1. Introduction
Smart cities have increasingly encouraged human-computer intersection with a range of cutting-edge technologies. These days smart media displays/façades provide a new means of communication and creative engagement in smart cities [
1,
2]. In Australia, the installation of interactive media displays in public places is a recent innovation. Such installations fuse smart technology, planning, and architecture to create shared experiences between members of the public as a living-lab [
3]. Recently, smart media display installations have begun to expand the potential of smart technology to encourage human–computer interactions (HCIs) in public places.
Previous research on HCIs in smart cities has adopted two distinct approaches. The demand-side approach has sought to consider the use of interaction designs for a living-lab in smart cities [
4,
5]. Conversely, the supply-side approach has sought to examine the application of smart technologies and technology development interactions in smart cities [
6,
7,
8]. Recent HCI research has led to more interactive systems being designed that are efficient and affordable and encourage public participation in smart cities [
9,
10]. In particular interfaces of the smart media display are being improved and integrated into blended environments. Such interfaces enable more intuitive interactions [
11] and could potentially influence patterns of social behaviour in smart cities [
2].
Jacucci et al. [
12] examined a range of smart interaction technologies for publicly exhibited artworks that use interactive technologies to encourage different participatory strategies. In one such artworks, lights appeared on three white canvasses in response to the external movements, sounds, pressure and electromagnetic stimuli provided by spectators. Other smart technologies have used mobile and global positioning system technologies as platforms to augment reality, transforming the role of visitors from that of passive receivers to engage in interactive and smart infrastructures [
13]. Another notable smart display installation featured an evolving line-art skyline that responded to users’ silhouettes while luminous creatures interacted playfully with the scaffold and users’ silhouettes [
14].
Despite the rapid evolution of smart media display technologies and the attendant multiplication of design possibilities in smart cities, an understanding of the interaction decision-making processes that individuals experience in response to interactive smart media displays remains limited. Specifically, very little is known about users’ socioeconomic profiles or, more importantly, the perceptions, motivations and intentions of those interacting with such new smart media displays in smart cities [
15]. To address these knowledge gaps, a survey was undertaken to examine the factors driving the increasing number of smart media displays using HCI. Given that a wide range of user and environmental variables could influence users’ interaction decisions, this study had two key objectives: (1) to determine which user characteristics encourage interactions with a smart media display, and (2) to determine which aspects of a display’s environment encourage these interactions. In this study, residents and visitors passing by a smart media display located at a commercial and retail podium of a newly developed smart precinct in central Sydney (Australia) were asked to complete a survey that had been designed to understand the unique intersection of smart technology, psychology and HCI in a public space.
3. Conceptual Framework: Modelling Interaction Decision with a Smart Media Display
This study adopted a conceptual framework for understanding individuals’ interaction decisions in relation to behavioural intention. The theory of reasoned action states that behavioural intentions are the immediate antecedents to actual behaviour [
30]. Suchman [
31] developed the situated action theory of human behaviour that holds that planned behaviour and reasoned action are interleaved. Their theory undermines the notion that human action is entirely under the control of cognition. Payne et al. [
32] challenged Suchman’s approach, contending that the relationship between planned behaviour and reasoned action is discretionary and that a planner’s intention should be viewed as a decision maker.
Payne et al. [
32] further argued that the phenomena of an interactive search are the result of an individual adapting to the characteristics of an environment and human cognition (e.g., personal experiences and perceptions). As Payne et al. [
32] stated (p.341): ‘The phenomena are reliable not because they are themselves invariant features of human behaviour or cognition, but because they derive from decision-making strategies applied to consistently structured task environments’. The cognitions between users and computers are distributed by the users themselves. As is the cognition distribution between planning and in place responsiveness. When interacting, users consider the probability (P) of revitalising a memory to achieve a current objective, their gain (G), and the cost (C) of this cognitive process [
33]. The cognition includes users’ previous experiences and knowledge, and their cognitions about in situ factors (i.e., their motivations to visit a place and their awareness of their safety in a place).
Respondents’ perceptions of the built environment were considered in relation to each of the following five constructs: their recognition of safety risks such as robbery, catcalling and vandalism; their response to the socialising/communication with smart technology; their appreciation of the aesthetics of the place, their motivation to visit the place; and their behaviours as consumers. The five social constructs are developed based on the interaction design guideline for urban media facades, which emphasizes the needs of visible interactive zones of media facades [
20,
34].
Table 1 outlines the five social constructs of the interactive built environment considered by this study.
The present study first examined the five aspects of a media display’s interactive environment (i.e., socialising, safety recognition, aesthetic appreciation of public space, motivation to visit and consumer behaviour). Specifically, this study examined how the five aspects of a media display’s interactive built environment affected individuals’ perceptions and interaction decisions (see
Table 1). The concept of the interactive built environment, as derived from psychometric sources, reflects individuals’ particular outlooks and social perceptions of a new smart display installation [
35,
43]. For example, safe and secure space may increase the likelihood that users will engage with the media display [
16]. Trees and walls are typical objects that evoke a protective feeling among people and create ‘comfort spaces’ in which people can observe interactive activities in a surrounding area [
26]. A user’s recognition of an interactive environment occurs within the context of a user’s cognitions of the built environment whereby information, upon reception, is coded, stored and organised in the brain. A user does not merely respond reflexively to a smart media display. Thus, it was anticipated that individuals’ recognition of the built environment surrounding a smart media display would first affect their individual perceptions of the digital display placement and then their interaction decisions.
In relation to the ‘socialising’ aspects of the interactive built environment of digital displays, respondents were asked two questions: (1) Does the interactive technology make you feel like socialising; and (2) How important is socialising in your everyday life? To assess their interaction decisions (i.e., the dependent variable), the respondents were also asked about the four other aspects of the media display’s built environment. Specifically, the respondents were asked ‘Are you interested in interacting with the smart media display?’
Users’ perceptions of a media display are also important in shaping the manner in which users interact with the new smart display. Design illumination, interaction methods [
28], the quality of the media content [
34] and the frequency of displays and other visual objects in proximity to a particular media display may produce different interaction decisions [
44]. Users’ interaction decisions will not only be affected by their cognitions about a media display’s built environment, but also by their individual socioeconomic and demographic characteristics [
45]. Users’ opinions of and level of familiarity with smart technology is also an important factor affecting users’ interaction decisions. Different user archetypes (e.g., contributors versus passive users or non-users) will display different reactions towards the same interactive display content, and different user needs. Thus, designers should consider their target users when designing the physical appearance of a display, its content and the interaction mechanism [
46]. For example, individuals’ acceptance levels in relation to the content displayed on the media screen in Flagey Square, Brussels (Belgium) varied depending upon their cultural background. To increase the effectiveness of a media façade, content providers need to be sensitive to the sociocultural environment and the receivers [
47]. Media surfaces with excellent usability and semantics could potentially encourage the integration of different cultures and multi-ethnic peoples [
48].
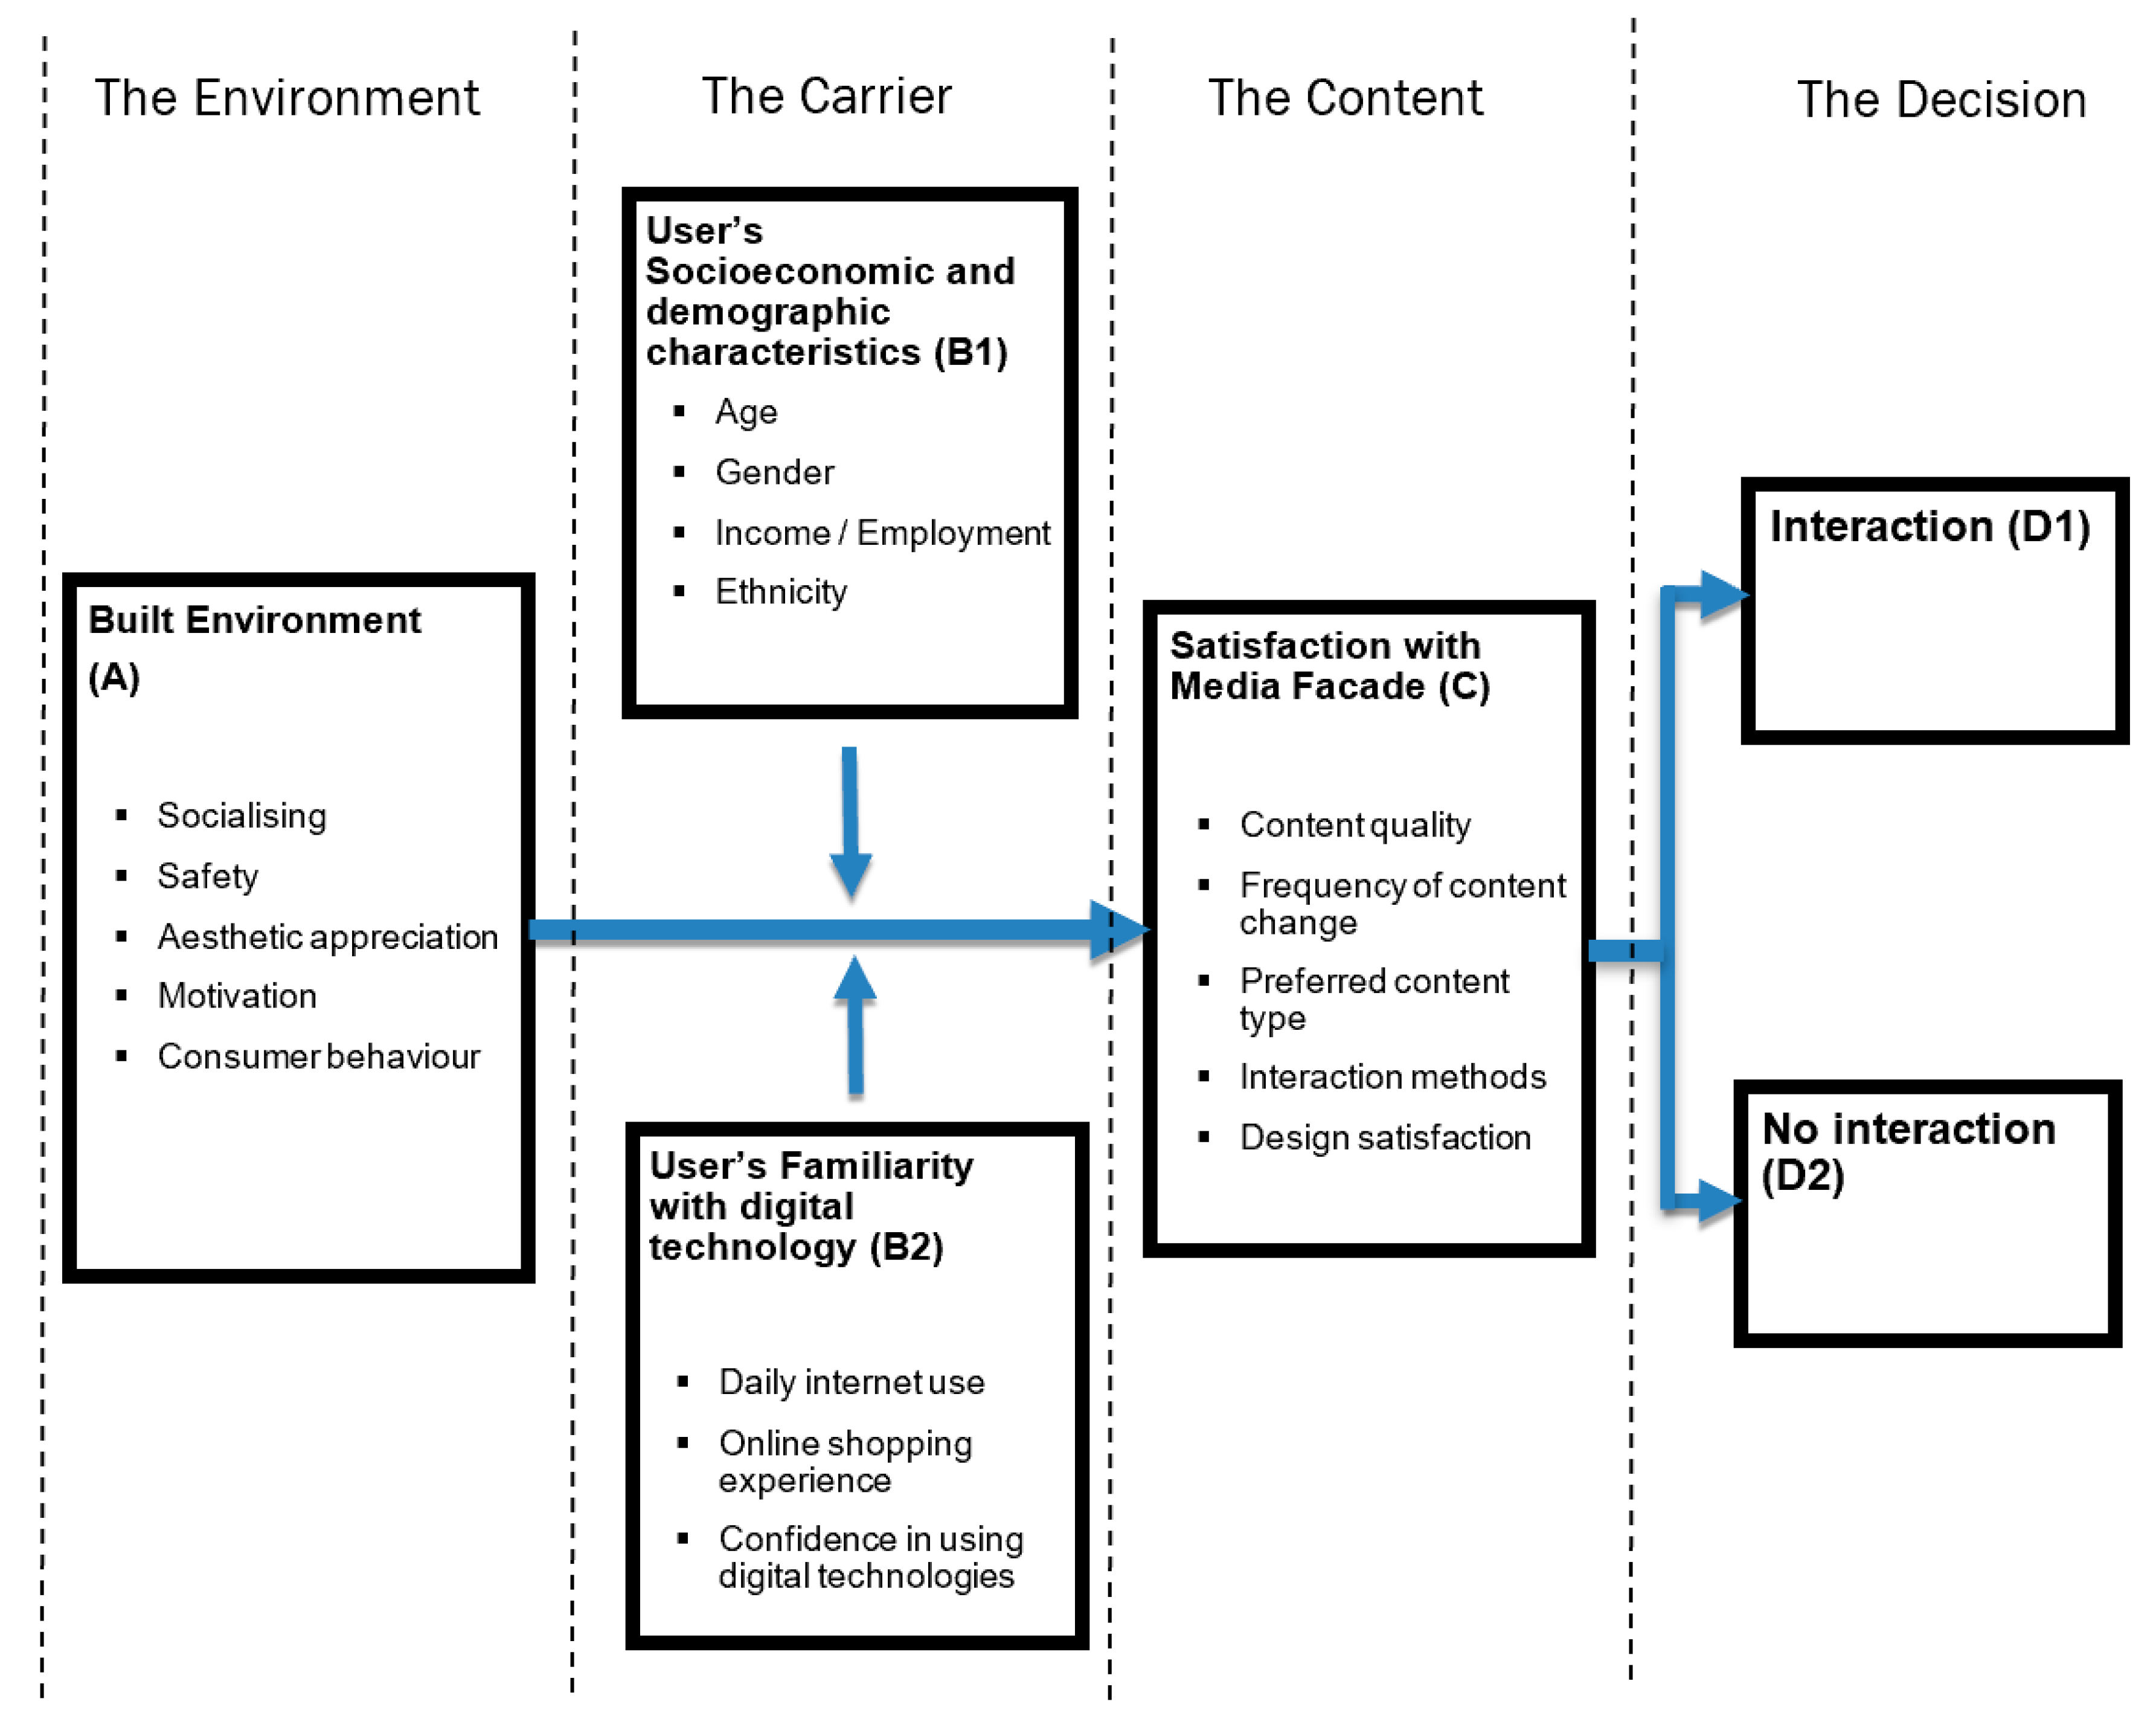
Vande Moere and Wouters [
47] considered four case studies and ultimately identified three aspects of the contextual integration of a media façade: (1) ‘the environment’ (i.e., the space where the media architecture is installed); (2) the ‘content’ (i.e., what the display actually delivers to the audience); and (3) ‘the carrier’ (i.e., who is operating the ‘content’ or the public image of the carrier). In the present study, a conceptual framework was developed that focused on the three factors affecting individuals’ interaction decisions in relation to the media façade: (1) the ‘environment’; (2) the ‘carrier’; and (3) the ‘content’. Tangible and intangible variables were considered in relation to each aspect of (A) the built environment where the display is installed (i.e., the environment); (B1) users’ socioeconomic characteristics and (B2) familiarity with smart technology (i.e., the carriers); and (C) Satisfaction with the media display (i.e., the content) (see
Figure 1).
Under this framework, a stimulus involving the interactive built environment (i.e., the Environment in
Figure 1) may prompt users to interact with a media display. For instance, a friendly environment for meeting a friend (socialising) and safer place for women and children would encourage their interaction with a media display. Various inputs may inform a user’s cognitive process; for example, a user may perceive the potential effects of interaction, or a lack thereof, may be registered [
49]. The decision to interact with a media display is a cognitive process that involves input in the form of a user’s prior knowledge, social values and experience, including a user’s level of familiarity with digital technology (i.e. how many hours per day do you usually use the Internet?; how would you rate your computer technology skills?). Interactions vary according to individual’s socioeconomic and demographic characteristics, such as their age, gender, ethnicity and levels of skill and experience with digital technologies [
11] (see Box B2 in
Figure 1). Most importantly, the quality design, media contents and technologies of the smart display affect user’s interaction decision (see Box C: ‘interaction’ [D1] and ‘no interaction’ [D2]).). In this conceptual framework, we assumed that site visitors first make judgments about the current built environment around the media display based on their own experience and socioeconomic and demographic characteristics, and then to derive a certain level of satisfaction to the design and contents of media display. Subsequently, their levels of satisfaction with the media display lead interaction decisions.
4. Survey Design and Methods
4.1. Case Study: One Central Park, Sydney
A case study was conducted at the Central Park precinct, a 5.8-hectare, 2-billion-dollar urban redevelopment at Broadway, near the southern edge of the central business district in Chippendale, (Sydney, Australia). The mixed-use project is a joint venture between Frasers Property and Sekisui House to redevelop the old Carlton and United Brewery that closed in 2005 [
50]. The project includes residential apartments, offices, shops and cafés. The project has won numerous awards across a range of categories, including sustainability, landscape architecture, design and innovation awards.
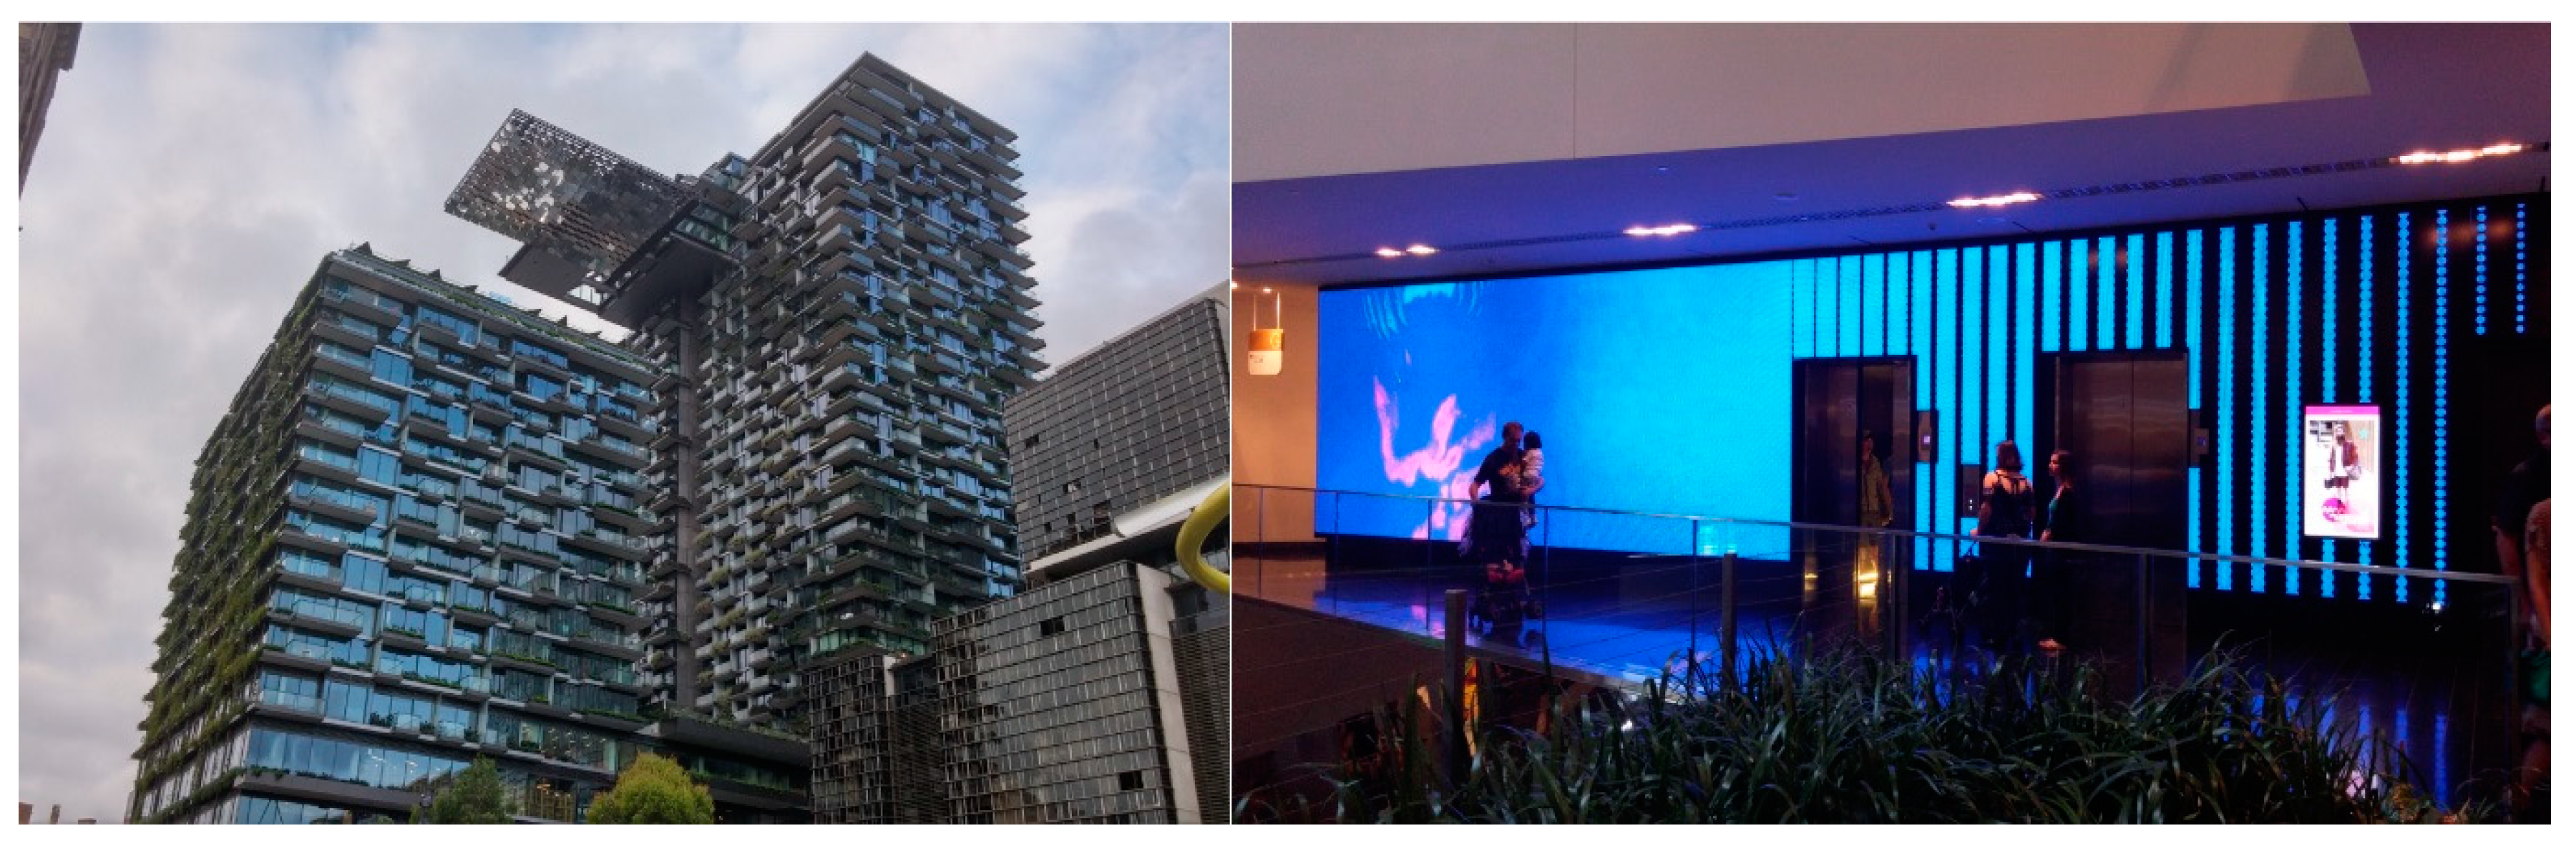
A 15-metre long interactive LED screen (i.e., ‘a digital wall’) is installed inside the retail portion of the precinct. The digital wall is located adjacent to the elevators on the ground floor. It was produced by Big Screen Projects and comprises 154 customised panels that together contain over 2 million 7 mm LED modules (
Figure 2). A kiosk, microphones and cameras enable individuals to interact with the digital wall. Ramus Illumination, who acted as the creative directors of the media display, has stated that it is the largest indoor media display of its kind in a retail precinct in the world [
51]. Visentin [
52] noted that a media display was included at the One Central Park retail precinct to distinguish it from other modern ‘sterile and soulless shopping malls’. The scale of the digital wall gives it great commercial potential; however, the project appears to be consciously trying to avoid becoming an ‘advertising billboard or an incessantly-looping foyer artwork’ [
53] and instead offers an ever-changing range of interactive activities to shoppers. In addition to showcasing local community art and playing a library of videos, the smart digital display provides shoppers with opportunities to play games at the kiosk and engage with social media. For example, during University Orientation Week, a custom Instagram application developed by Ramus Illumination allowed students to hashtag their photos and display them on the digital wall [
53]. The content of the wall can be changed by simply walking through space. Cameras and microphones around the smart digital display are mapped to the area in front of the screen. They sense people’s movements and then cast those people’s shadows onto the screen [
53]. Ramus [
51] described this as ‘reflective content: it reflects the environment where the installation sits’.
4.2. Survey Design
The data presented in this paper was compiled after a random sample survey was administered to the respondents. Questionnaire survey (paper copy) were conducted with individuals who had seen the newly installed media display between 15 and 20 May 2015. Permission to conduct the on-site survey was granted by the Central Park One manager and research human ethics approval was obtained from the Human Research Ethics Committee (grant no. 155040). A supervisor and two trained staff administered the survey on site during the shopping centre’s trading hours. They were dressed in a uniform and carried appropriate identification at all times.
It was thought that completing the survey on site might assist the respondent shoppers to understand more about the new smart technology and increase their interest in the Central Park site. The respondents were asked if they had previously seen or recognised the smart media display. Only those who responded ‘yes’ to this question were invited to continue to participate in the survey. The survey considered respondents’ intention to interact with the media display, asking whether they like to interact or not. Regardless of their actual interaction with the media display, their interaction intention can be viewed as reasoned actions and planned behavior [
32]. The conceptual model developed in this study focuses on the mediating role of the interactive built environment, design satisfaction and interaction intentions, which appear more circumscribed by behavioural theories rather than simply predicting if they will interact with the media display. In total, 200 written surveys were collected from members of the public visiting or residing in the One Central Park retail precinct. Over 330 people were asked to participate in the survey. Thus, the response rate was approximately 60%. The survey comprised a total of 26 questions. These questions were divided into three major categories: (1) interactive built environment; (2) perceptions of the media display; and (3) socioeconomics and demographics. The survey was designed to ascertain various human interactions with and perceptions of the media display. A media display was installed at One Central Park to increase visitation and support public engagement (e.g. socialising). It is important to ensure that the public is satisfied with the design of any new smart display and that they choose to interact with the screen. Consideration must also be given to how a high level of interaction with a smart media display can be sustained, especially in relation to permanent installations.
The survey questionnaire integrated the key influences of trust in a smart media interface, including the quality of the media content [
54], the frequency of the displays [
55], the methods of interaction [
10] and users’ satisfaction with the display design [
56]. Users’ perceptions of a media display can range from positive to negative and may include satisfaction or dissatisfaction with the content quality (five-point Likert scale), a desire for more or less frequent content change and a preference for one type of content over another. The following questions were used to measure respondents’ perceptions of the media display:
How would you rate the quality of the content shown on the media display?
How frequently would you like to the media content/information to change?
If you could add content using your smartphone, what would you like to display on the media display?
How frequently would you like to the media content/information to change?
My satisfaction with the design of media display is [….].
4.3. Logistic Regression Model
To examine all the potential aspects of the interaction decisions (the subject of this study), a logistic regression model was used to predict the likelihood of a respondent interacting with the smart media display. In relation to the logistic regression model, six missing cases had to be deleted; thus, a total of 194 respondents were included in the analysis. The dichotomous dependent variable selected was an individual’s interaction decision (i.e., to interact [n = 163] or to not interact [n = 31] with the smart media display. In relation to the media display’s built environment, the variables chosen were socialising, safety, aesthetic appreciation, motivation to visit and consumer behaviours. To measure these variables, respondents were asked to use a five-point Likert scale (very high, high, neither high or low, low, very low satisfaction) to indicate their levels of satisfaction with the media display’s environment. The ‘content’ variables pertaining to the media display itself included respondents’ perceptions of the quality of the media display’s content, their preferred frequency of content change, their content preference, their interaction method preference and their overall levels of satisfaction with the display design. At a personal level (i.e., the carrier level), a range of variables relating to respondents’ levels of familiarity with smart technology (e.g., daily hours of internet usage, online shopping and confidence in technology use) and their socioeconomic and demographic characteristics (e.g., their age, gender, country of birth, residency, employment status) were selected.
The logistic regression model estimated the relative weight of each variable by the exponential of the beta coefficients (Exp β). Each coefficient shows an odds ratio as an indicator of the change in odds resulting from a unit change in an individual’s interaction decision. For example, if an Exp β value is greater than 1, the likelihood of an individual interacting with a smart media display will increase, in accordance with the corresponding variable’s contribution to the interaction decision. Conversely, if an Exp β value is less than 1, the likelihood of an individual interacting with a smart media display will decrease as the predictor increases. Thus, the Exp β values are interpreted as odds ratios that represent the likelihood of an individual intention of interacting with a smart media display given a particular outcome (where decisions to interact represent the independent variables in this study). The model employed a forced entry method whereby the coefficients for all selected independent variables were estimated in line with the decision-making process. The coefficients were then forced into the model simultaneously to report all coefficient estimates with a significance level for each predictor.
5. Findings
5.1. Descriptive Analysis
Table 2 outlines the socio-demographic profiles of the respondents. Of the respondents, 17.5% were residents and 82.5% were non-residents. Of those non-residents, 1.8% were first-time visitors, 23.9% were second-time visitors and 74.3% had visited the retail precinct multiple times over the past 12 months. The respondents were very culturally diverse. In relation to the country of the birth question, over 30 different countries were identified as respondents’ places of birth. Of the respondents, 29.5% were born in Australia, 20.5% were born in South-East Asia, 12.5% were born in Europe and 12% were born in China. The majority of the respondents (i.e., 84.5%) were aged 18 to 30 years old and 53% were female. The following three variables were used to measure the familiarity with smart technology: (1) internet usage per day (measured in hours); (2) frequency of online shopping; and (3) level of confidence in using smart technology. Over 32% of respondents stated that they used the internet for 6 hours or more per day. Only 1.5% of respondents stated they used the internet for less than one hour per day. A large proportion of respondents indicated that they had purchased goods and services online (i.e., 94%). Further, 59% of respondents indicated that they had purchased goods or services online at least once in the last month.
5.2. Characteristics of the Interactive Built Environment
To examine the effects of the smart media display on respondents’ interaction decisions, respondents were asked about their cognitive image in relation to five aspects of the media display’s environment: (1) the smart screen’s effect upon respondents’ enjoyment of nearby social activities (i.e., socialising); (2) the smart screen’s effect upon local safety and security; (3) the smart screen’s contribution to respondents’ aesthetic appreciation of the precinct; (4) the extent to which the smart screen motivated shoppers to visit the precinct; and 5) the extent to which the smart screen encouraged their consumption.
Of the respondents, 52% felt that the smart media display neither enhanced nor detracted from their social activities at One Central Park, 26% indicated that they would enjoy their social activities a little less if the media display did not exist and 6% said they would enjoy their social activities a lot less if the media display did not exist. Only 16% of respondents indicated that they would enjoy their social activities more if the media display did not exist. Thus, for almost a third of the respondents, the smart media display positively contributed to their enjoyment of social activities at One Central Park.
Of the respondents, 65% indicated that the level of safety and security they experienced would be the same if the media display did not exist. However, almost a quarter of the respondents viewed the smart media display could promote a feeling of safety. 18.5% of respondents were of the view that safety and security would be a little worse if the media display did not exist and 4.5% were of the view that it would be much worse.
A response of ‘the same’ attracted the highest number of responses from respondents in relation to four of the five questions about the media display’s built environment (i.e., socialising, local safety and security, motivation to visit and ease of spending money). Thus, it appears that a majority of the respondents felt that the presence of the media display did not affect these aspects of their visit. However, when asked about aesthetics and appearance, 68.5% of respondents stated that the aesthetic of the place would be a little worse or much worse if the media display did not exist. This highlights the importance of the media displaying improving respondents’ aesthetic and visual experience of the Central Park retail precinct.
Of the respondents, 69.5% were of the view that their motivation to visit One Central Park would be the same if the media display did not exist and 23% indicated that their motivation to visit would be a little less or much less if the media display did not exist. However, the results showed that for almost a quarter of the respondents to One Central Park, the media display informed their motivation to visit the retail precinct. The existence of the media display had the least effect on respondents’ spending habits. Of the respondents, 75% were of the view that their spending at the Central park retail precinct would be the same whether or not the media display existed.
Respondents’ satisfaction levels with the design of the media display were very high. Indeed, 62.5% of respondents classed their levels of satisfaction as a very high or high. A third of respondents felt neutral about the media display and 4.5% of respondents surveyed felt low or very low levels of satisfaction. Respondents had high regard for the content shown on the media display. Specifically, 23% of respondents were of the view that mostly good content was available and 63% thought that some good content was available. Most of the respondents were of the view that the content should be changed frequently. Of the respondents, 60.5% stated they would like to see the content on the media display change every week while 19.5% stated they would like to see the content change every day. As the retail precinct has been designed to cater mostly to local residents, including those who live on site, this high demand for content change may reflect the frequency with which residents use this area of the building.
5.3. Modelling Interaction Decisions: A Logistic Regression Analysis
Guided by the conceptual framework, a binomial logistic regression analysis was undertaken.
Table 3 sets out the results of the analysis that used the pre-defined variables in the research framework (see
Figure 1).
The results of the three logistic regression models indicated odd ratios for all the independent variables affecting individuals’ interaction decisions in relation to the built environment (i.e., the environment), individuals’ perceptions of the media display (i.e., the content) and individuals’ personal characteristics (i.e., the carrier). Model 1 (A + C) included the independent variables of the built environment (A) and the contents/design of media display (C) only (refer to
Figure 1). Several intangible factors were closely associated with individuals’ interaction decisions. Specifically, aesthetic appreciation, the quality of the content, interaction methods and levels of satisfaction with the media display’s design significantly affected respondents’ interaction decisions. Within the built environment group of variables (Model 1), the perception of aesthetic appearance was the most significant factor in determining interaction decisions. Respondents who were not of the view that the media display enhanced the aesthetic appearance of the public place were less likely to interact with the media display (Exp β = 0.378).
Design satisfaction with the media display was also a main driver of respondents’’ interaction decisions. Respondents who were satisfied with the media display’s design were 10 times (Exp B = 10.816) more likely to interact with the media display than those were unsatisfied. Respondents who chose personal or text messaging as their preferred method of interaction were less likely to interact with the media display (Exp β = 0.269) than others. This may be attributable to these respondents’ perception that the media display had only simplistic uses and they are being mainly interested in verbal communication.
In Model 2 (see
Figure 1(B1 + B2)), several socio-demographic and technology familiarity variables were associated with the respondents who interacted with the media display. The variable of the ethnic background was significantly associated with interactions. Compared to Australian born respondents (the reference category), respondents who were born overseas were 2.7 times (Exp β = 0.269) more likely to interact with the media display. However, other socio-demographic characteristics (e.g., age, gender, residency and employment status) did not significantly affect the likelihood that respondents would interact with the media display. Most significantly, the likelihood of interaction was lower for part-time and casual workers (Exp β = 0.164) than for those with other employment statuses.
The overall model predictability of the composite model, which considered the variables of environment, personal characteristics and perceptions (Model 3, see
Figure 1(A+B1+B2+C)), showed a significant improvement. The log likelihood revealed the extent to which observations remained unexplained after each model had been applied; a larger value of the log likelihood ratio indicated higher unexplained interaction decisions. The result of the –2 LL ratio in the composite model (Model 3) was 82.475, much lower than that of the other models (Model 1 and 2), indicating an improvement in the model’s predictivity when the other two models were combined in the interaction decision process. This showed that individuals’ socioeconomic and demographic characteristics and their familiarity with smart technology were also important predictors in their interaction decisions.
Respondents who believed that the precinct’s aesthetic appearance would be significantly worse without the media display were also significantly more likely to interact with it (Exp β = 0.259). The quality of content available on the media display was another important contributor to the likelihood of interaction (Exp β = 9.725). Respondents who were born overseas, especially those born in South-East Asia, were 7.8 times more likely to interact with the smart media display than those born in Australia. Surprisingly, age and residency did not significantly affect respondents’ decisions to interact with the display.
Decisions to display personal photographs/images or work-related advertisements as a preferred interaction method proved to be a significant predictor of respondents’ decisions to interact with the media display. The interaction method that included digital photographs increased the likelihood of interactions; however, the respondents who chose to display an advertisement were less likely to interact with the media display. Notably, all the independent variables relating to familiarity with technology (e.g., daily hours of internet usage, levels of confidence with digital technology and online shopping experience) did not increase the likelihood that the respondents would interact with the media display. The results suggest that content quality, levels of satisfaction with the display design of the media display, its aesthetic appearance, respondents’ preferred interaction methods and their ethnic backgrounds, were the key independent variables that differentiated between the respondents who interacted with the media display and those who did not (at p < 0.05).
6. Discussion and Conclusions
The complexities of public display designs and HCI interfaces appear to be hindering the development of smart media display or façades in smart cities; however, opportunities still exist for better understanding individuals’ perceptions of media display and the variables that influence individuals’ interaction decisions. Documentation of such encounters have raised an important question: Would new smart media display be more successful and socially accepted if they presented more interactive opportunities in smart cities?
Decisions to interact with media display necessitate a new standard for smart media display design and media content development in smart cities. Specifically, consideration must be given to the built environment (i.e., the environment) and the socio-demographic characteristics of individuals (i.e., the carriers). It should not be assumed that new smart technologies will resolve or address discontinuities of HCIs in smart cities. Indoor media displays adjacent to main building entries and gathering points can effectively leverage HCI based on their proximity to retail shops; however, the smart media display may not be able to remove the influence of the perceptions created by the surrounding built environment (i.e., perceptions about safety and the aesthetics of a place) in the precinct.
The perceived built environment (i.e., individuals’ perceptions of safety and aesthetic quality) can influence individuals’ interaction decisions in smart cities. Thus, the socioeconomic and demographic characteristics of engagers should influence both the cognitive and affective images displayed in any smart media display (i.e., the content). Individuals’ personal familiarity with smart technology was not found to significantly affect their interaction decisions. Further, individuals were more likely to interact with the smart media display if a variety of interaction methods were offered (e.g., the possibility of using digital images or digital twins rather than simple text messages).
Socio-demographic factors still play a mediating role in encouraging or discouraging human interactions with smart media displays. Gender, age and residency are commonly believed to play an important role in determining interaction decisions, but the related independent variables considered by this study’s models proved non-significant. It may be attributed to such structural variables (gender, age and residency) largely play in an independent manner to predict interaction behaviours while relationships between satisfaction and interaction are closely related. The relative significance of specific ethnicities was not explored in this study; however, in the descriptive analysis respondents with South-East Asian backgrounds would interact with the new smart media display considered in the present study. As the majority of South-East Asian (90.2%) is a visitor to the site the underlying cause might be that they are a tourist who are more likely to interact with the smart technologies.
An individual’s digital familiarity was considered in relation to particular individual attributes; however, it could arguably be better established by considering an individual’s social network interactions on Facebook, Twitter, LinkedIn, etc. Given that digitally familiar people now spend a large amount of time interacting with digital screens, the issue of saturation arises, as such individuals may lack the desire to interact with other devices. Thus, the extent of individuals’ screen exhaustion may negate other effects relating to different levels of technological experience. This issue should be the subject of an extended behavioral study in smart cities.
This study is one of the first studies empirically identified the key aspects of a smart display “media façade” in relations to the enhancement of intuitive interactions with a new generation of public display. This study, therefore, has important implications for planners, architects, engineers and policymakers seeking to deploy creative media façade and innovative HCI methods in smart cities. We argued that individuals’ perceptions of the built environment (i.e., safety) and their personal characteristics significantly mediate the relationship between the perceived image of a media display and individuals’ interaction decisions. However, the implication of this intention for actual interaction may differ if the respondents have interacted in different time, date and weather. Further studies therefore need to be gained of actual interaction behaviors with newly implemented smart technologies and media contents and investigate their social interaction patterns if smart media displays are to become more effective at achieving their intended objectives. A semi-structured interview with end-users helps understand which the attributes of ‘environment’, ‘carrier’ and ‘content’ affect the extent to which intentions are translated into actual interaction.
This paper found addressing the needs of users with particular socio-demographic characteristics and attracting visitors to a smart building represent particular challenges. Interestingly, cultural differences (defined in this study as country of birth) had a varying effect on individuals’ interaction decision, indicating that more cultural content should be featured in the displays. Many existing media display programs do not consider cultural differences in interaction decisions. However, the inclusion of multicultural content and international language services provided by smart technology (real-time translation), not least for Chinese, Indonesian and French visitors to One Central Park, could significantly enhance interaction decisions, especially for visitors or tourists. The findings suggest that a one-size-fits-all approach to content should not be adopted when decisions are being made to install or vary the multicultural content of a media display. Clearly, smart media display installations can be successful in culturally mixed communities and may also be successful at international tourist destinations in Sydney.
Media displays are typically developed for specific temporal and spatial contexts. Thus, many opportunities and challenges arise in exploring when they should be implemented. Issues of spatial organisation and built environment will be unique to each individual smart display project; however, guidelines or principles could be developed to ensure that a better approach to the design and content development of specific media façades is adopted (Dalsgaard and Halskov [
20]). Higher levels of satisfaction with the design of a smart media display may also motivate individuals to (re)visit a place while the quality of the display content could also encourage viewers to remain in a space, and thus affect their interaction decisions.
The findings of this paper further suggest that a need for smart technologies for safe and secure place and an appreciation of the aesthetics of a smart media display affects people’s decisions to interact with a smart installation. Thus, the creation of a safe built environment in the display zone and an aesthetically appealing display should be a design priority rather than providing socialising place. Sustaining user interest through the provision of high-quality content and interaction opportunity, especially if a media screen is intended to be displayed more permanently, is likely to present an ongoing challenge for a smart city planning.


