Article

Continuous Battery Health Diagnosis by On-Line Internal Resistance Measuring

by
Jaime de la Peña Llerandi
*,
Carlos Sancho de Mingo
and
José Carpio Ibáñez
Dpto. Ingeniería Eléctrica, Electrónica, Control, Telemática y Química Aplicada a la Ingeniería, Universidad Nacional de Educación a Distancia (UNED), E.T.S. de Ingenieros Industriales, cl/Juan del Rosal, 12, 28040 Madrid, Spain
*
Author to whom correspondence should be addressed.
Energies 2019, 12(14), 2836; https://doi.org/10.3390/en12142836
Submission received: 28 June 2019 / Revised: 13 July 2019 / Accepted: 19 July 2019 / Published: 23 July 2019

Abstract

:
Energy storage in an uninterruptible power supply (UPS) is one of the most frequent applications of batteries. This can be found in hospitals, communication centers, public centers, ships, trains, etc. Most frequent industrial methods for battery state-of health estimation require a technician to move to the battery’s location and, in some cases, require the use of heavy equipment and disconnection of the battery from the UPS. For example, in railway applications, trains must stop at the maintenance depot producing significant total costs. This article proposes a new method to assess a battery’s health by measuring the battery’s internal resistance, based on the measurement of its voltage ripple in response to the current ripple imposed by the charger which in most UPS applications is permanently connected to the battery. Unlike most traditional methods, this system makes it possible a continuous on-line and on-board monitoring, and, therefore, it eases condition-based maintenance (CBM). To verify its viability, a low cost measuring prototype has been built and measurements in a railway battery with its charger have been carried out.

1. Introduction

Power plants, substations, communication centers and all fundamental services in general have uninterruptible power supply (UPS) systems to keep critical equipment operational in the event of a failure in the alternating current (AC) input power supply [1,2]. In the case of both marine and rail transport, UPS systems must also maintain the minimum comfort conditions in case of loss of the main power source.
The first UPS systems were based on generators powered by combustion engines. It was in the decade of the 1960s when the first UPS based on thyristors appeared. For example, in 1967 Toshiba built a 200 kVA UPS with lead-acid batteries for the air traffic control system of Tokyo International Airport [3].
In the 1970s, with the evolution of power semiconductors, the use of batteries in power plants became commonplace. It was a decade of a large number of scientific studies, publications and patents in the fields of measurement, diagnosis and modeling of batteries. For instance, [4] in May 1975, researchers from Bell Telephone Laboratories developed the idea of an international conference on telephone power energy systems, and three years later launched the International Telecommunications Energy Conference (INTELEC), which throughout its history has published a large number of technical articles about batteries.
In a UPS based on power semiconductors, batteries are the most critical components because they have to provide their stored energy promptly when required by the system, even when the battery has spent long periods of time floating without activity. Therefore, it is crucial to know aspects such as the process of battery degradation, how much energy they actually store, how much energy they will be able to provide, and how much time they have left before a failure in order to carry out an optimized preventive maintenance. These characteristics are summarized by the state of charge (SOC) and the state of health (SOH) of the battery [5,6,7,8,9,10].
State-prediction techniques (prognostics and health management, PHM) have evolved in line with the knowledge of the internal operation of batteries, their chemical reactions and the process of degradation of their components. The existing methods to determine the state of health and the charge of a battery can be divided into direct methods and computational methods.
Direct methods are based on tests, which usually require the intervention of a technician; that by direct measurements of a physical parameter of the battery can give directly or can estimate the battery state of charge SOC and state of health SOH. Some of these methods are:
a.
Discharge test [5,6,7].
b.
Acid density measurements [8,11].
c.
Battery open circuit voltage [6,7,10].
d.
Battery float charging current [6,7,12,13].
e.
Internal resistance measurement [5,6,7,10,11,14,15,16,17,18].
f.
Electrochemical Impedance Spectroscopy (EIS) [14,19].
g.
Hybrid pulse power characterization (HPPC) [20,21].
Computational methods are those that, by measuring battery parameters stored in historical records or by adaptive calculation algorithms, can estimate the state of charge and battery status (SOC and SOH) [22,23,24,25,26,27,28,29,30,31,32,33]. Some of these methods are:
h.
Coulomb counting [22,23,24].
i.
Modified coulomb counting [23].
j.
Adaptive systems and neural networks [23,24].
  • EBP, Error back propagation neural network [23,25,26].
  • RBF, Radial basis function network [27].
  • SVM, Support vector machine [28,29].
  • FNN, Fuzzy neural network [30,31].
  • Kalman filter [32,33].
  • Hybrid methods [22,23].
Battery maintenance in the industry is programmed according to battery manufacturers’ recommendations and international standards [6,7,8,9,10]. Generally, monthly, quarterly and yearly consistencies are used, which include tests (b), (c) and (d) above. Test (a) is only used to confirm the status of a dubious battery, since it takes a long time and needs specific equipment. Methods (f) and (g) require introducing disturbances in the battery which are only possible using power electronics. Methods (h), (i) and (j) cannot be used in UPS batteries because the battery is floating and they require measurements of the discharge and charge currents as inputs.
The measurement of the battery internal resistance (e) (widespread in industry), is recommended by several battery manufacturers for maintenance as a method to estimate battery SOH and, in fact, several commercial equipment sets are available [8,34,35]. Dr. Damlumd [11] studied the influence of different physical/chemical phenomena on the value of internal resistance, impedance and battery capacity. He concluded that internal resistance increases with the degradation of the battery, except in the case of internal short circuits or a temperature increase.
It is now generally accepted that the value of the battery internal resistance depends on the battery conditions, namely, its SOC, its temperature (resistance decreases as the battery temperature increases [16,17,18]), etc. and indicates the battery SOH [5,11,15]. In fact the use of the internal resistance, as an alternated inspection method, is proposed by the IEEE standard 450_2010 [7] for vented lead-acid (VLA) batteries and is also recommended by the IEEE standard 1188_2005 [10] for valve-regulate lead-acid (VRLA) batteries, specifying a quarterly measure and record of the internal resistance. These standard enphasizes that the internal ohmic values are useful as a trend characterization tool. To use these readings effectively, accurate baseline readings should be taken after about six months of battery operation. Notice that all methods (a–e) require a technician to move to the battery’s location; whilst (e) also requires the use of heavy equipment and disconnection of the UPS battery. In the case of railways, trains must be stopped at the maintenance depot bringing very important cost and, very often, preventing an appropriate maintenance program.
In this paper, a new non-invasive method is proposed to measure battery’s internal resistance continuously during its normal operation connected to a UPS, reducing human and operation costs which, eventually, should facilitate monitoring and maintenance programs. The proposed method is based on the fact that, in a UPS, the battery is usually connected permanently to the UPS charger [19], which imposes the current ripple of its output filter inductor on the battery (usually 10% of its average direct current (DC) output current value). By measuring this current ripple and the voltage ripple of the battery cells, the value of the internal resistance can be obtained and, therefore, the SOH can be determined. Although voltage and current ripples are very small and are surrounded by a very noisy environment, the main voltage and current harmonics of the rectification can be extracted using the Fourier Transform to calculate the battery’s internal resistance.
On-line battery monitoring systems have already been proposed in the literature [19,36,37]. However, unlike in the proposed system, in all the cases spotted the authors had to introduce disturbances in the normal operation of the battery. For example, [37], based on (g) (HPPC), perturbing the battery with power pulses while [19,36], based on (f) (EIS), uses an electronic power converter to introduce disturbances with different frequencies.
To verify the feasibility of the proposed method, measurements have been carried out in the battery-charger unit of a metropolitan train of “Metro de Madrid”. It will be shown that reliable results can be obtained, without perturbing the normal operation of the battery + charger system, using a low cost set-up based on a simple micro-controller. Since most modern micro-controllers can be easily interfaced with wireless communication systems, the proposed solution could transmit its information to a central maintenance system to make a continuous maintenance program possible. This feature is a clear advantage with respect to all “direct methods” listed above. “Computational methods” above are seldom used in practice in UPS batteries because they are not subject to charge–discharge cycles.

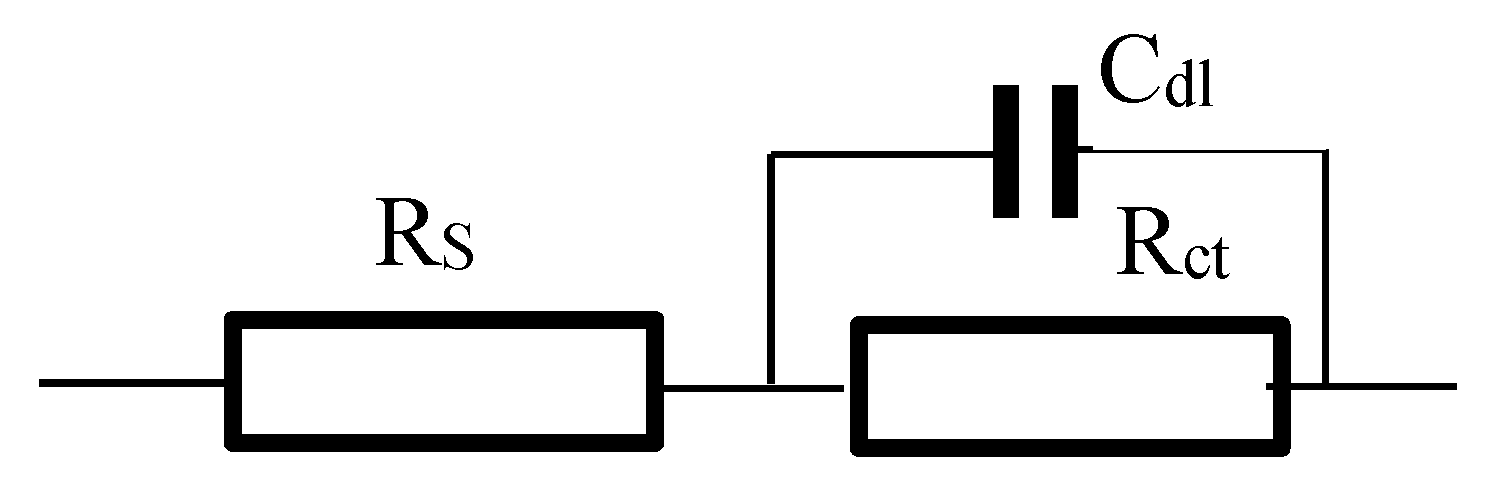
2. Description of the Method Proposed and Its Application
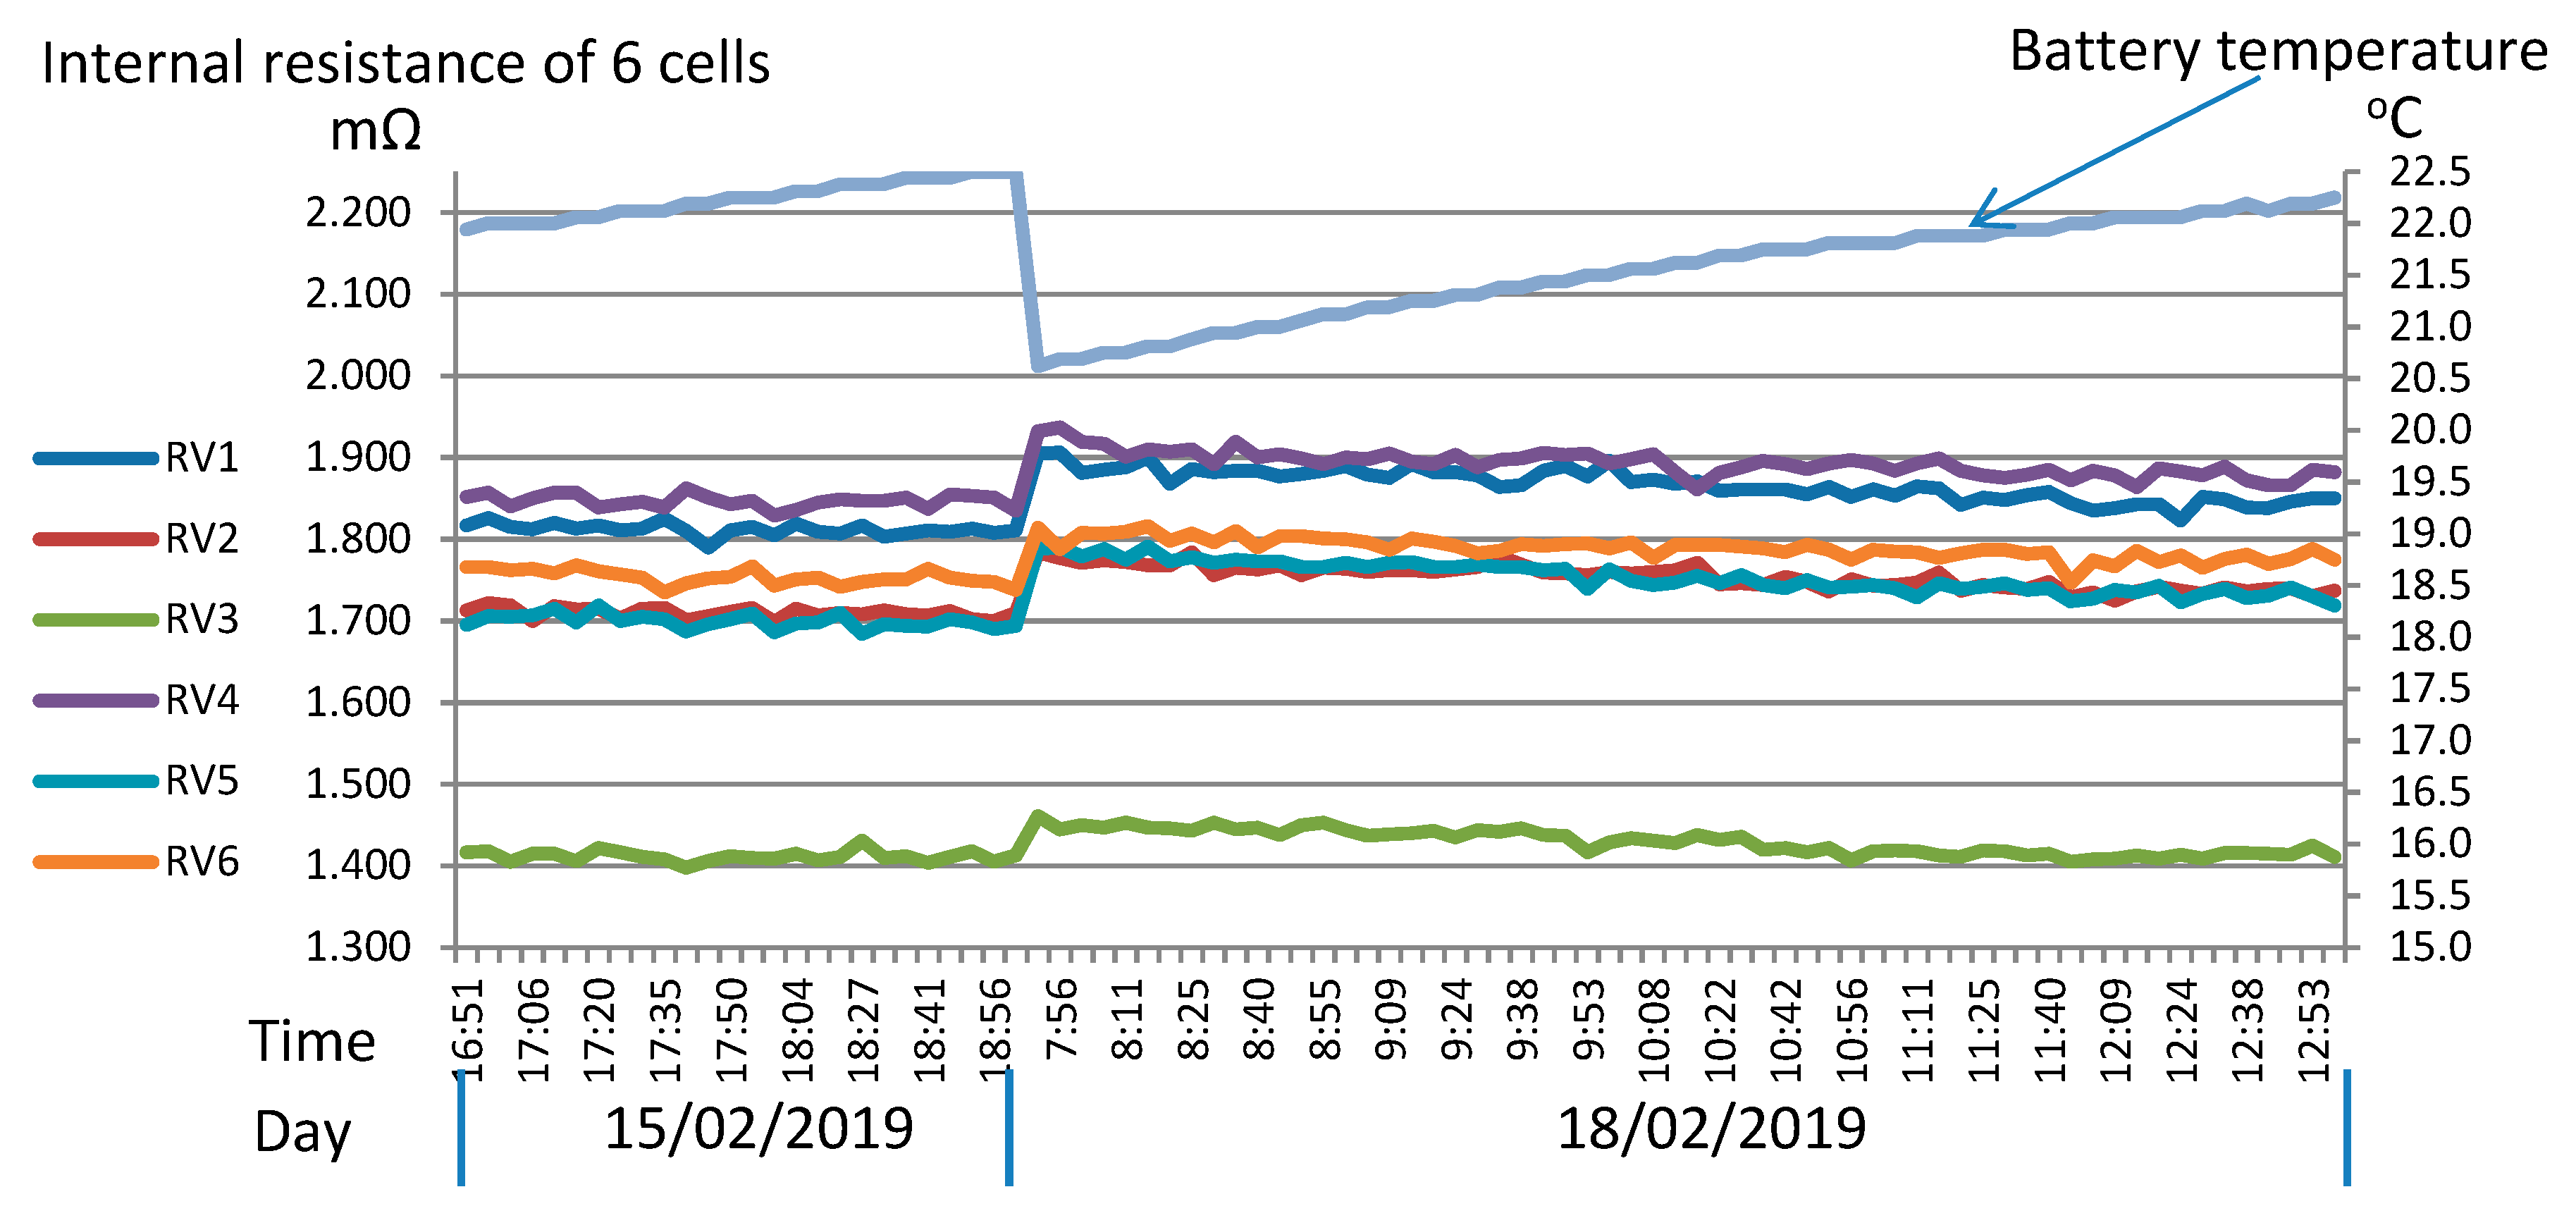
A typical battery-charger unit for a metropolitan train of “Metro de Madrid” is depicted in Figure 1.
The catenary feeds an inverter which supplies a three-phase transformer, with two output windings, one supplies the 380 Vac and 53 kVA and 50 Hz three-phase output to the train’s AC auxiliary loads and the other output winding is rectified in order to obtain a 116 V and 7 kWDC output where the battery is connected.
The charger is a 60 kVA converter from the manufacturer SEPSA The battery is a vented lead acid (VLA) type, of 116 V and (C5) 120 Ah. It consists of 52 cells grouped in 9 containers and it is manufactured by EXIDE (type CLASSIC 52, 02EPZSQ0120S). The battery used to carry out the measurements was taken from a train due to its poor condition: it showed signs of sulfation and most of its cells had not passed the discharge test.
The current ripple and the voltage ripple in the battery when in floating connection to the converter have been measured in the laboratory. It has been verified that the current ripple depends on the load condition of the converter; Figure 2 shows the current and voltage ripples for minimum and maximum load. Figure 2a,b show battery current ripple and one-cell voltage ripple at low load (0 A), respectively, while Figure 2c,d show battery current ripple and one-cell voltage ripple at full load (60 A), respectively.
To analyze the ripples imposed by the converter on the battery, voltage and current ripples values have been captured with the Graphtec GL500A midi LOGGER. A sampling period of 8 μs has been used and 212 (4096) points have been captured. The harmonic of the waveforms were calculated using the fast Fourier transform (FFT), verifying that the main harmonic has a frequency of 300 Hz, corresponding to the three-phase uncontrolled rectification of a 50 Hz system.
The harmonic contents of battery current and one-cell voltage ripples are detailed in Figure 3. Notice that, for the chosen number of sampling points (4096) and the sampling frequency (125 kHz), the frequency resolution of the harmonics calculated by the FFT is 30.5176 Hz and, therefore, the 300 Hz component appears shifted slightly towards the 10th FFT coefficient (305.1758 Hz) (Figure 3).
The root-mean-square (RMS) values of voltage and current ripples were calculated using harmonics from the 5th (152.5879 Hz) to the 15th (457.7637 Hz) FFT coefficients. Since no significant inductance was expected, the battery’s internal resistance was calculated dividing voltage RMS by current RMS. The results for the measurements over one cell were:
F F T V 300 = Y = 5 15 | F F T _ V y | 2 = 1.7980   mV ,
F F T I 300 = Y = 5 15 | F F T _ I y | 2 = 0.9225   A ,
R = F F T V 300 F F T I 300 = 1.9490   m Ω ,
An ad hoc Capture + Master device (shown in Figure 4) has been built in order to automate the necessary measurements. The Capture unit (a) measures the average voltages of each cell, the voltage ripple in each cell and calculates its Fourier transform. The Master unit (b) is responsible for measuring the average current and the current ripple, calculating its Fourier transform, measuring the temperature of the battery, requesting the data from the Capture unit and saving all these data in a micro-SD card. In order to make a quick and economical design, commercial prototyping modules were chosen. Both units are based on the Arduino DUE board [38] that mounts an Atmel SMART SAM38E micro-controller (MCU) based on the ARM Cortex-M3 RISC 32-bit processor. It operates at a maximum speed of 84 MHz and features up to 512 kbytes of Flash memory and up to 100 kbytes of Static Random Access Memory (SRAM). The peripheral set includes a 12-bit ADC at 1 MHz conversion rate, which permits a sampling period of 8 μs. Calculations have been carried out with 213 (8192) points. The Master unit also incorporates a DS3231 real-time clock and a digital thermometer DS18B20 12-bit with 1-wire bus communication. Both units incorporate a 2.4 GHz wireless module NRF24L01 to communicate with each other and operational amplifiers to adjust measurements gains to the margin available in the ADC (Figure 4).
The Capture unit, by means of solid state opto-relays, connects its ground (GND) to the negative terminal of each cell to be measured (Figure 5) the measurement is made by means of pairs of twisted cables to simplify the assembly. To keep the wiring simple, a Capture unit is mounted for each group of 6 cells, giving a total of 9 Capture units for the 52-cell battery. Figure 6 shows the installation in the first group of 6 cells together with the Master and the first Capture unit. The temperature sensor measures the temperature of the cell container and it is placed between cells V1, V2, V5 and V6 at medium depth.

3. Results

The proposed measurement system makes possible a continuous monitoring of a battery without disturbing its normal operation.
In the prototype built, a measurement time span of around 5 min has been set, and measured data are recorded in a micro-SD card. In a future design, the time span will be programmable and the data will be sent by radio or by wireless modules (Wi-Fi, 4G, etc.) for remote and continuous condition-based maintenance (CBM) while batteries are on board of the trains.
The measurements made in the laboratory began on 15 February 2019 with a load of 10 A in the UPS. The tests were stopped at 19:00 and the battery was disconnected during the weekend. On Monday 18, the battery was reconnected without load in the UPS (load 0 A); at 10:30, the load in the UPS was changed from 0 A to 45 A, and at 12:00 the load was reduced to 10 A. Figure 7 shows the variation of the internal resistance of each cell (RV1 to RV6) together with the battery temperature, the sharp temperature drop is due to the fact that the test was stopped during the weekend, as well as the effect of the laboratory’s heating system.
Figure 8 shows the variation of the average floating voltage of each cell (V1_ave to V6_ave) and the battery charging current when the battery is connected to the UPS and load changes. The current peak is due to the battery being discharged during the weekend when the UPS was switched off.
The data stored should allow maintenance personal to carry out a number of statistical studies of the variation of the battery parameters when a condition varies or when the battery status changes. For example, with data of Figure 7, it is possible to calculate the variation of the internal average resistance of each cell (RV1 to RV6) with temperature, its regression line, its prediction errors and its Pearson coefficient (Figure 9 and Figure 10). It is verified that the internal resistance presents a strong linear correlation with temperature, with values of the Pearson coefficient (R2) greater than 0.93 and a maximum prediction error less than ±38.7 μΩ (±2.1%) (in RV4 at 22 °C).

4. Discussion

To verify the results, the same resistance measurements for each of the 6 cells were also carried out at a fixed temperature of 22 °C, to avoid the effect of variation with temperature, by the commercial equipment for battery resistance testing MEGGER BITE 2P [34], commonly used in battery maintenance. It uses an AC current of 8 A and 50 Hz, and measures the voltage response of the battery. The accuracy for the impedance measurement is ±0.3% and ±0.1% for the voltage measurement.
The differences between the BITE 2P and the proposed measurement system are:
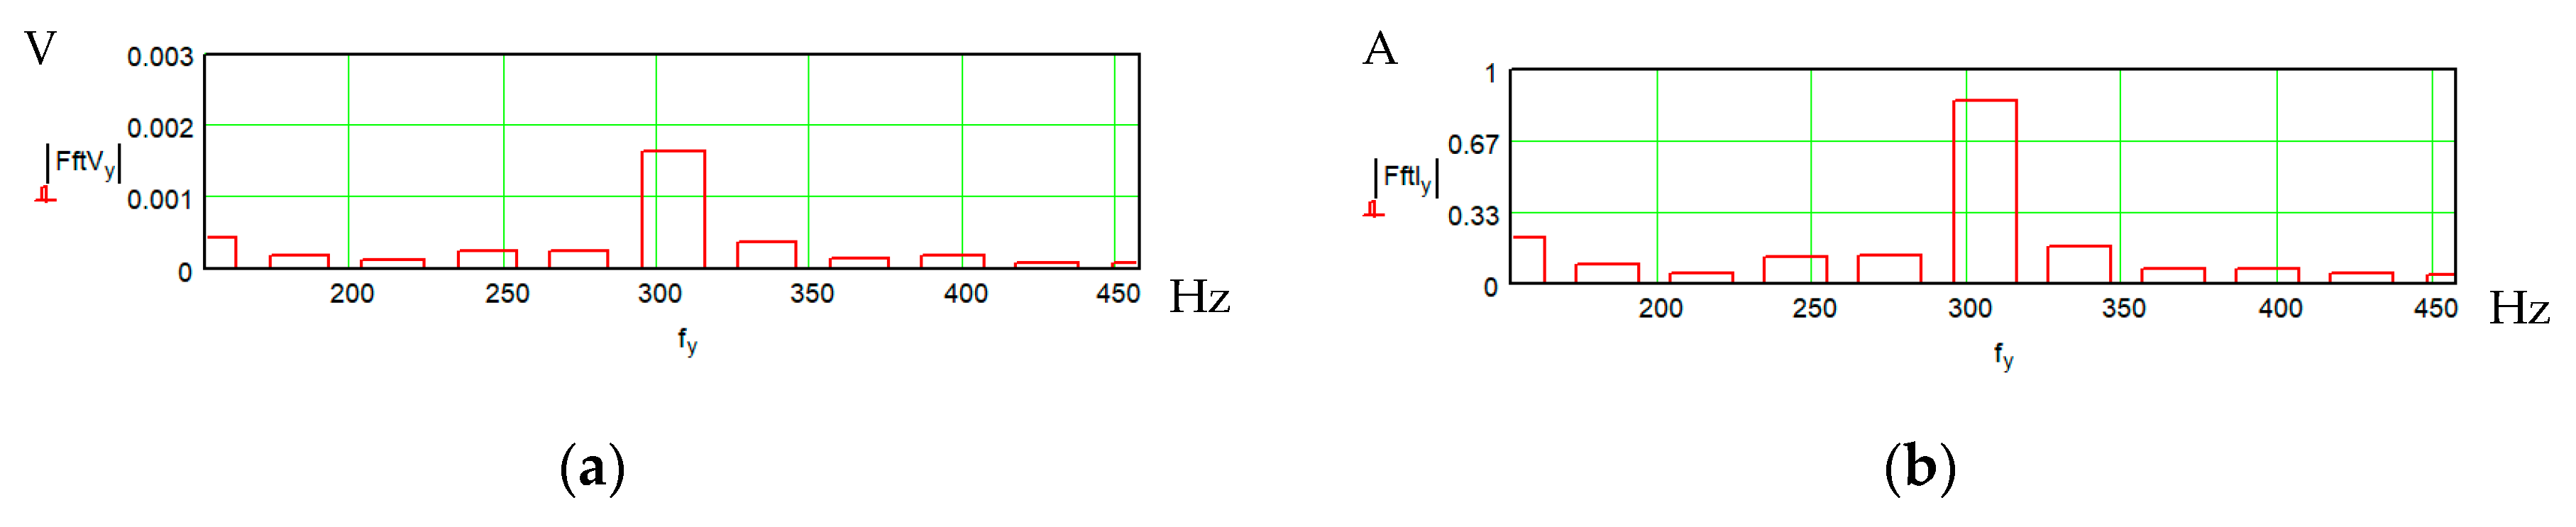
  • The BITE performs the measurement at a mains frequency of 50 Hz, while the proposed measurement system performs measurements at UPS current ripple frequency, which is 300 Hz (Figure 3).
  • The BITE needs to disconnect the battery from the UPS, to inject the measurement current, while the proposed measurement system performs measurements while the battery is working connected to the UPS.
The influence of the frequency of measurement on the value obtained for the internal resistance has been widely studied [19,20,36,39]. Figure 11 shows an effective RC circuit model for the frequency range of 10−1 Hz to 1 kHz where Rs models all conductive effects of the battery, Rct is the plate charge transfer resistance and Cdl is the electro-chemical double layer capacitance [19]. For example, [39] shows that above 100 Hz the measurement corresponds to the internal series resistance because the capacitor has a low resistance, negligible compared to the series resistance Rs.
Measurements with MEGGER BITE 2P are compared in Table 1 with those obtained with the equipment developed for the 6 cells (V1 to V2) at the same temperature of 22 °C.
Differences in Table 1 are due to the different frequency used, as explained above.
According to Figure 11, the double-layer capacitance Cdl can be calculated that correlates the two measures at different frequency, assuming that the measurements performed at 300 Hz correspond to Rs, as has been argued, and a plate charge transfer resistance Rct value of 12 Ω has been taken.
C d l = 1 2 π f [ 1 ( Z 2 R s 2 ) 1 R c t ]
Table 2 presents the results, sorted by the impedance value measured with the BITE, and the average voltage of each cells measured at 17:00 h of the day 15 February 2019 at 22 °C (Figure 8).
There is a relationship between cells with the highest resistance, the lowest capacitance and the lower flotation voltage. This result coincides with the results presented in [5], where the variation of the internal parameters of the battery is studied with its degradation for different reasons.
Given the cell resistance measured in both methods, one should conclude that cells 1, 2 and 4 to 6 are equally deteriorated while cell 3, although unhealthy, has the best SOH of all. Note that a healthy cell is expected to show an internal resistance below 1.250 mΩ at 22 °C.

5. Conclusions

A new method has been proposed to measure a battery’s internal resistance continuously and non-invasively in a UPS system. This parameter is widely accepted to estimate a battery state-of-health. Unlike popular direct methods, the procedure proposed does not require a disturbance in the battery’s normal operation. The new system can placed on board a train, which makes it possible to automatize measurements and send several parameters of each battery cell (internal resistance, float voltage, float current, temperature) through a wireless channel (Wi-Fi, 4G, etc.) to the maintenance center. This is a key step to facilitate battery CBM, without having to stop the train carrying out manual measurements.
The new measurement system has been tested in the laboratory, registering the values of 6 cells under different temperature and charging current conditions. The measures with the proposed system have been shown to be repetitive and obtained the same values in different days, even after the system has been turned off for 48 h. The values obtained with the proposed system have been compared with those obtained with a commercial equipment. The differences found are due to the difference in the measurement frequency, and it is shown that, qualitatively, the two systems give the same results in terms of SOH of the measured cells.
As an example of a possible use for the data obtained, the variation of the internal resistance with temperature has been analyzed, finding a strong linear correlation with R2 greater than 0.93 and a maximum prediction error less than ±2.1%. This analysis carried out with the current systems would have required a technician to spend a working day performing test, having to disconnect the battery from the UPS to be able to take measurements and reconnecting the battery to avoid the influence of self-discharge in the measurements. The proposed system makes it possible to obtain information that would otherwise be very difficult to obtain, such as the variation of the internal resistance when the battery is being charged, or the correlation between the internal resistance and the cell voltage in flotation and charging.

Author Contributions

Investigation, J.d.l.P.L.; supervision, C.S.d.M.; validation, J.C.I.

Funding

This research received no external funding.

Acknowledgments

To Metro de Madrid for facilitating the laboratory with the equipment to test (battery and 60 kVA UPS) and the test means (supply voltage and load resistors).

Conflicts of Interest

The authors declare no conflict of interest.

References

  1. UPS Market Share: Analysis, Size, and Forecast. Available online: https://www.technavio.com/research/ups-market-share (accessed on 16 March 2019).
  2. SBI Energy. SBI Energy White Paper, Advanced Storage Battery Market, From Hybrid/Electric Vehicles to Cell Phones; SBI Energy: Rockville, MD, USA, 2009; Available online: https://www.sbireports.com/docs/SBI_AdvancedStorageBatteryMarketWhitePaper_October2009.pdf (accessed on 16 March 2019).
  3. Toshiba Science Museum. World’s First Large-Capacity Static Uninterruptible Power Supply (UPS). Available online: http://toshiba-mirai-kagakukan.jp/en/learn/history/ichigoki/1967power_source/index.htm (accessed on 16 March 2019).
  4. A Brief History of INTELEC®. The International Telecommunications Energy Conference. Available online: http://www.intelec.org/about.html (accessed on 16 March 2019).
  5. Debardelaben, S. Determining the end of battery life. In Proceedings of the INTELEC ‘86—International Telecommunications Energy Conference, Toronto, ON, Canada, 19–22 October 1986; pp. 365–368. [Google Scholar]
  6. IEEE. IEEE Recommended Practice for Maintenance, Testing, and Replacement of Vented Lead-Acid Batteries for Stationary Applications; IEEE Std 450-1995; IEEE: New York, NY, USA, 1995; pp. 1–32. [Google Scholar]
  7. IEEE. IEEE Recommended Practice for Maintenance, Testing, and Replacement of Vented Lead-Acid Batteries for Stationary Applications; IEEE Std 450-2010 (Revision of IEEE Std 450-2002); IEEE: New York, NY, USA, 2011; pp. 1–71. [Google Scholar]
  8. BatteryTestingGuide_AG_es_V04; Megger GmbH; Obere Zeil 2; DE-61440 Oberursel. Available online: https://uk.megger.com/login?returnurl=%2fsupport%2ftechnical-library%2ftechnical-guides%2fbattery-testing-guide (accessed on 16 March 2019).
  9. GNB Industrial Power. Instrucciones de Instalación y Operación; Section 93.10TS2012-07; GNB Industrial Power: Aurora, IL, USA, 2012; Available online: http://www2.exide.com/Media/files/Downloads/IndustAmer/Section%2093_10TS%202012-07%20GNB%20Flooded%20Classic%20TCX%20Batteries%20I%26O%20Manual%20in%20Spanish.pdf (accessed on 16 March 2019).
  10. IEEE. IEEE Recommended Practice for Maintenance, Testing, and Replacement of Valve-Regulated Lead-Acid (VRLA) Batteries for Stationary Applications; IEEE Std 1188-2005 (Revision of IEEE Std 1188-1996); IEEE: New York, NY, USA, 2006; pp. 1–44. [Google Scholar]
  11. Damlund, I. Analysis and interpretation of AC-measurements on batteries used to assess state-of-health and capacity-condition. In Proceedings of the 17th International Telecommunications Energy Conference (INTELEC 95), The Hague, The Netherlands, 29 October–1 November 1995; pp. 828–833. [Google Scholar]
  12. Boisvert, T. Using float charging current measurements to prevent thermal runaway on VRLA batteries. In Proceedings of the 2001 Twenty-Third International Telecommunications Energy Conference (INTELEC 2001), Edinburgh, UK, 14–18 October 2001; pp. 126–131. [Google Scholar]
  13. Floyd, K.D.; Noworolski, Z.; Noworolski, J.M.; Sokolski, W. Assessment of lead-acid battery state of charge by monitoring float charging current. In Proceedings of Intelec 94; IEEE: New York, NY, USA, 1994; pp. 602–608. [Google Scholar]
  14. Vaccaro, F.J.; Casson, P. Internal resistance: Harbinger of capacity loss in starved electrolyte sealed lead acid batteries. In Proceedings of the Ninth International Telecommunications Energy Conference, Stockholm, Sweden, 14–17 June 1987; pp. 128–131. [Google Scholar]
  15. Johnson, W. Stationary Battery Monitoring by Internal Ohmic Measurements; Final Report, December 2002; EPRI: Palo Alto, CA, USA, 2002; Product ID: 1002925; Available online: https://www.epri.com/#/pages/product/000000000001002925/?lang=en-US (accessed on 16 March 2019).
  16. Munoz-Condes, P.; Gomez-Parra, M.; Sancho, C.; San Andres, M.A.G.; Gonzalez-Fernandez, F.J.; Carpio, J.; Guirado, R. On Condition Maintenance Based on the Impedance Measurement for Traction Batteries: Development and Industrial Implementation. IEEE Trans. Ind. Electron. 2013, 60, 2750–2759. [Google Scholar] [CrossRef]
  17. Markle, G.J. Variables that influence results of impedance testing for valve regulated cells. In Proceedings of the 15th International Telecommunications Energy Conference (Intelec 93), Paris, France, 27–30 September 1993; Volume 1, pp. 444–448. [Google Scholar]
  18. Alber, G.; Migliaro, M.W. Impedance testing-is it a substitute for capacity tests? In Proceedings of Intelec 94; IEEE: New York, NY, USA, 1994; pp. 245–249. [Google Scholar]
  19. Saponara, S. Distributed Measuring System for Predictive Diagnosis of Uninterruptible Power Supplies in Safety-Critical Applications. Energies 2016, 9, 327. [Google Scholar] [CrossRef]
  20. Willihnganz, E.; Rohner, P. Battery Impedance: Farads, Milliohms, Microhenrys. Electr. Eng. 1959, 78, 922–925. [Google Scholar] [CrossRef]
  21. PNGV Battery Test Manual; DOE/ID-10597; Rev. 3; February 2001; Idaho Operations Office., Idaho, USA. Available online: https://avt.inl.gov/sites/default/files/pdf/battery/pngv_manual_rev3b.pdf (accessed on 16 March 2019).
  22. Rezvanizaniani, S.M.; Liu, Z.; Chen, Y.; Lee, J. Review and recent advances in battery health monitoring and prognostics technologies for electric vehicle (EV) safety and mobility. J. Power Sources 2014, 256, 110–124. [Google Scholar] [CrossRef]
  23. Chang, W. The State of Charge Estimating Methods for Battery: A Review. ISRN Appl. Math. 2013, 2013, 953792. [Google Scholar] [CrossRef]
  24. Ng, K.S.; Moo, C.S.; Chen, Y.P.; Hsieh, Y.C. Enhanced coulomb counting method for estimating state-of-charge and state-of-health of lithium-ion batteries. Appl. Energy 2009, 86, 1506–1511. [Google Scholar] [CrossRef]
  25. Weigert, T.; Tian, Q.; Lian, K. State-of-charge prediction of batteries and battery-supercapacitor hybrids using artificial neural networks. J. Power Sources 2011, 196, 4061–4066. [Google Scholar] [CrossRef]
  26. Linda, O.; William, E.J.; Huff, M.; Manic, M.; Gupta, V.; Nance, J.; Hess, H.; Rufus, F.; Thakker, A.; Govar, J. Intelligent neural network implementation for SOCI development of Li/CFx batteries. In Proceedings of the 2nd International Symposium on Resilient Control Systems (ISRCS ‘09), Idaho Falls, ID, USA, 11–13 August 2009; pp. 57–62. [Google Scholar]
  27. Chang, W.Y. State of charge estimation for LiFePO4 battery using artificial neural network. Int. Rev. Electr. Eng. 2012, 7, 5800–5874. [Google Scholar]
  28. Álvarez, J.C.; García, P.J.; Blanco, C. Support Vector Machines Used to Estimate the Battery State of Charge. IEEE Trans. Power Electr. 2013, 28, 5919–5926. [Google Scholar] [CrossRef]
  29. Carmona Suárez, E.J. Tutorial sobre Máquinas de Vectores Soporte (SVM); Dpto. de Inteligencia Artificial, ETS de Ingeniería Informática, Universidad Nacional de Educación a Distancia (UNED). 2014. Available online: http://www.ia.uned.es/~ejcarmona/publicaciones/%5B2013-Carmona%5D%20SVM.pdf, (accessed on 21 July 2019).
  30. Li, I.H.; Wang, W.Y.; Su, S.F.; Lee, Y.S. A merged fuzzy neural network and its applications in battery state-of-charge estimation. IEEE Trans. Energy Convers. 2007, 22, 697–708. [Google Scholar] [CrossRef]
  31. Lee, Y.S.; Wang, W.Y.; Kuo, T.Y. Soft computing for battery state-of-charge (BSOC) estimation in battery string systems. IEEE Trans. Ind. Electron. 2008, 55, 229–239. [Google Scholar] [CrossRef]
  32. Juang, L.W.; Kollmeyer, P.J.; Jahns, T.M.; Lorenz, R.D. Implementation of online battery state-of-power and state-of-function estimation in electric vehicle applications. In Proceedings of the Energy Conversion Congress and Exposition (ECCE), Raleigh, NC, USA, 15–20 September 2012. [Google Scholar] [CrossRef]
  33. Plett, G.L. Extended Kalman filtering for battery management systems of LiPB-based HEV battery packs. J. Power Sources 2004, 134, 277–292. [Google Scholar] [CrossRef]
  34. Megger Battery Testing. Available online: https://megger.com/products/cable-fault-test-and-diagnostics/telecom-testing/battery-testing (accessed on 16 March 2019).
  35. Wurst, J.W.; Garron, S.A.; Dob, A.M. Apparatus for Measuring Internal Resistance of Wet Cell Storage Batteries Having Non-Removable Cell Caps. U.S. Patent 5047722A, 10 September 1991. [Google Scholar]
  36. Lee, Y.D.; Park, S.Y.; Han, S.B. Online Embedded Impedance Measurement Using High-Power Battery Charger. IEEE Trans. Ind. Appl. 2015, 51, 498–508. [Google Scholar] [CrossRef]
  37. Stefanakos, E.K.; Thexton, A.S. Remote battery monitoring and management field trial. In Proceedings of the Power and Energy Systems in Converging Markets, Melbourne, Australia, 23 October 1997; ISBN 0-7803-3996-7. [Google Scholar]
  38. ARDUINO DUE. Available online: https://store.arduino.cc/due (accessed on 16 March 2019).
  39. Huet, F. A review of impedance measurements for determination of the state-of-charge or state-of-health of secondary batteries. J. Power Sources 1998, 70, 59–69. [Google Scholar] [CrossRef]
Figure 1. Diagram block of the 60 kVA converter and battery.
Energies 12 02836 g001
Figure 2. Current and voltage ripple measurements. (a) Battery current ripple at low load (1 A/Div. and 1 ms/Div.); (b) one-cell voltage ripple at low load (2 mV/Div. and 1 ms/Div.); (c) battery current ripple at full load (2 A/Div. and 1 ms/Div.); (d) one-cell voltage ripple at full load (5 mV/Div. and 1 ms/Div.).
Energies 12 02836 g002
Figure 3. Fast Fourier transform (FFT) of the voltage (a) and current ripple (b).
Energies 12 02836 g003
Figure 4. (a) Capture unit; (b) Master unit.
Energies 12 02836 g004
Figure 5. Cells measurement configuration.
Energies 12 02836 g005
Figure 6. Implementation in a battery.
Energies 12 02836 g006
Figure 7. Results of measurements in the laboratory: resistance of 6 cells vs. temperature.
Energies 12 02836 g007
Figure 8. Results of measurements in the laboratory: float voltage of 6 cells vs. charging current.
Energies 12 02836 g008
Figure 9. Average resistance of RV1 to RV3 vs. temperature.
Energies 12 02836 g009
Figure 10. Average resistance RV4 to RV6 vs. temperature.
Energies 12 02836 g010aEnergies 12 02836 g010b
Figure 11. Cell equivalent circuit model [7,19,39].
Energies 12 02836 g011
Table 1. Results of the proposed unit vs. MEGGER BITE.
Cell NumberR Cell Proposed Unit (mΩ)Z Cell BITE (mΩ)
V11.8142.182
V21.7122.007
V31.4111.575
V41.8462.138
V51.7032.021
V61.7582.037
Table 2. Double layer capacitance.
Cell NumberZ Cell BITE at 50 Hz (mΩ)RS Cell Proposed Unit at 300 Hz (mΩ)Cdl (F)Average Voltage at 18:00 h Day 15 February 2019 (V)
V31.5751.4134.62.303
V22.0071.7353.22.237
V52.0211.7323.12.233
V62.0371.7743.22.243
V42.1381.8773.12.241
V12.1821.8422.72.239

