1. Introduction
Wind energy is one of the leading sources of renewable energy in Denmark and other countries. Wind energy is increasingly being used in cold climate locations [
1] where icing can be a significant issue that should be taken into account in a risk assessment related to the area around wind turbines. An environmental impact assessment has to be performed, e.g., when it is planned to locate wind turbines in areas where people are living and in cases where it is planned to place wind turbines near a road or highway. Generally, the safety factors used for the design of wind turbines do not cover such situations, since safety factors have been calibrated assuming that there is no or almost no risk of human fatalities in case of the failure of parts of a wind turbine. Ice accretion could have a direct impact on wind turbine operation, such as measurement errors, power losses, mechanical and electrical failures, and safety hazard problems [
2]. Several investigations are ongoing in order to establish rules and guidelines related to icing. For instance, icing could affect the functionality of anemometers if they are unheated, see [
3]. In Germany, wind turbines are not allowed to operate during icing situations, see [
4]. Several reports are available showing that some wind turbines in Sweden during the 2002 and 2003 winters were forced to stop for seven weeks. Statistics from Sweden show that in winter months, 92% of full stops are caused because of icing [
5]. In Germany, 85% of full stops of wind turbines in the mountains were caused by icing [
6]. During the design stage, a functional ice detection system can be planned to be installed; subsequently, the wind turbine will be shut down if icing is detected by the ice detection systems.
Most of the de-icing and anti-icing techniques used for wind turbines are inspired by the aviation industry; all these techniques can be classified into two types: passive and active. As an example, for passive techniques, ice-phobic and hydrophobic coatings can be used; furthermore, for active techniques, electrothermal blade heating, heating with microwaves, warm air heating can be applied. However, all of them have some disadvantages. These systems are generally unreliable, and therefore energy losses occur, and the effectiveness of the system decrease [
2,
7,
8].
Ice detection systems are needed to make de-icing and anti-icing systems work. Double anemometer and vibration sensors are often used, as they are cheap; however, they have some weak points. For example, in double anemometers, since humidity is measured relatively, it may lead to an incorrect prediction of icing, which will then affect the wind turbine operation [
9]. Another weakness point for double anemometers is related to the location of where they are installed; since icing is increasing with height, a double anemometer will always predict less icing compared to the amount of icing at the most critical location, especially when the turbine is parked [
10]. Another shortcoming occurs due to increased measurement errors in case of low temperatures for unheated anemometers [
11]. Furthermore, vibration sensors cannot detect icing during stall operation [
10]. Optical sensors or video cameras seem more reliable than the aforementioned instruments, e.g., Remote Ice Detection Equipment (RIDE) [
12].
In this paper, we consider whether it is worthwhile putting heating systems on the blades when there is the possibility of icing. Situations are considered in which an ice detection system is already installed. Different failure scenarios related to blade failures and icing will be presented in
Section 2. In
Section 3, risk assessment is described taking to account the distance of wind turbines to highways. Risk is estimated as the probability (per km and per year) that a person in a car will be hit (and killed) by ice pieces or parts of wind turbine blades. It is assumed that a row of wind turbines is placed along the highway. The risk is determined as a function of the distance from the wind turbines to the highway. Our results could provide decision-makers with a tool for deciding whether wind turbines should be placed near a highway and whether heating systems should be installed. This risk assessment and a case study are presented in
Section 3 and
Section 4, and can be used as decision support for designers at sites with limited space and in which wind turbines need to be placed as close as possible to highways. In
Section 5, the Value of Action approach is presented as the basis for quantifying whether it is worthwhile installing a heat detection system for wind turbine blades exposed to icing, and in
Section 6, a case study is presented to illustrate the decision problem and how it can be solved.
2. Failure Scenarios
The following scenarios are considered in the assessment of risks for the surroundings of a wind turbine:
- (1)
A part of a wind turbine blade or the whole blade may fail/collapse and be thrown away from the turbine;
- (2)
Icing may occur when the wind turbine is in operation, and ice pieces may be thrown away;
- (3)
The wind turbine may be stopped in situations with icing, but ice pieces may be thrown away due to high wind speeds.
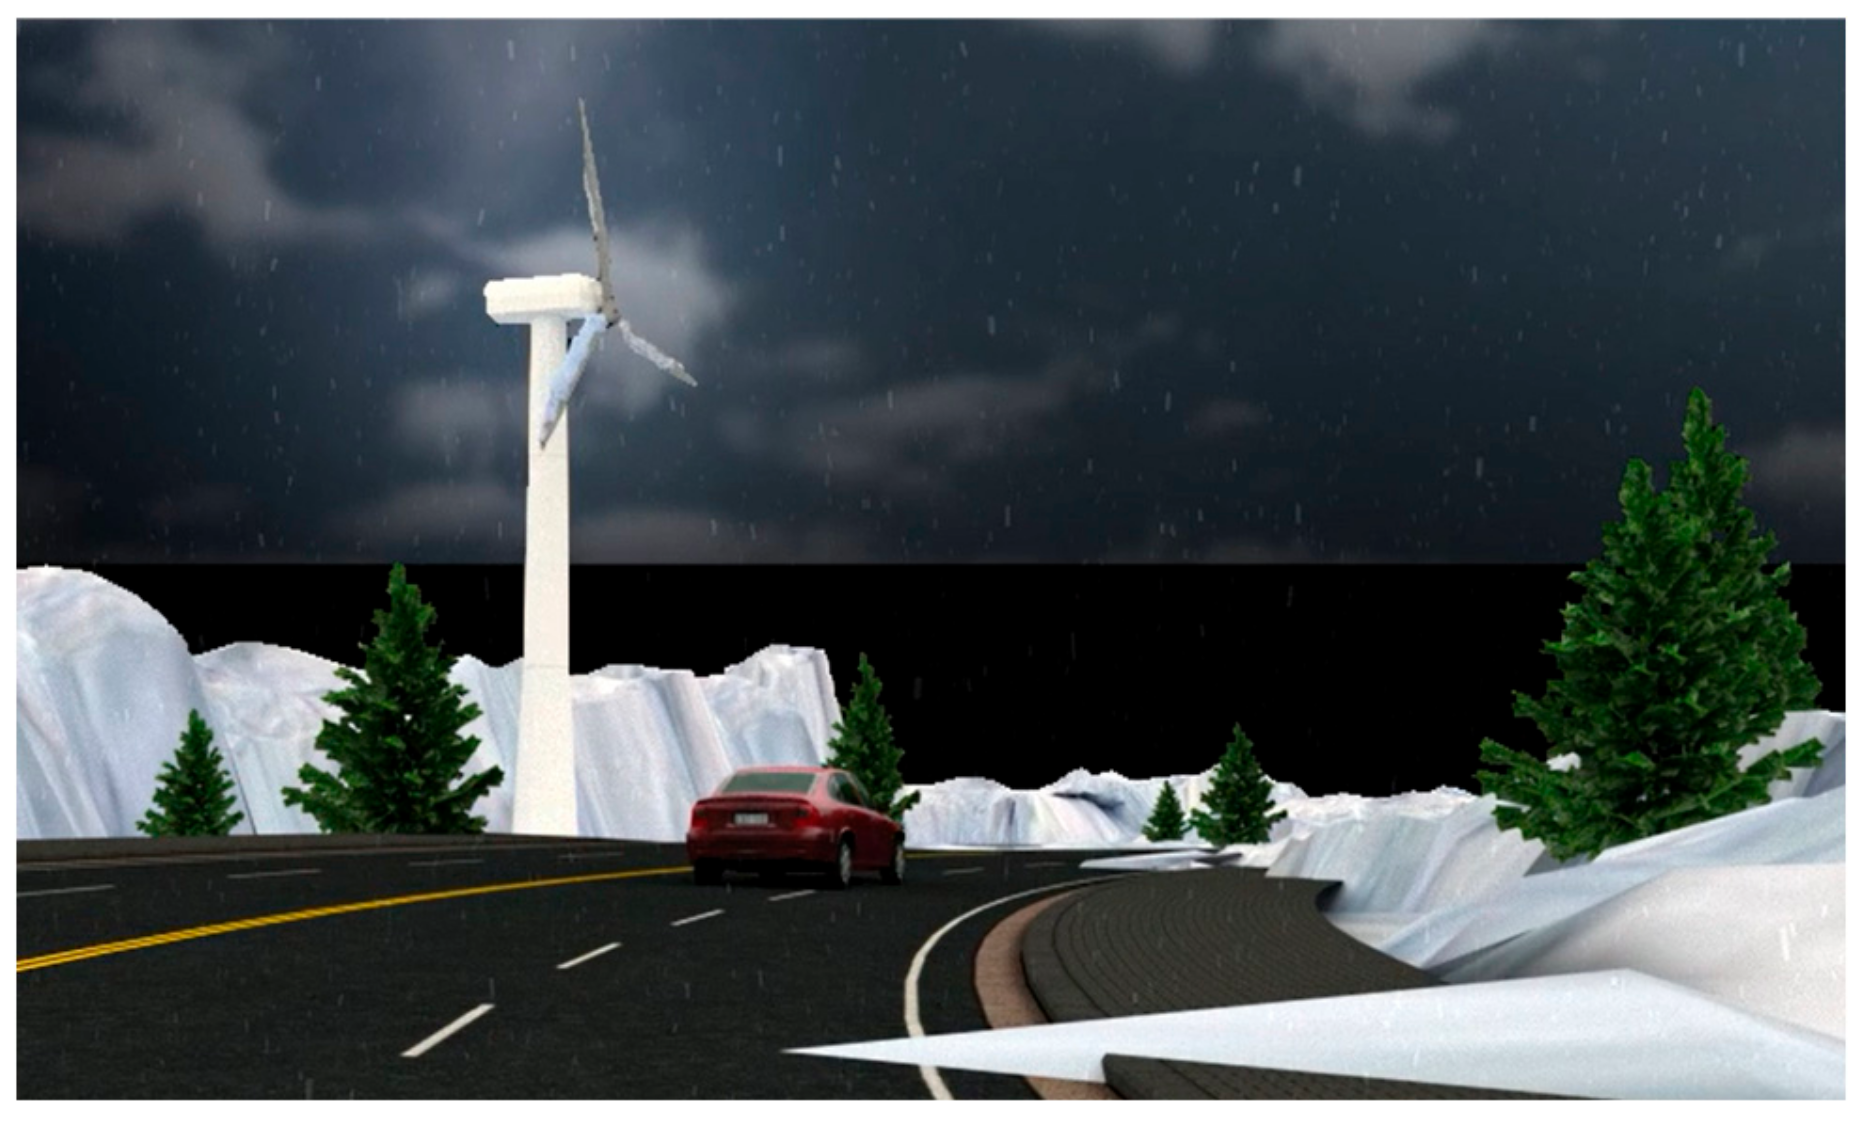
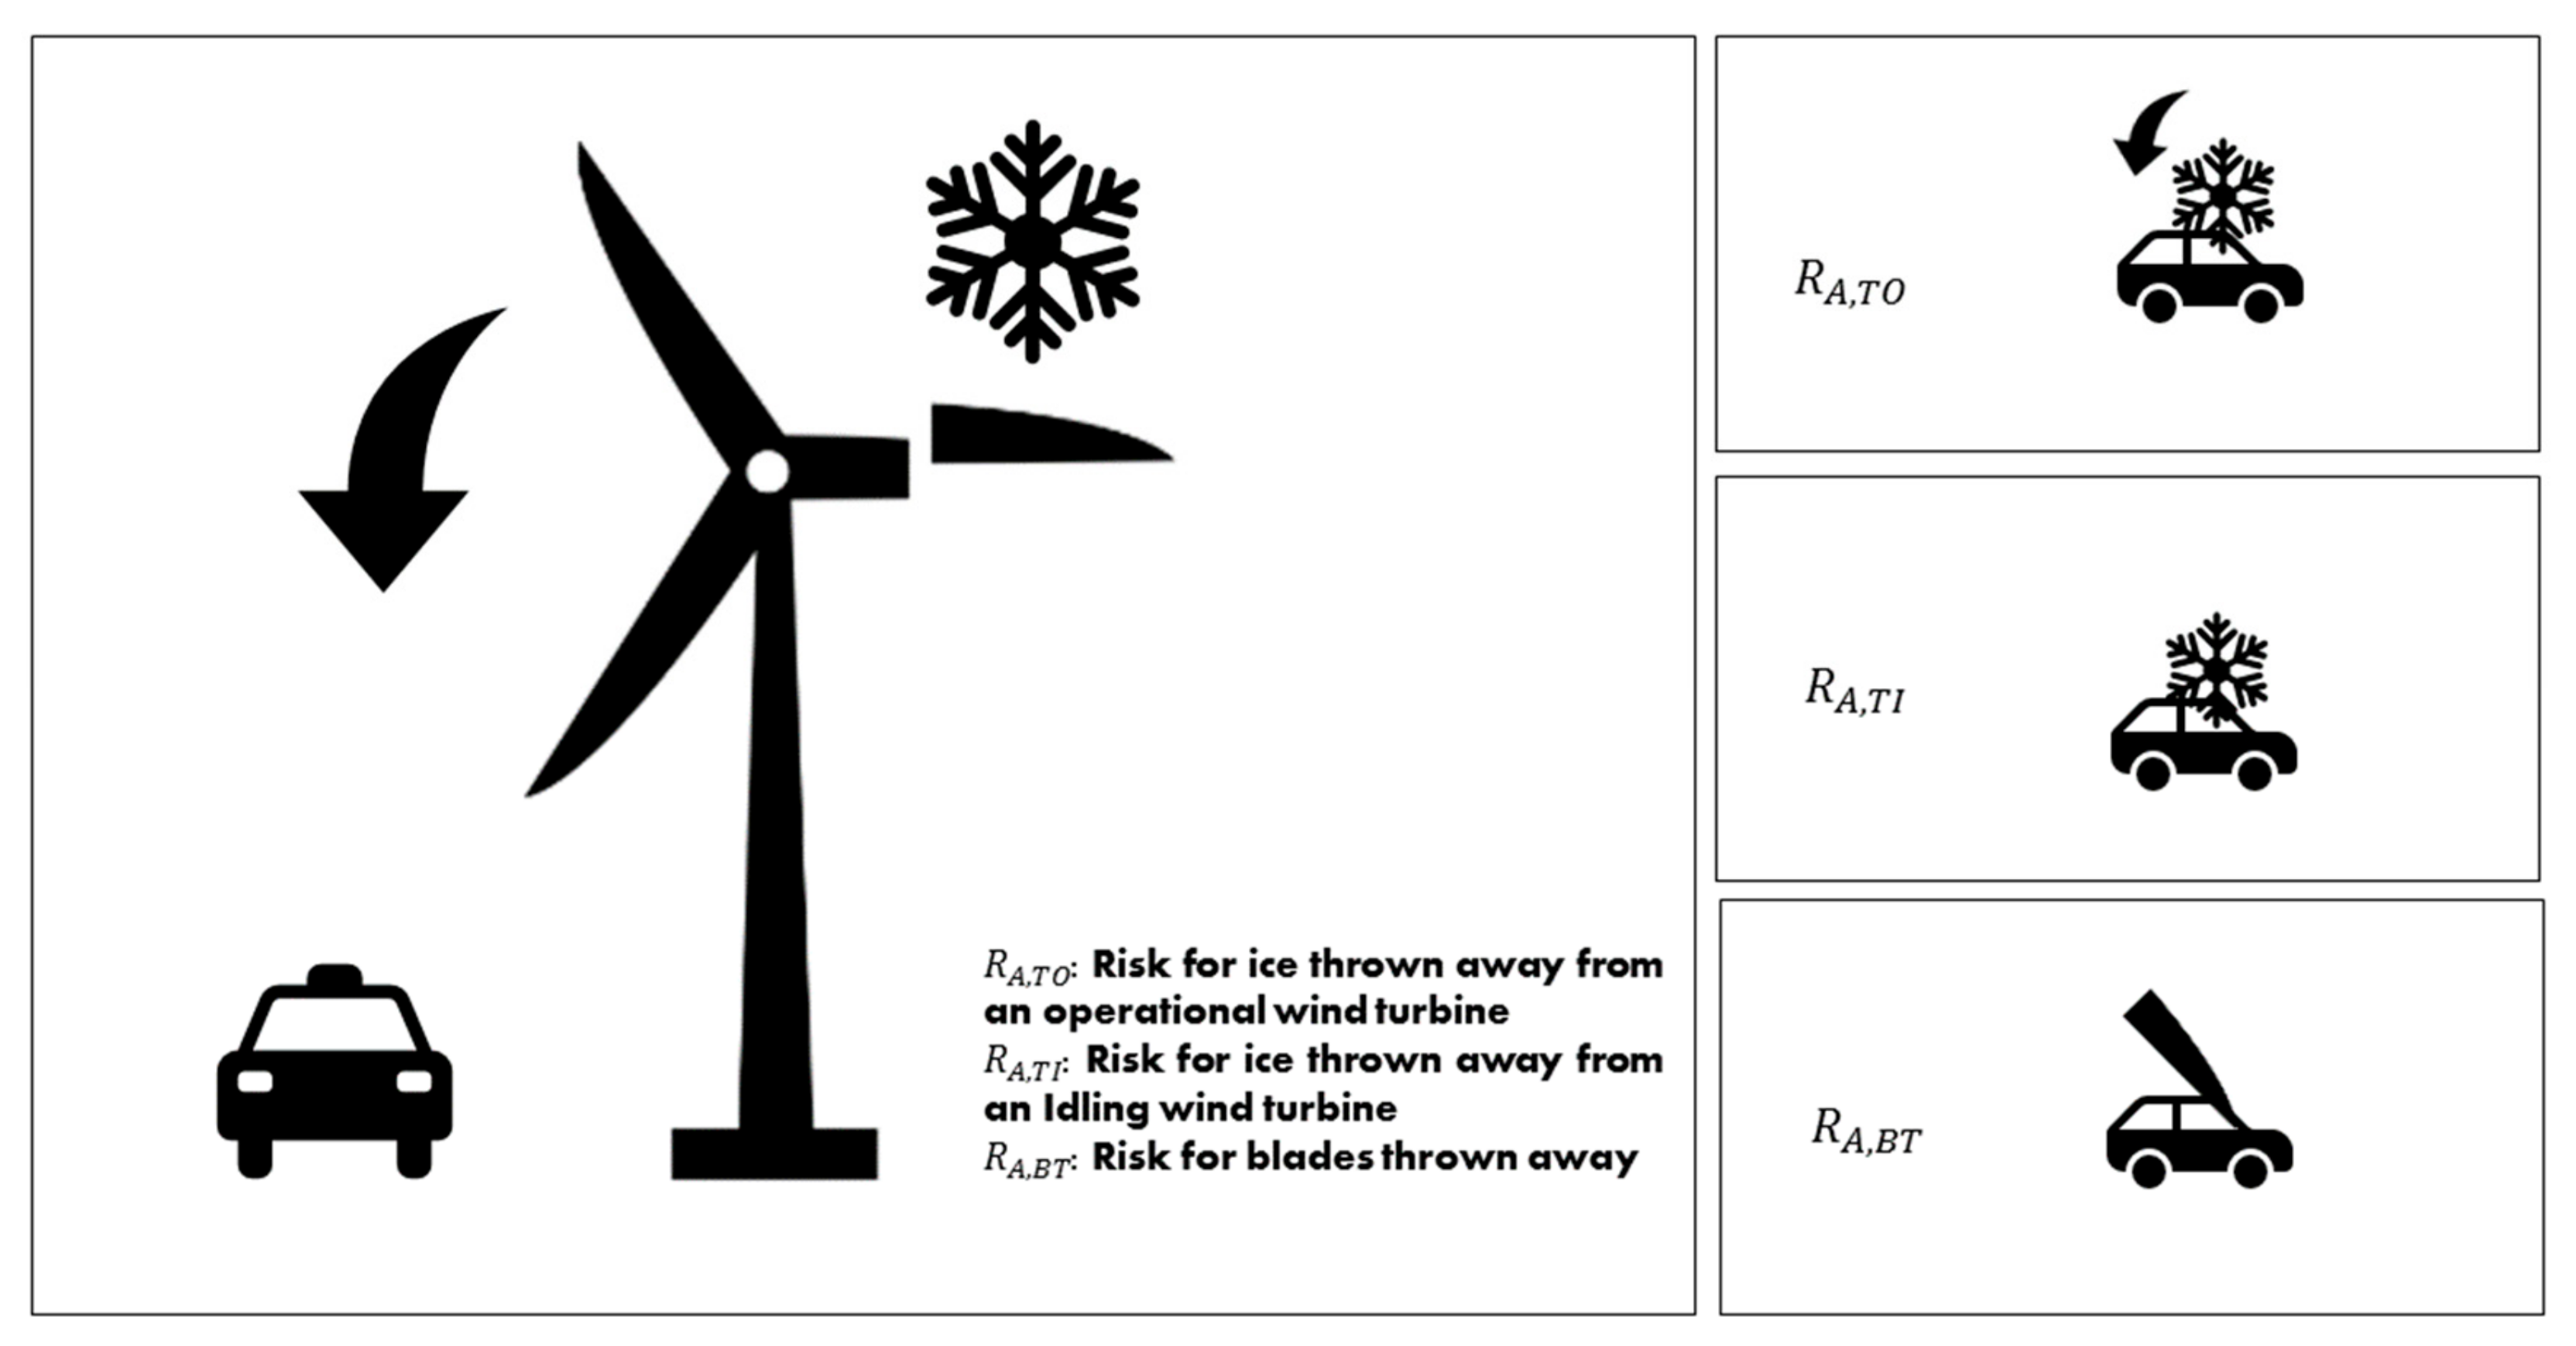
The reasons for wind turbine blade failures may be the extremely low strength of the materials (within random variations of strength parameters), manufacturing errors, maintenance errors or extreme environmental conditions (within random variations of environmental parameters and accounting for the effect of the control system). Ice throw can be considered to be similar to a slingshot effect. Ice may be blown from the rotor blades in cases with strong wind when the wind turbine is parked or idling, or thrown away when the wind turbine is in operation. In a risk assessment, mechanical and electrical failures may lead to blade or blade fragment failures; fire and ice risks may be considered as similar events with the main difference between them in the risk assessment being related to their frequency of occurrence [
13]. An icing event of a wind turbine near a highway is depicted in
Figure 1.
A conservative rule suggested by Seifert states that the risk of ice-throw from an operational wind turbine has to be investigated for roads, paths or other objects of interest if the wind turbine is placed within the following distance from a road [
3]:
To determine the probability of adverse events in the affected area around the wind turbine, the following parameters should be considered [
14]:
In [
15], an icing model is proposed based on measurements in Germany. Some challenges were observed by this study for ice forecasting, such as the high sensitivity to parameters like liquid water content, droplets median diameter, wind, and temperature.
Ice properties/ice pieces are often classified into four scenarios based on a study by TÜV [
14]:
Rime ice, mass: 90 g (scenario A), and 240 g (scenario B);
Clear ice, mass: 70 g (scenario C) and 180 g (scenario D).
Based on the TÜV study, which considered a typical wind turbine of 141 m hub height and 117 m rotor diameter, scenario B and D are identified as scenarios that can cause fatalities, and in cases of 90 g rime ice (Scenario A) and 70 g clear ice (Scenario C), slight injuries might occur [
14].
In another study, rime ice was classified into five cases [
16]: (1) 0 to 0.5 kg/m, (2) 0.5 to 0.9 kg/m, (3) 0.9 to 1.6 kg/m, (4) 1.6 to 2.8 kg/m and (5) 2.8 to 5.0 kg/m, for which observations from wind turbines in Quebec showed that the second class could be dangerous [
17].
In the WECO (Wind Energy Production in Cold Climate) project [
18], the frequency of ice fall events is estimated based on observations from a wind turbine by counting ice pieces around a test site in Switzerland, where 200 ice falls over three winters were measured.
4. Case Study—Risk Assessment
An example of risk assessment for wind turbines close to highways in Denmark is presented in this section, accounting for the risks mentioned above from falling parts from wind turbine blades in conditions of total or partial damage, as well as ice thrown from wind turbine blades in the case of icing.
In [
24], the occurrence of icing was divided into four conditions: heavy, moderate, light, and no icing; Denmark can be considered as a country with moderate icing conditions. It is presumed that a row of wind turbines is placed along a highway with a typical total height of 150 m and a spacing of 500 m along the road. Data is collected from wind turbines both in Denmark and overseas [
25].
The following assumptions are made [
25]:
The average drag coefficient of ice pieces is assumed to be 0.6, the density of air is assumed at 1.3 kg/m3 and that of ice is assumed to be 800 kg/m3;
Ice pieces need to be more than 2 cm in thickness in order to be thrown away without being split to smaller pieces on the way;
The mean speed of vehicles is assumed to 88 km/h on Danish highways (based on Danish road statistics);
1.5 people will die in the case of hitting parts (based on Danish road statistics, on average 1 or 2 people usually sits in cars, the average is considered in this case study);
The probability of being killed when an ice piece or blade part hits a car is assumed to be one, since only large objects are considered;
The 10-min mean wind speeds, , are assumed to discretized to 5, 10, 15, 20 and 25 m/s;
The area of a vehicle is assumed to be 10 m2, which is average for a passenger car;
Ice pieces larger than 3 mm are used with an occurrence rate of 0.175 times per year (in Denmark). This modeling is subject to considerable uncertainty, since the ice pieces can become larger on the blades because of wind speed or during blade rotation.
In the following figures, models for each of the above three cases are derived based on the models described in [
25], as well as ballistic calculations using the models in [
26].
The probability (per km per year) that a car is hit by ice pieces,
, is estimated in icing conditions based on the following model [
25]:
where
speed of the vehicle
S length of road section considered
area of a car
D spacing between the wind turbines placed along the highway
probability (per km per year) that an ice piece lands in the distance s from the wind turbine if the mean wind speed is
. A uniform probability distribution is assumed within the throwing distance
at the mean wind speed
. Furthermore, using a uniform directional distribution of the wind speed,
is determined by
ν number of icing events per year
probability that the mean wind speed at hub height in connection with icing is equal to .
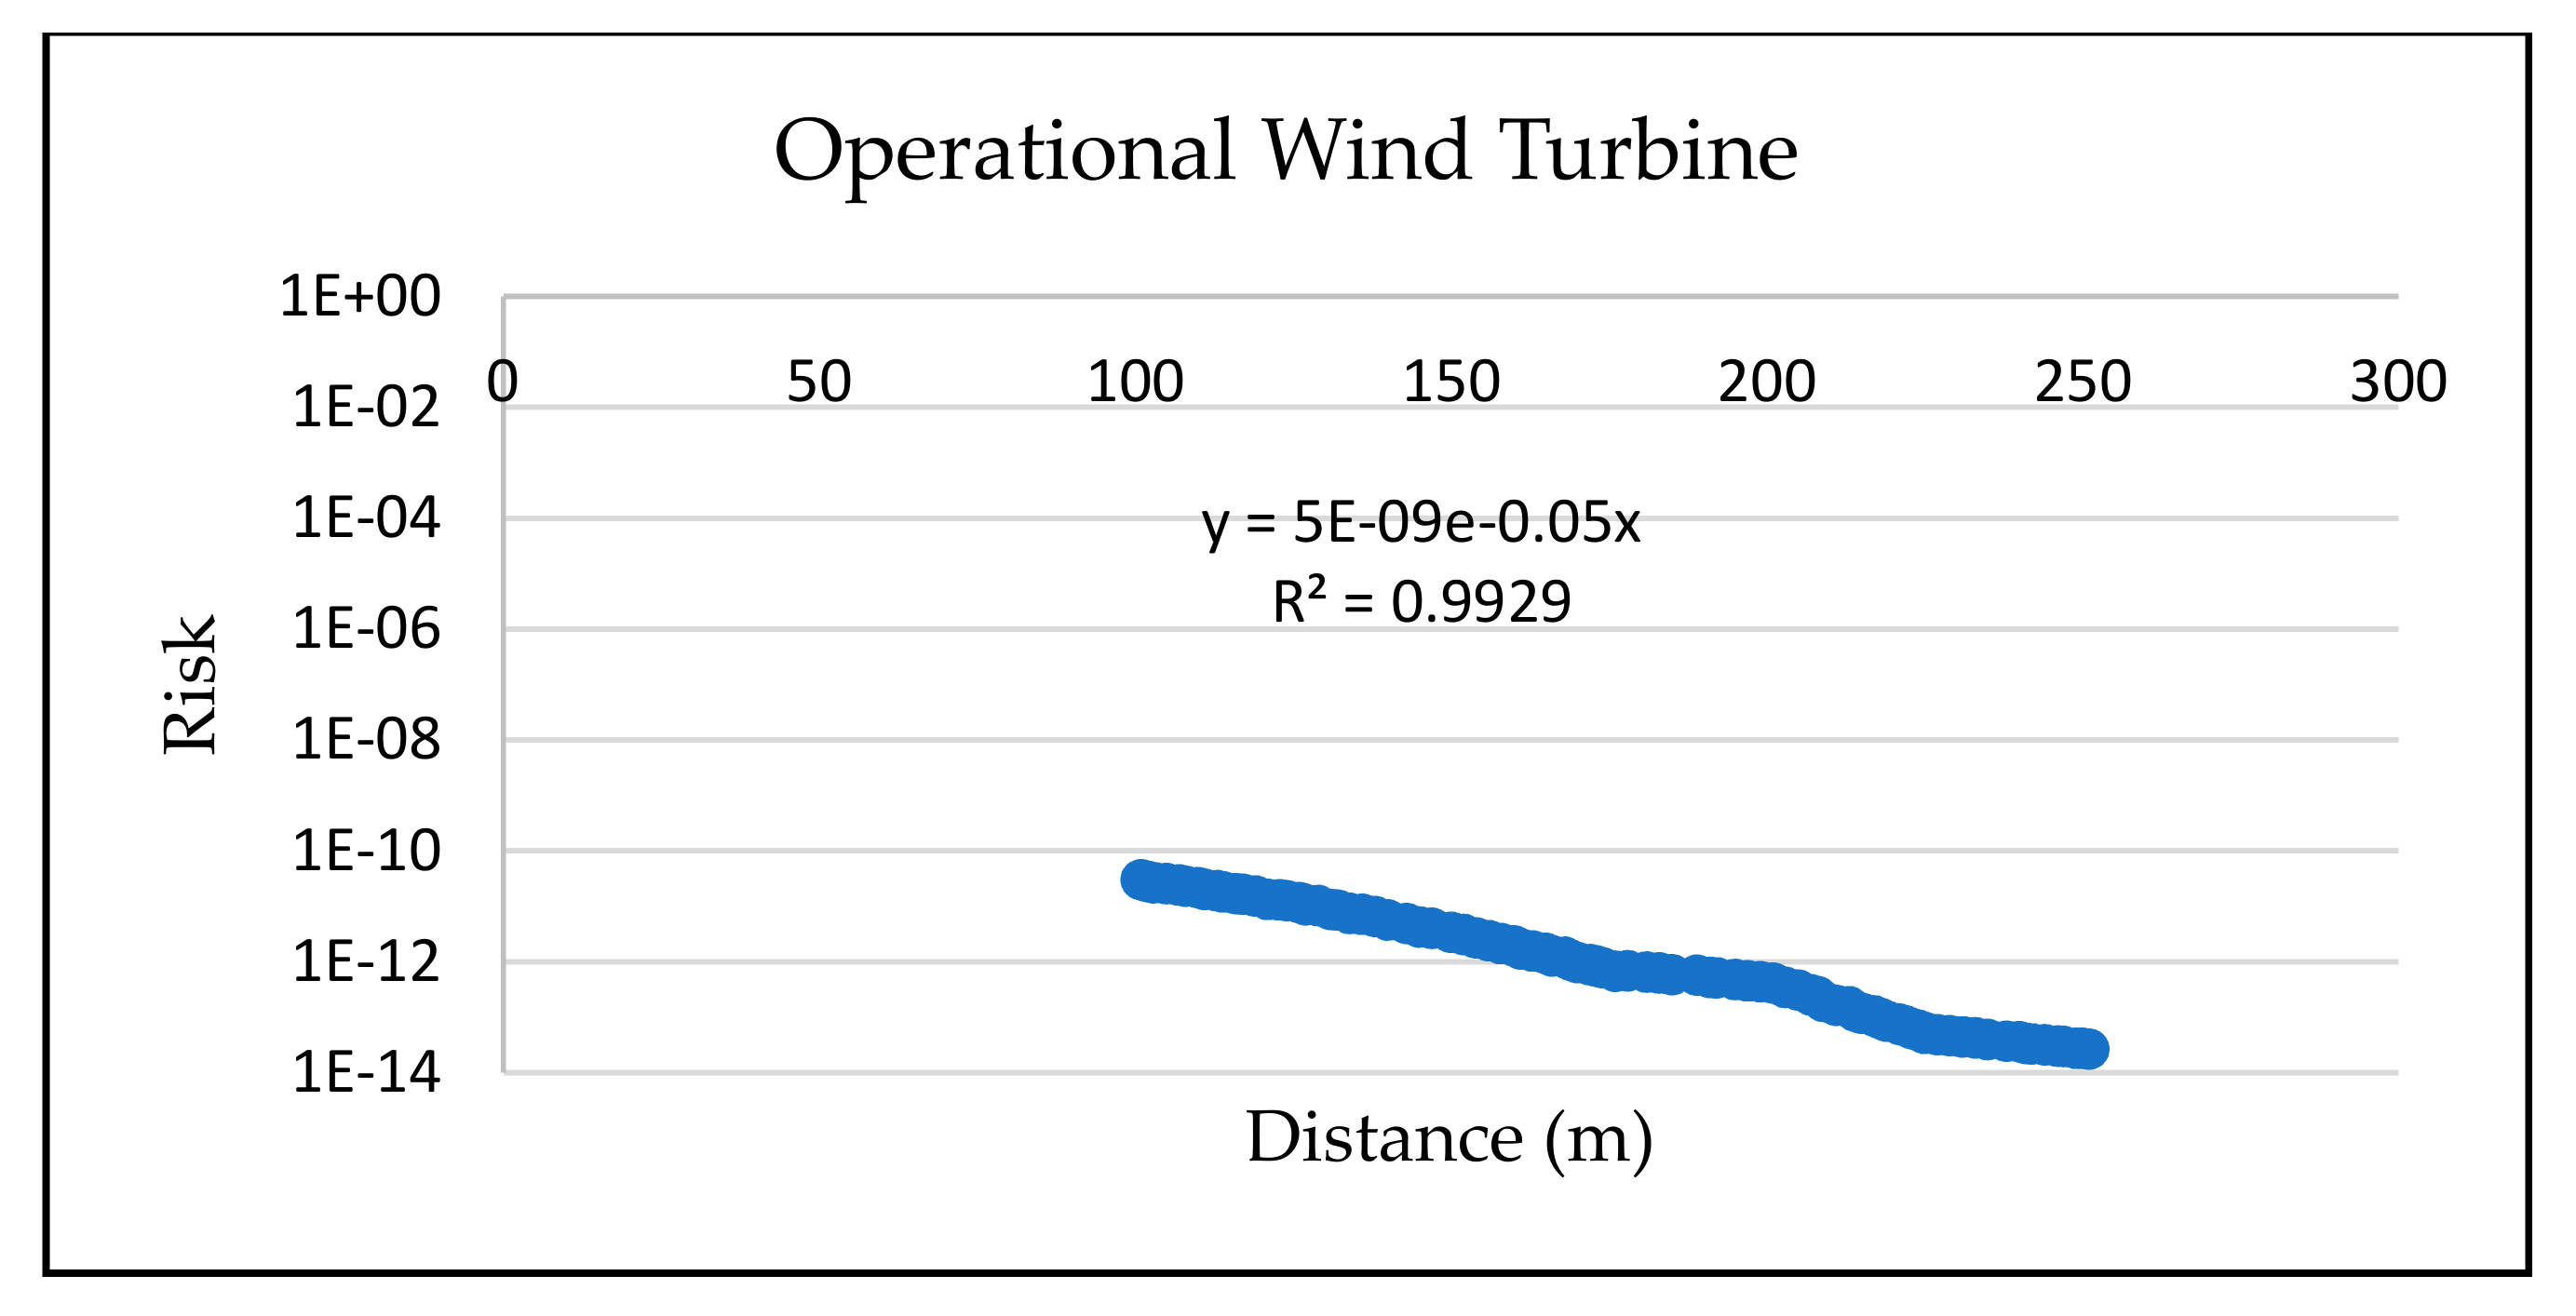
The risk, here introduced as the expected number of persons,
, per year per kilometer that will be killed by a wind turbine, is estimated by
where it is conservatively assumed that the probability of being killed when an ice piece or blade part hits a vehicle is
= 1.
A similar equation is presented by [
25] for the last scenario.
Figure 3 shows
for ice throw from an operational wind turbine as a function of distance (
d) to a road (in m) with the tower height of 100 m and the total height of 150 m. Approximately,
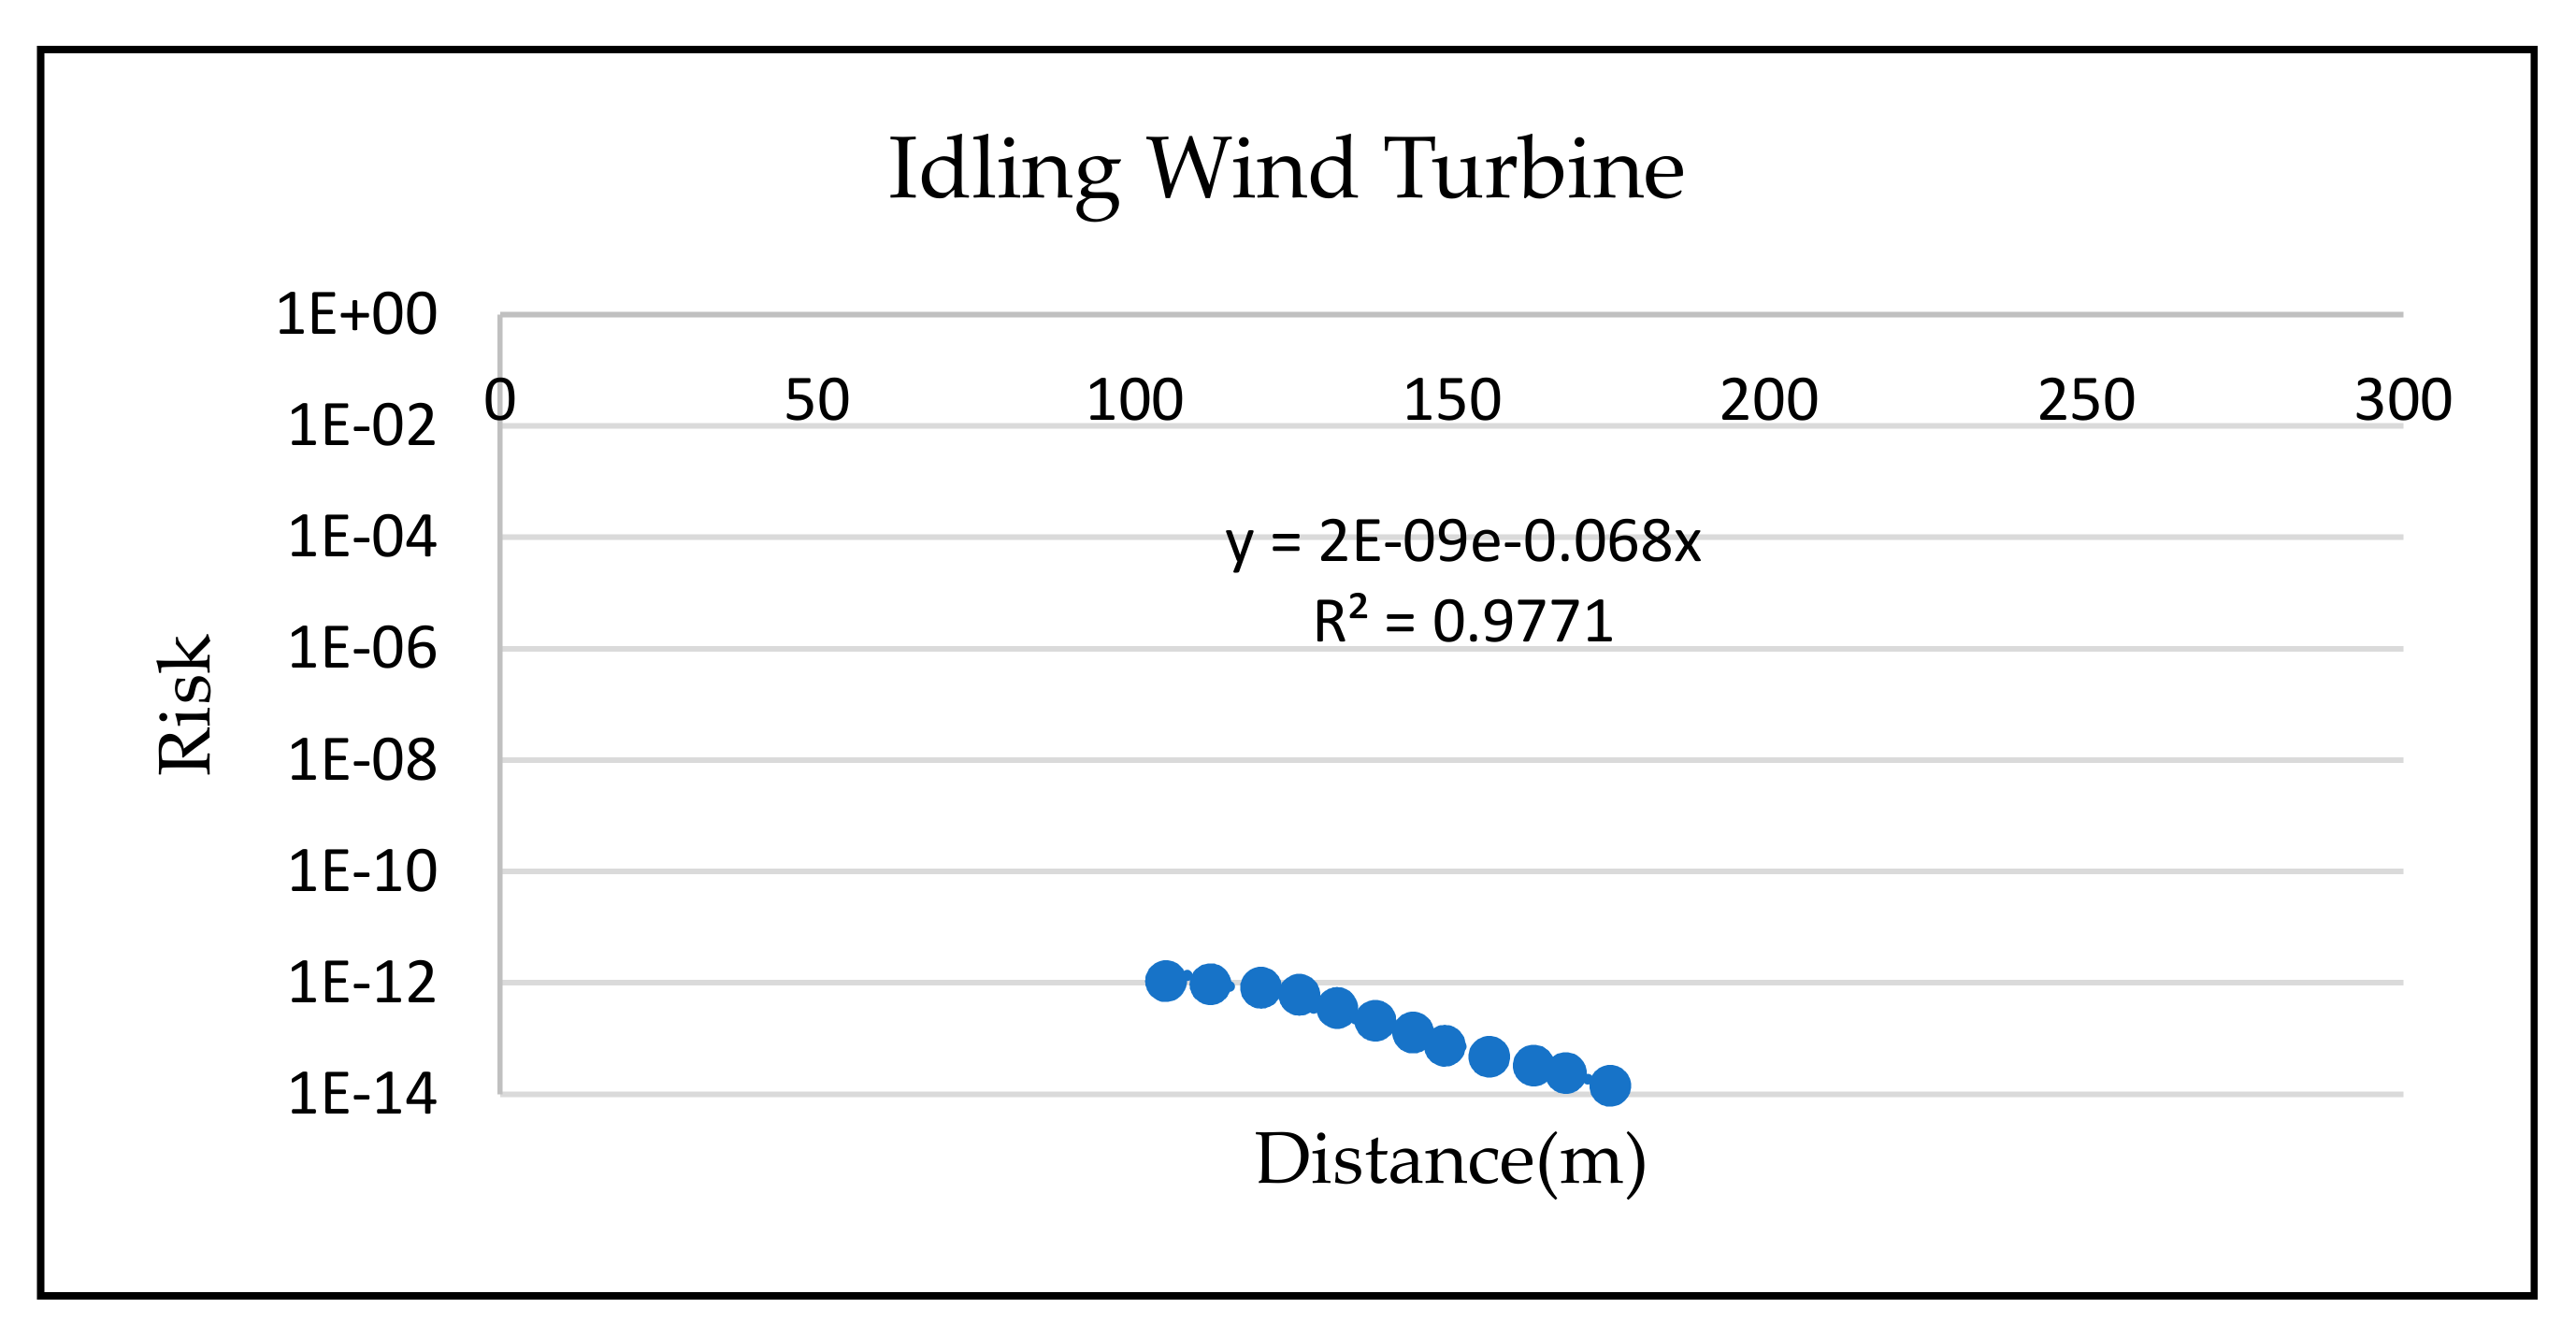
Figure 4 illustrates
for an idling (parked) wind turbine as a function of distance (
d) to a road (in m) with a tower height of 100 m and a total height of 150 m. Approximately
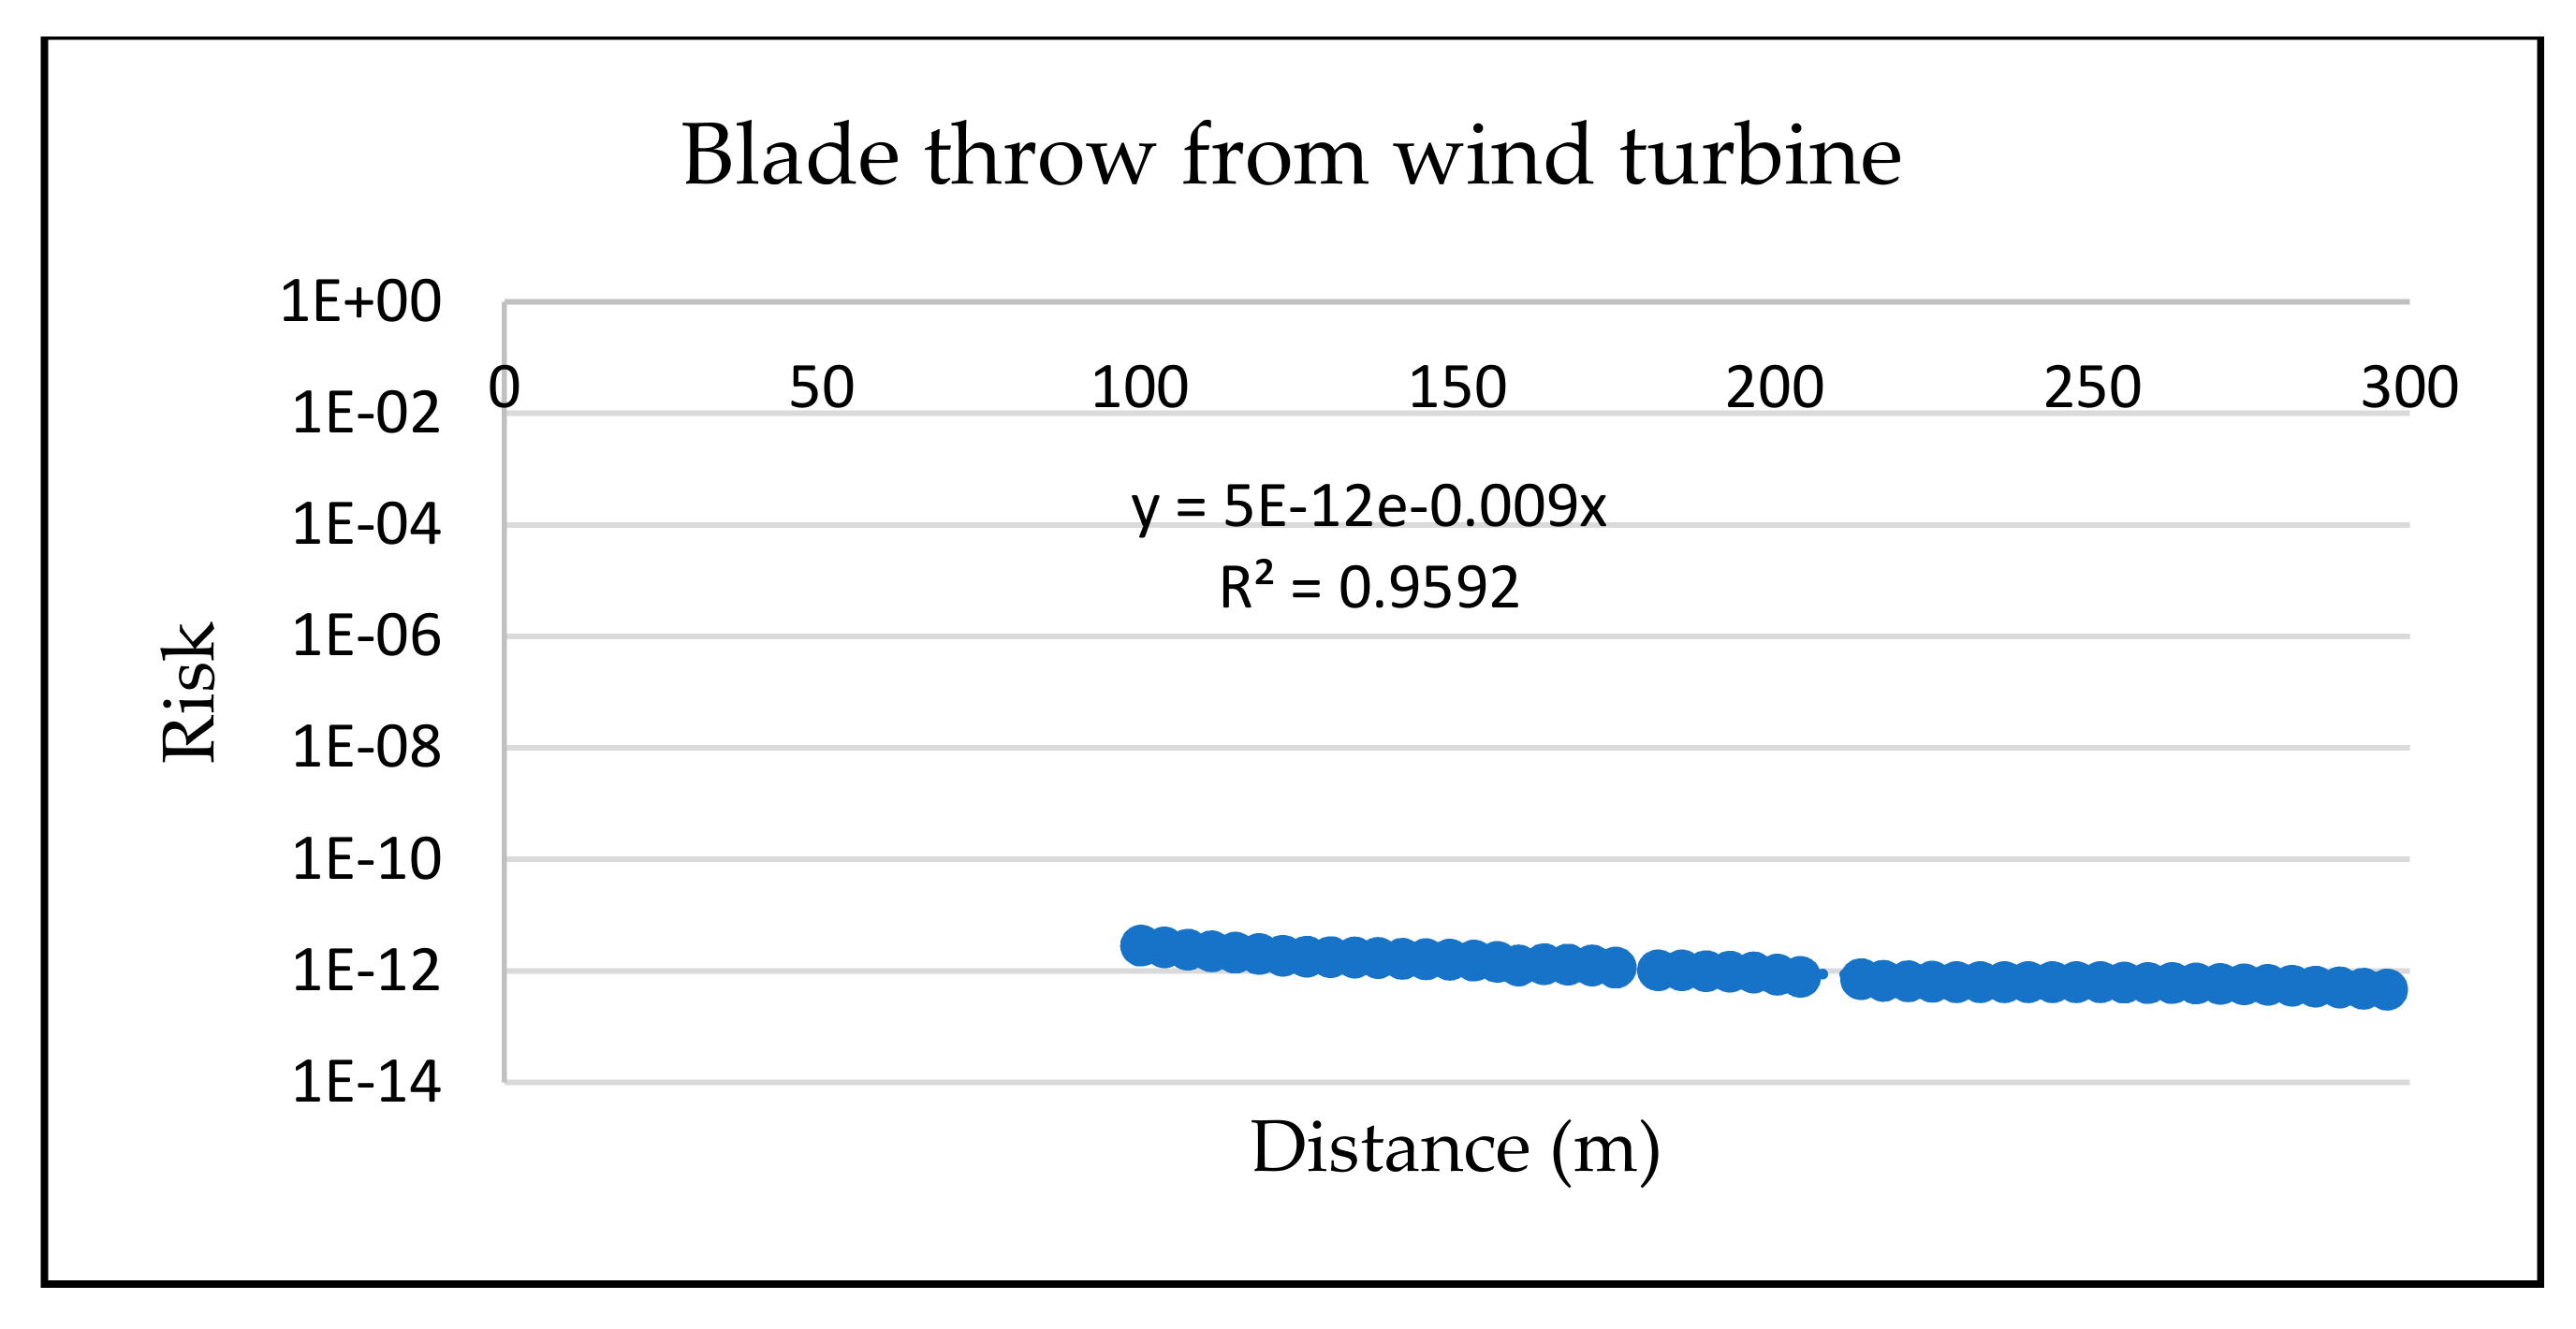
Figure 5 shows
due to total or partial failure/collapse of a wind turbine as a function of distance (
d) to a road (in m), with a tower height of 100 m and a total height of 150 m. Approximately
Based on these probabilistic models, the next section presents the basis for decision making and for estimating the Value of Action (VoA). The decision problem that will be considered is whether a heating system should be implemented, assuming that an ice detection system has already been established. This is done for different distances between the road and the row of wind turbines, and can be used as a basis for determining the acceptable distance to the highway using an ice detection system, and next, whether a heating system should be installed.
5. Value of Action Analysis
The concept of Value of Action (VoA) was introduced by Thöns and Kapoor, see [
27,
28], and constitutes a further development of the Value of Information (VoI) analysis from Raiffa and Schlaifer in [
29] and its application in engineering, see e.g., [
30,
31,
32,
33]. The VoI is defined as the expected utilities gained by obtained (conditional) or predicted (expected) information, including their costs and consequences, while the VoA is different in that the expected utility is gained only on the basis of predicted or implemented actions. The quantification of VoA can be calculated as the difference between the expected utilities of the predicted action and a system state analysis. Based on quantification of VoA, it is possible to provide a decision basis as to whether to implement an action or not. To figure out whether it is beneficial to install the heating systems on the wind turbine blades following the risk assessment results above, a VoA analysis was carried out.
As discussed above, when it is planned to locate a wind turbine location near to highways, one of the interests from owners’ perspectives is in reducing risk owing to falling parts from wind turbines in the event of total or partial damage, and from ice thrown from the wind turbines in the case of icing, as shown in
Figure 6. The general objective is to ensure normal and steady energy generation, which can be achieved with additional investments in SHM techniques, such as implementing an ice detection system and a blade heating system. Initial investments in SHM techniques can increase the cost of the wind turbine. However, the shutdown of the wind turbine will result in loss of energy production, thus reducing the income of the owner or reputation loss. The major constraints regarding wind turbines close to highways are that falling parts from wind turbines may lead to a traffic accident, damage to cars, and even to the injury or fatality of people. To minimize the overall cost of wind turbine management, it is essential to decide whether to implement an ice detection system, and when to turn on the blade heating system.
A situation is considered in which the risks due to parts being thrown from failed/collapsed wind turbine blades are assumed to be difficult to reduce; therefore, only the reduction of risk due to icing can be reduced. It is assumed that an ice detection system has already been installed. The question is: is it worthwhile installing a heating system in the blades? When ice is detected, should the wind turbine be shut down directly, or should the ice heating system be turned on? The application of the value of action analysis with regard to the installation of heating systems in wind turbine blades in cases where an ice detection system has already been installed aims at answering the question as to whether it is of value putting a heating system on the blades.
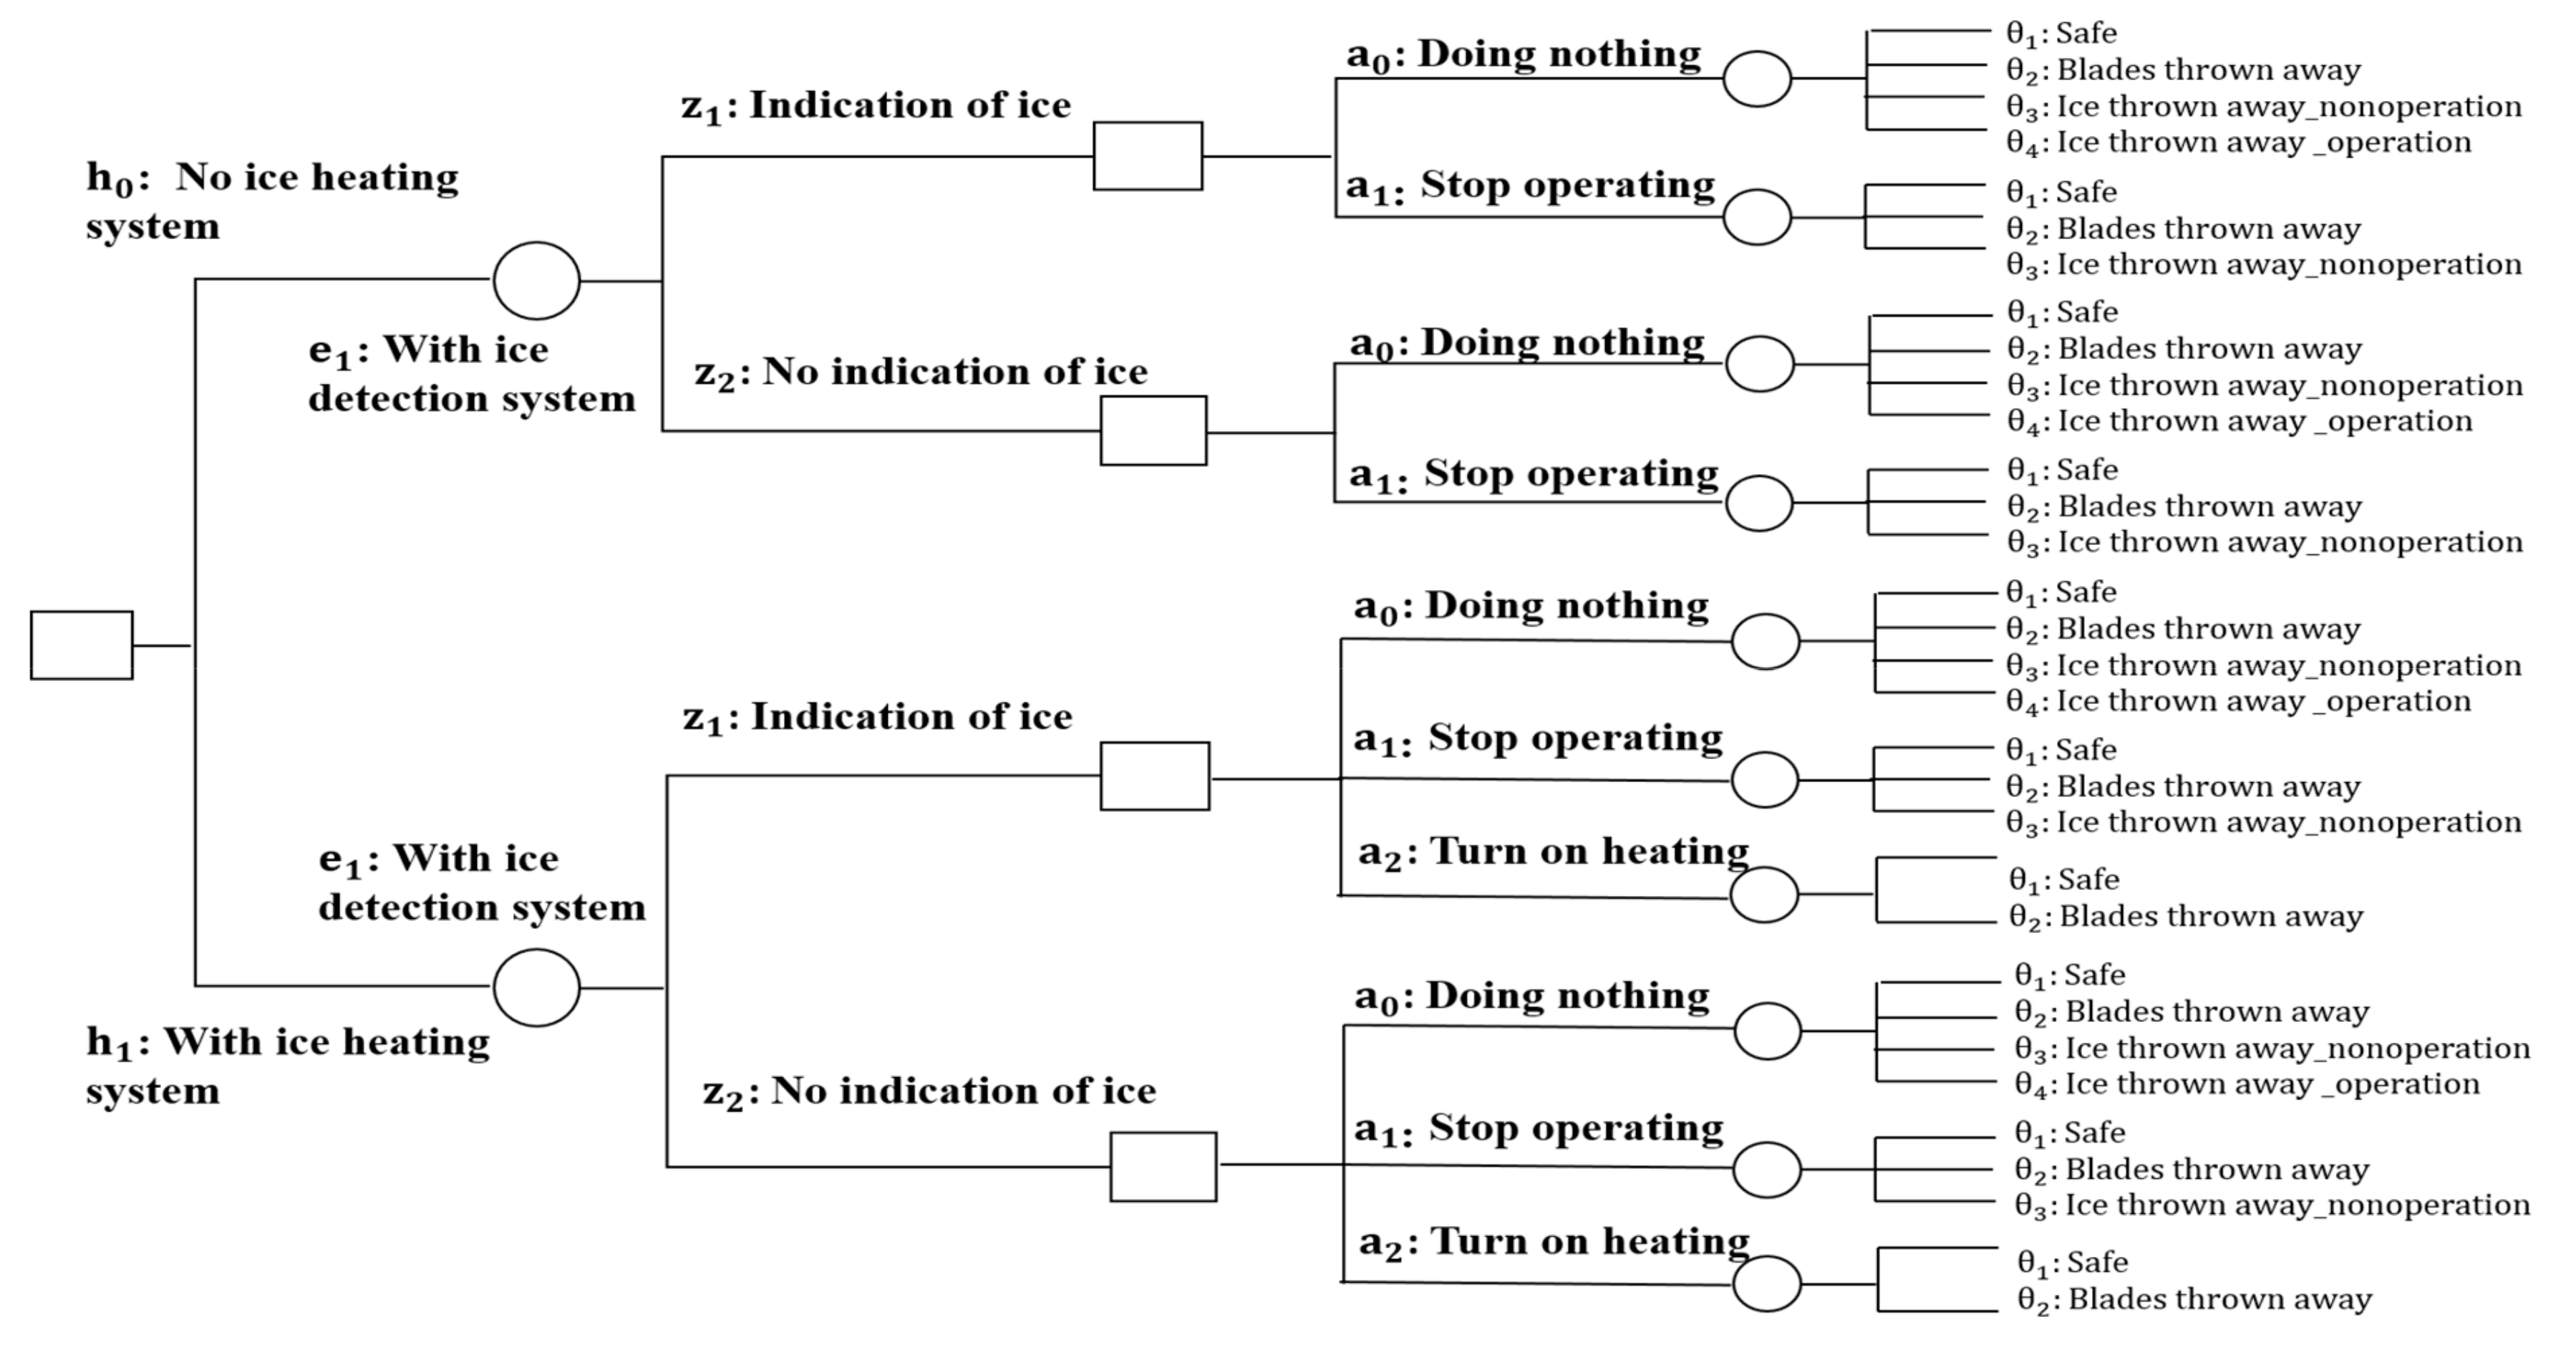
The illustration of the full decision tree is shown in
Figure 7. The decision choice is
, no heating system, or
, with the heating system. By installing the heating, there would be a heating system cost
. The decision choice of action will be
, do nothing,
, stop operating, and
, turn on the heating system; moreover, if operation stops, there will be a production loss
. Given the monitoring strategy
, with ice detection system, data of the ice mass will be collected, and when the mass of ice is over a certain threshold, a warning will be given. Two monitoring outcomes will be provided:
, indicating ice, and
, not indicating ice. For different choices of actions based on the monitoring outcomes, the wind turbine could be under different states; for example,
, safe state,
, at risk of blades being thrown away,
, at risk of ice being thrown away when the wind turbine is non-operational, and
, at risk of ice being thrown away when the wind turbine is operating. The owners’ decisions with respect to actions regarding the wind turbine are based on the indication of ice detection, and the consequences, benefits, and costs. The consequences of parts falling from wind turbines may include traffic accidents, damage of cars, and even the injury or fatality of people,
. The most important consequences related to whether a heating system is used or not are those which affect the risk of a person in a vehicle potentially being killed due to falling parts or ice pieces from a wind turbine. If a heating system has not been installed, downtimes can last several days or even weeks due to persistent ice on the blades [
34]. Therefore, the production loss
can range from hundreds to thousands of Euro. If a heating system is installed, the wind turbine can continue working with benefits
per year.
It is assumed that the ice detection system provides precise and accurate information. Therefore, if equipped with an ice heating system, when ice is detected, the choice of action could be to
, turn on the heating system. The wind turbine will continue working when the heating system is turned on, but there will be a cost for installation of the heating system
. The ice will melt after turning on the heating system, and the only risk left in this case will be the risk of blades being thrown away
. If no ice heating system has been installed, when ice is detected, the choice of action could be
, stop operating; there will be a production loss during the downtime, but the risk of ice being thrown away under operation condition
will be reduced. However, there is still the risk of ice being thrown away under no operation condition
, as well as the risk of blades being thrown away
. If the ice detection system did not indicate ice, whether a heating system has been installed or not, the choice of action will be
, do nothing. An illustration of the choice of decision action scenario for wind turbines in icing events close to highways is shown in
Figure 8.
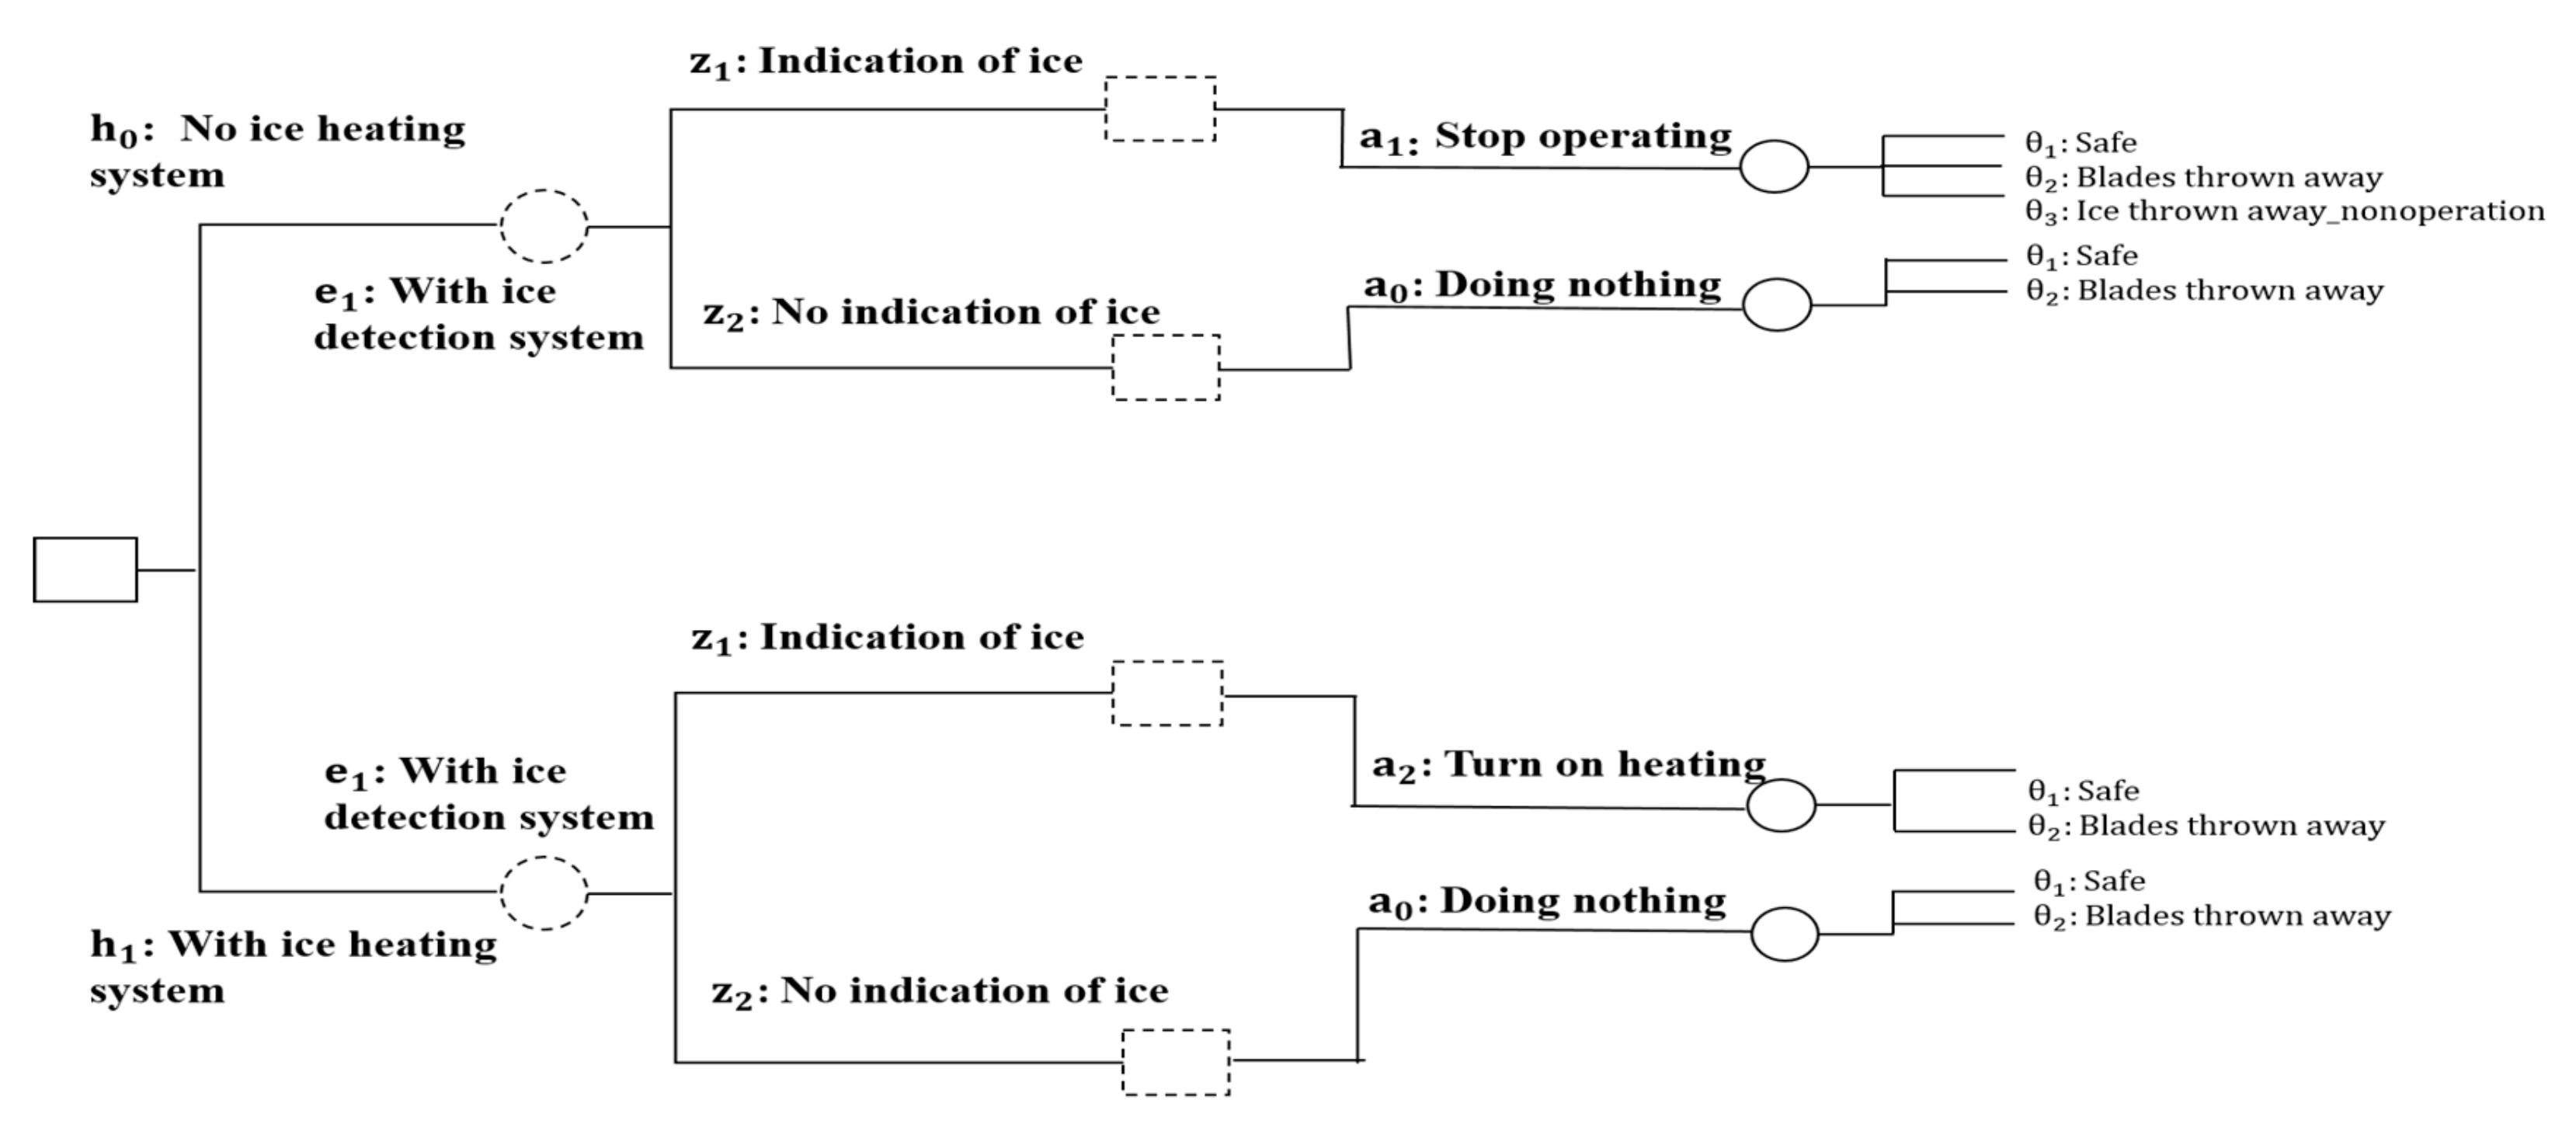
Following the choice of decision scenario in
Figure 9, when the ice detection system detects the ice, the choice of action when there is no ice heating system will be to stop operating, which leads to a utility
. The choice of action if the ice heating system is installed will be to turn on the heating, which results a utility
; the value of installing the heating system will be calculated as:
It is assumed that when the ice heating system is turned on, the ice will melt, and if the ice is thrown away, the risks under both operation and non-operation will be significantly reduced, leaving only the risk of blades thrown away
remaining, so that, considering the service life
, the cost of the heating system
, the cost of possible fatality
and the benefits of production
, the spacing between wind turbines placed along a highway
, and discounting factor
, the utility of the heating system
can be obtained by adding the contributions from each year
:
Here, the ratio of downtime per year in which the wind turbine will be stopped . for blade repair if blade has been thrown away is assumed.
When there is no ice heating system, and the wind turbine stops operating, given the ice detection warning, the risk of consequences of ice being thrown away under operation will be reduced, and the remaining risk will be of ice being thrown away under non-operation
and the risk of blades being thrown away
. Considering the production loss
. during this period, the number of icings per year
, and the ratio of down time per year due to icing
, the utility of stop operation
will be:
The estimate of the benefits of production
per year is based on [
35]:
where
is the rated power of the machine MW,
is the turbine availability factor,
is the capacity factor,
is the sales price of electricity kW/h and
is the feed-in-tariff.
6. Case Study—Value of Action Analysis
The summary of the probability (per km) that a car will be hit by ice or a blade thrown away, as well as the costs and benefits analysis parameters, are shown in
Table 1 and
Table 2, respectively.
Table 2 is from [
35]; the power of the wind turbine is 3.6 MW, a capacity factor of 0.45 is assumed, turbine availability factor is 0.95, feed-in-tariff is €0.12/kWh, with a rough electricity price of €0.3/kWh, so that there will be 5.66
. Euro per year of production benefit. The total costs of the wind turbine
is €2
. The discounting factor
is 0.05. The cost of heating
is assumed to be on the order of 5% of the total costs of the wind turbine, considering the equipment costs, installation costs and energy consumption costs [
34], which are assumed to be
Euro. The fatality costs of 1.5 person in a vehicle being killed are assumed to be
. Euro, based on [
36].
Following Equations (8)–(12) and
Table 1 and
Table 2, the computational results of VoA are shown in
Figure 10. When VoA < 0, it means that it is not worthwhile installing the heating system. When VoA > 0, it is recommended that the heating system be installed. Based on
Figure 9a, the VoA will increase with the increase in downtime, which means that it will be more beneficial to install the heating system if the downtime due to icing on the blades is longer. However, the impact of the distance of the wind turbine from a highway
d is comparably small, which can be explained by the low variation of risk model independence of distance in
Section 5. The critical downtime in the case study when VoA = 0 is at
. 30 days, as shown in
Figure 9b. Therefore, if the down time due to ice on the blades is less than 30 days, it is beneficial to just shut down the wind turbine instead of installing a heating system. If the downtime is longer than 30 days, it is worthwhile installing the ice heating system on the blades.
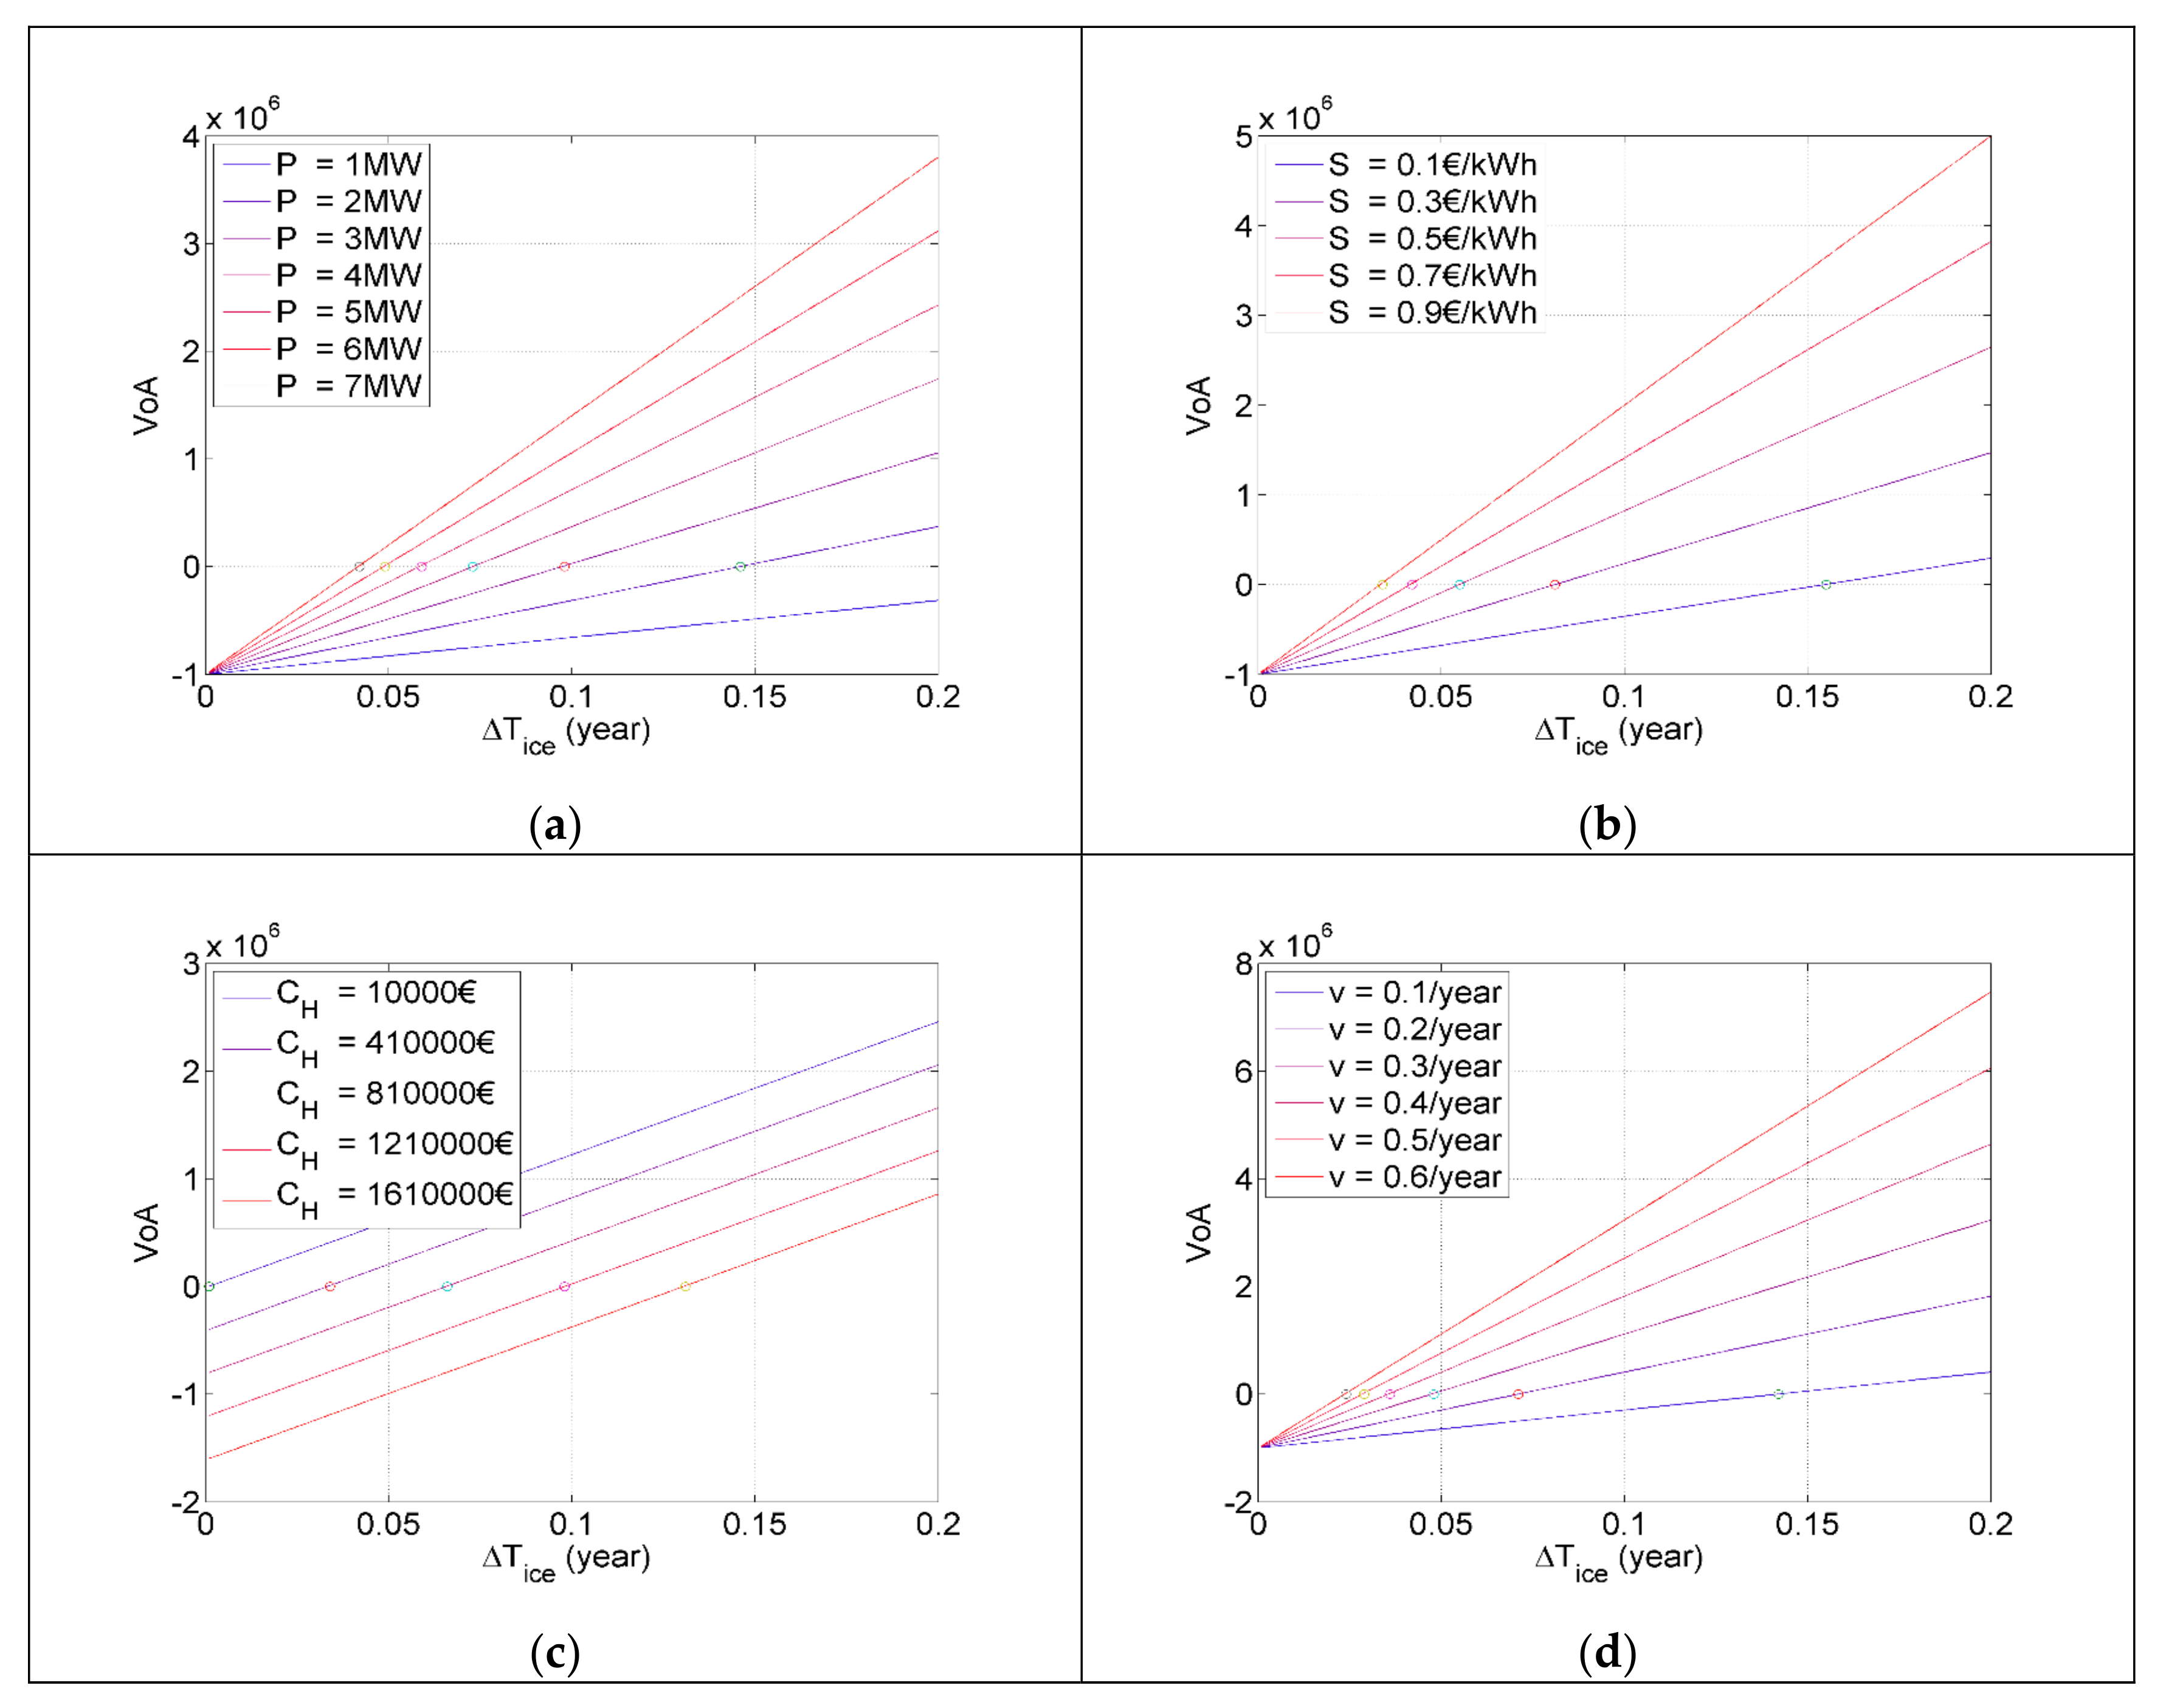
To investigate how the model factors, for example, the power of the wind turbine
, the electricity price
, the cost of the heating system
, the number of icings per year
, and the influence the choice of action, a parametric analysis is carried out. The results are shown in
Figure 10. If the down time is the same, based on
Figure 10a, the higher the power of wind turbine
is, the higher the VoA will be, which means that it will be more beneficial to install a heating system on larger wind turbines. The same trend goes for the electricity sales price
in
Figure 10b; it is more beneficial to install the heating system when the electricity sales price is high. This also applies to the number of icings per year,
, in
Figure 10c; it is more worthwhile installing a heating system when icing per year is greater. Meanwhile, in
Figure 10d, the higher the cost of the heating system,
, is, the smaller the benefit of VoA will be.
7. Conclusions
A probabilistic model and a risk assessment model are described for the assessing the consequences related to icing and the associated risk of ice pieces being thrown away from a wind turbine and potentially hitting a vehicle on a road near the wind turbine. In addition, the risk from blades and parts of blades being thrown away from a wind turbine in case of blade failures also needs to be accounted in the risk assessment. This paper considers the application of Bayesian decision analysis for decision-making with respect to the installation of heating systems in wind turbine blades in cases where ice detection systems have already been installed in order to allow wind turbines to be placed close to highways.
Furthermore, the application of Value of Action (VoA) is presented for the decision problem related to installation of a heating system in situations where an ice detection system is already available. Decision trees for the VoA are developed, together with the corresponding utility functions, making it possible to quantify whether it is valuable to put a heating system on the blades in addition to the ice detection systems. This is especially interesting in countries with limited space for placing wind turbines. The model makes it possible to investigate, e.g., whether higher power production can be obtained with less downtime when a heating system is installed.
An illustrative case study is considered, presenting the details of the risk modelling and the Value of Action. Risk is calculated as a function of distance from the wind turbines to the highways. The risk owing to ice throw in operation mode is slightly higher than in the parked position. The spacing between the wind turbines and the height of them did not have a major impact.
The case study with regard to quantification of the Value of Action on wind turbines close to highways with respect to icing events provides a general decision basis for deciding whether or not to install ice heating systems given the condition that ice detection systems have already been installed. The results show that the decision result is highly dependent on the duration of downtime due to ice on the blades.


