An Assessment of Wind Energy Potential in the Caspian Sea


Department of Mechanical Engineering, Faculty of Engineering, Dunarea de Jos University of Galati, 47 Domneasca Street, 800008 Galati, Romania
*
Author to whom correspondence should be addressed.
Energies 2019, 12(13), 2525; https://doi.org/10.3390/en12132525
Submission received: 10 June 2019
/
Revised: 25 June 2019
/
Accepted: 25 June 2019
/
Published: 1 July 2019
(This article belongs to the Special Issue Renewable Energy in Marine Environment)
Abstract
:At this time, there are plans to develop offshore wind projects in the Caspian Sea. The aim of the present work was to estimate the possible benefits coming from such a project. As a first step, the wind profile of this region was established by considering reanalysis data coming from the ERA-Interim project, the time interval covered being between January 1999 and December 2018. According to these results, significant resources have been noticed in the northern part where the wind speed frequently reached 8 m/s, being identified also as a hot-spot south of Olya site. In the second part, the performances of some offshore wind turbines were established. These were defined by rated capacities ranging from 3 MW to 8.8 MW. The downtime period of some generators can reach 90% in the central and southern sectors, while for the capacity factor, the authors expected a maximum of 33.07% for a turbine rated at 4.2 MW. From a financial point of view, the values of the levelized cost of energy (LCOE) indicated that the sites from the north and central parts of the Caspian Sea have been defined by an average LCOE of 0.25 USD/kWh. Thus, they can represent viable locations for wind farm projects.
1. Introduction
The wind energy market is a dynamic sector that is continuously expanding. Nevertheless, this evolution will finally reach saturation, taking into account that the range of suitable sites for such projects will reduce. As an alternative, one of the best locations to develop a wind project is near the coastal areas, which can easily support the development of either onshore and offshore projects. At this time, there is growing interest to develop systems capable of operating in deep water areas, the floating platforms being the most viable solution [1,2]. A significant percentage of the projects have operated in Europe (almost 409 projects), being estimated that in 2018, only 18 projects were added to the grid. Per total, the operating projects are defined by a capacity of 18.5 GW, this value being supported by 11 countries, such as UK, Germany, Denmark, Norway or Portugal, as being more relevant. One of the largest wind turbines connected at this moment is the Haliade 150-6 MW (Merkur project, Germany), with the mention that some other projects currently under construction may include systems defined by comparable capacity, or even higher [3].
Most of the research is focused on the coastal areas facing the ocean environment [4,5,6], since the wind resources are more consistent in such areas. During recent years, the enclosed sea basins were also considered for investigation [7,8,9]. More advanced progress is related to the Mediterranean Sea, where a pilot farm of 24.8 MW will be developed off the coast of Gruissan in the Aude region, France. It is expected that through four wind turbines, it is possible to generate approximately 100 million kWh/year, which should be enough to cover the annual electricity consumption of more than 50,000 inhabitants [10]. Other sources indicate that a 30 MW wind project will be installed in front of the Taranto Harbour, Puglia, Southern Italy, which will consider ten wind turbines produced by Senvion [11]. The French coastal area located in this region seems to present important wind resources, and the implementation of several floating projects is expected in the near future [12].
As for the Caspian Sea wind resources, there is some research focused in this aspect. In the research by Amirinia et al [13], the distribution of the wind and wave resources associated to the southern area was evaluated. By considering various databases (including in-situ measurements) and the characteristics of a 3 MW wind turbine, it was found that more promising results have been reported in the eastern part of this region. In Rusu and Onea [8], the wind and wave regime from this region were also assessed, and more energetic conditions in the centre and northern regions were observed, with an average wind speed of 6 m/s (at 80 m height). In addition, observations of the bathymetric map of the Caspian Sea highlight that the entire northern area is defined by a lower water depth, which is very suitable for the development of the wind projects. In Onea and Rusu [14], the performances of some wind turbines that may operate in the coastal areas of the Black and Caspian seas were discussed. The turbines were reported to an operating hub height of 80 m, while the power output of the particular systems were estimated using a Betz coefficient of 0.5. By applying these simplifications, it appears that the performances of some wind turbines have been overestimated, resulting in capacity factors of 70%, compared to the usual capacity factor values between 20 and 40%. An important aspect, which is highlighted in this work, is related to the diurnal and nocturnal fluctuations of the wind conditions. Kerimov et al [15] analysed the long term distribution of wind resources, also proposed some suitable sites, and evaluated the associated costs required to couple some wind generators to the electrical grid. According to these results, one of the best sites to implement an offshore wind project is located in the northern part of Absheron peninsula (Azerbaijan). Here, a suitable connection grid was also identified. Although, this region is an enclosed sea defined by moderate conditions, there is some research focused on the local wave resources that brings into discussion the viability of a commercial wave farm in this environment, especially considering hybrid wind-wave approaches [16,17,18].
On the other hand, it is well known that the Caspian Sea region is defined by important oil reserves and therefore, at this time, it seems that the interest for a renewable project is not very high [19]. Nevertheless, taking into account that there are problems with the oil pollution in this region [20,21], some changes are expected to occur. Thus, at this moment there are plans to develop a 200 MW offshore wind farm in the coastal areas of Azerbaijan, which will significantly increase the existing wind capacity (66.7 MW) of this country. It is estimated that the project will cost 392 million euro. This is one of the multiple wind parks proposed for this area, and more likely will be developed close to the capital, Baku [22,23].
In this context, the objective of the present work is to provide a more complete picture of the wind resources in the Caspian Sea in order to identify some suitable sites for the development of a wind project, and also to establish the performances of some state-of-the-art wind turbines that may operate in the vicinity of some major cities from this region.
2. Materials and Methods
2.1. The Target Area
Figure 1 presents a first perspective of the Caspian Sea. Thus, Figure 1a,b presented the distribution of the water depth, in general, and for the reference sites considered for evaluation. Regarding the northern sector, this is defined by lower water depths that do not exceed 50 m, compared to the southern side, where the water depth values easily reach 500 m, and even higher, if the Nowshahr site as a reference is considered. Several distances from the shoreline are taken into account (5 km, 25 km and 50 km) in order to identify the variations from the nearshore to offshore. Furthermore, in Table 1 the characteristics of the sites located near the shore are presented. A total of 10 reference sites are considered for evaluation, the main selection criteria being related to the fact that they are important port cities capable of easily offering the infrastructure and technical support for the development of a wind project. The sites located at 5 km, are defined by lower water depths (<50 m), but going towards the 50 km limit, these values significantly increase. This is the case of the Iranian sites of Babolsar, Nowshahr, Anzali and Astara, where the depths can easily exceed 400 m. The 50 km limit was not arbitrarily selected, and represents an acceptable threshold at which a renewable project can still be competitive [24].
The port of Baku is the capital of Azerbaijan and one of the largest cities in the Caucasus, this aspect being reflected by the number of its inhabitants (Figure 1c), of almost 2.5 million, being followed by the Makhachkala city with 0.6 million inhabitants and Atyrau with 0.24 million.
2.2. Wind Dataset
ERA-Interim Reanalysis Data
The ERA-Interim wind product has been considered for assessment, this being a project maintained by the European Center for Medium-Range Weather Forecasts (ECMWF). This global model covers the time interval from 1979 to the present, being defined by a temporal resolution of 6h per day (00-06-12-18 UTC). In the near future, this model may be replaced by the ERA5 product defined by 1h resolution and some others significant improvements [27,28]. For the present work, only the data covering the 20-year time interval from January 1999 to December 2018 are used, considering a spatial resolution of 0.125° × 0.125° (the highest one). The U and V components of the wind speed are reported to a 10 m height above the sea level, and in this case, the wind speed is denoted as U10. Apart from the assessment of the wind energy potential, another objective of the present work is to estimate the performance of some offshore wind turbines, and therefore the U10 values need to be adjusted to the hub height of a particular system. This is indicated as [29,30]:
where, —wind speed at hub height, —initial wind speed (at 10 m), —roughness factor (calm sea surface −0.0002 m), and —reference heights.
2.3. Wind Turbines
Several offshore wind turbines are considered for evaluation, their characteristics being presented in Table 2. The rated power of the generators is in the range of 3–8.8 MW, with the systems rated below 6 MW currently in operation, compared to the others that are the next generation turbines and are being implemented at this moment. In general, the cut-in values are approximately 3–3.5 m/s. The system, Adwen AD 5-135, has a lower rated speed value of 11.4 m/s, which means that this turbine will reach his rated capacity quicker. Each turbine is defined by a particular hub height, some of them being specifically indicated by the manufacturers, but in most of the cases these are mentioned as site specific, being possible to develop in this way multiple scenarios. A minimum of 65 m corresponds to the system Vestas V90-3.0 MW, while a maximum value of 140 m corresponds to Vestas V164-8.0 MW.
The annual electricity production (AEP) indicator is frequently used to quantify the electricity output expected in a particular system. In the present work, the following expression was considered for this indicator [32]:
where, AEP—in MWh, T—average hours per year (8760 hr/year), —Weibull probability density function, —power curve of a turbine, cut-in and cut-out values of a turbine.
One way to estimate the overall performances of a particular system is through the capacity factor (Cf), that can be defined as [32]:
where: PE is the electric power expected to be generated and RP represents the rated power of the system.
3. Results
3.1. Verification of the Reanalysis Data
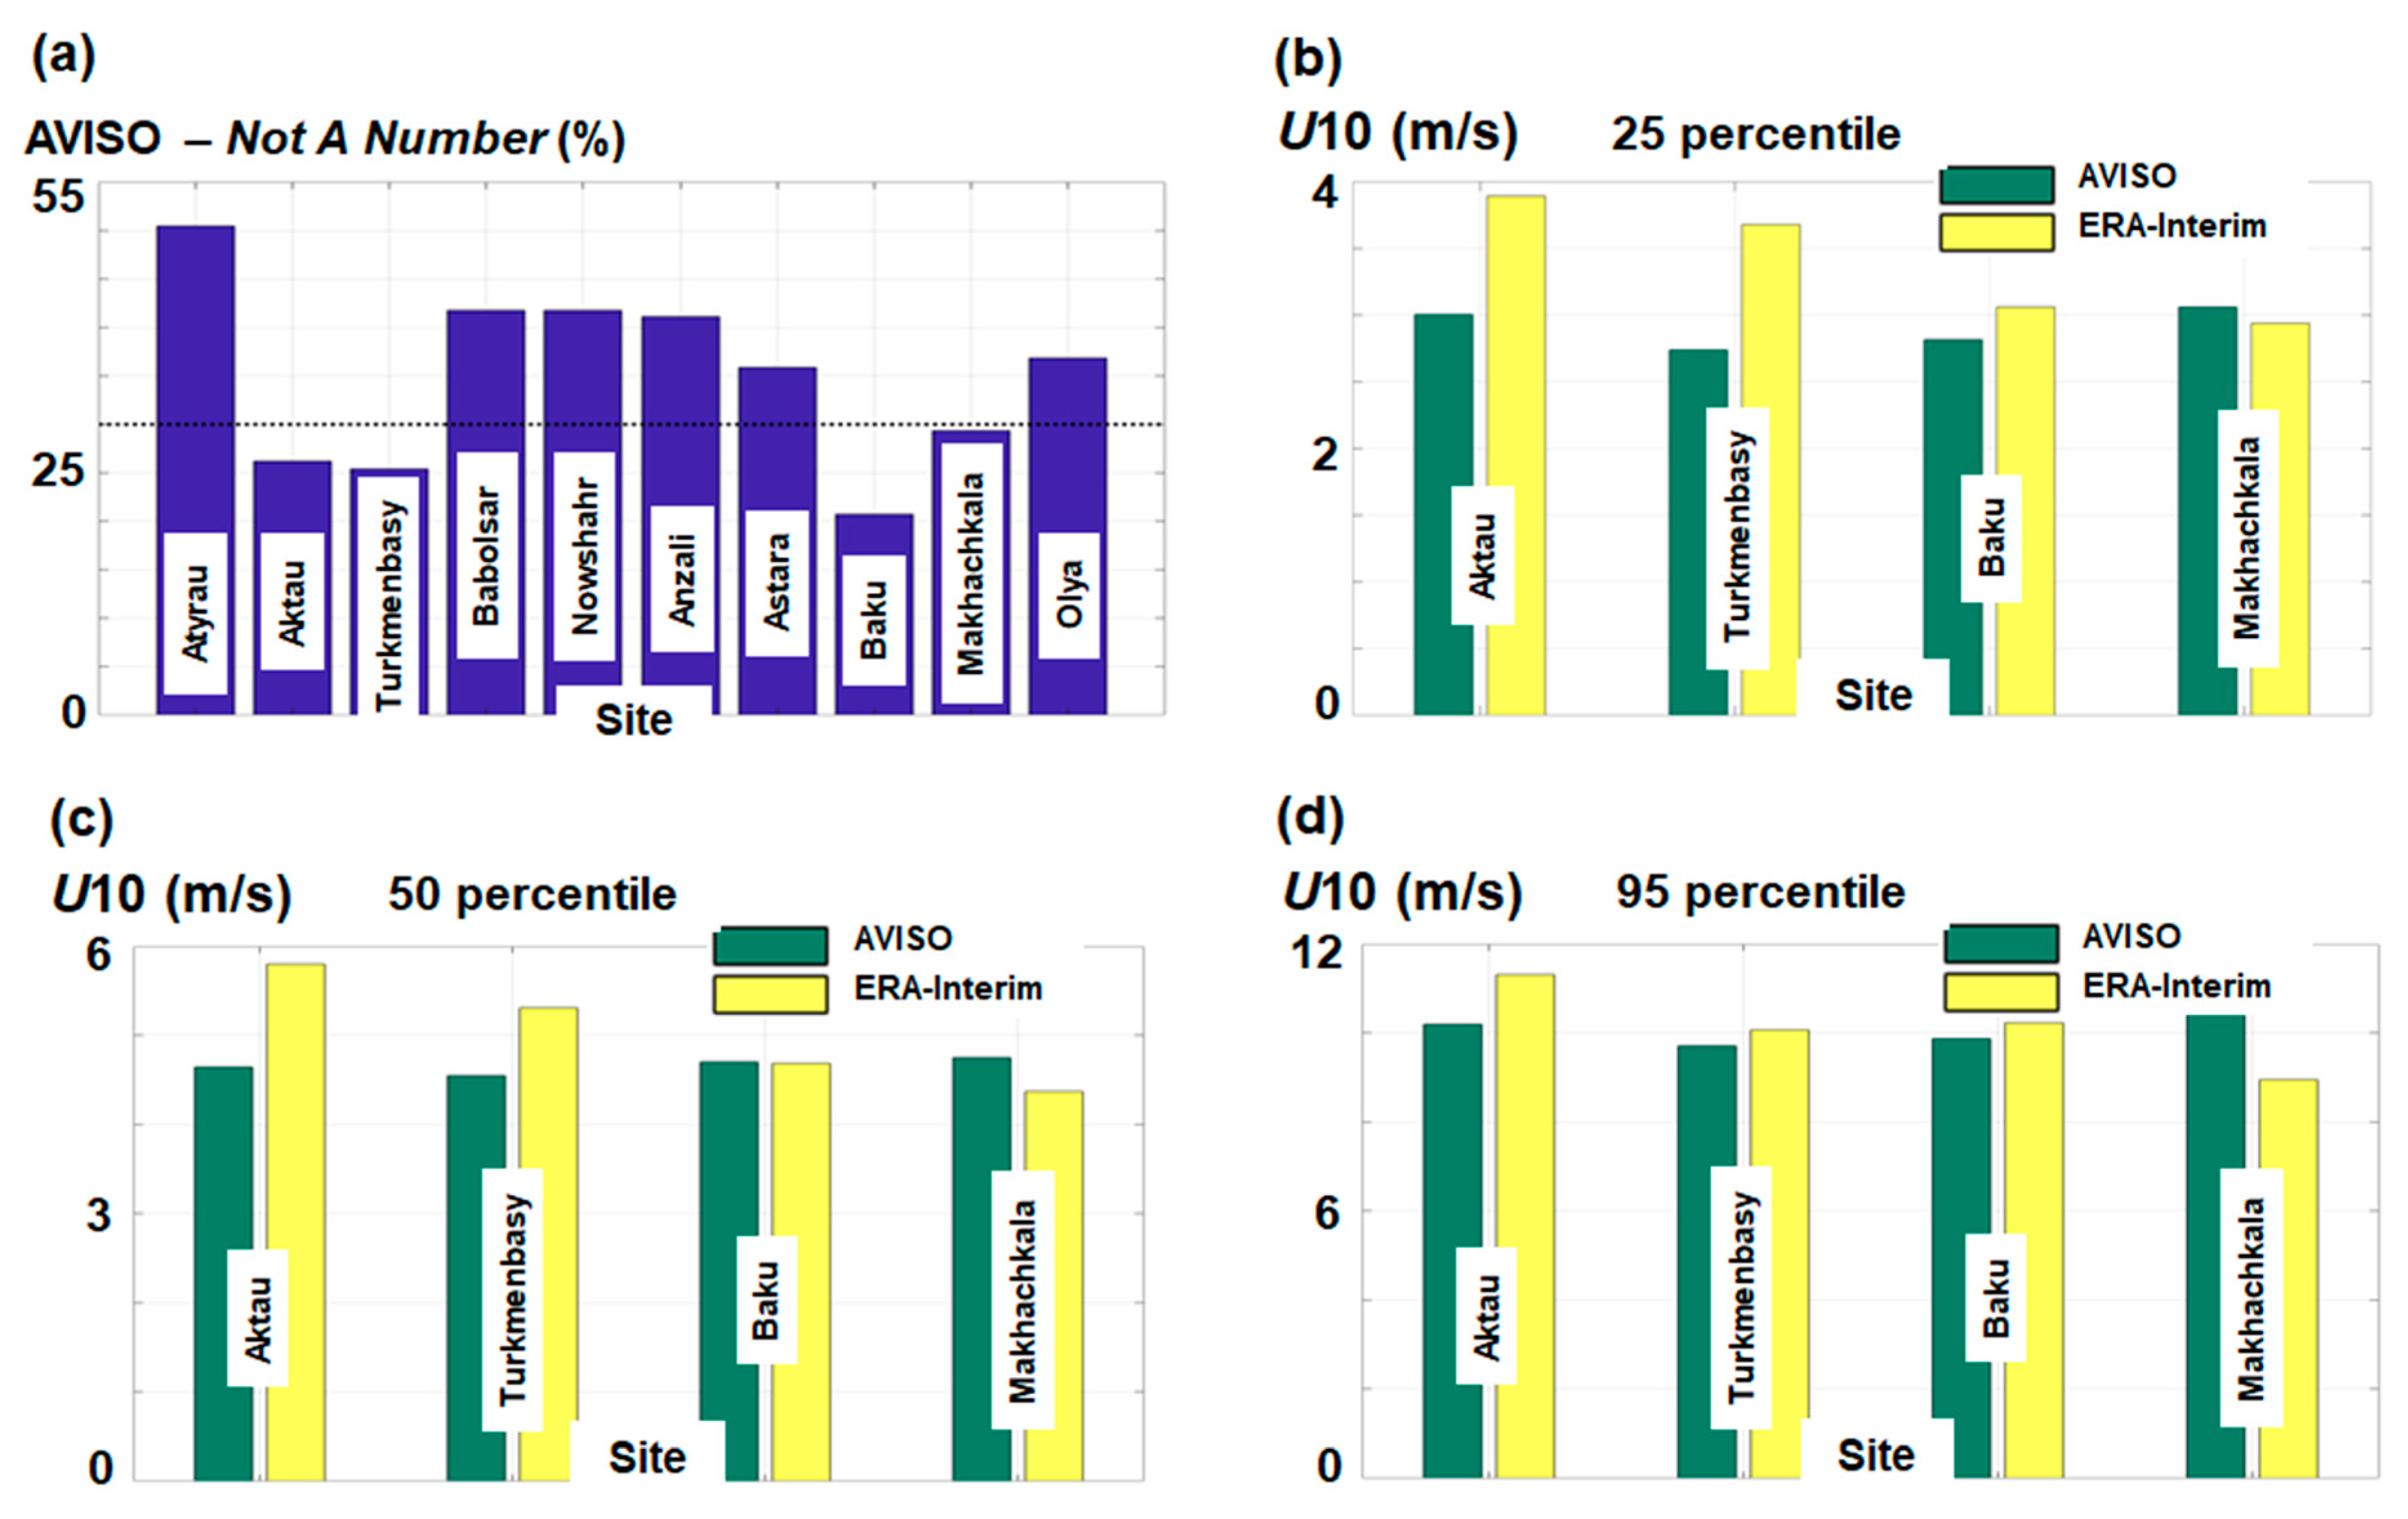
The ERA-Interim data were obtained through numerical simulations and therefore the accuracy of these data for this enclosed sea area need to be discussed. One way is to use the satellite measurements provided by the AVISO (Archiving, Validation and Interpretation of Satellite Oceanographic Data) project that include daily multi-mission measurements [33]. This dataset was defined by only one measurement per day (U10 values), and for the current work the values corresponding to the interval January 2010 and December 2017 were processed. Figure 2 presents a direct comparison between AVISO and ERA-Interim data, including a quality check of the satellite measurements. A common problem associated to the altimeter data, has been represented by the accuracy of these systems to measure the marine resources at the land-water interface. As can be seen from Figure 1a, a maximum of 50.46% corresponded to the site of Atyrau, compared to a minimum of 20.76% indicated for Baku, while a constant distribution of 41% was noticed close to the sites Babolsar, Nowshahr and Anzali, respectively.
In order to compare the two datasets, only the sites defined by much lower NaN (not a number) occurrences were considered for evaluation, and for this work, the ones chosen did not exceed 30% (indicated by dotted line). From the percentile analysis (25, 50 and 95), the ERA-Interim indicated higher values than the satellite measurements, this aspect being valid only for the sites Aktau, Türkmenbasy and Baku located in the eastern and southern sectors. The Aktau site was defined by more significant variations, and a difference of 0.9 m/s (25 percentile), 1.16 m/s (50 percentile) and 1.12 m/s (95 percentile) was observed. A reverse pattern corresponded to the Makhachkala site (west coast–north of Baku), where ERA-Interim slightly underestimated the wind resources, with a maximum difference of 1.62 m/s for the 95 percentile.
3.2. Analysis of the Wind Speed
A first perspective of the wind distribution is presented in Figure 3, including the full time distribution (denoted as the total time) and the four main seasons that include: spring (March-April-May), summer (June-July-August), autumn (September-October-November) and winter (December-January-February). Regardless the period taken into account, it is clear that the northern part of the Caspian Sea is defined by more important wind resources. For the total time, a maximum value of 8.5 m/s was noticed in the southern regions of Olya site (north-west), and on an axis that crosses the northern area of this basin. The values significantly decreased towards the centre of this target area, the eastern part being defined by more important resources that can reach 6 m/s. The areas located in the centre-west and south seem to be defined by hot-spot regions where the wind conditions frequently indicated values of approximately 2 m/s, which meant that they are not very attractive for a wind project.
During the springtime, the spatial distribution was similar to the total time, where the maximum values can increase to 8 m/s. As for the summer season, moderate conditions were noticed and the hot-spot area located near the Olya site was identified, where the wind speed reached a maximum value of 7.3 m/s. For the rest of the regions, the conditions decreased below 6 m/s, with a significant percentage of the southern part did not exceed 4 m/s. During autumn and winter, the wind strength significantly increased, and more frequent wind speeds of 9 m/s were observed.
Figure 4 presents a slightly better representation of the seasonal variations, where the average values corresponding to each season are reported to the total time distribution. Various patterns were noticed. During spring, in the north, wind conditions increased approximately 10% and a decrease of the resources to almost 20% was observed close to the Absheron Peninsula (Baku site). During summer, the entire region indicated a decrease of the values to almost 30%. There is a hot spot close to the Babolsar site (south-east) where the wind speed may increase to 30%. During autumn, a wind farm located close to the Absheron Peninsula may have indicated better performances with an expected increase of the wind speed to almost 20%. The northern and centre regions indicated, in general, a slight increase of the values that may reach a maximum of 10%. During winter, the wind conditions presented a constant increase in intensity (≈15%), and in some sites, the balance was close to zero. In this case, the eastern area of Babolsar indicated a 15% decrease of the values.
In Figure 5a, the evolution of the U80 parameter is presented for the reference sites indicated in Table 1. The average values (dotted line) reported to all the sites were approximately 5.2 m/s, and above this threshold, this study found: Atyrau (7.12 m/s), Olya (6.96 m/s), Aktau (6.68 m/s), Turkmenbasy (6.36 m/s) and Baku (5.87 m/s). A minimum wind speed value of 3.12 m/s corresponded to the site Anzali (south-west).
The variation of the wind speed between various distances from the shoreline (5 km-25 km-50 km) is presented in Figure 5b. In general, the sites defined by important wind resources have not indicated important variations, this being the case of Atyrau, Baku or Olya. This suggests that a wind project located close to the shoreline will be a suitable solution. For the Turkmenbasy site, it was observed that the wind speed at 50 km offshore was lower than the one at 25 km, the differences being approximately 2.61%. It is clear that, in general, the wind speed increased heading towards offshore, this being the situation of Babolsar (25 km—6.2%; 50 km—11.62%), Anzali (10.1%; 24.79%) or Makhachkala (14.27%; 27.67%). In this case, the site Makhachkala (50 km) with 6.1 m/s exceeded the value of 6 m/s, which corresponded to the Baku site.
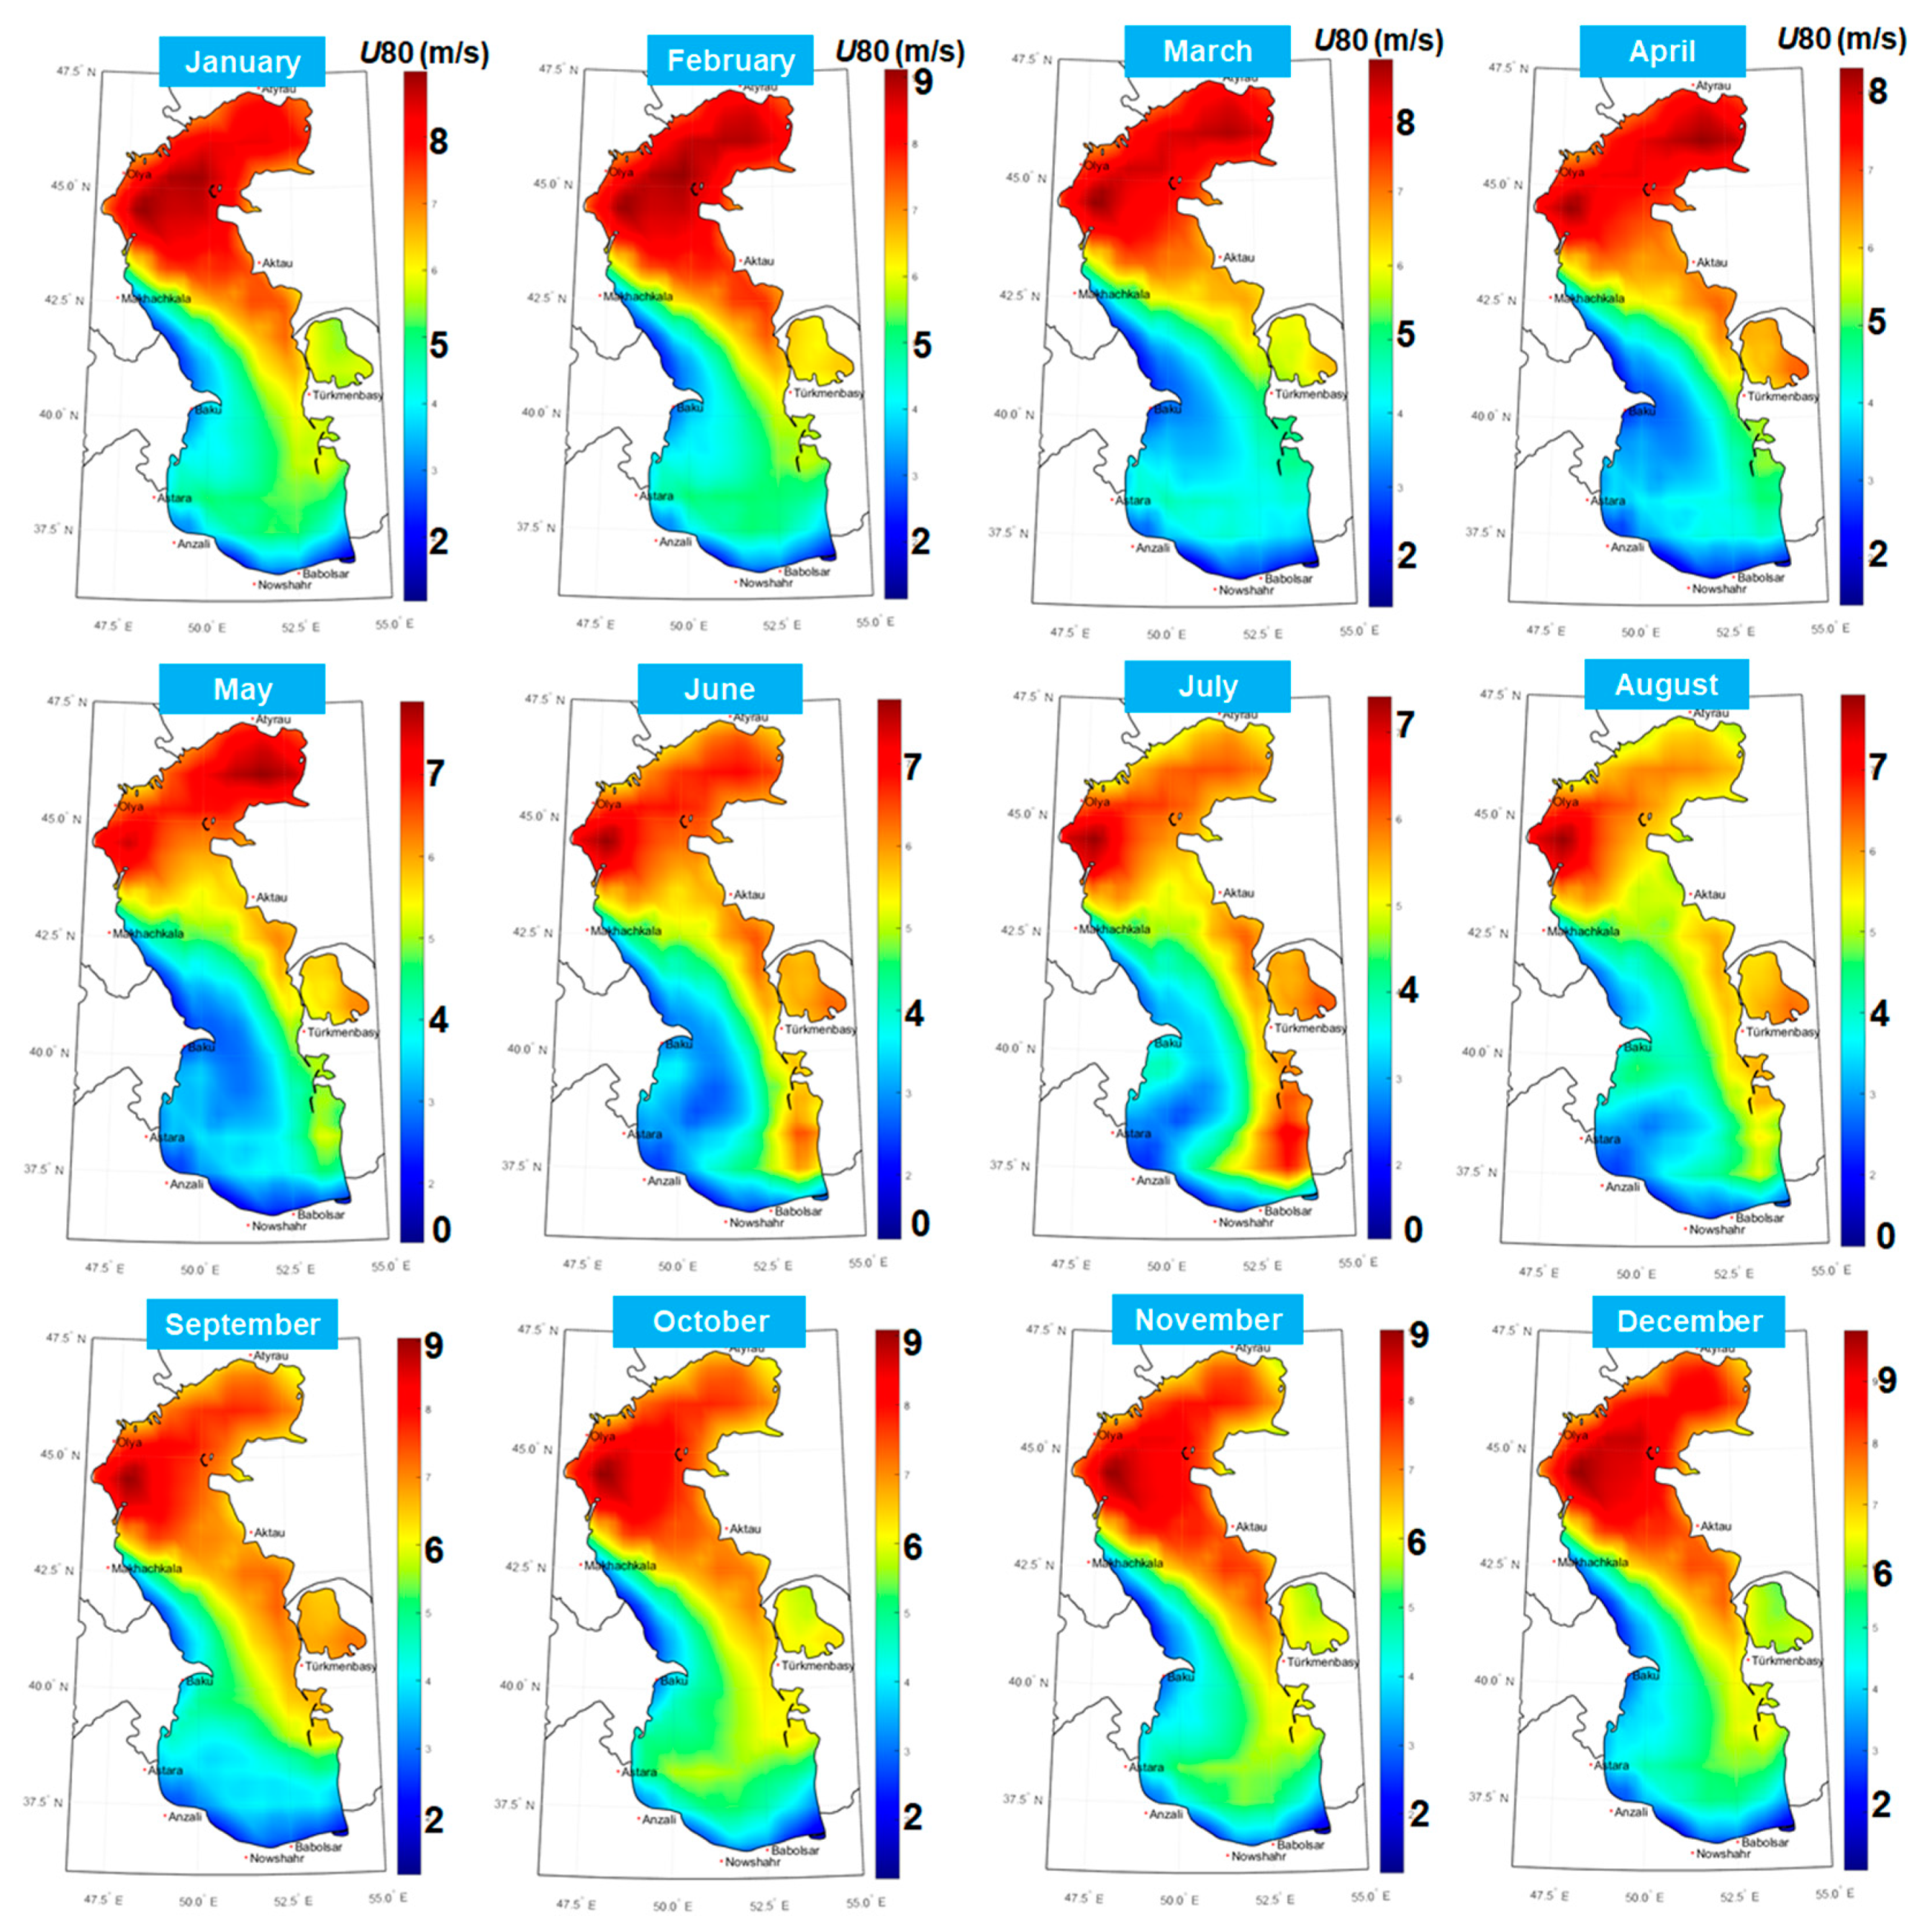
Figure 6 presents the monthly evolution of the U80 parameter taking into account all the available wind data. As expected, the northern part was dominated by more important conditions for the entire time interval considered., In July, it was observed that some wind energy hot-spots close to Olya site (in the south) or nearby Balbosar (in the north), reached a maximum value of 7 m/s. During the interval January–April, the consistency of the wind resources was more present in the entire northern region, with wind speed values observed at 9 m/s. In general, the sites located close to Olya (in the south) constantly indicated a higher wind resource, which makes them suitable candidates for the development of a wind project, if there is any energy demand in this region.
3.3. Evaluation of the Wind Turbines
The downtime interval represents the inactivity period, during which the turbine will be shut down since the wind conditions are not suitable for the electricity production. In Figure 7, some case studies are presented. As the wind distribution located below the cut-in value and a dotted line that marks a distance of 50 km from the shore, a wind project can be usually implemented. In the case of the value 3 m/s, a minimum of 20% may be expected for the northern region, this value gradually increasing to 50% for the sites located in the central part of the target area, while a maximum of 70% may be expected in some isolated regions from the west and south. Small differences were noticed between the values 3 m/s and 3.5 m/s, the more notable values corresponded to the 5 m/s scenario (close to 90%). This indicates that a system as Siemens SWT-4.0 is not a suitable option for this enclosed basin.
A top five downtime is presented in Table 3, taking into account as a reference the 3 m/s value. The lowest values were accounted by the same sites that include Atyrau, Olya, Aktau, Türkmenbasy and Makhachkala, regardless of the distance to the shore considered for evaluation. For the 5 km limit, a minimum of 20.76% was expected close to Atyrau and a maximum of 36.01% near Makhachkala. The same pattern was repeated for the 25 km, with a minimum of 20.31%, while in the case of 50 km, there was a change of places between the fourth and fifth positions, for which a maximum of 34.4% was noticed.
Through the rated capacity, the percentage of time during which a particular turbine will operate at a full capacity can be identified. This is done by taking into account the wind speed located between the rated wind speed and the cut-out values. More details are presented in Figure 8. Only one spatial map was represented, since the colour distribution remained the same, and only the scale of the map was represented for different wind speed values. As expected, the values significantly decreased from 10.5 m/s to 15 m/s, It was observed that the energy hot spot located close to the Olya site did not exceed the 50 km limit (dotted line), where the best results were reported. The maximum values, oscillated between 15% and 30%, depending on the considered rated speed. This distribution closely followed the evolution of the wind speed with better results expected in north. In the southern region, it is possible that the considered wind turbines from Table 2 reported a negative performance (0%).
A more concise evaluation of the rated capacity is presented in Table 4, with the rated speed of 13 m/s as a reference. From the selected sites, Olya presented the best performances that varied between 14.7% (5 km) to 17.81% (50 km), compared to a minimum value of 3.96% (50 km) reported by Türkmenbasy, that was included in this classification.
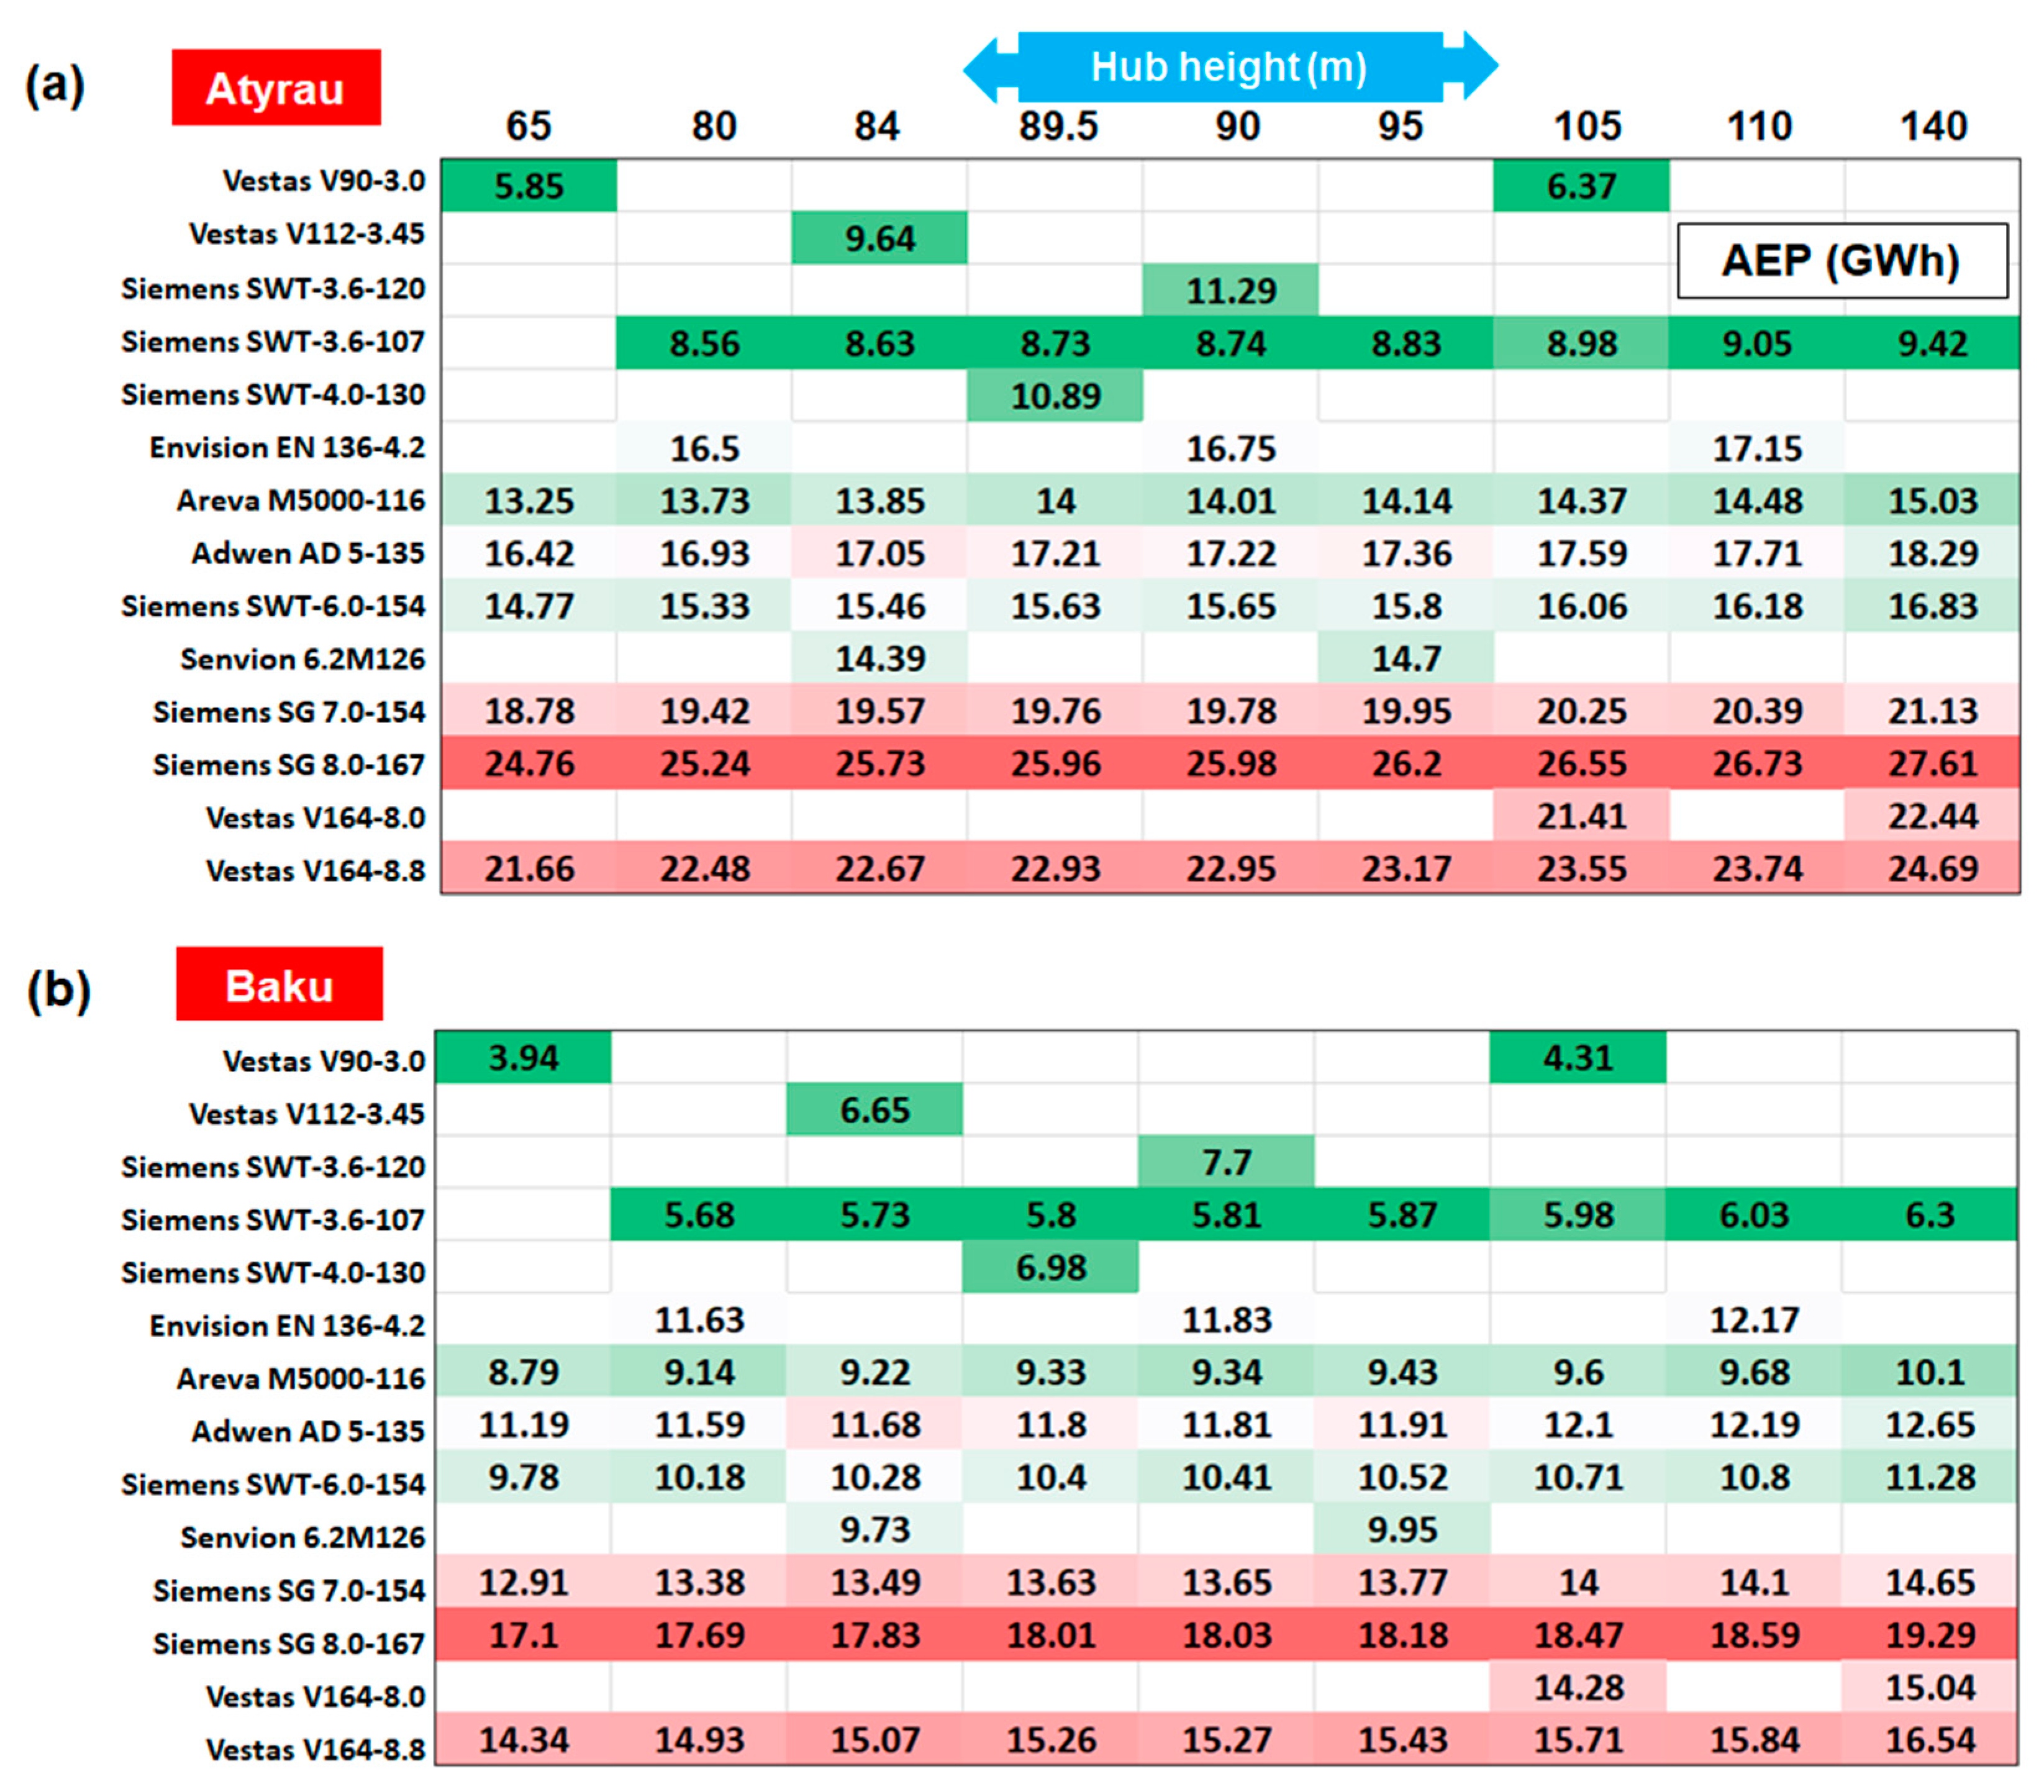
As a next step, the annual electricity production (AEP) was assessed by considering two reference sites, namely Atyrau and Baku. The selection of the Baku site was made by taking into account the interest for development of an offshore project in this region, the large population that lives in this region, and that it has some wind resources considering the results presented in Figure 5a. Figure 9 is focused on this evaluation which includes all the selected wind turbines. In the case of the systems where the hub height was indicated as site specific, different values were considered for assessment.
It is clear that the site Atyrau (5 km from shore) indicated better performances than Baku (5 km from shore), regardless of the selected wind turbine, the lower and higher values being highlighted as a reference to the individual hub heights. As expected, the electricity production was related to the rated capacity and at the bottom, the systems rated below 4 MW were found. In addition, it is important to mention that the system, Siemens SG 8.0 MW, presented better results than the other two Vestas systems rated at 8 MW and 8.8 MW, making it a suitable candidate for this region. For the Atyrau site, the authors expected a maximum value of 5.85 GWH in the case of Vestas V90-3.0 MW. These systems operate at a hub height of 65 m, while a maximum of 27.761 GWh is indicated by the Siemens SG 8.0 MW, if the rotor of this system works at a height of 140 m. In the case of the Baku site, a similar pattern was noticed, with the values oscillating between 3.94 GWh and 19.29 GWh. Also, it seems that some wind turbines presented lower performances compared to others, although they were defined by a higher rated capacity. This was the case of Vestas V112-3.45 MW compared to Siemens SWT-3.6-107, or for the generator, Adwen AD5-135, compared to Siemens SWT-6.0-154 and Senvion 6.2M126.
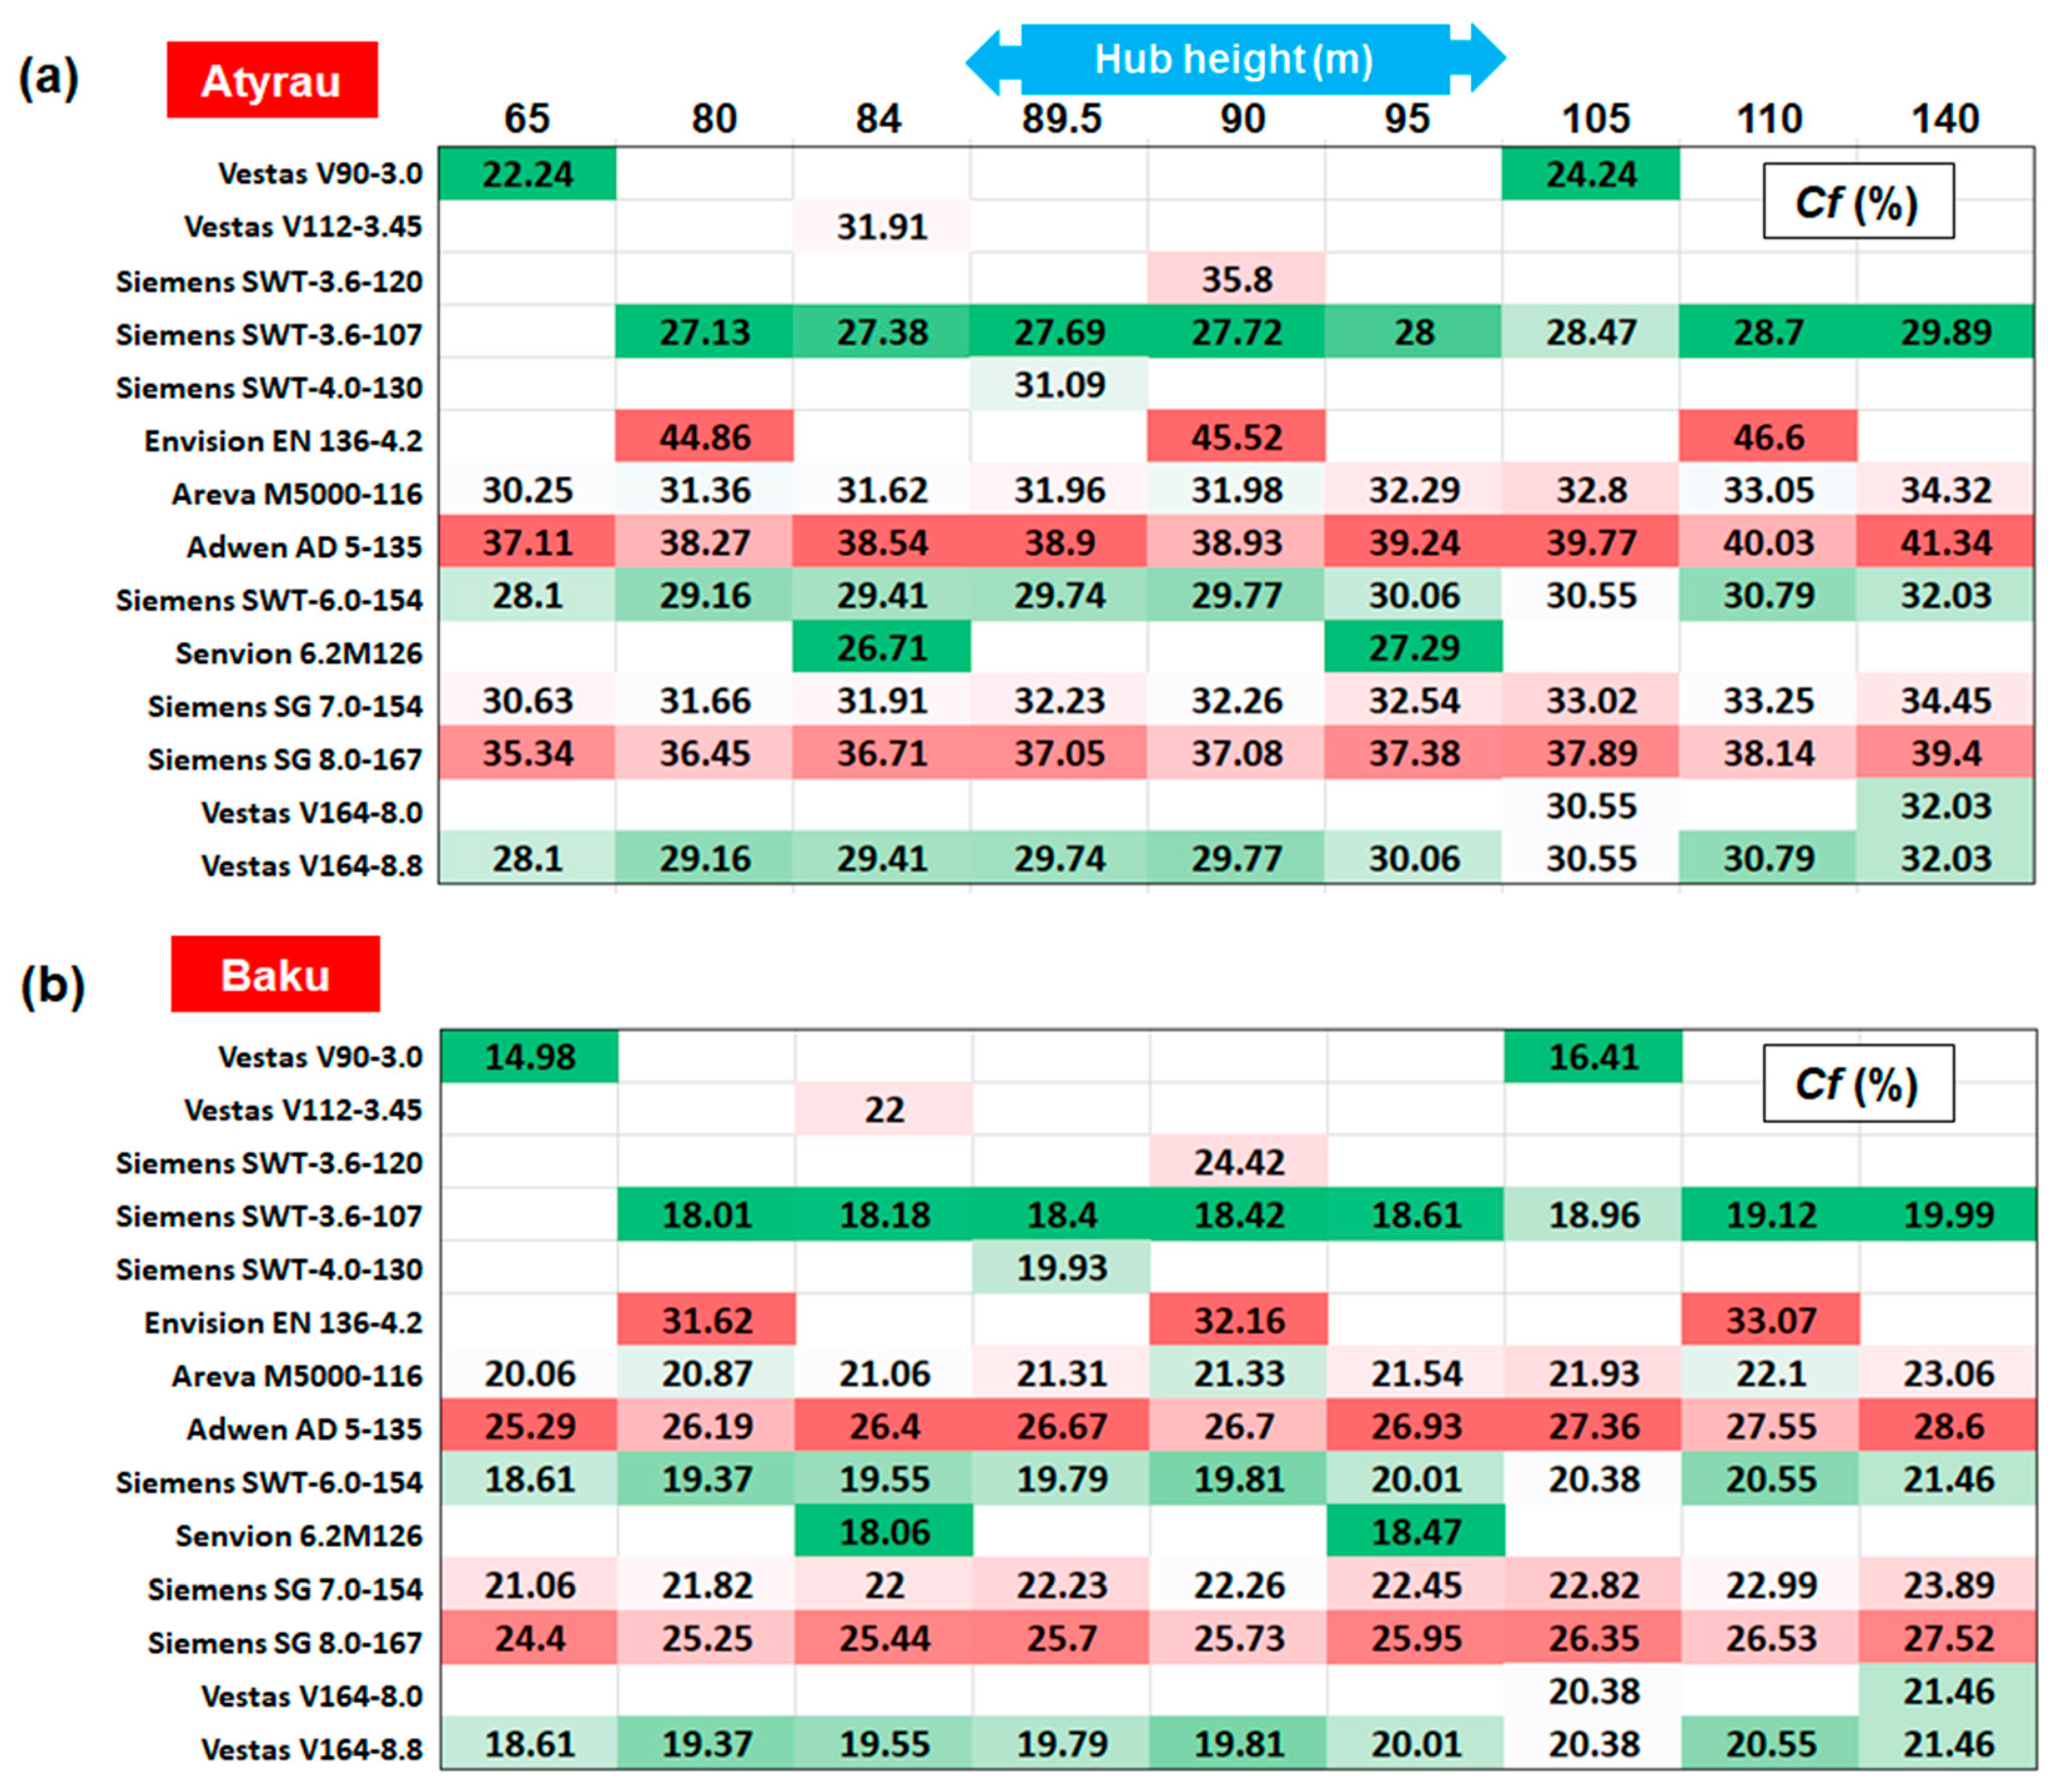
A similar analysis was performed in Figure 10, taking into account the capacity factor index. According to these values, Envision 4.2 MW stood out with more important values, being followed by Adwen AD5-135 and Siemens SG 8.0 MW. Regarding the Atyrau site, by observing the 80 m hub height, the values in the range of 27.13–44.86%, which were specific to some turbines rated at 3.6 MW and 4.2 MW, respectively, were noticed. Compared to these, the turbine rated at 8.8 MW indicated a value of approximately 29.16%. This is close to the lower value and similar to the one reported by Siemens SWT-6.0-154. In the case of the turbines, where the hub height was indicated as site specific, the authors obtained the following differences from 65 m to 140 m: Areva Multibrid M5000—4.07%; Adwen AD 5-135—4.23%; Siemens SWT-6.0-154—3.93%; Siemens Gamesa 7 MW—3.82% or Vestas V164-8.8 MW—3.93%. For the Baku site, lower values were expected from the turbines Vestas V90-3.0, Siemens SWT-3.6-107 and Senvion 6.2M126, while the turbine Envision 4.2MW seemed to be a suitable solution for this site. The turbines rated above 4.2 MW exceeded, in general, by 20%, and reached a maximum of 33.07% in the case of Envison 4.2 MW (110 m height), this turbine exceeded, in general, by 30%.
4. Discussions and Conclusions
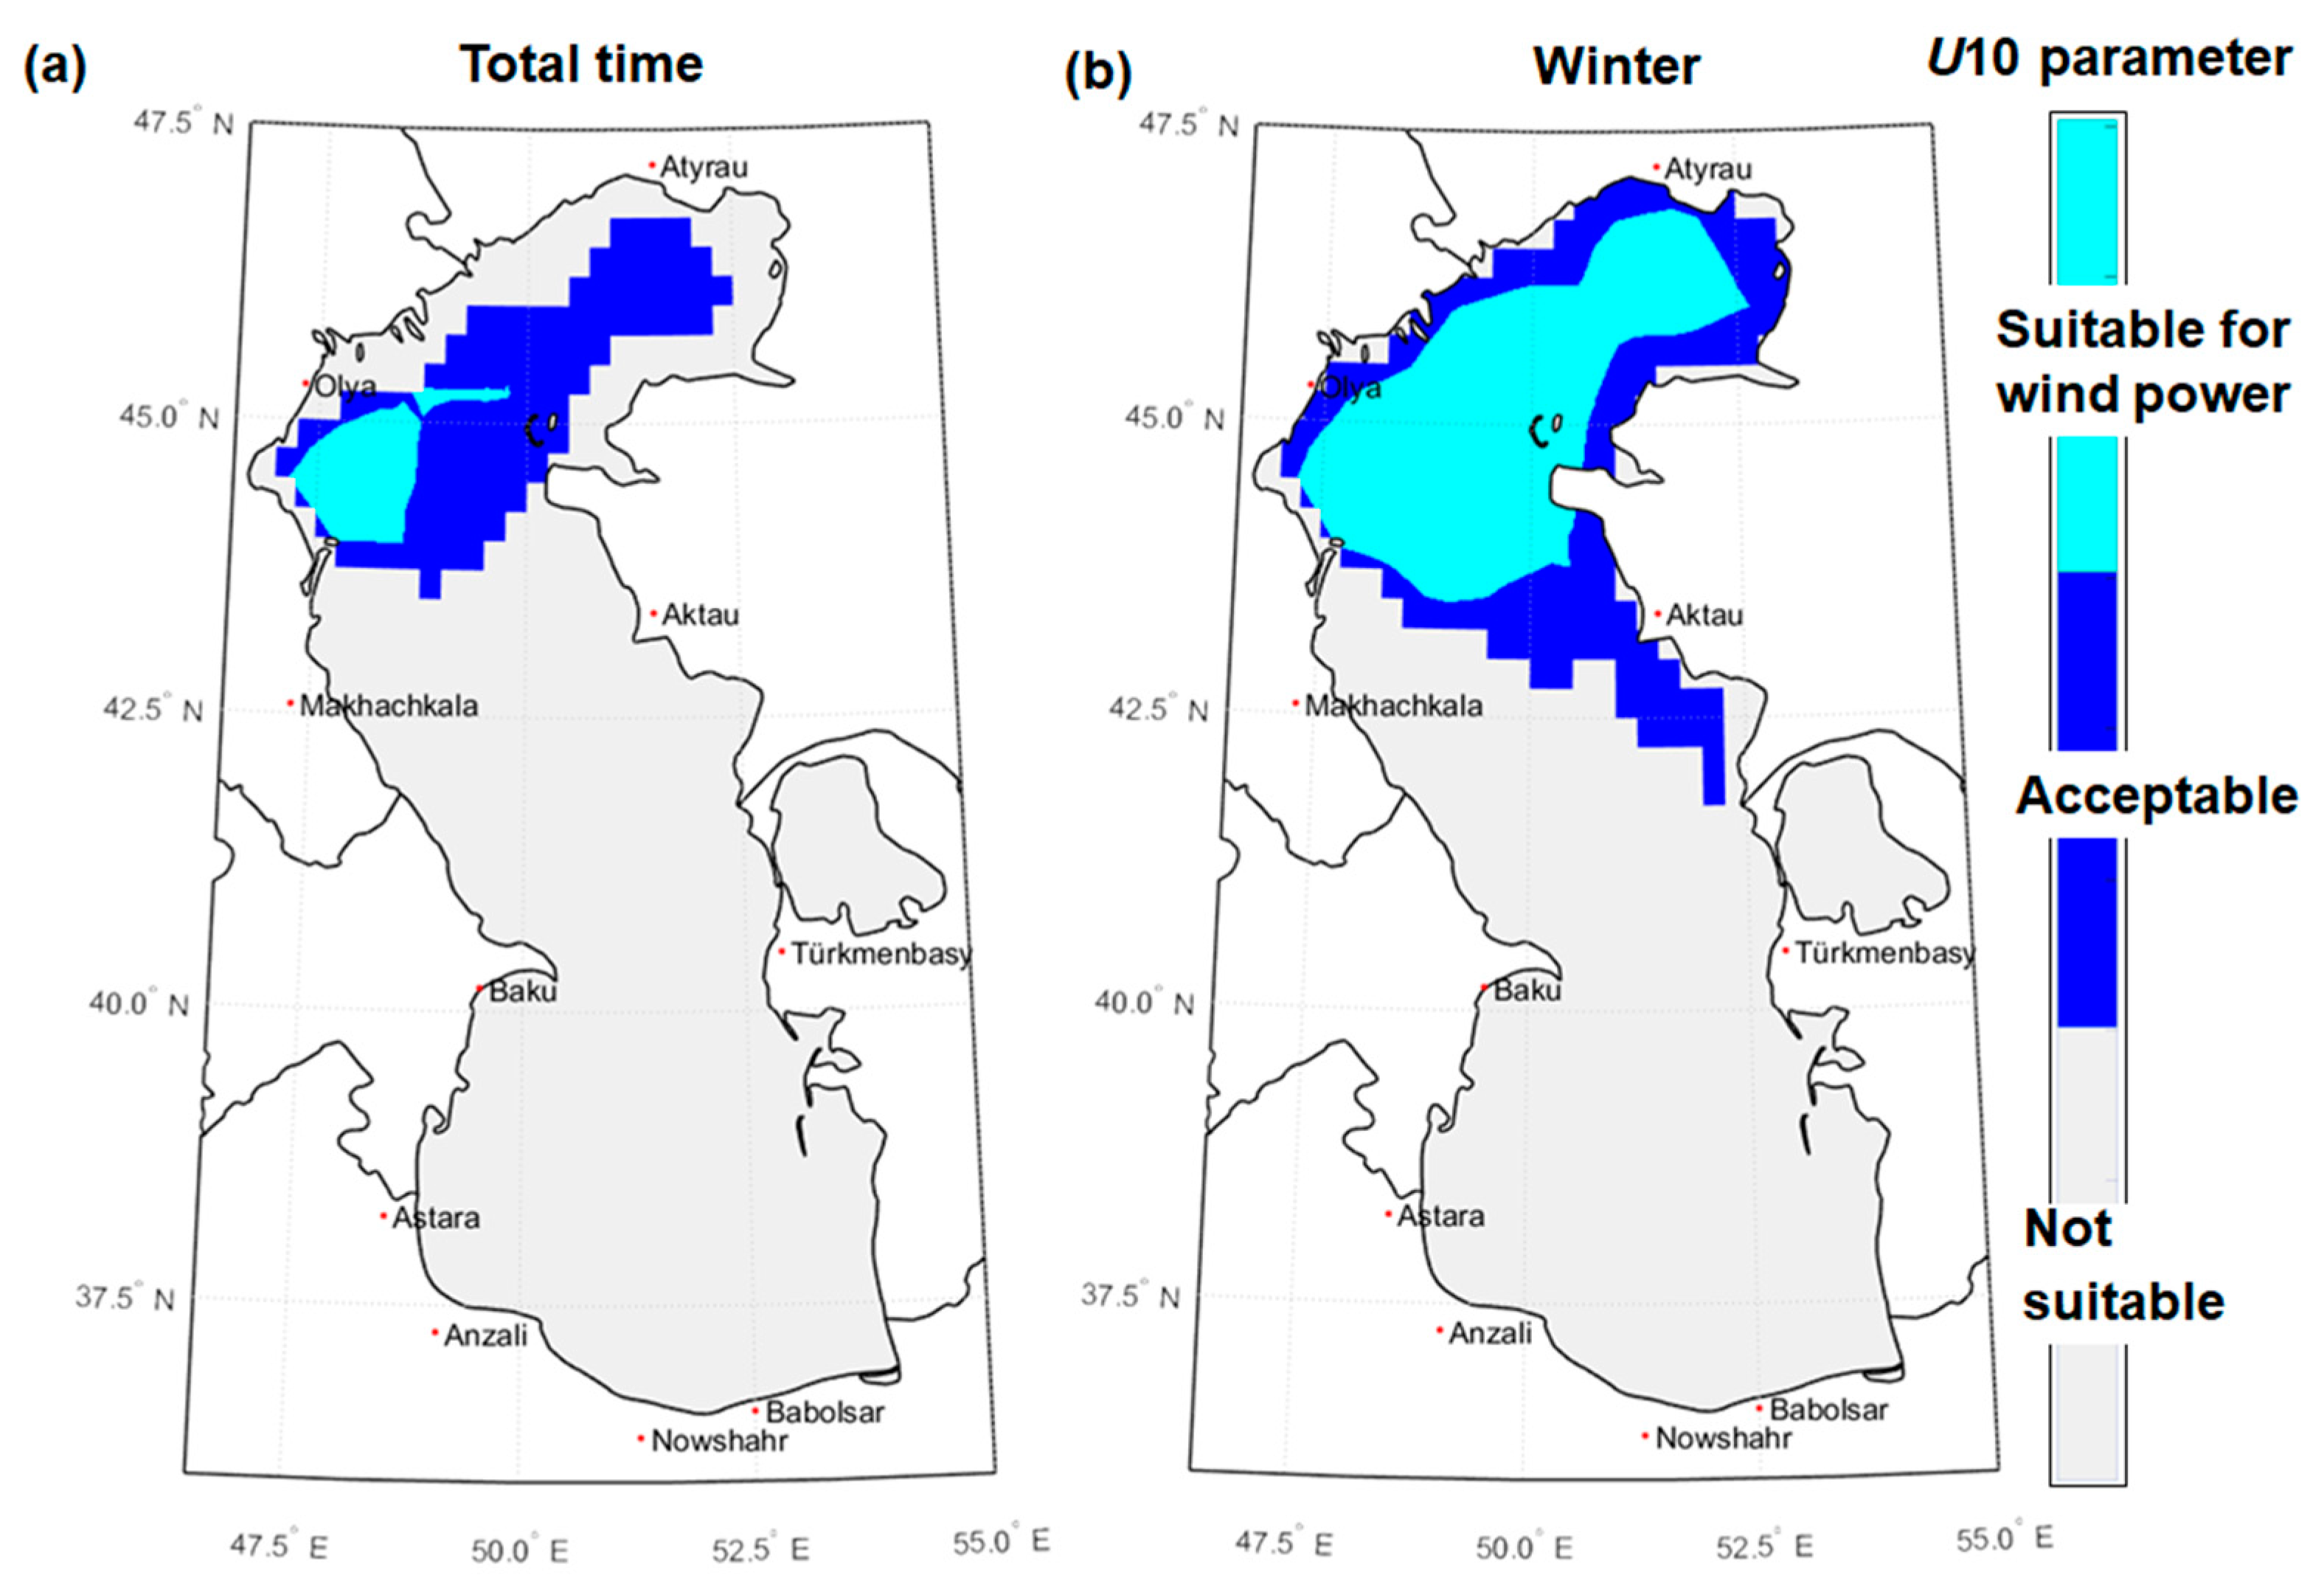
One objective of the present work is to identify some suitable areas for the development of a wind project. From the literature review, it seems that the offshore sites that exceeded an average wind speed of 6 m/s (reported at 10 m height) are recommended [34]. Figure 11 presents this analysis, where the total time interval can be noticed, with the more promising areas being located in the northern sector. As expected, the region located south of the Olya site concentrated most of the wind energy. Some acceptable areas were noticed heading towards the north-east. During the winter time (December-January-February), the suitable areas were significantly extended, reaching the northern and eastern coast of the Caspian Sea. During this season, some promising results are expected from the sites located in the central part of this sea, more precisely, close to the Aktau site (east). Per total, according to this criterion (U10 < 6 m/s), a significant part of the Caspian Sea is not suitable for the development of an offshore wind project, this being also the case of the Baku location, where some offshore wind farms may occur in the near future.
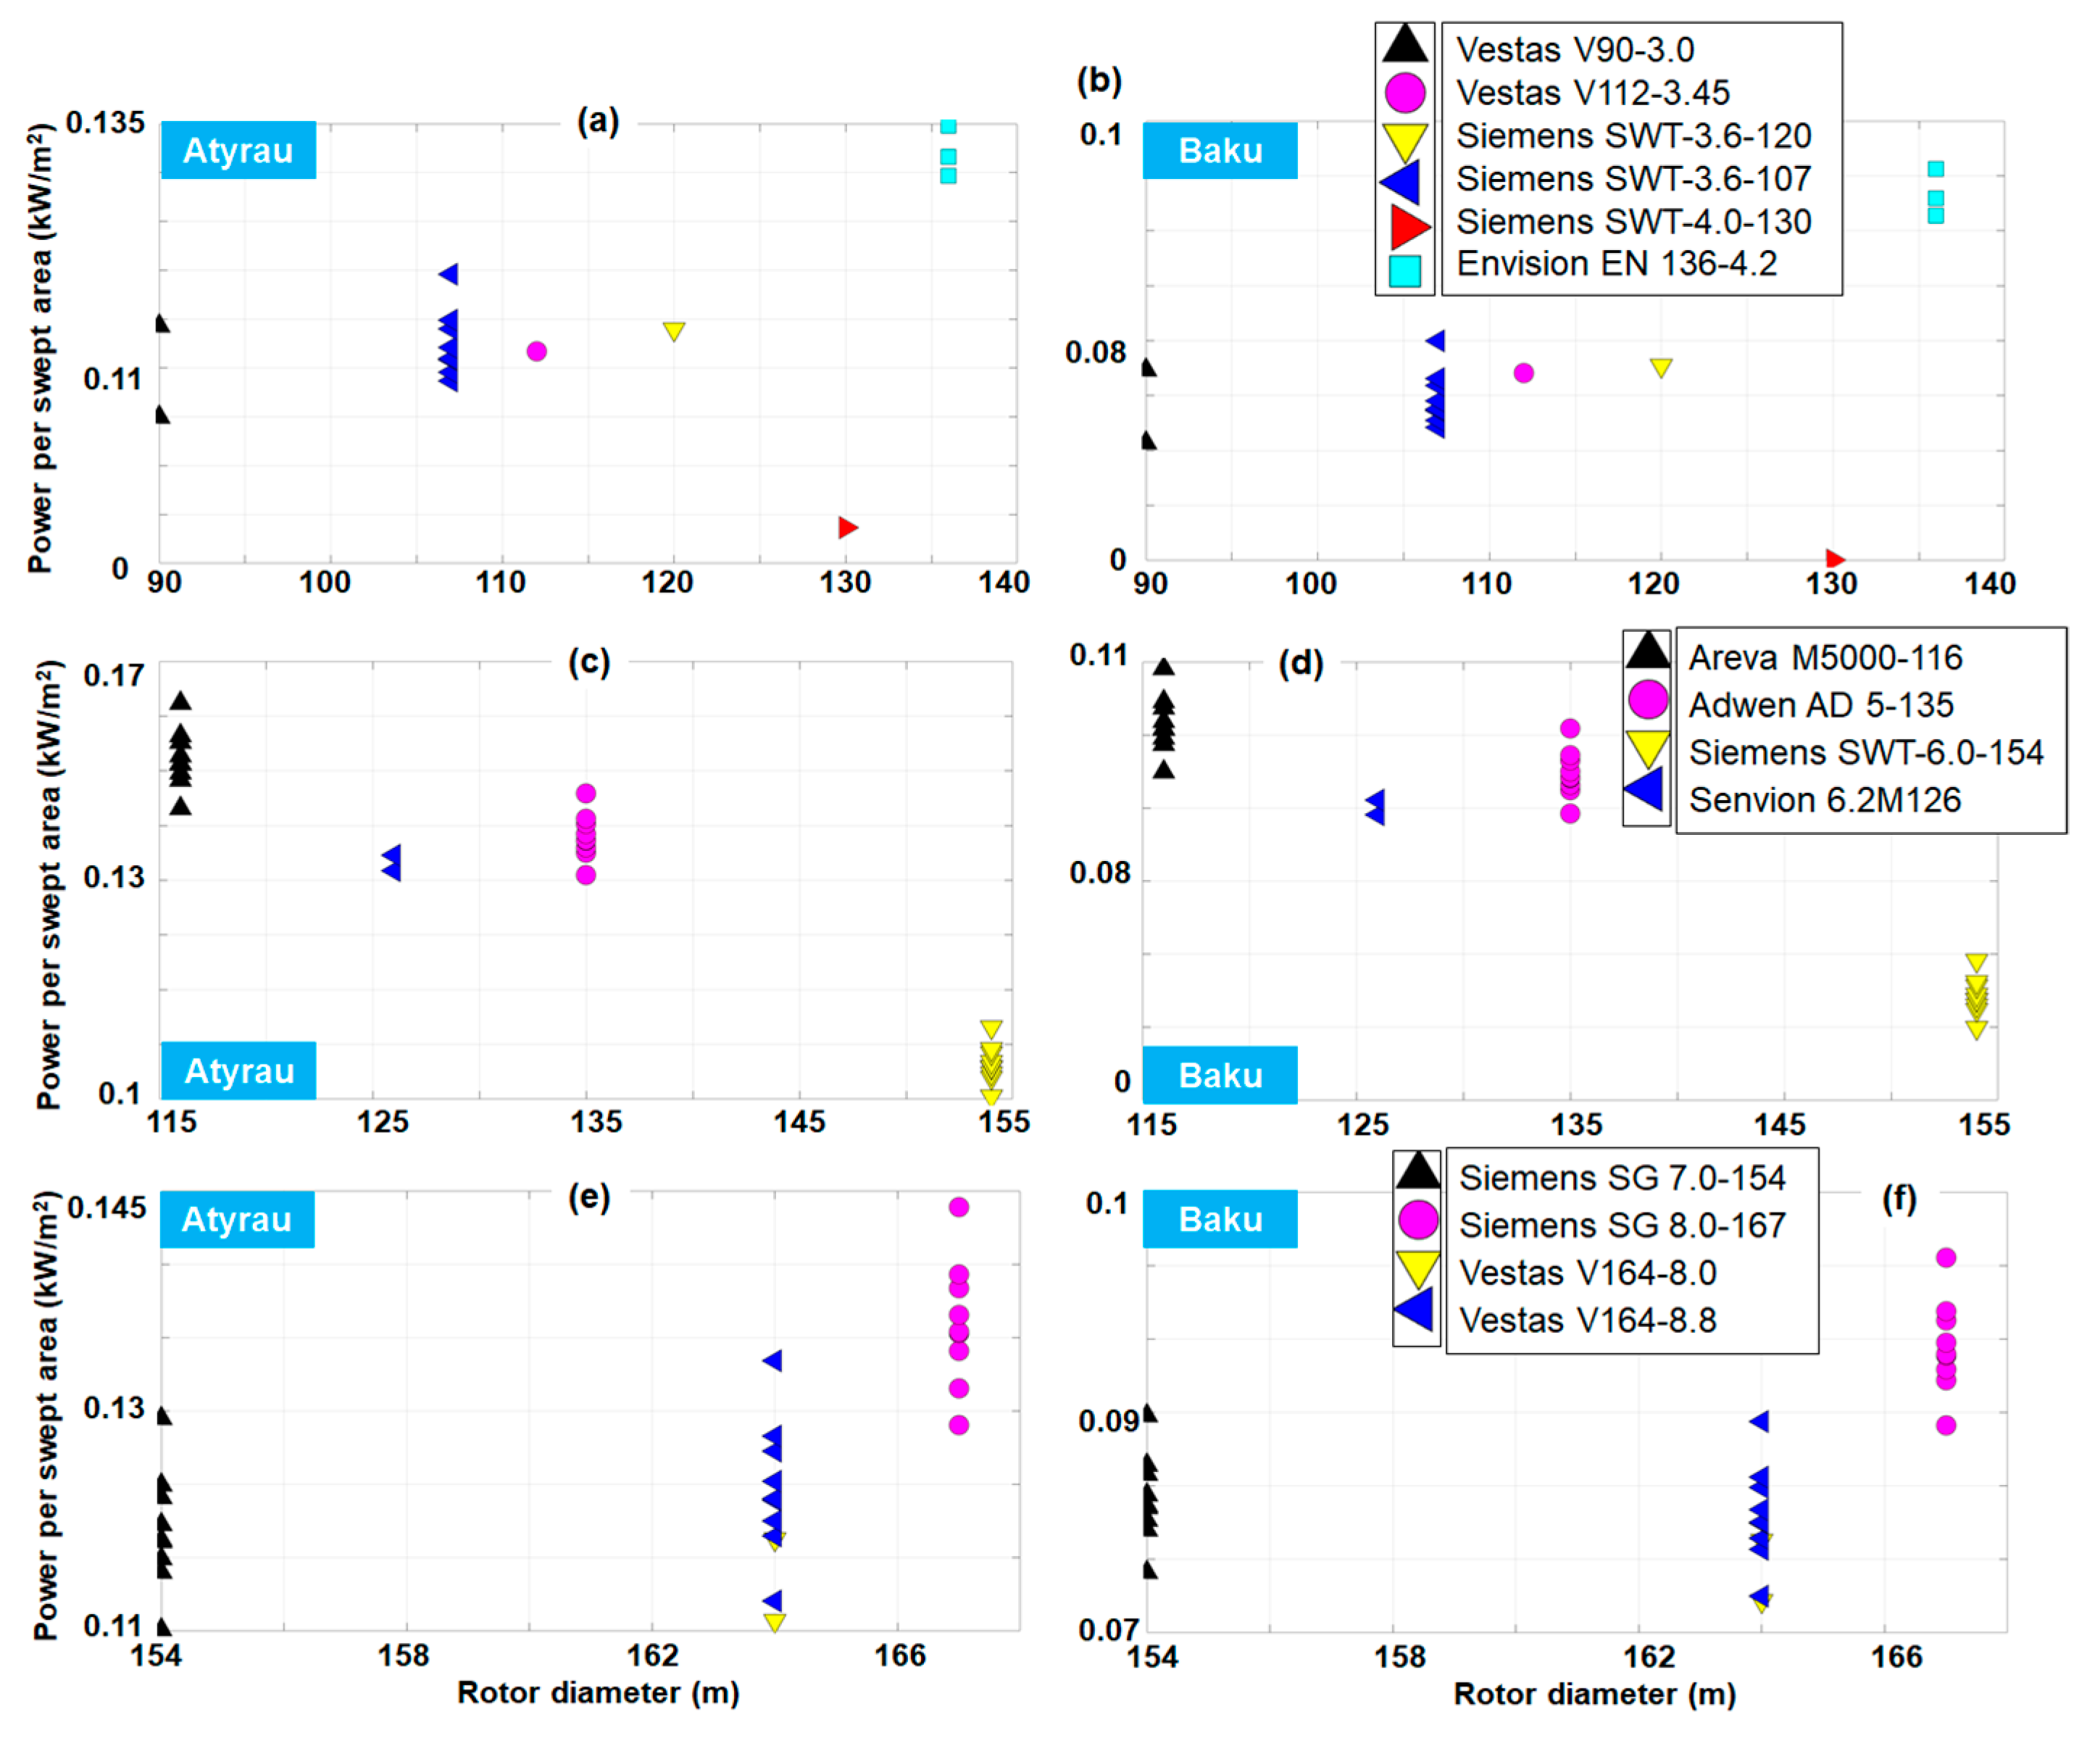
Until now, the performances of the wind turbines were discussed in terms of their rated power. Another important parameter that needs to be taken into account is the turbine diameter, and this analysis is provided in Figure 12. The wind turbines presented in Table 2 were grouped in three main categories (small-medium-large), and the results were presented only for the sites Atyrau and Baku. These results showed a similar distribution for both sites, with the Atyrau site presenting slightly higher values.
From the analysis of the wind turbines included in the first category (small), the system, Envision EN 136-4.2 (hub height 80-90-110 m), seems to be more suitable for this location compared to Siemens SWT-4.0-130 that has a comparable rated capacity and operates at a height of 89.5 m. As for the second group (medium), significant results were noticed between Areva M500-116 and Siemens SWT-6.0-154, although similar hub heights were taken into account. From the systems rated above 7 MW, the better performances were expected from the Siemens SG 8.0-167, compared to Vestas V164-8.0 and Siemens SG 7.0-154, which were defined by a much lower rated capacity.
In the present work, a more complete description of the wind conditions corresponding to the Caspian Sea was provided by considering spatial maps and specific sites located near the major harbour cities of this region. According to the bathymetric data, significantly lower water depths are noticed in the northern part of this region. This means that they are suitable for the development of mono pile wind projects, taking into account that this solution can be used for water depths of 50 m [35]. For the rest of the regions, a floating wind farm has been indicated [36]. According to the wind data coming from the ERA-Interim project, the northern part of this sea was also defined by important wind resources, that seemed to be very suitable for a wind project. For this region, an average wind speed of 8–8.5 m/s (at 80 m height) were noticed, with a significant increase in the wind power which corresponded to autumn and winter. This environment was defined by important seasonal variations, which can reach a maximum of 40% in the southeast (in summer) or an increase with 15% of the wind speed for the entire basin (in winter).
When discussing the viability of an offshore wind project, an important issue to take into account are the financial aspects, especially in the case of the Caspian Sea. A common way to do this is to consider the levelized cost of energy (LCOE) that can be defined as [24]:
where: CAPEX—represents Capital Expenditure; OPEXt—Operational expenditures reported for year t; AEPt—Annual Energy Production corresponding to year t; r—the discount rate; η—lifetime of the project; t—year from the start of project.
Considering the methodology presented in Rusu and Onea [24], the following set-up was used: (a) Discount rate = 10%; (b) inflation = 2%; (c) ageing of the turbines = 1.6%; (d) CAPEX cost = 4500 USD/kW; (e) OPEX = 0.048 USD/kW; (f) project lifetime = 20 years (1999–2018). For simplicity, the hub height of the turbines was fixed to 80 m height and all the reference sites located at 5 km were taken into account. However from the results presented in Figure 2a, it is possible that some of them need to be defined by a lower quality of the wind data.
Figure 13 presents such an analysis, where a similar spatial pattern of the LCOE is indicated by the three groups of wind turbines. The better results corresponded to the sites Atyrau, Aktau, Turkmenbasy, Baku and Olya, where the values gradually decreased below 0.5 USD/kWh. A maximum LCOE value of 10 USD/kWh was reported by the site Anzali, this value gradually decreasing to 4.5 USD/kWh and 3 USD/kWh for turbines defined by higher rated capacity. Taking into account that the target of the European Union for the year 2025 is to obtain an LCOE of 0.11 USD/kWh [24], this study can conclude that the sites that exceed at this moment 0.5 USD/kWh cannot be taken into account for an offshore project. In Figure 13 (subplots b1 and c1), the turbines rated between 7 and 8.8 MW indicate better performances, reporting in some cases LCOE values below 0.25 USD/kWh. There is room for improvement and better performances can be obtained.
The best sites to develop wind projects are close to Atyrau (north) and Olya (northwest), with the mention that the spatial maps indicate a hot-spot south of Olya (close to 44° latitude north) that presents more important wind resources. At this moment, there are plans to develop offshore wind projects in the vicinity of the Baku region (Absheron peninsula). By looking at the wind map, it can be noticed that this region is located in an area with moderate wind resources, where the wind speed conditions do not increase heading towards the offshore region. This means that a wind project located close to the shore will be preferable as the energy output will not significantly increase. Also to be considered is the development of a project along the shoreline in order to avoid the problems associated with marine areas, such as weather windows [37].
As in most of the regions located in the northern hemisphere, the wintertime presents more energetic wind resources [38,39], this being also the case for the Caspian Sea. During December, January and February, the entire northern area has been defined by important wind resources, which constantly indicated average wind speed values of 8.5–9 m/s. During the summer time, the areas suitable for a renewable project are significantly reduced, being possible to register a maximum of 7 m/s only in the southern part of Olya site.
As for the wind turbine performances, different generators were considered for assessment using as a reference the sites of Atyrau and Baku. The annual electricity production is directly related to the rated capacity of the turbines, but even so, an 8 MW system will perform much better than an 8.8 MW generator. By considering different hub heights, the electricity output for different configurations was established, being reported a maximum production of 27.61 GWh and 19.29 GWh for the Atyrau and Baku site, respectively. To obtain a higher capacity factor, probably a system rated at 4.2 MW or 5 MW will be more indicated, having reported values close to 50% for the Atyrau sites, and between 25% and 33% for the Baku location.
Finally, the Caspian Sea is an important area in terms of energy resources, being well known for the hydrocarbon extractions [40]. Nevertheless, there is interest for natural resources, and the development of a wind farm which will represent one-step forward for the development of a renewable portfolio, as it can be designed according to the electricity demand of the coastal communities from this region.
Author Contributions
F.O. performed the literature review, processed the wind data, carried out the statistical analysis and interpreted the results. E.R. guided this research, wrote the manuscript and drawn the conclusions. The final manuscript has been approved by all authors.
Funding
This work was carried out in the framework of the research project REMARC (Renewable Energy extraction in MARine environment and its Coastal impact), supported by the Romanian Executive Agency for Higher Education, Research, Development and Innovation Funding—UEFISCDI, grant number PN–III–P4–IDPCE–2016–0017.
Acknowledgments
ECMWF ERA-Interim data used in this study have been obtained from the ECMWF data server. The altimeter products were generated and distributed by Aviso (http://www.aviso.altimetry.fr/) as part of the SSALTO ground processing segment.
Conflicts of Interest
The authors declare no conflicts of interest.
Nomenclature
| T | Avera–year (8760 hr/year) |
| r | discount rate |
| U10 | wind speed reported for a 10 m height above sea level |
| P(u) | power curve of a wind turbine |
| PE | electric power expected to be generated |
| RP | rated power of the system |
| OPEXt | Operational expenditures reported for year t |
| CAPEX | Capital Expenditure |
| LCOE | Levelized Cost of Energy |
| AEP | Annual Electricity Production |
| NaN | Not A Number |
| f(u) | Weibull probability density function |
| ECMWF | European Centre for Medium-Range Weather Forecasts |
| Cf | Capacity factor |
| AVISO | Archiving, Validation and Interpretation of Satellite Oceanographic Data |
| ; | reference heights |
| roughness of the sea surface |
References
- Yang, W.; Tian, W.; Hvalbye, O.; Peng, Z.; Wei, K.; Tian, X. Experimental research for stabilizing offshore floating wind turbines. Energies 2019, 12, 1947. [Google Scholar] [CrossRef]
- Ishie, J.; Wang, K.; Ong, M. Structural dynamic analysis of semi-submersible floating vertical axis wind turbines. Energies 2016, 9, 1047. [Google Scholar] [CrossRef]
- Offshore Wind in Europe—Key Trends and Statistics 2018. Available online: https://windeurope.org/about-wind/statistics/offshore/european-offshore-wind-industry-key-trends-statistics-2018/ (accessed on 8 March 2019).
- Klinge Jacobsen, H.; Hevia-Koch, P.; Wolter, C. Nearshore and offshore wind development: Costs and competitive advantage exemplified by nearshore wind in Denmark. Energy Sustain. Dev. 2019, 50, 91–100. [Google Scholar] [CrossRef]
- Vieira, M.; Henriques, E.; Amaral, M.; Arantes-Oliveira, N.; Reis, L. Path discussion for offshore wind in Portugal up to 2030. Mar. Policy 2019, 100, 122–131. [Google Scholar] [CrossRef]
- Rusu, E.; Onea, F. Joint evaluation of the wave and offshore wind energy resources in the developing countries. Energies 2017, 10, 1866. [Google Scholar] [CrossRef]
- Ganea, D.; Mereuta, E.; Rusu, E. An evaluation of the wind and wave dynamics along the european coasts. JMSE 2019, 7, 43. [Google Scholar] [CrossRef]
- Rusu, E.; Onea, F. Evaluation of the wind and wave energy along the Caspian Sea. Energy 2013, 50, 1–14. [Google Scholar] [CrossRef]
- Zountouridou, E.I.; Kiokes, G.C.; Chakalis, S.; Georgilakis, P.S.; Hatziargyriou, N.D. Offshore floating wind parks in the deep waters of Mediterranean Sea. Renew. Sustain. Energy Rev. 2015, 51, 433–448. [Google Scholar] [CrossRef]
- EolMed—The First Offshore Wind Farm in the Mediterranean Sea. Available online: http://www.eolmed.fr/en/ (accessed on 29 May 2019).
- Italy on Pole in Race for First Mediterranean Offshore Wind | Recharge. Available online: https://www.rechargenews.com/wind/1712851/italy-on-pole-in-race-for-first-mediterranean-offshore-wind (accessed on 29 May 2019).
- Onea, F.; Deleanu, L.; Rusu, L.; Georgescu, C. Evaluation of the wind energy potential along the Mediterranean Sea coasts. Energy Explor. Exploit. 2016, 34, 766–792. [Google Scholar] [CrossRef]
- Amirinia, G.; Kamranzad, B.; Mafi, S. Wind and wave energy potential in southern Caspian Sea using uncertainty analysis. Energy 2017, 120, 332–345. [Google Scholar] [CrossRef]
- Onea, F.; Rusu, E. Efficiency assessments for some state of the art wind turbines in the coastal environments of the Black and the Caspian seas. Energy Explor. Exploit. 2016, 34, 217–234. [Google Scholar] [CrossRef] [Green Version]
- Kerimov, R.; Ismailova, Z.; Rahmanov, N.R. Modeling of wind power producing in Caspian Sea conditions. Int. J. Tech. Phys. Problems Eng. 2013, 15, 136–142. [Google Scholar]
- Alamian, R.; Shafaghat, R.; Miri, S.J.; Yazdanshenas, N.; Shakeri, M. Evaluation of technologies for harvesting wave energy in Caspian Sea. Renew. Sustain. Energy Rev. 2014, 32, 468–476. [Google Scholar] [CrossRef]
- Kamranzad, B.; Etemad-Shahidi, A.; Chegini, V. Sustainability of wave energy resources in southern Caspian Sea. Energy 2016, 97, 549–559. [Google Scholar] [CrossRef] [Green Version]
- Alamian, R.; Shafaghat, R.; Safaei, M.R. Multi-objective optimization of a pitch point absorber wave energy converter. Water 2019, 11, 969. [Google Scholar] [CrossRef]
- Tavana, M.; Behzadian, M.; Pirdashti, M.; Pirdashti, H. A PROMETHEE-GDSS for oil and gas pipeline planning in the Caspian Sea basin. Energy Econ. 2013, 36, 716–728. [Google Scholar] [CrossRef]
- Mityagina, M.; Lavrova, O. Satellite survey of Inner Seas: Oil pollution in the Black and Caspian Seas. Remote Sens. 2016, 8, 875. [Google Scholar] [CrossRef]
- Efendiyeva, I.M. Ecological problems of oil exploitation in the Caspian Sea area. J. Pet. Sci. Eng. 2000, 28, 227–231. [Google Scholar] [CrossRef]
- INTERVIEW—Azerbaijan’s 200MW Offshore Wind Plan May be Tweaked After Feasibility Study. Available online: /news/interview-azerbaijans-200mw-offshore-wind-plan-may-be-tweaked-after-feasibility-study-503906/ (accessed on 30 May 2019).
- Wind Power in Azerbaijan. REVE, Archives: Wind energy in Azerbaijan. Available online: https://www.evwind.es/tags/wind-energy-in-azerbaijan (accessed on 30 May 2019).
- Rusu, E.; Onea, F. An assessment of the wind and wave power potential in the island environment. Energy 2019, 175, 830–846. [Google Scholar] [CrossRef]
- Bathymetric Data Viewer. Available online: https://maps.ngdc.noaa.gov/viewers/bathymetry/ (accessed on 31 May 2019).
- Home. United Nations. Available online: https://www.un.org/en/ (accessed on 31 May 2019).
- Poli, P. Browse Reanalysis Datasets. Available online: https://www.ecmwf.int/en/forecasts/datasets/browse-reanalysis-datasets (accessed on 31 May 2019).
- Wan, Y.; Fan, C.; Dai, Y.; Li, L.; Sun, W.; Zhou, P.; Qu, X. Assessment of the joint development potential of wave and wind energy in the South China Sea. Energies 2018, 11, 398. [Google Scholar] [CrossRef]
- Onea, F.; Rusu, L. Evaluation of some state-of-the-art wind technologies in the nearshore of the Black Sea. Energies 2018, 11, 2452. [Google Scholar] [CrossRef]
- Onea, F.; Rusu, L. A Study on the wind energy potential in the Romanian coastal environment. J. Mar. Sci. Eng. 2019, 7, 142. [Google Scholar] [CrossRef]
- Welcome to Wind-Turbine-Models.com. Available online: https://en.wind-turbine-models.com/ (accessed on 20 May 2018).
- Rusu, E.; Onea, F. A parallel evaluation of the wind and wave energy resources along the Latin American and European coastal environments. Renew. Energy 2019, 143, 1594–1607. [Google Scholar] [CrossRef]
- MSWH/MWind: Aviso+. Available online: https://www.aviso.altimetry.fr/en/data/products/windwave-products/mswhmwind.html (accessed on 18 August 2018).
- Vagiona, D.G.; Kamilakis, M. Sustainable site selection for offshore wind farms in the South Aegean—Greece. Sustainability 2018, 10, 749. [Google Scholar] [CrossRef]
- Njomo-Wandji, W.; Natarajan, A.; Dimitrov, N. Influence of model parameters on the design of large diameter monopiles for multi-megawatt offshore wind turbines at 50-m water depths. Wind Energy 2019, 22, 794–812. [Google Scholar] [CrossRef]
- Lerch, M.; De-Prada-Gil, M.; Molins, C. The influence of different wind and wave conditions on the energy yield and downtime of a Spar-buoy floating wind turbine. Renew. Energy 2019, 136, 1–14. [Google Scholar] [CrossRef]
- O’Connor, M.; Lewis, T.; Dalton, G. Weather window analysis of Irish west coast wave data with relevance to operations 82 maintenance of marine renewables. Renew. Energy 2013, 52, 57–66. [Google Scholar] [CrossRef]
- Onea, F.; Rusu, E. Wind energy assessments along the Black Sea basin. Meteorol. Appl. 2014, 21, 316–329. [Google Scholar] [CrossRef]
- Onea, F.; Raileanu, A.; Rusu, E. Evaluation of the wind energy potential in the coastal environment of two enclosed seas. Adv. Meteorol. 2015. [Google Scholar] [CrossRef]
- Clem, R.S. Energy in the Caspian region: Present and future. Eurasian Geogr. Econ. 2002, 43, 661–662. [Google Scholar] [CrossRef]
Figure 1.
The Caspian Sea and the reference sites considered for assessment, where: (a) bathymetry map [25]; (b) water depths corresponding to each reference site [25]; (c) number of inhabitants corresponding to the reference area considered [26].

Figure 2.
The comparisons between the AVISO measurements and the ERA–Interim reanalysis data for the time interval 2010–2017. The results are structured in: (a) NaN corresponding to the AVISO measurements; (b) 25 percentile; (c) 50 percentile; (d) 95 percentile.
Figure 2.
The comparisons between the AVISO measurements and the ERA–Interim reanalysis data for the time interval 2010–2017. The results are structured in: (a) NaN corresponding to the AVISO measurements; (b) 25 percentile; (c) 50 percentile; (d) 95 percentile.

Figure 3.
Spatial distribution of the U80 parameter (average values) considering the 20-year time interval (January 1999 to December 2018) of ERA-Interim data.
Figure 3.
Spatial distribution of the U80 parameter (average values) considering the 20-year time interval (January 1999 to December 2018) of ERA-Interim data.

Figure 4.
The spatial differences (in %) between the total time data and the four main seasons. The results are reported for the U80 parameter (average values) considering the 20-year time interval of ERA-Interim data, where: (a) spring; (b) summer; (c) autumn and (d) winter.
Figure 4.
The spatial differences (in %) between the total time data and the four main seasons. The results are reported for the U80 parameter (average values) considering the 20-year time interval of ERA-Interim data, where: (a) spring; (b) summer; (c) autumn and (d) winter.

Figure 5.
The distribution of the U80 parameter (average values) per reference sites considering the 20-year time interval of ERA-Interim data, where: (a) U80 values reported by the sites located at 5 km nearshore; (b) differences (in %) between the sites located at 5 km and the ones located at 25 km and 50 km, respectively.

Figure 6.
Monthly distribution of the U80 parameter (average values) reported by the ERA-Interim wind data for the 20-year time interval from January 1999 to December 2018.
Figure 6.
Monthly distribution of the U80 parameter (average values) reported by the ERA-Interim wind data for the 20-year time interval from January 1999 to December 2018.

Figure 7.
The downtime interval (%) corresponding to different cut-in values, where: (a) 3 m/s; (b) 3.5 m/s; (c) 4 m/s; (d) 5 m/s. The dotted line is located at approximately 50 km from the shoreline.
Figure 7.
The downtime interval (%) corresponding to different cut-in values, where: (a) 3 m/s; (b) 3.5 m/s; (c) 4 m/s; (d) 5 m/s. The dotted line is located at approximately 50 km from the shoreline.

Figure 8.
The rated capacity (%) reported for different rated wind speeds.

Figure 9.
Annual electricity production (GWh) reported for the full time distribution, considering the sites: (a) Atyrau; (b) Baku. The points are located at a distance of 5 km from the shoreline.
Figure 9.
Annual electricity production (GWh) reported for the full time distribution, considering the sites: (a) Atyrau; (b) Baku. The points are located at a distance of 5 km from the shoreline.

Figure 10.
The capacity factor (%) reported for the full time distribution, considering the sites: (a) Atyrau; (b) Baku. The points are located at a distance of 5 km from the shoreline.
Figure 10.
The capacity factor (%) reported for the full time distribution, considering the sites: (a) Atyrau; (b) Baku. The points are located at a distance of 5 km from the shoreline.

Figure 11.
The suitability map for wind power with an average wind speed of 6 m/s as a reference. The results are indicated for: (a) full time distribution; (b) winter time.
Figure 11.
The suitability map for wind power with an average wind speed of 6 m/s as a reference. The results are indicated for: (a) full time distribution; (b) winter time.

Figure 12.
The classification of the wind turbines selected for the sites Atyrau and Baku, taking into account the power output per swept area. The results are grouped as follows: (a,b) small (3–4.2 MW); (c,d) medium (5–6.2 MW); (e,f) large (7–8.8 MW).
Figure 12.
The classification of the wind turbines selected for the sites Atyrau and Baku, taking into account the power output per swept area. The results are grouped as follows: (a,b) small (3–4.2 MW); (c,d) medium (5–6.2 MW); (e,f) large (7–8.8 MW).

Figure 13.
LCOE assessment considering the reference sites located at 5 km from the shore. The results were grouped in small, medium and large systems (a–c) including a detailed view of the values reported by the sites Atyrau, Aktau and Turkmenbasy (a1–c1). All the turbines were evaluated for an 80 m hub height.


Table 1.
The main characteristics of the considered sites located at a distance of 5 km from shore.
| No. | Site | Country | Long (o) | Lat (o) | Water Depth (m) |
|---|---|---|---|---|---|
| P1 | Atyrau | Kazakhstan | 51.745 | 46.680 | 30 |
| P2 | Aktau | Kazakhstan | 51.101 | 43.615 | 46 |
| P3 | Türkmenbasy | Turkmenistan | 52.714 | 39.994 | 50 |
| P4 | Babolsar | Iran | 52.643 | 36.759 | 48 |
| P5 | Nowshahr | Iran | 51.492 | 36.705 | 56 |
| P6 | Anzali | Iran | 49.512 | 37.519 | 52 |
| P7 | Astara | Iran | 48.938 | 38.425 | 38 |
| P8 | Baku | Azerbaijan | 49.889 | 40.324 | 37 |
| P9 | Makhachkala | Russia | 47.584 | 42.997 | 41 |
| P10 | Olya | Russia | 48.136 | 45.269 | 30 |
Table 2.
The main characteristics of the wind turbines considered [31].
Table 2.
The main characteristics of the wind turbines considered [31].
| Turbine | Rated Power (MW) | Cut-in Speed (m/s) | Rated Speed (m/s) | Cut-out Speed (m/s) | Diameter (m) | Hub Height (m) |
|---|---|---|---|---|---|---|
| Vestas V90-3.0 | 3 | 3.5 | 15 | 25 | 90 | 65–105 |
| Vestas V112-3.45 | 3.45 | 3 | 13 | 25 | 112 | 84 |
| Siemens SWT-3.6-120 | 3.6 | 3.5 | 12 | 25 | 120 | 90 |
| Siemens SWT-3.6-107 | 3.6 | 4 | 13.5 | 25 | 107 | 80 or site specific |
| Siemens SWT-4.0-130 | 4 | 5 | 12 | 25 | 130 | 89.5 |
| Envision EN 136-4.2 | 4.2 | 3 | 10.5 | 25 | 136 | 80/90/110 |
| Areva M5000-116 | 5 | 4 | 12.5 | 25 | 116 | site specific |
| Adwen AD 5-135 | 5.05 | 3.5 | 11.4 | 30 | 135 | site specific |
| Siemens SWT-6.0-154 | 6 | 4 | 13 | 25 | 154 | site specific |
| Senvion 6.2M126 | 6.15 | 3.5 | 14 | 30 | 126 | 85/95 |
| Siemens SG 7.0-154 | 7 | 3 | 13 | 25 | 154 | site specific |
| Siemens SG 8.0-167 | 8 | 3 | 12 | 25 | 167 | site specific |
| Vestas V164-8.0 | 8 | 4 | 13 | 25 | 164 | 105/140 |
| Vestas V164-8.8 | 8.8 | 4 | 13 | 25 | 164 | site specific |
Table 3.
The top five downtimes sorted in an ascending order (corresponding to a 3 m/s cut-in value).
Table 3.
The top five downtimes sorted in an ascending order (corresponding to a 3 m/s cut-in value).
| Distance to Shore | Site (%) | ||||
|---|---|---|---|---|---|
| 5 km | Atyrau (20.76) | Olya (21.28) | Aktau (25.97) | Türkmenbasy (29.47) | Makhachkala (36.01) |
| 25 km | Atyrau (20.31) | Olya (20.49) | Aktau (24.92) | Türkmenbasy (30.62) | Makhachkala (30.75) |
| 50 km | Olya (19.89) | Atyrau (20.11) | Aktau (24.56) | Makhachkala (27.32) | Türkmenbasy (34.40) |
Table 4.
The top five rated capacities sorted in a descending order (reported to a 13 m/s rated speed).
Table 4.
The top five rated capacities sorted in a descending order (reported to a 13 m/s rated speed).
| Distance to Shore | Site (%) | ||||
|---|---|---|---|---|---|
| 5 km | Olya (14.70) | Atyrau (13.17) | Aktau (7.61) | Türkmenbasy (5.30) | Makhachkala (1.34) |
| 25 km | Olya (16.65) | Atyrau (14.09) | Aktau (9.59) | Türkmenbasy (5.30) | Makhachkala (3.77) |
| 50 km | Olya (17.81) | Atyrau (14.50) | Aktau (10.38) | Makhachkala (6.25) | Türkmenbasy (3.96) |
© 2019 by the authors. Licensee MDPI, Basel, Switzerland. This article is an open access article distributed under the terms and conditions of the Creative Commons Attribution (CC BY) license (http://creativecommons.org/licenses/by/4.0/).
Share and Cite
MDPI and ACS Style
Onea, F.; Rusu, E. An Assessment of Wind Energy Potential in the Caspian Sea. Energies 2019, 12, 2525. https://doi.org/10.3390/en12132525
AMA Style
Onea F, Rusu E. An Assessment of Wind Energy Potential in the Caspian Sea. Energies. 2019; 12(13):2525. https://doi.org/10.3390/en12132525
Chicago/Turabian StyleOnea, Florin, and Eugen Rusu. 2019. "An Assessment of Wind Energy Potential in the Caspian Sea" Energies 12, no. 13: 2525. https://doi.org/10.3390/en12132525
Note that from the first issue of 2016, this journal uses article numbers instead of page numbers. See further details here.