Article

Adsorption Capacity of Organic Compounds Using Activated Carbons in Zinc Electrowinning

1
Center for Plant Engineering, Institute for Advanced Engineering, Yongin-si 17180, Korea
2
WESCO Electrode, Changwon-si, Gyeongsangnam-do 642370, Korea
*
Author to whom correspondence should be addressed.
Energies 2019, 12(11), 2169; https://doi.org/10.3390/en12112169
Submission received: 7 May 2019 / Revised: 29 May 2019 / Accepted: 3 June 2019 / Published: 6 June 2019

Abstract

:
The influence of adsorbate (D2EPHA and kerosene) on the process of zinc electrowinning from sulfuric acid electrolytes was analyzed. The main objective was to critically compare three factors: (1) Three types of activated carbon (AC); (2) adsorption temperatures and contact time; and (3) zinc recovery efficiency. The results showed that organic components reduced the efficiency of zinc recovery. Moreover, wood-based ACs had a higher adsorption capacity than coal- and coconut-based ACs. To maintain a removal efficiency of 99% or more, wood-based ACs should constitute at least 60% of the adsorbate. The temperature of adsorption did not affect the removal efficiency. Additionally, the feeding rate of adsorbate in the solvent was inversely proportional to the removal efficiency. A feeding rate of the liquid pump of over 3 mL/min rapidly increased the delta pressure. For the same contact time, 99% of adsorbate removal occurred at 1 mL/min compared to approximately 97% at 0.5 mL/min. In the presence of 100 mg/L zinc, with increasing adsorbate from 0–5%, the recovery efficiency of zinc decreased from 100% to 0% and the energy consumption increased from 0.0017–0.003 kwh/kg zinc. Considering the energy consumption and zinc deposit mass, 0.1% of the adsorbate is recommended for zinc electrowinning.

1. Introduction

Electrowinning (EW) of rare metals, such as zinc (Zn), copper (Cu), and manganese (Mg), has been widely used due to its low energy consumption and high output [1,2,3,4,5]. The process of Zn electrowinning is conducted in several stages, including solvent extraction (organic mixing and separation), Zn removal, and electrolytic winning [6,7]. Solvent extraction is a particularly important unit operation in the purification and concentration of these materials. Several researchers have studied solvent extraction from an aqueous leaching solution using organic extractants [6,7,8,9,10,11,12,13,14]. Generally, the extraction of Zn and selected base metal and alkali cations to produce organophosphorus-based extractants; i.e., phosphoric-acid extractants (de(2-ethylhexyl)phosphoric acid(D2EHPA), phosphonic-acid extractant (Ionquest 801), and phosphinic-acid extractants (CYANEX 272), depends on the pH, O/A phase ratio, and concentration. At first, Devi et al. investigated the extraction of Zn from sulphate solution using sodium salts in kerosene and compared the effect of pH, extraction concentration and various sodium salts [11]. Among the organophosphorus-based extractants, D2EHPA has shown the best extraction efficiency for increasing Zn impurities [11,14,15]. The effects of several parameters on Zn extraction from phosphoric acid solution were found to have the following order of importance: D2EHPA concentration > equilibrium pH > O/A phase ratio [16].
The presence of organophosphorus-based extractants decreases metal impurities, including the concentration of Zn [17]. Ivanov’s research group focused on Zn impurities through the addition of inhibitors during electrowinning [18,19]. They reported that the addition of inhibitors to the electrolytes caused Zn re-dissolution. For this reason, it is necessary to explore effective methods for the efficient removal of organic components in sulfuric acid solvent components to improve the Zn electrowinning process. The adsorption of organic components from sulfuric acid by carbon has been studied for several decades and is becoming more widespread, due to large surfaces and strong adsorption [19,20,21,22]. Hydrophobic carbons are more effective adsorbents for trichloroethene (TCE) and methyl tertiary-butyl ether (MTBE) than hydrophilic carbons because enhanced water adsorption on the latter interferes with the adsorption of micropollutants from solutions containing natural organic matter [22]. Among all types of carbon, activated carbon (AC) is generally considered to have a strong adsorption affinity for organic chemicals, due to their highly hydrophobic surfaces. With respect to pore structure, optimal AC should exhibit a large volume of micropores approximately 1.5 times the kinetic diameter of the target adsorbate [22].
Therefore, in order to determine an efficient removal method of organic components in sulfuric acid solvent components, it is necessary to determine the uppermost limit of organic compounds that will not affect the Zn electrowinning efficiency. Therefore, this study has three principle objectives: (1) To compare the performance of three types of AC as an adsorbent; (2) to investigate the effects of adsorption temperature and contact time; and (3) to determine the efficiency of Zn recovery with organic components.

2. Materials and Methods

2.1. Adsorbate

The D2EHPA extractants were provided by Mining Chem Co., Ltd., Seoul, Korea, and dissolved in treated kerosene (ESCAID 110). The kerosene used as the diluent in this study was a commercial ESCAID 110 product from Minning CAM. We prepared 2M D2EPHA using kerosene (the ratio of D2EPHA and kerosene was 7:3). The extractants were added to the electrolytes in various proportions from 0.00% to 5.00% in sulfuric acid as an electrolyte.

2.2. Activated Carbons (ACs) as Adsorbents

The commercially ACs were obtained adsorbents, as shown in Table 1. To compare the ACs, wood-based AC (Wood-AC, JCG-10, Ja Yeon Science Ind. Co., Chulwon, Korea), coal-based AC (Coal-AC, NCL, Neven Ind. Co., Pohang, Korea), and coconut-based AC (Coconut-AC, Ya-1, Yeon Science Ind. Co., Chulwon, Korea) were tested. Before adsorption, ACs was dried at 110 °C and stored in a desiccator.
The most common AC characteristics reported in previous adsorption literature are its specific surface area, total pore volume, and micropore volume. Surface area and total pore volume were determined from N2 isotherm data collected at 196 °C, which were measured using an adsorption analyzer (ASAP-2010, Micromeritics Inc., Norcross, GA, USA). The Brunauer-Emmet-Teller (BET) theory was used to determine the specific surface area and the total pore volume was calculated from the amount of N2 gas adsorbed at a relative pressure of 0.95. The Horváth–Kawazoe (HK) method was applied to calculate the micropore volume. Prior to analysis, AC samples were outgassed overnight at 110 °C.
For the proximate analysis, dried samples were placed in a furnace (Daeheung Science, DF-4S, Incheon, Korea) and heated at 950 °C for 7 min. The weight of the samples was measured to determine the volatile matter content. The samples were placed in the furnace again and heated at 750 °C for 10 h to measure the amount of ash. The ash, volatile matter, and fixed C contents within the ACs were reported as a weight percentage. Elemental contents of carbon (C), hydrogen (H), oxygen (O), nitrogen (N), and sulfur (S) were determined with an elemental analyzer (FLASH 2000, Thermo Fisher Scientific, Waltham, MA, USA).

2.3. Adsorption Test

We compared the continuous stirred tank reactor (CSTR) and the packed bed reactor (1PBR and 2PBR) adsorption methods, as shown in Table 2. For the CSTR method, 100 mL solvent of 3 M H2SO4 was added to the AC adsorbate and stirred for 1 h at 300 rpm. After filtration, we analyzed the organic components. For the PBR method, 0.5–1.5 g of AC was loaded into a ¼-inch glass reactor and the solvent was fed using a liquid pump (Model 781100, KD Scientific, Holliston, MA, USA). The flow rate was set to 0.5, 1.0, 3.0, and 5.0 mL/min.

2.4. Adsorbate Analysis

2.4.1. n-Hexane Extraction

The adsorbate was extracted with 100 mL of solvent and shaken twice over 5 min. After separation, the extracted adsorbate in n-Hexane was boiled at 80 °C. The adsorbate contents yielded was expressed in terms of the mass percentage of the samples. The extracted adsorbate yield can be estimated using the following Equation (1),
Extracted   Adsorbate   Yield   ( wt . % ) = Mass   of   extracted   adsorbate   ( g ) Mass   of   adsorbate   ( g ) × 100

2.4.2. Total Organic Carbon (TOC)

Total organic carbon (TOC) was evaluated using TOC cell kits (Merck, Darmstadt, Germany) which is analogous to the APHA 5310 C (2014) method. Ten milliliters of the sample was prepared for the TOC analysis. The solution was pretreated with a reagent containing sulfuric acid according to the specifications of the Merck kits, titrated to pH 2.2–2.3, and stirred at a low speed for 10 min. In order to remove a small amount of AC, filtration was carried out with a 0.2-μm syringe filter. Three milliliters of sample was added to the cell kit. Immediately after treatment with a reagent containing peroxydisulfate, the cell was tightly closed with an aluminum crew cap then stood upside down and heated at 120 °C using a heating block for 2 h. After cooling for 1 h, it was analyzed by Spectroquant® (Merck, Kenilworth, NJ, USA).

2.5. Characterization of Electrodes

Zn electrowinning experiments were conducted in 3 M H2SO4 solution with adsorbate using ZIVE (MP2PC) from WonA Tech. (Seoul, Korea). The cell consisted of an aluminum anode (2 × 2.5 cm2) and Pd-Ir-Sn-Ta/TiO2 cathode (2 × 2.5 cm2). The anode–cathode distance was 3 cm, as shown in Figure 1a. A commercial electrode, 8.6 g Pd-Ir-Sn-Ta/TiO2, was purchased from West Co. (Changwon-si, Korea) and the substrate was an aluminum plate. The metal composition was obtained using energy-dispersive X-ray analysis (EDAX, Inspect F50, Thermo Fisher Scientific, Waltham, MA, USA) and the electrode compositions of Pd, Ir, Sn, and Ta were 8.6, 39.9, 18.5, and 33.0% [23]. The thickness of coating materials was 7.6~8.8 um and is well dispersed, as shown in Figure 1b,c.
For the Zn electrowinning, the electrolyte (100 g/L Zn and 3 M H2SO4) was prepared using sulfuric acid and zinc oxide. After electrolyte preparation, the adsorbate was added in proportions from 0.0–5.0%. The electrowinning reactor consisted of a 1 l double jacket, so a reaction temperature of 40 °C was maintained using bath circulator throughout. The electrowinning measurements were carried out at a current density of 500 A/dm2 for 4 h.

3. Results and Discussion

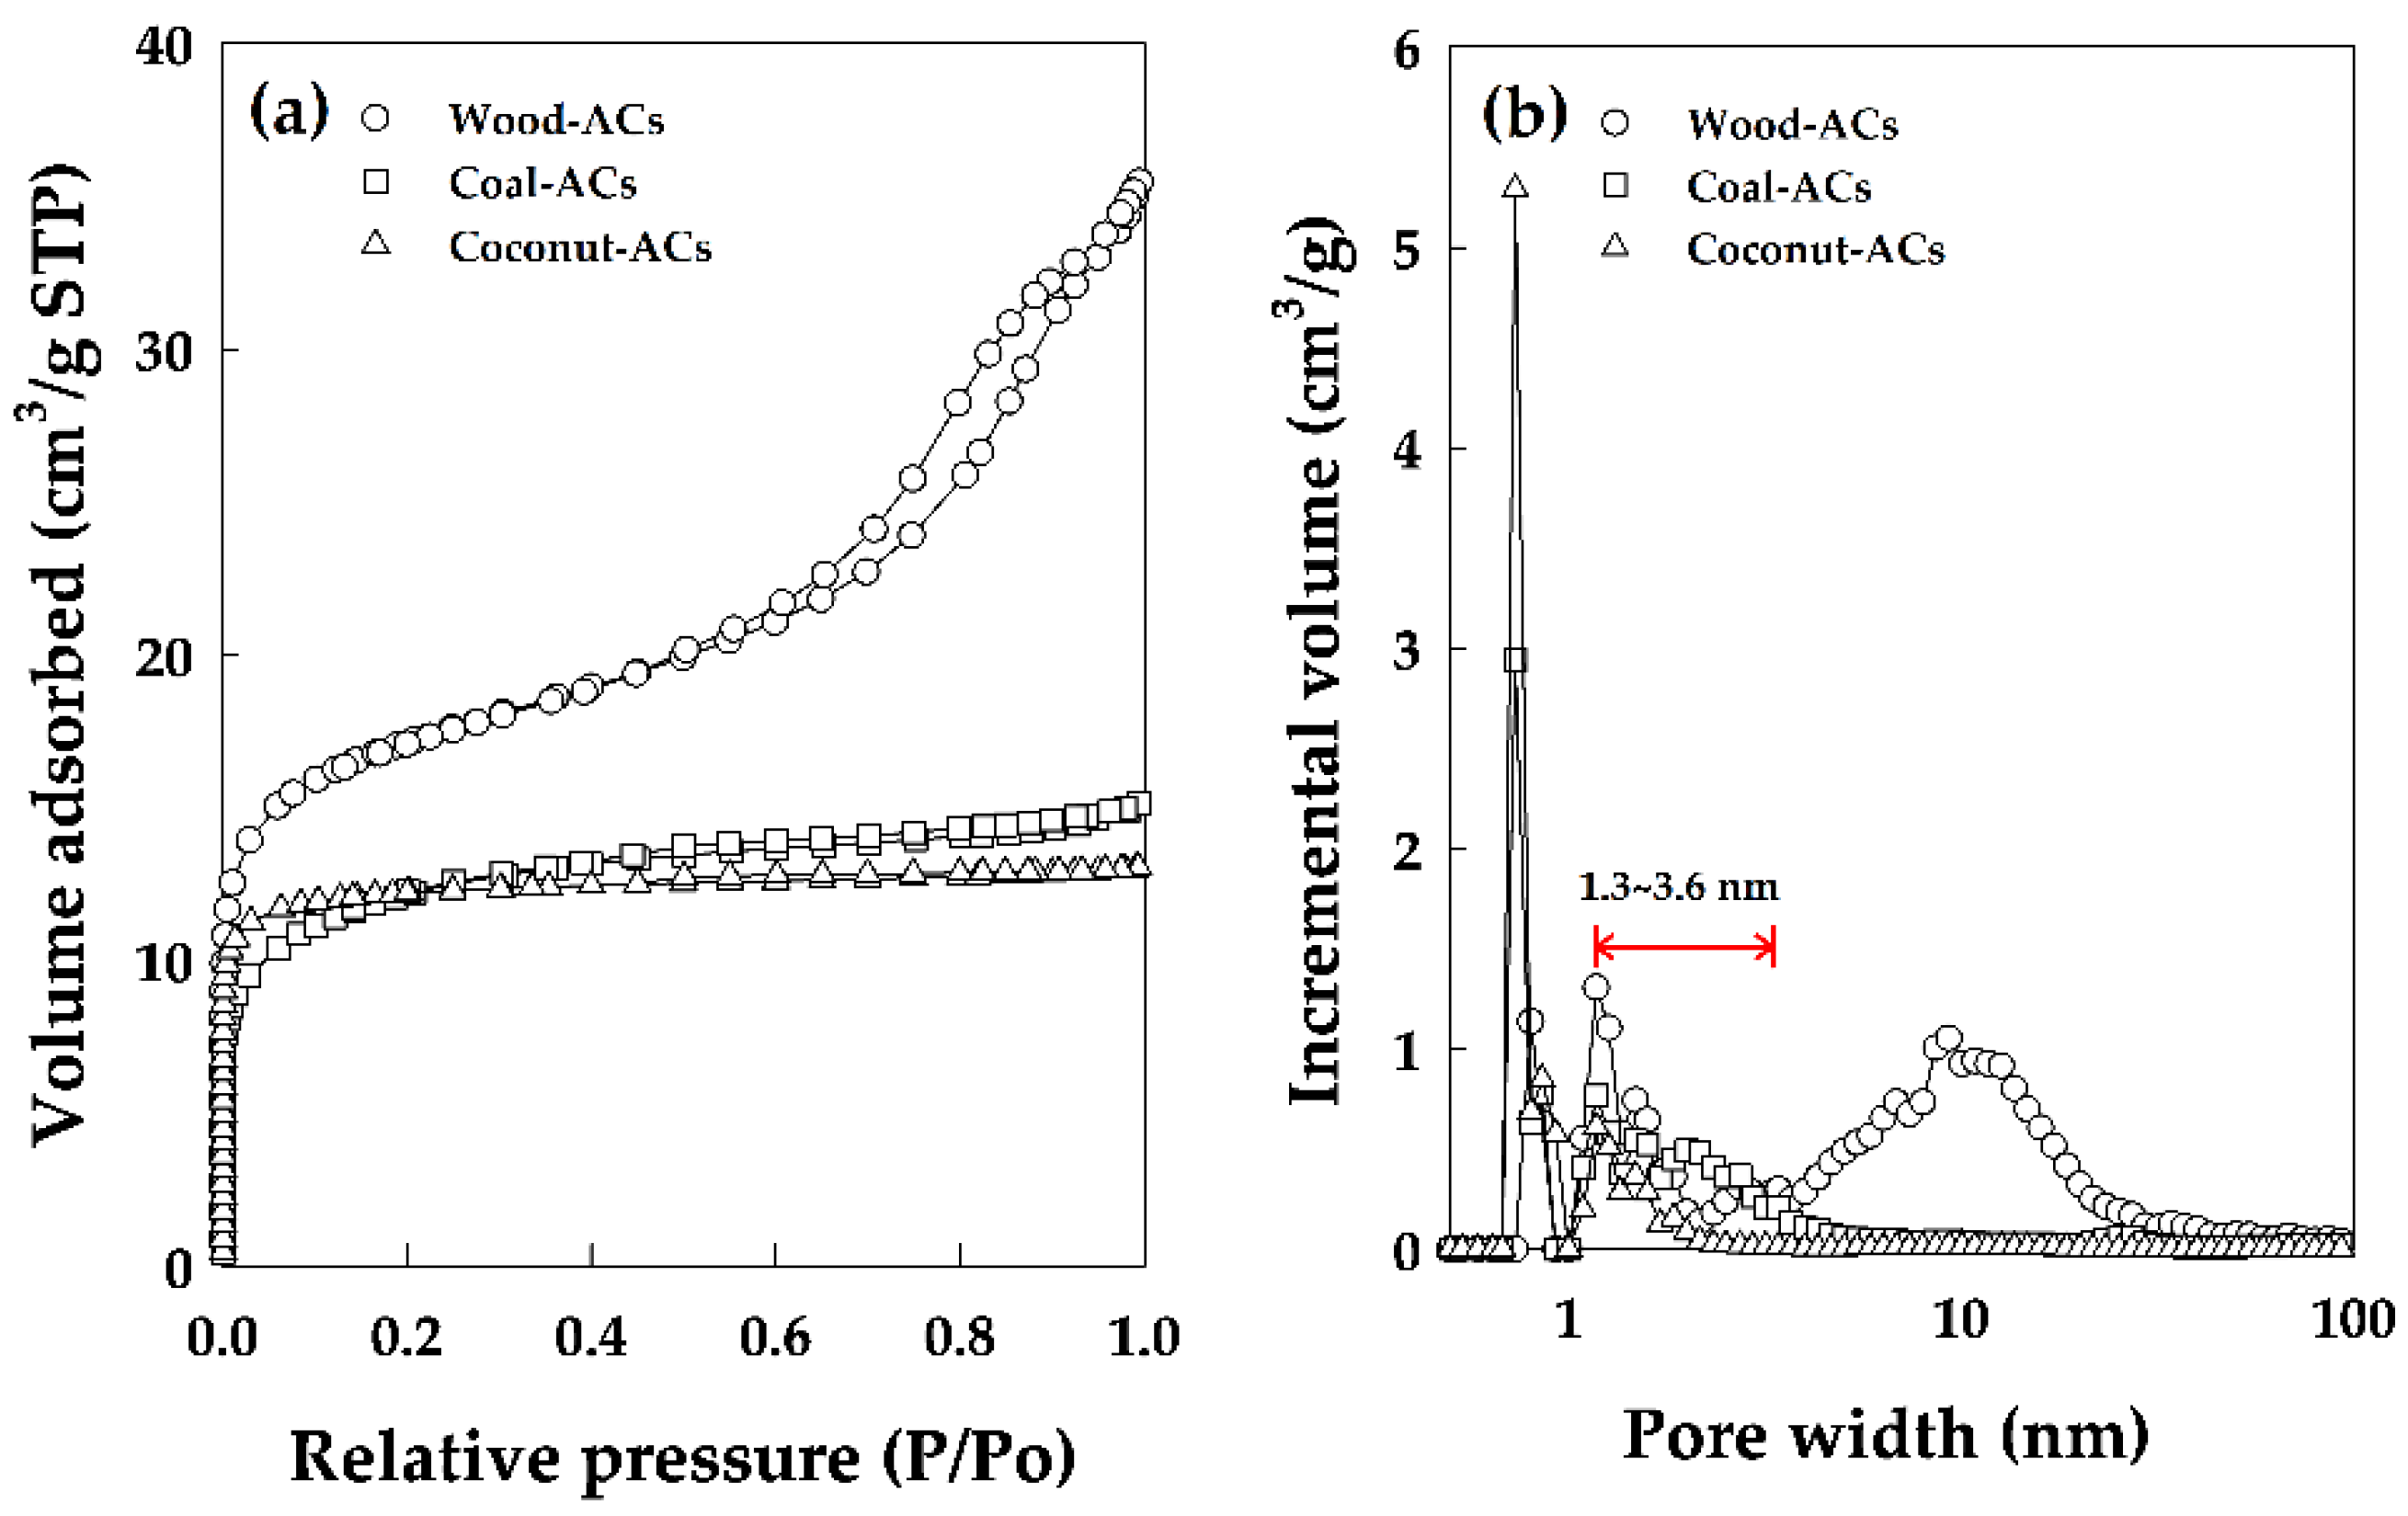
3.1. Characterization of ACs

A list of ACs and their surface area, total pore volume, and micropore size values are presented in Table 1. Wood-AC had high volatile and ash matter content and low moisture content. According to the ultimate analysis, the carbon content of Coconut-ACs was higher than that of Coal-ACs and Wood-ACs. Moreover, the oxygen content decreased in the following order: Wood-ACs > Coconut-AC > Coal-AC (Table 1). All three commercial ACs contained approximately zero sulfur, decreasing the potential for acid species formation.
Figure 2 shows the adsorption/desorption isotherms of nitrogen obtained for all three ACs analyzed in this study. N2 adsorption and desorption isotherms of Wood-ACs followed the trend of type IV isotherms (Figure 2a), whereas the isotherms of Coal-ACs and Coconut-ACs belonged to type I isotherms according to the IUPAC classification.
Furthermore, Figure 2b illustrates the pore size distribution of ACs. The pore widths of Wood-ACs were higher than those of Coal-ACs and Coconut-ACs (Table 1). The surface area of Wood-ACs was higher than that of Coal-ACs and Coconut-ACs. Total pore volume and micropore size (<2 nm) decreased in the following order: Wood-ACs > Coal-ACs ≥ Coconut-ACs. In addition, the percentages of mesopores (2–50 nm) for Wood-ACs, Coal-ACs, and Coconut-ACs were 85, 13, and 4%, respectively.

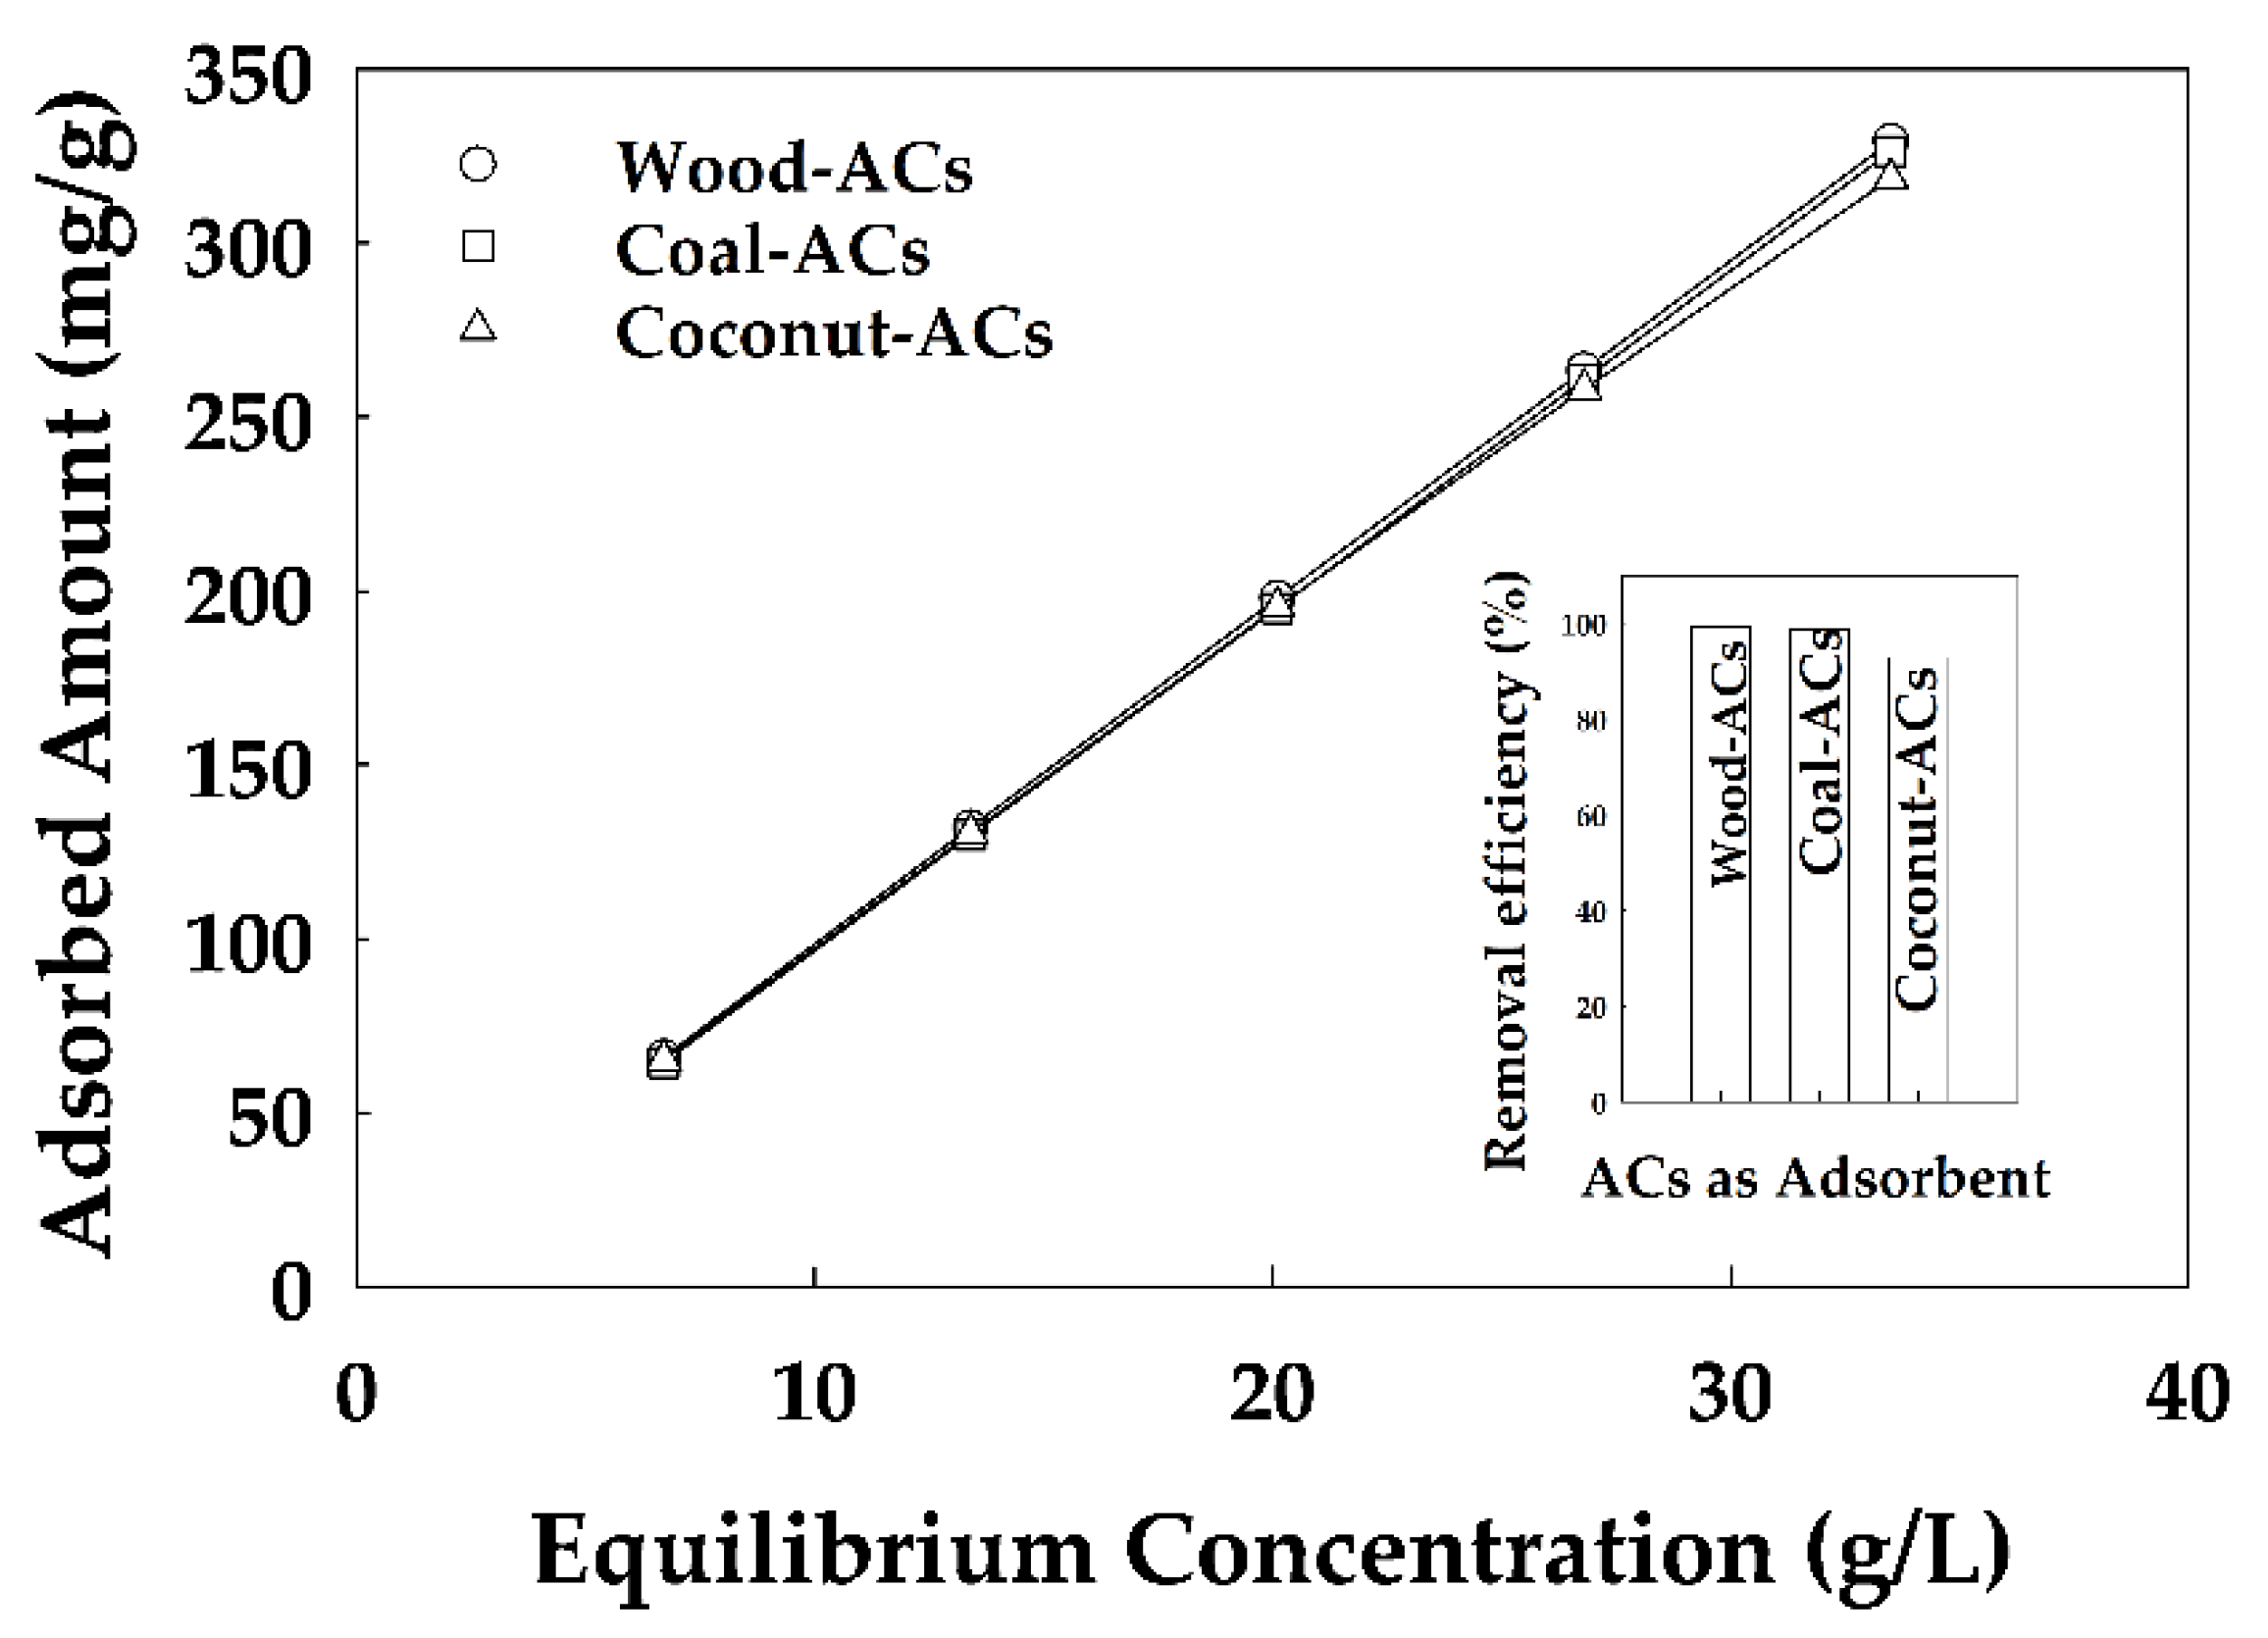
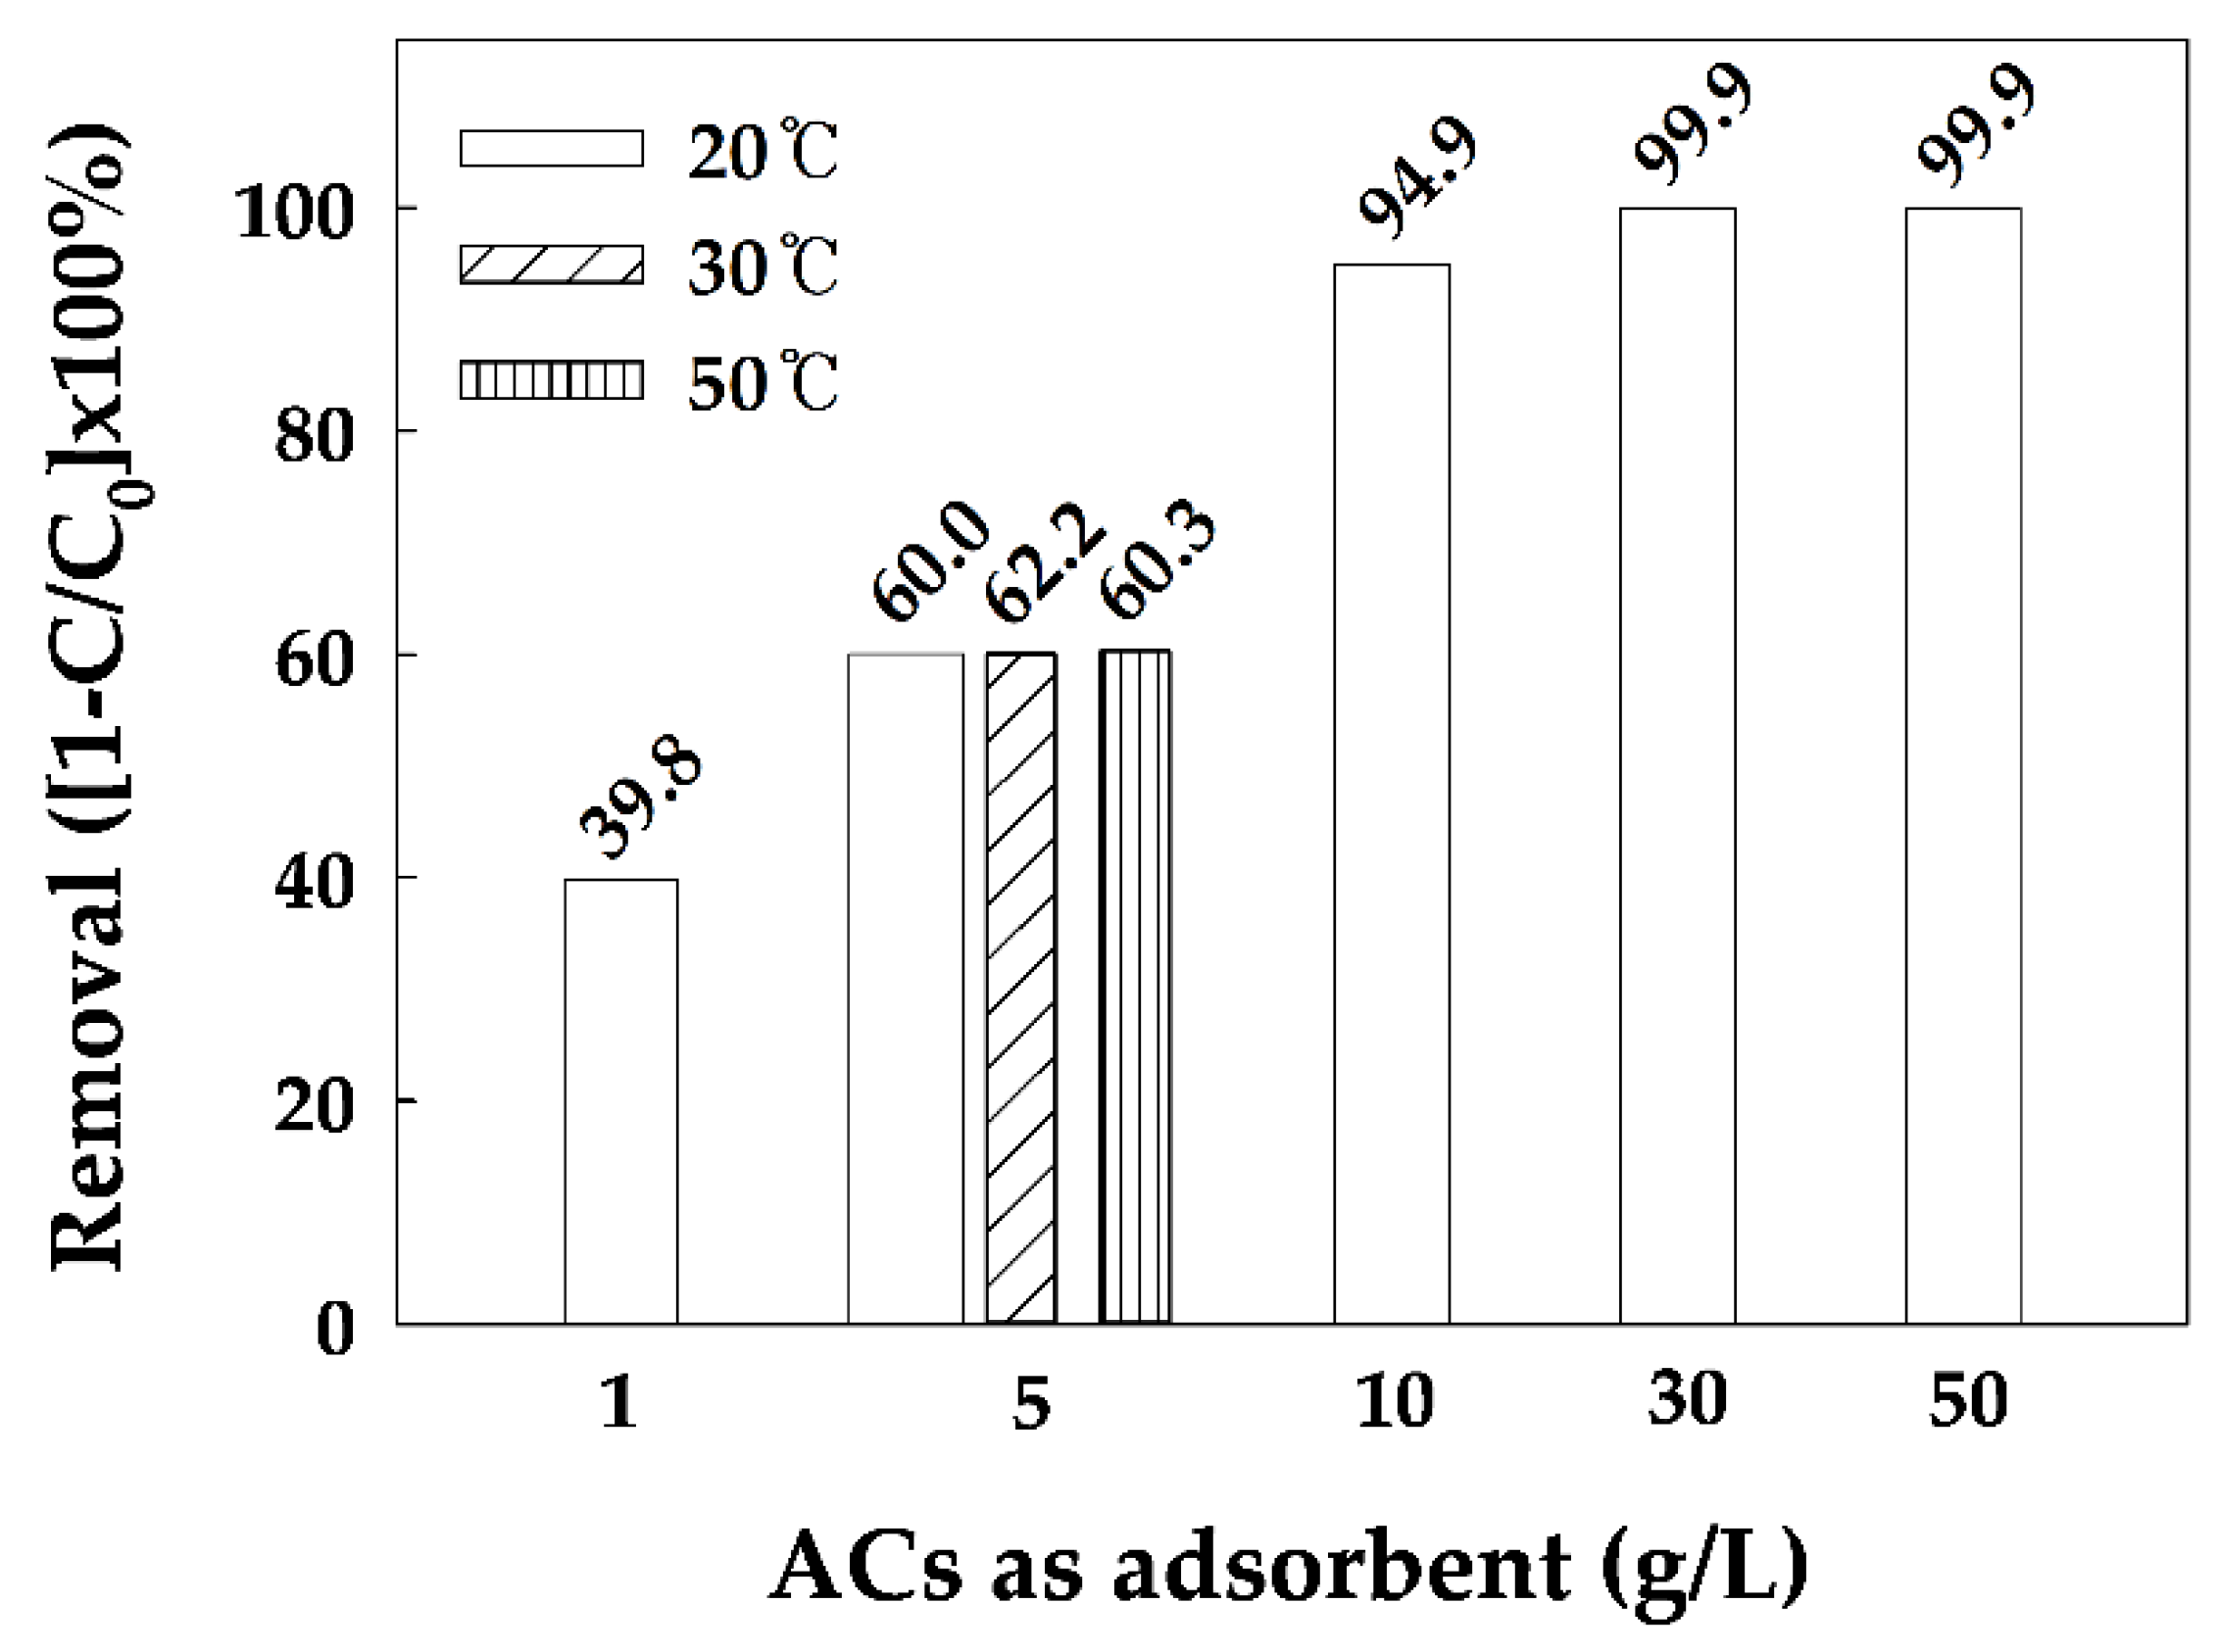
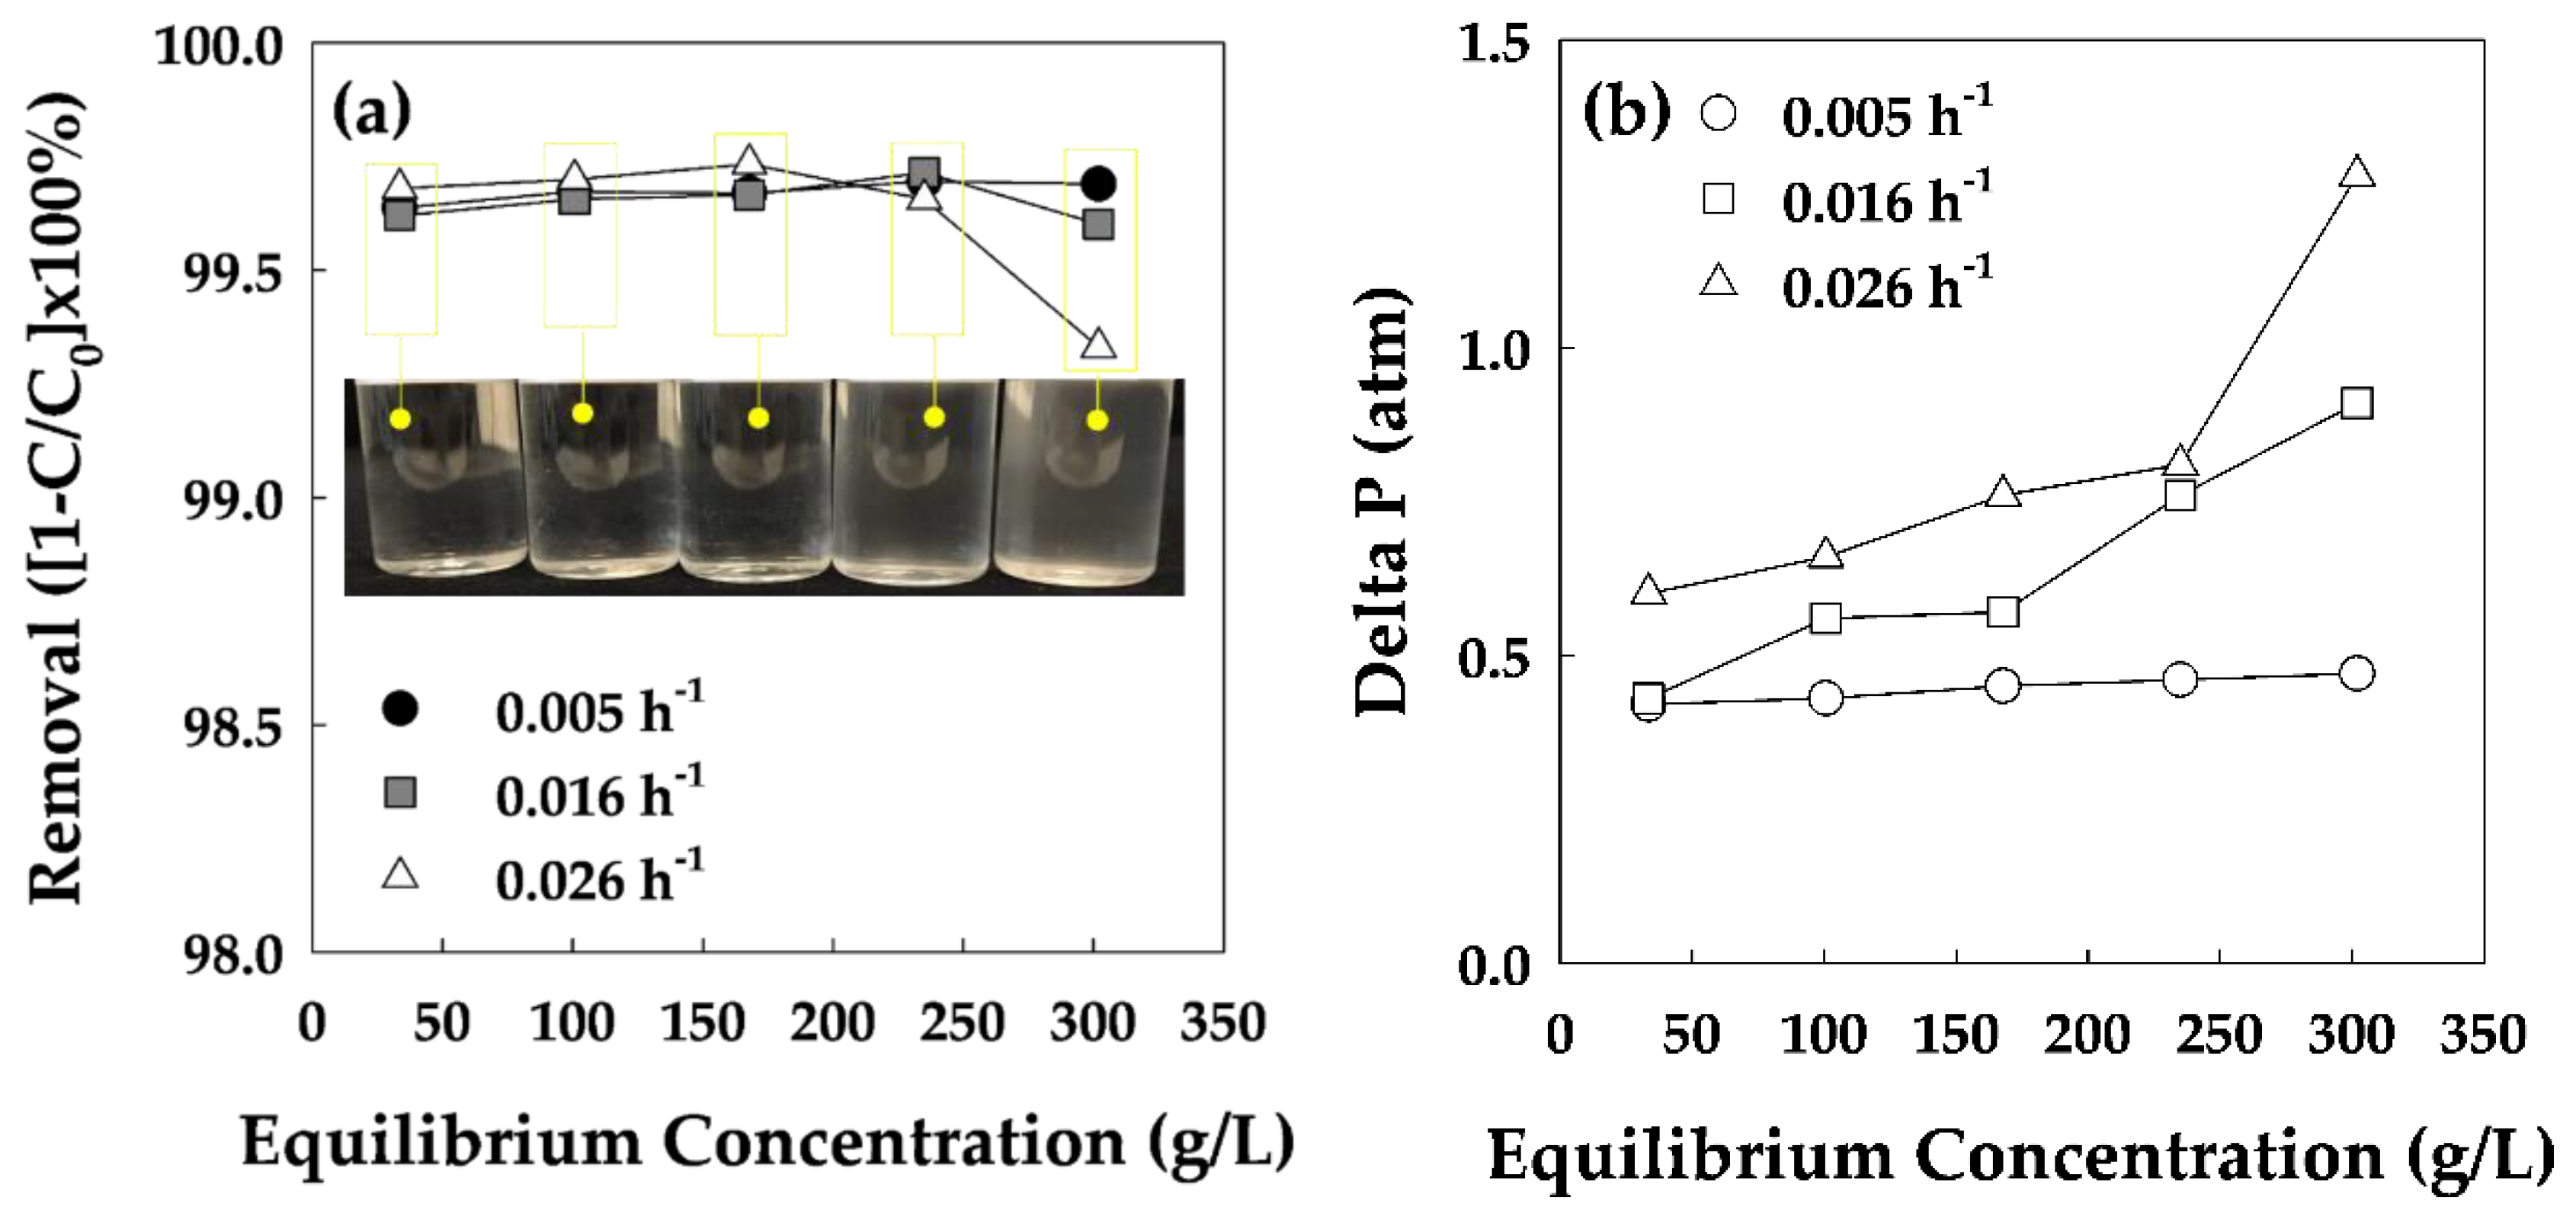
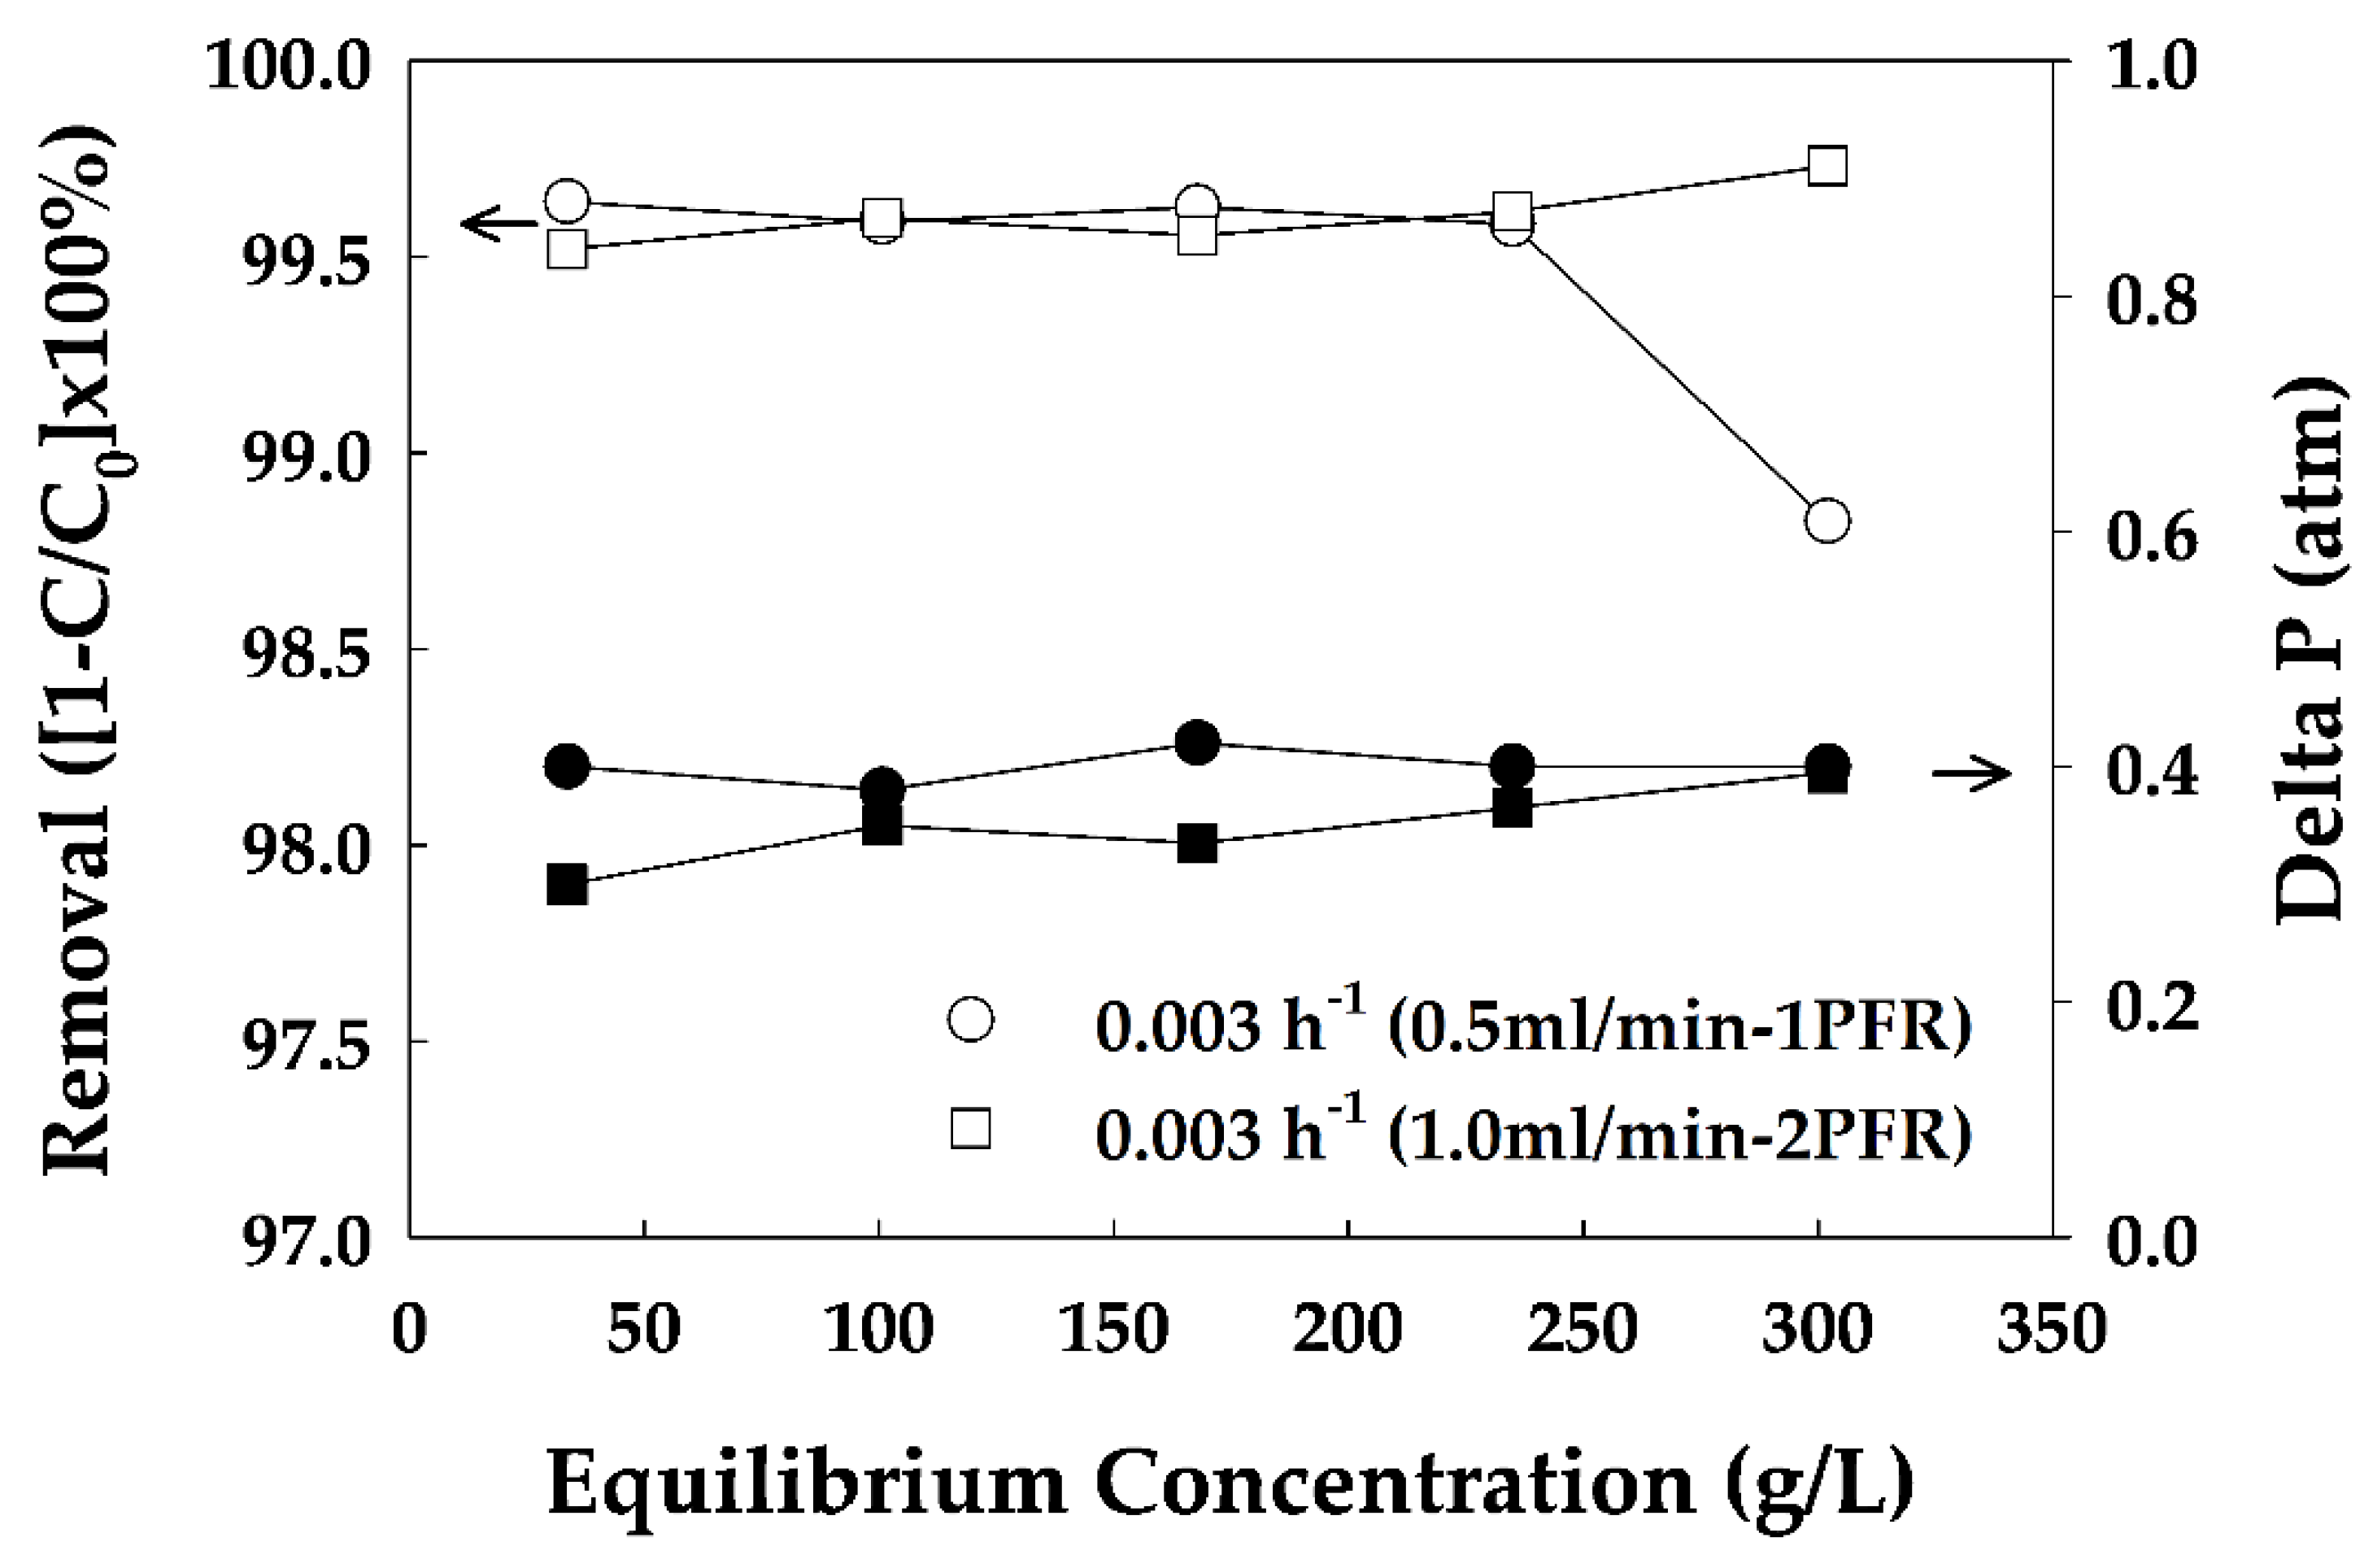
3.2. Adsorbate Removal Efficiency

To evaluate the effect of AC types (Wood-ACs, Coal-ACs, and Coconut-ACs) on adsorption capacities in the presence of adsorbate, we conducted an adsorbate test. As shown in Table 3, the adsorbate adsorption capacities of Wood-ACs, Coal-ACs, and Coconut-ACs were 99%, 98%, and 93%, respectively, with Wood-ACs exhibiting the largest adsorption capacity for adsorbate, including the highest BET surface area and total pore volume. Quinlivan et al. compared the effects of physical and chemical activated carbon on adsorption capacities; they exhibited a large volume of micropores with widths approximately 1.3 to 1.8 times larger than the kinetic diameter of the target adsorbent [22]. Considering the molecular weight of D2EPHA and kerosene as the adsorbate, the pore diameter is predicted to be at least 10 A to 20 A [24,25]. AC, which is effective at adsorbing organic matter, has a large number of pores with diameters of at least 13 A to 36 A. Therefore, the large surface area and mesopore volume of Wood-ACs indicates their high removal efficiency.
Apart from textual characteristics, the behavior of ACs is often strongly influenced by oxygen, which affects the surface hydrophobicity [19,26,27,28,29]. The surface hydrophobicity of carbon materials plays an important role in interface and colloid science. An increase in the oxygen content of carbon leads to a decrease in its hydrophobicity. Thus, the adsorption of adsorbate on ACs (Coal-ACs and Coconut-ACs) decreased when the oxygen content of the carbonaceous adsorbent increased.
The removal efficiency of adsorbate components was analyzed in detail using the PBR system. The removal efficiency trends for the PBR system were the same as those of the CSTR system; Wood-ACs > Coal-ACs > Coconut-ACs. When adsorbing 600 mg of adsorbate, Wood-ACs exhibited residual adsorbate values of 5.7 mg, whereas Coal-ACs and Coconut-ACs showed residual adsorbate values of 8.6 mg and 16.5 mg, respectively.
Among the ACs, Wood-ACs showed the highest removal efficiency of adsorbate (Figure 3). Therefore, we compared the removal efficiency of adsorbate for the different weights of Wood-AC (0.1 g to 5.0 g). As shown in Figure 4, the removal efficiency of adsorbate depended on the ratio of adsorbents; the removal efficiency increased with decreasing adsorbate components. It should be noted that the removal efficiency results show a very good correlation. Using the n-Hexane method, ACs should utilize at least 60% of the sorbent to remove 99% of the adsorbate before the AC breaking point occurs.
Generally, the adsorption temperature is thought to be important in the gas phase. However, an adequate adsorption temperature has yet to be proven in the liquid phase for ACs. To assess the effect of adsorption temperature on the adsorbent, Figure 4 compares the removal efficiency of Wood-AC adsorbate at three temperatures (from 20–50 °C). Absorption of the adsorbate within this temperature range is included within the error range. In previous research, they compared the adsorption isotherms of diclofenac onto ACs at different operation temperature (30–60 °C). The mass of adsorbed diclofenac was less dependent on the temperature at high concentration of diclofenac [30].
We also investigated the influence of flow rate, removal efficiency, and delta pressure (P) at a liquid hourly space velocity (LHSV) of 0.005–0.026 h−1. As shown in Figure 5, the adsorbate adsorption capacities were largest at lower space velocity; i.e., 0.005 h−1 > 0.016 h−1 > 0.026 h−1. Moreover, the space velocity increased with increasing delta P. To achieve 99.5% adsorbate removal from Wood-ACs, a space velocity of approximately 0.016 h−1 was required. However, delta P should be maintained under 1 atm at the adsorption condition; otherwise, the elimination efficiency of the adsorbate is reduced, and the adsorbate adsorbed onto the surface of ACs is thought to be detoxified.
To design the factors of the adsorption system, we experimentally compared the efficiency of adsorbate removal under the same space velocity conditions. The first reaction condition supplied the adsorbate at 0.5 mL/min and employed 1PBR. The second reaction condition supplied the adsorbate at 1.0 mL/min and employed 2PBR.
According to the results, up to 250 g/L of equilibrium concentration was adsorbed under both conditions. However, differences appeared in the removal efficiency of the adsorbate at greater than 250 g/L of equilibrium concentration (Figure 6). Therefore, in order to effectively eliminate the adsorbate, it is more effective to increase the number of PBR than to regulate the supply speed of the adsorbate.

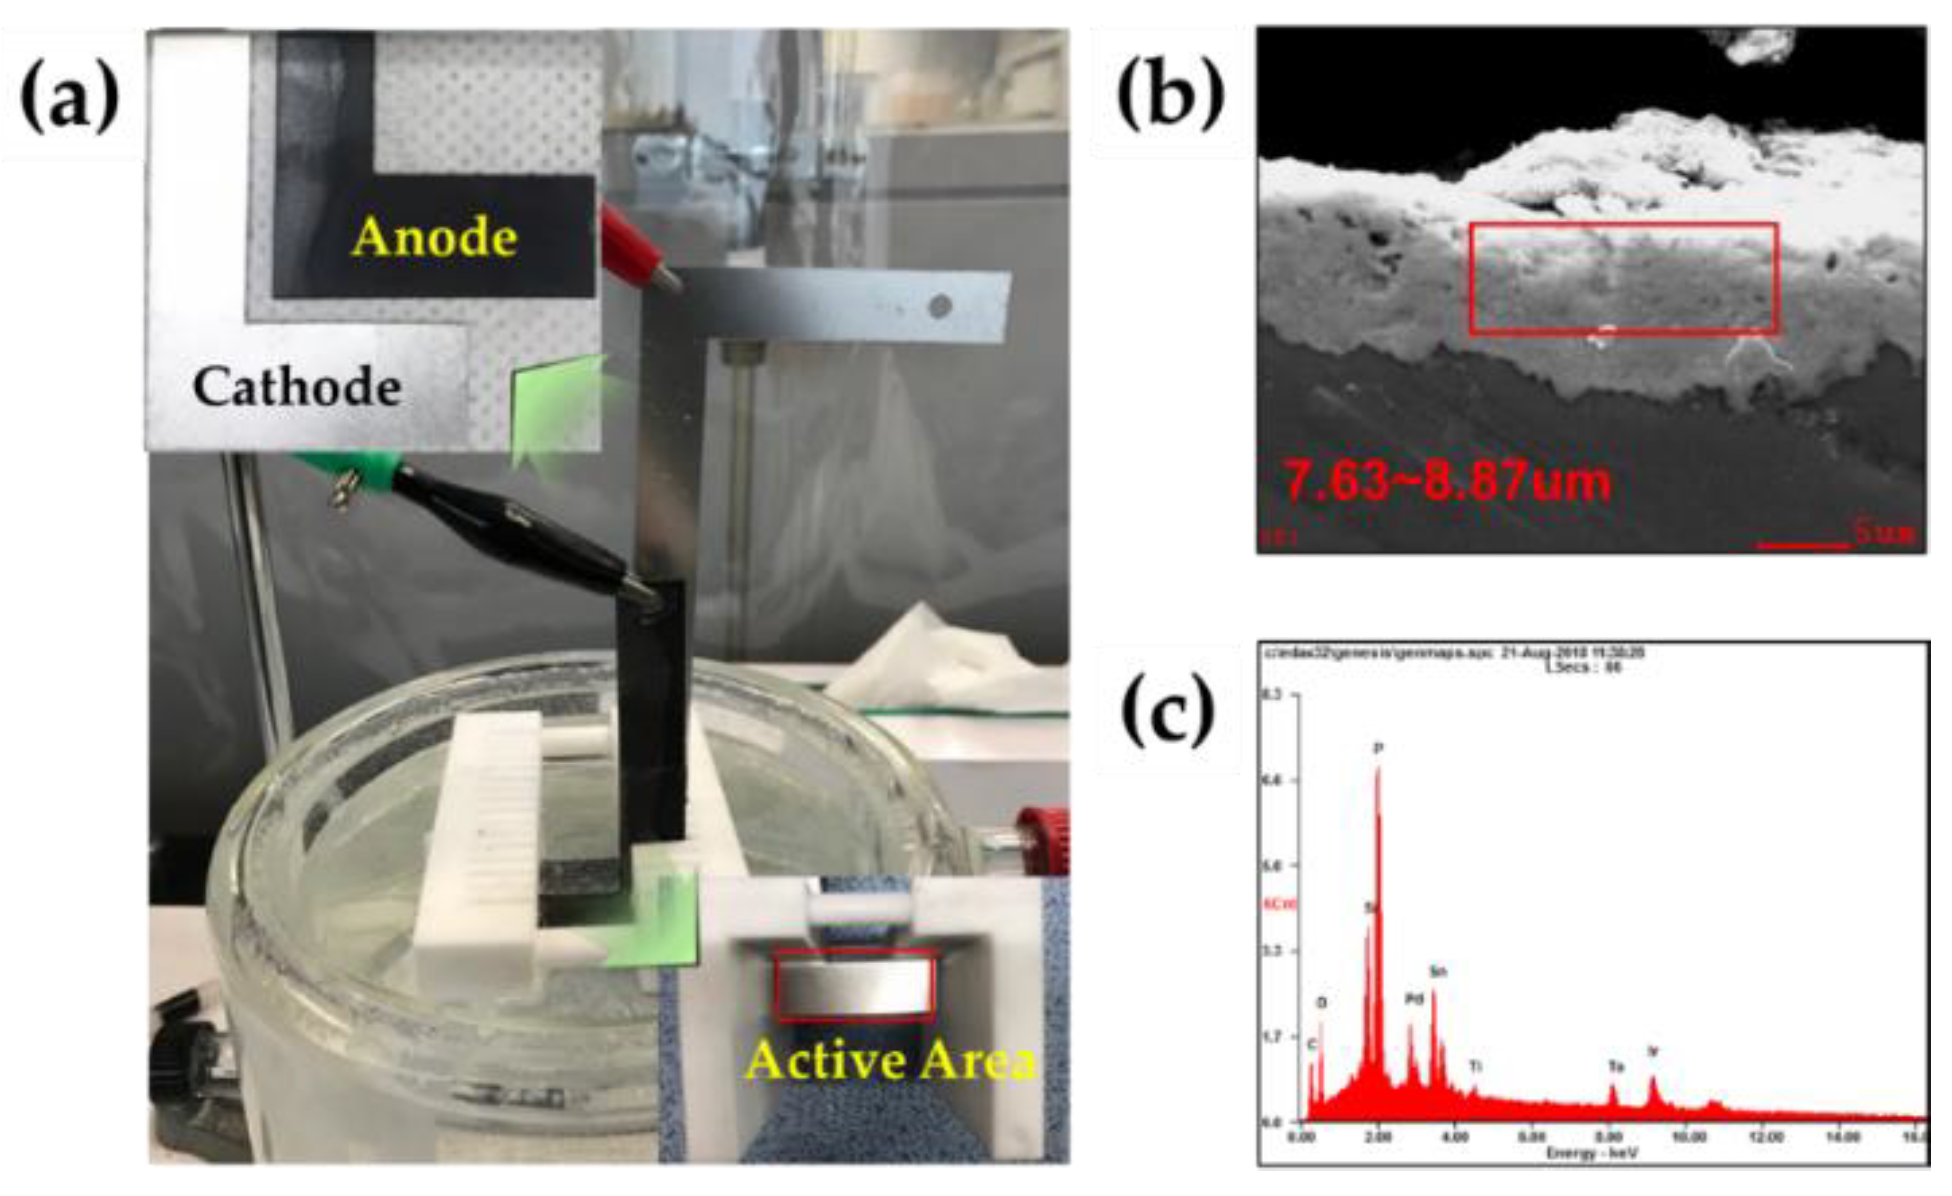
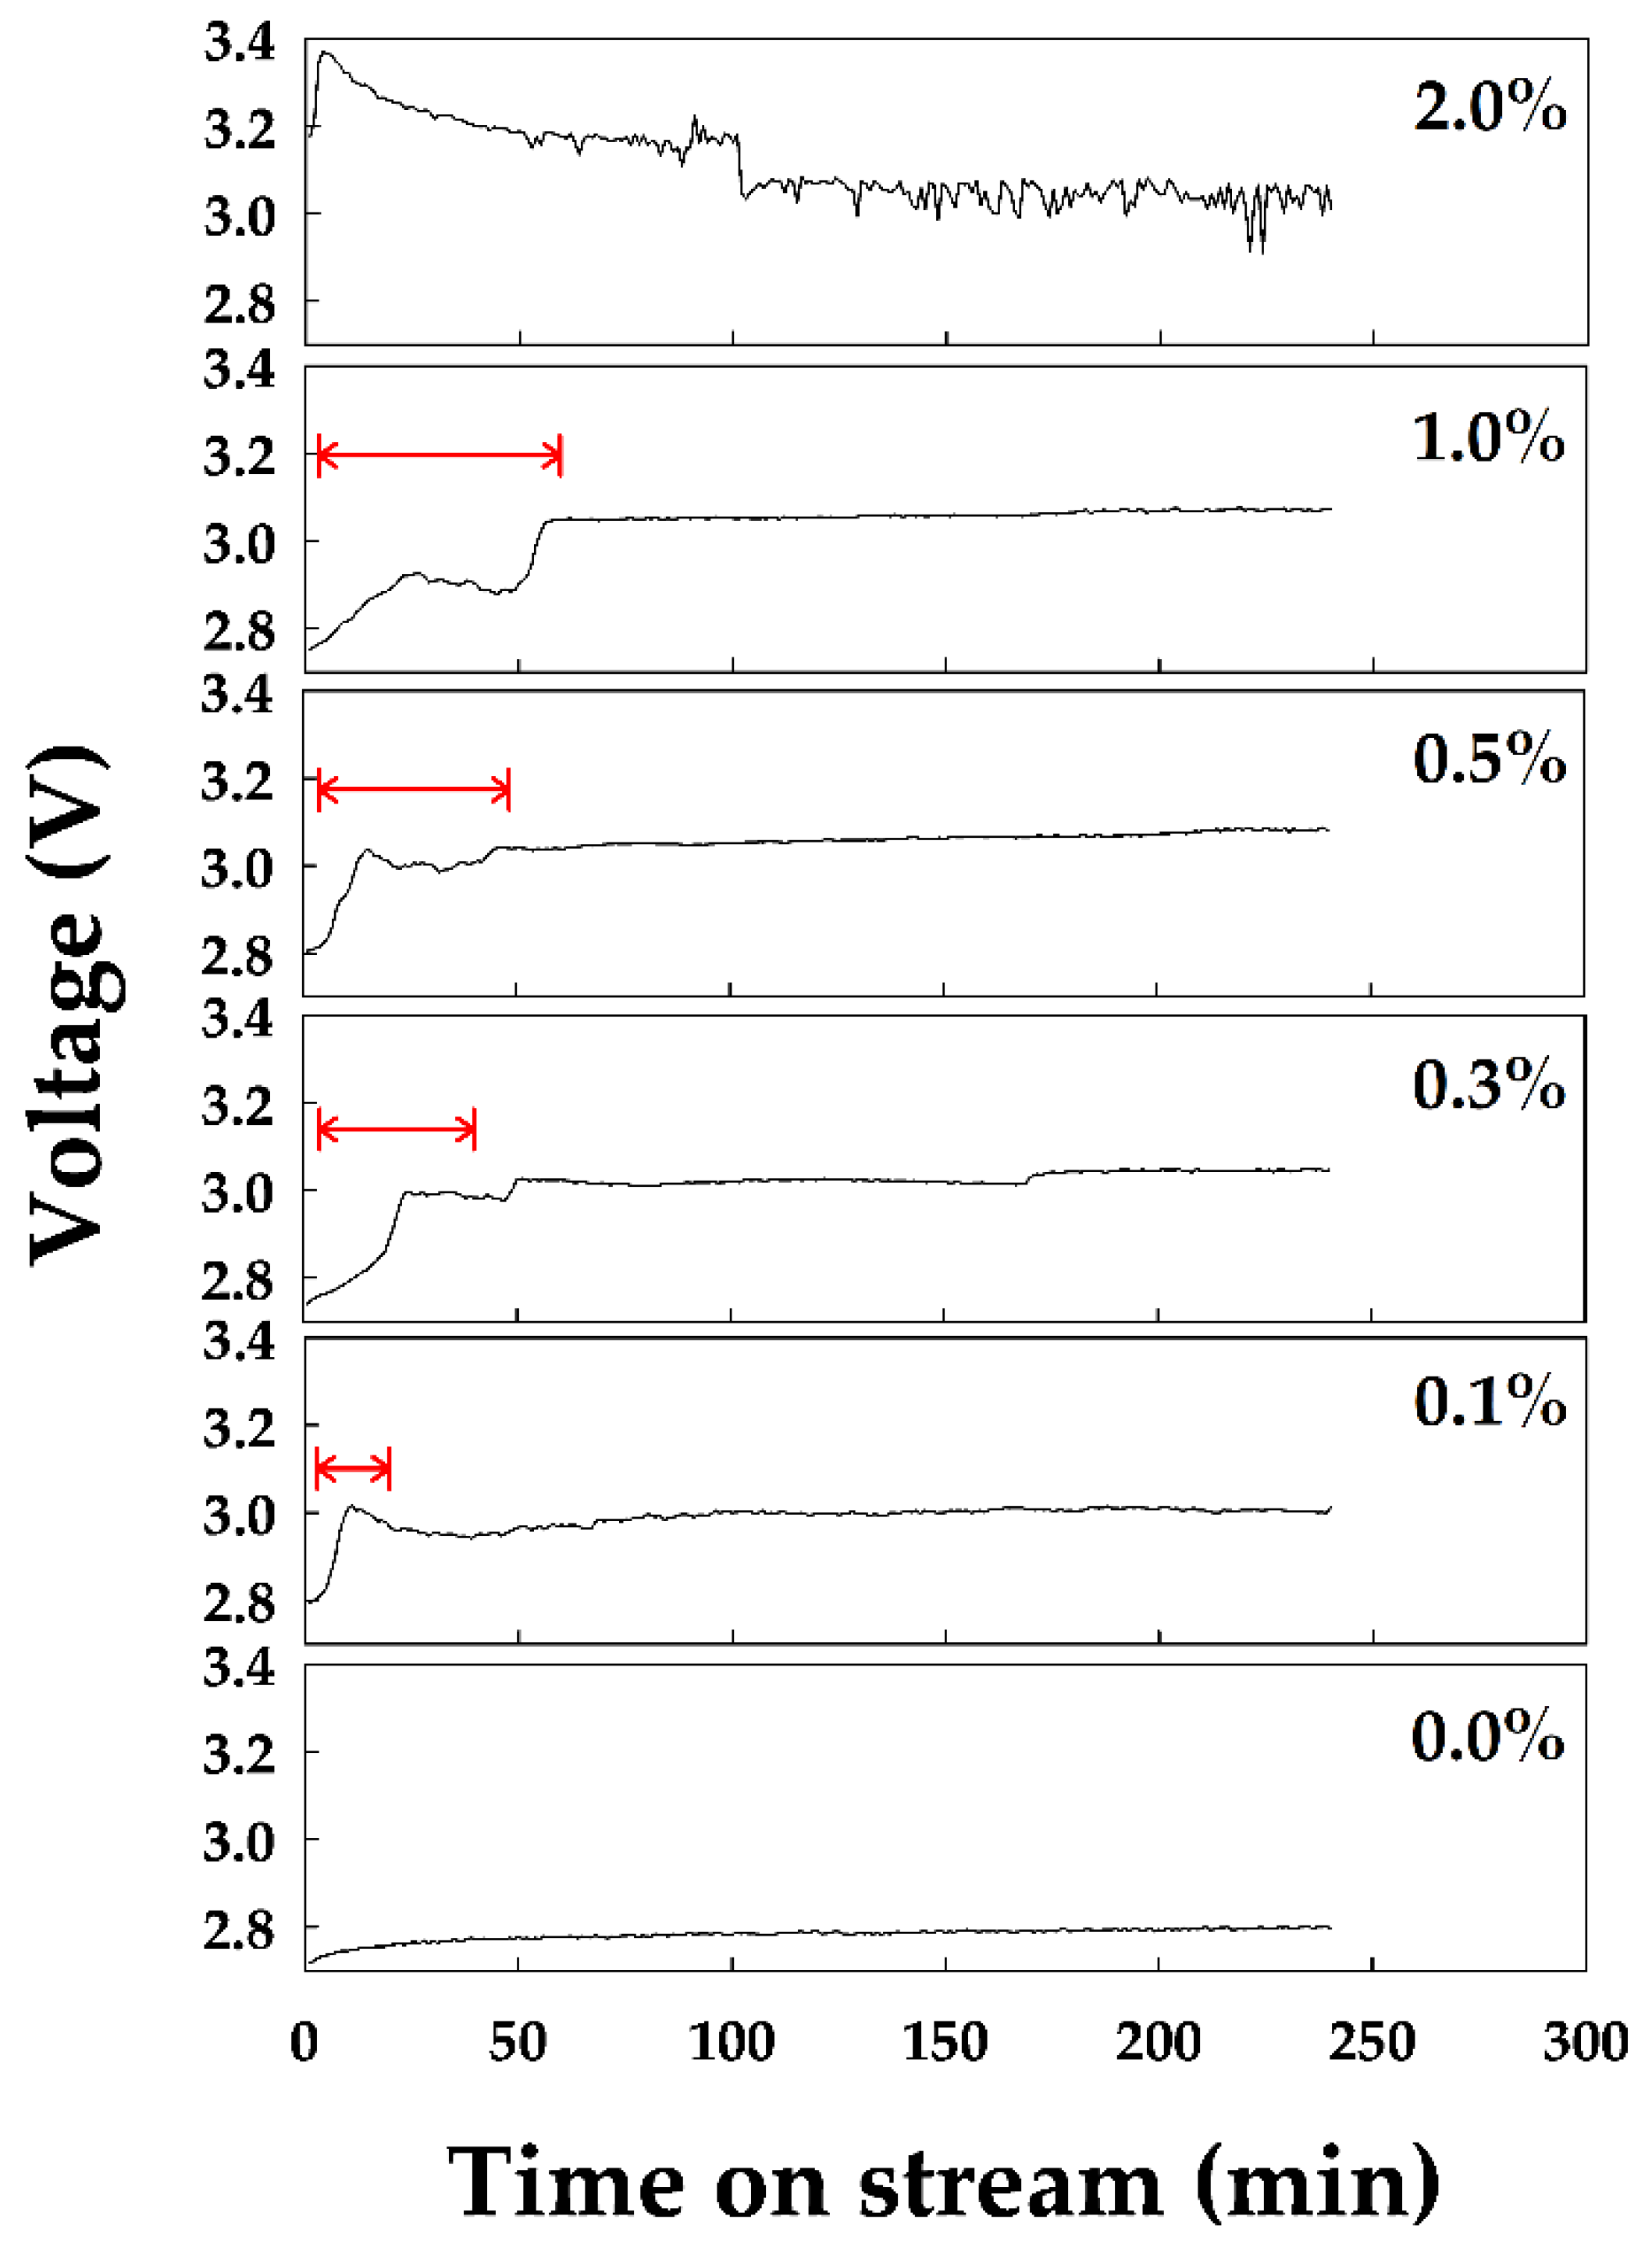
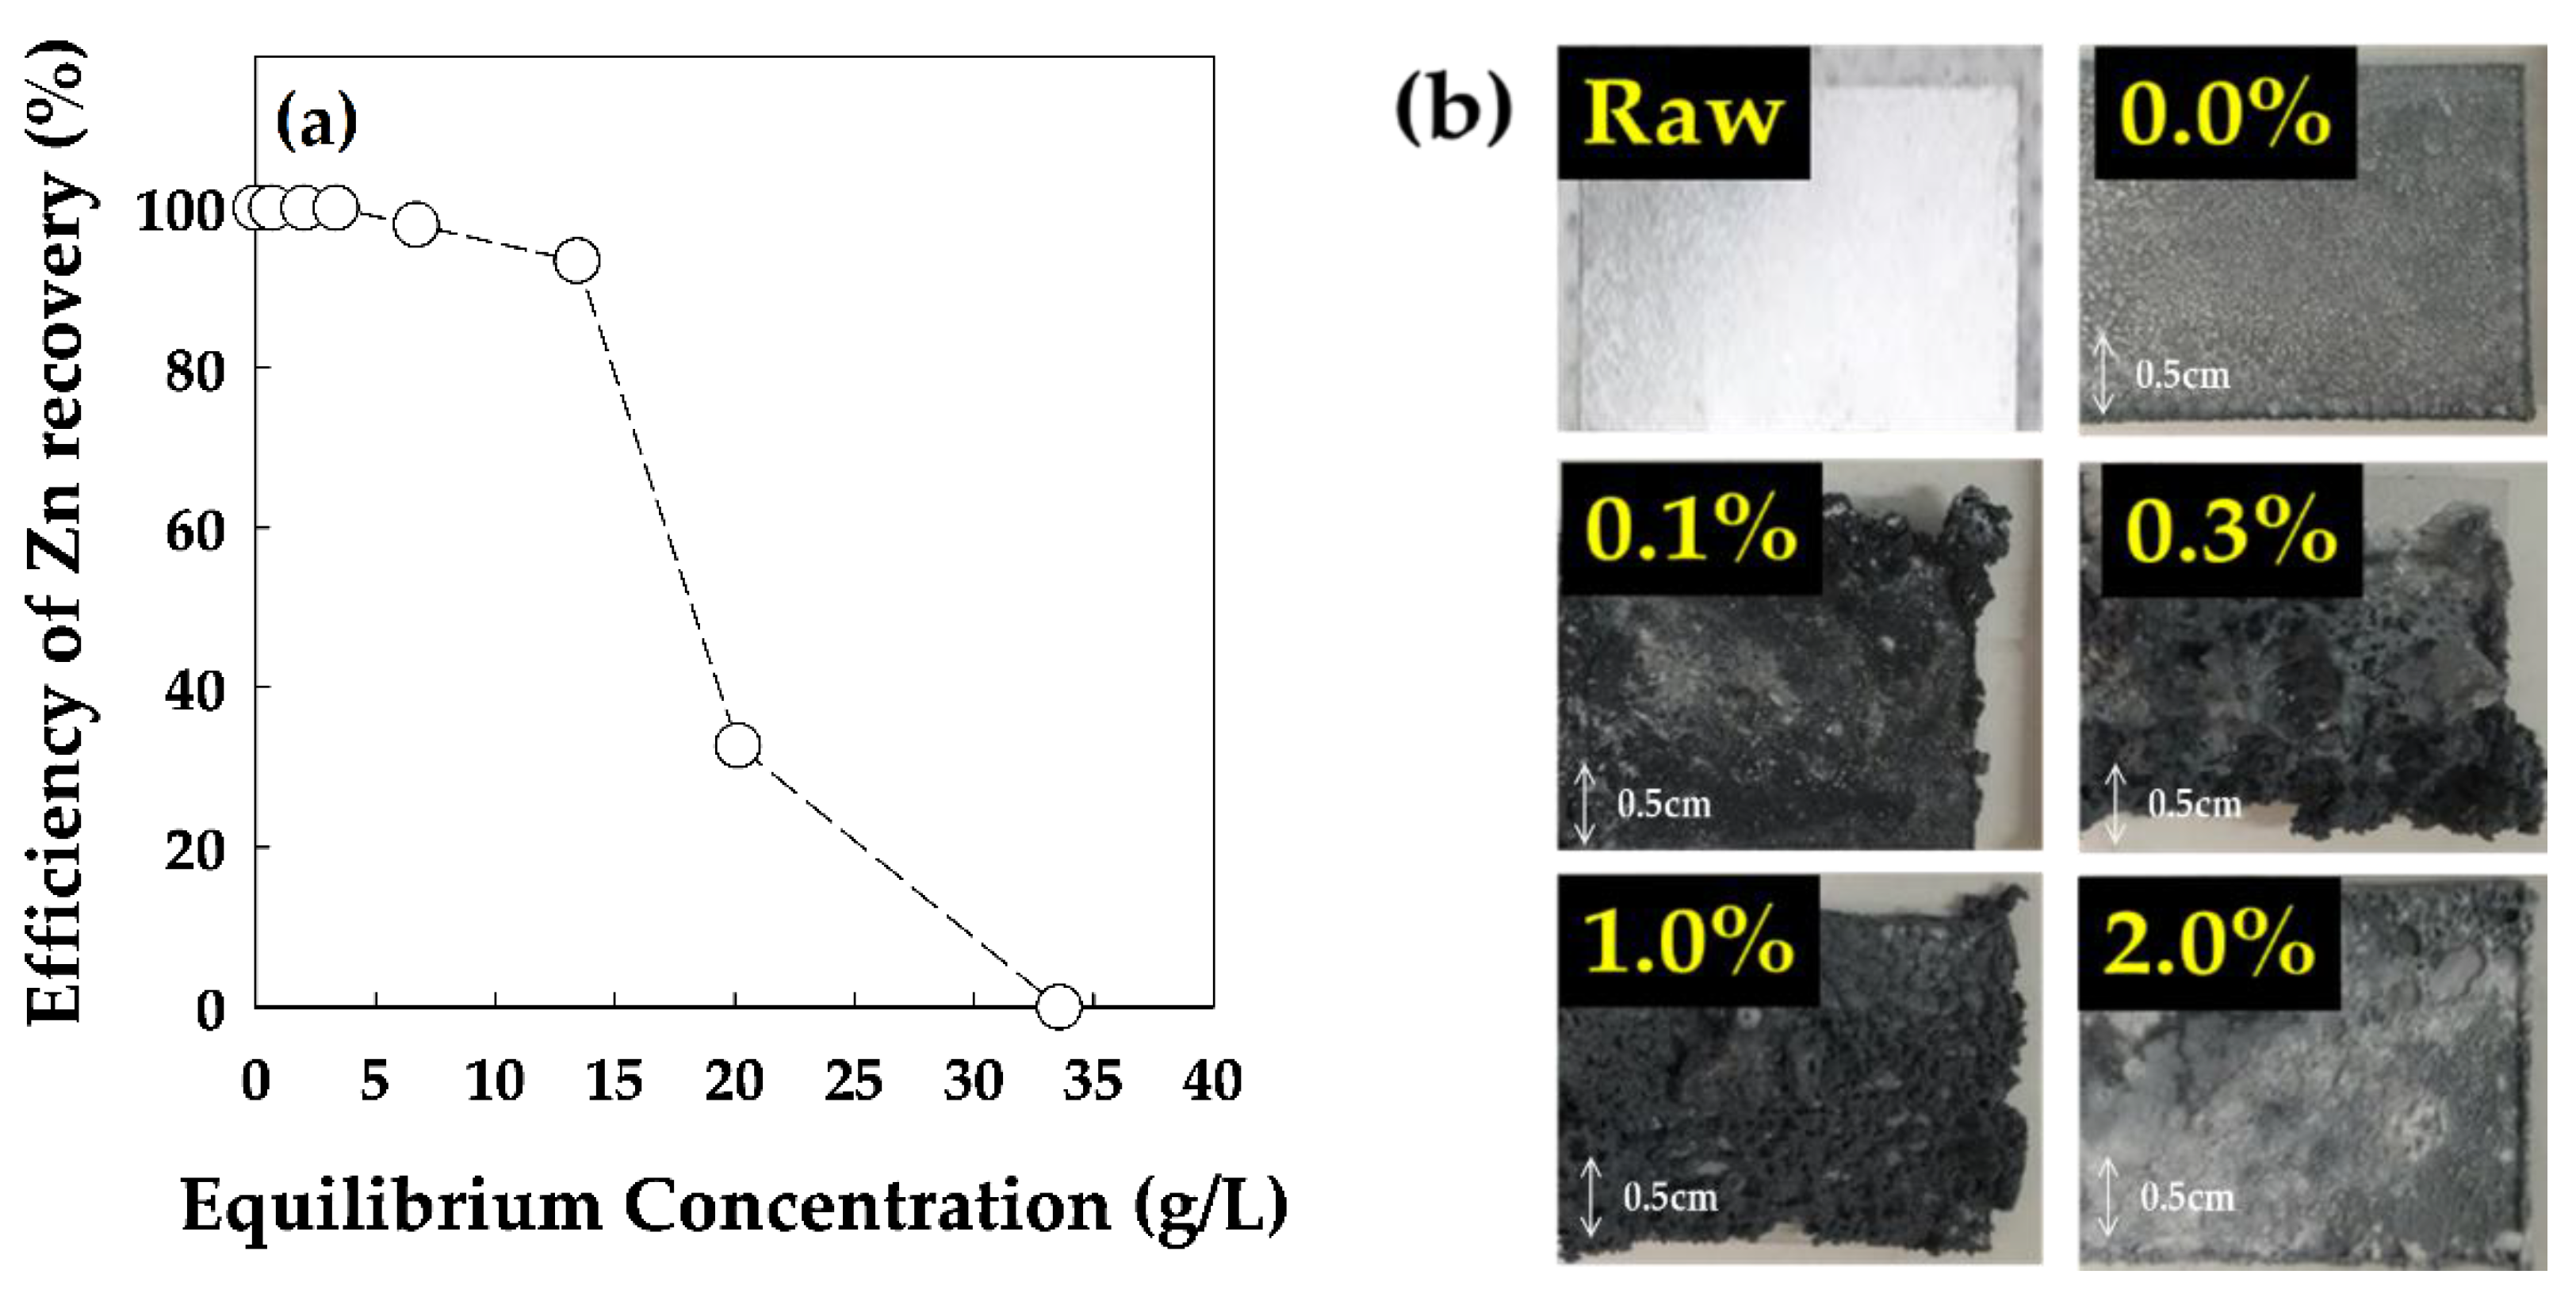
3.3. Zn Electrowinning Test

This adsorbate adsorption test revealed the factors necessary for the efficient recovery of high purity Zn during the pre-treatment process. Therefore, if the adsorbate was not efficiently removed during the pre-treatment process, the effects of the Zn recovery process were considered. Thus, a Zn recovery experiment was conducted using an adsorbate concentration range from 0.0–5.0%.
As shown in Figure 7, the Zn recovery efficiency tended to decrease as the adsorbate content increased. An electrolyte containing more than 2% adsorbate led to a rapid reduction in Zn recovery efficiency. In the case of 0% adsorbate, the voltage was maintained at 2.7 V for 4 h. For 0.1–1.0% adsorbate in the electrolyte, the initial voltage fluctuated for 0.5–1 h. The average voltage for 4 h increased as increasing adsorbate concentration. As increased the adsorbate concentration of 0.00, 0.10, 0.30, 0.50, 1.00%, the average voltage increased 2.7972 V, 2.9874 V, 3.0109 V, 3.0466 V, and 3.0728 V, respectively. In other words, as increased the adsorbate concentration from 0.00 to 1.00% was increasing consumption energy for Zn recovery from 0.0017 kWh to 0.0031 kWh. According to the previous research, the current efficiency and impurity were found to decrease with increasing additive concentration. Also, the voltage (2.80–2.95) and energy consumption (2675–2799 kWh/t) increase with increasing concentration of additives (0–15ppm) [30]. In the presence of organic from 0 to 100 mg/L, the current efficiency decreased from 93 to 61% [31]. As discussed later in this paper, this organic caused significant reductions in the current efficiency of the electrowinning process, thereby increasing energy consumption. At more than 2% adsorbate, the voltage fluctuated rapidly and hard to verify a stable voltage. Therefore, as the adsorbate increased, the consumption energy increased, and Zn recovery efficiency decreased.
As shown in Figure 8a, Zn recovery efficiency in the presence of adsorbate concentration from 0.00 to 0.50% was recovered at least 99.9%. In the presence of more than 0.50% of adsorbate, Zn recovery efficiency tends to rapidly decrease. The surface of an electrode recovered from an electrolyte with different adsorbate contents, as shown in Figure 8b. In the absence of adsorbate, the electrode surface exhibited uniform deposition. However, for 0.1–2% adsorbate, the electrode surface appeared to have grown very unevenly. The addition of the organics to the electrolyte changed the features of the metal deposit [31]. From the microscopy analysis, the addition of organics to the electrolyte leads to the formation of pore on the deposition surface. Therefore, the presence of adsorbate reduces Zn recovery efficiency and leads to non-uniform deposition. Thus, adsorbate removal must be less than 0.1%.

4. Conclusions

The objective of this research was to determine the effect of adsorbate on the electrolyte in the Zn electrowinning process. Experiments were conducted to determine the effects of three different parameters: (1) Adsorbent type, (2) adsorbate content, and (3) Zn recovery.
Among the three different types of activated carbon (AC), wood-based AC (Wood-AC) showed the highest adsorbate adsorption capacity and is thought to be more suitable for adsorbate adsorption, due to its surface area and pore size. If Wood-ACs with a surface area of 1000 m2/g account for at least 60% of the adsorbate, more than 99% is eliminated. Moreover, the adsorption capacity did not differ significantly within a temperature range of 20–50 °C.
The Zn recovery efficiency tended to show an inversely proportional relationship to the amount of adsorbate. In other words, the Zn recovery efficiency decreased from 100% to 0% when the adsorbate content increased from 0% to 5%. In addition, as the adsorbate content increased, the voltage increased from 2.7 V to 3.1 V; thus, the consumption energy increased from 0.0017 to 0.0031 kWh. Therefore, considering the energy consumption and Zn deposit mass, 0.1% of adsorbate is recommended for Zn electrowinning.

Author Contributions

Conceptualization, J.E.P. and E.S.L.; methodology, J.E.P. and E.J.K.; formal analysis, J.E.P. and E.J.K.; writing—original draft preparation, J.E.P.; writing—review and editing, J.E.P. and E.S.L.; project administration, E.S.L.; funding acquisition, M.-J.P.

Funding

This study was supported by the Energy Development Technology Program of the Korea Institute of Energy Technology Evaluation and Planning (KETEP) granted financial resources from the Ministry of Trade, Industry and Energy, Korea (20172010105220) and also the National Research Foundation of Korea (NRF) and the Center for Women In Science, Engineering and Technology (WISET) Grant funded by the Ministry of Science and ICT under the Program for Returners into R&D.

Conflicts of Interest

The authors declare no conflict of interest.

References

  1. Gladysz, O.; Los, P.; Krzyzak, E. Influence of concentrations of copper, leveling agents and temperature on the diffusion coefficient of cupric ions in industrial electro-refining electrolytes. J. Appl. Electrochem. 2007, 37, 1093–1097. [Google Scholar] [CrossRef]
  2. Moats, M.; Free, M. A bright future for copper electrowinning. JOM 2007, 59, 34–36. [Google Scholar] [CrossRef]
  3. Alfantazi, A.; Valic, D. A study of copper electrowinning parameters using a statistically designed methodology. J. Appl. Electrochem. 2003, 33, 217–225. [Google Scholar] [CrossRef]
  4. Xue, J.; Wu, Q.; Wang, Z. Function of additives in electrolytic preparation of copper powder. Hydrometallurgy 2006, 82, 154–156. [Google Scholar] [CrossRef]
  5. Muresan, L.; Nicoara, A.; Varvara, S. Influence of Zn2+ ions on copper electrowinning from sulfate electrolytes. J. Appl. Electrochem. 1999, 29, 719–727. [Google Scholar] [CrossRef]
  6. Cole, P.M.; Sole, K.C. Zinc solvent extraction in the process industries. Miner. Process. Extr. Metall. Rev. 2003, 24, 91–137. [Google Scholar] [CrossRef]
  7. Zhu, Z.; Cheng, C.Y. A study on zinc recovery from leach solutions using Ionquest 801 and its mixture with D2EHPA. Miner. Eng. 2012, 39, 117–123. [Google Scholar] [CrossRef]
  8. Jha, M.K.; Gupta, D.; Choubey, P.K.; Kumar, V.; Jeong, J.; Lee, J. Solvent extraction of copper, zinc, cadmium and nickel from sulfate solution in mixer settler unit (MSU). Sep. Purif. Technol. 2014, 122, 119–127. [Google Scholar] [CrossRef]
  9. Daryabor, M.; Ahmadi, A.; Zilouei, H. Solvent extraction of cadmium and zinc from sulphate solutions: Comparison of mechanical agitation and ultrasonic irradiation. Ultrason. Sonochem. 2017, 34, 931–937. [Google Scholar] [CrossRef]
  10. Verbeken, K.; Verhaege, M.; Wettinck, E. Separation of iron from zinc sulfate electrolyte by combined liquid-liquid extraction and electroreductive stripping. In Lead-Zinc 2000; Dutrizac, J.E., Gonzalez, J.A., Henke, D.M., James, S.E., Siegmund, A.H.-J., Eds.; The Minerals, Metals & Materials Society: Warrendale, PA, USA, 2013; pp. 779–788. [Google Scholar] [CrossRef]
  11. Devi, N.B.; Nathsarma, K.C.; Chakravortty, V. Solvent extraction of zinc(II) using sodium salts of D2EHPA, PC88A and Cyanex 272 in kerosene. In Proceedings of the Mineral Processing: Recent Advances and Future Trends, Indian Institute of Technology, Kanpur, India, 11–15 December 1995; Mehrotra, S.P., Rajiv, S., Eds.; Volume 11–15, pp. 537–547. [Google Scholar]
  12. Jha, M.K.; Kumar, V.; Jeong, J.; Lee, J. Review on solvent extraction of cadmium from various solutions. Hydrometallurgy 2012, 111–112, 1–9. [Google Scholar] [CrossRef]
  13. Deep, A.; de Carvalho, J.M.R. Review on the Recent Developments in the Solvent Extraction of Zinc. Solvent Extr. Ion Exch. 2008, 26, 375–404. [Google Scholar] [CrossRef]
  14. Nathsarma, K.C.; Devi, N.B. Separation of Zn(II) and Mn(II) from sulphate solutions using sodium salts of D2EHPA, PC88A and Cyanex 272. Hydrometallurgy 2006, 84, 149–154. [Google Scholar] [CrossRef]
  15. Asadi, T.; Azizi, A.; Lee, J.; Jahani, M. Solvent extraction of zinc from sulphate leaching solution of a sulphide-oxide sample using D2EHPA and Cyanex 272. J. Dispers. Sci. Technol. 2017, 39, 1328–1334. [Google Scholar] [CrossRef]
  16. Mellah, A.; Benachour, D. The solvent extraction of zinc and cadmium from phosphoric acid solution by di-2-ethyl hexyl phosphoric acid in kerosene diluent. Chem. Eng. Process. 2006, 45, 684–690. [Google Scholar] [CrossRef]
  17. Dhak, D.; Asselin, E.; Carlo, S.D.; Alfantazi, A. An investigation on the effects of organic additives on zinc electrowinning from industrial electrolyte. ECS Trans. 2010, 28, 267–280. [Google Scholar] [CrossRef]
  18. Ivanov, I. Increased current efficiency of zinc electrowinning in the presence of metal impurities by addition of organic inhibitors. Hydrometallurgy 2004, 72, 73–78. [Google Scholar] [CrossRef]
  19. Moreno-Castilla, C. Adsorption of organic molecules from aqueous solutions on carbon materials. Carbon 2004, 42, 83–94. [Google Scholar] [CrossRef] [Green Version]
  20. Apul, O.G.; Karanfil, T. Adsorption of synthetic organic contaminants by carbon nanotubes: A critical review. Water Res. 2014, 68, 34–55. [Google Scholar] [CrossRef]
  21. Zhang, S.; Shao, T.; Bekaroglu, S.S.K.; Karanfil, T. Adsorption of synthetic organic chemicals by carbon nanotubes: Effects of background solution chemistry. Water Res. 2010, 44, 2067–2074. [Google Scholar] [CrossRef]
  22. Quinlivan, P.A.; Li, L.; Knappe, D.R.U. Effects of activated carbon characteristics on the simultaneous adsorption of aqueous organic micropollutants and natural organic matter. Water Res. 2005, 39, 1663–1673. [Google Scholar] [CrossRef]
  23. Park, J.E.; Yang, S.K.; Kim, J.H.; Park, M.-J.; Lee, E.S. Electrocatalytic activity of Pd/Ir/Sn/Ta/TiO2 composite electrodes. Energies 2018, 11, 3356. [Google Scholar] [CrossRef]
  24. Dora, S.K. Real time recrystallization study of 1, 2dodecanediol on highly oriented pyrolytic graphite (HOPG) by tapping mode atomic force microscopy. WJNSE 2017, 7, 1–15. [Google Scholar] [CrossRef]
  25. Lu, J.R.; Thomas, R.K.; Binks, B.P.; Fletcher, P.D.I.; Penfold, J. Structure and composition of dodecane layers spread on aqueous solutions of dodecyland hexadecyltrimethylammonium bromides studied by neutron reflection. J. Phys. Chem. 1995, 99, 4113–4123. [Google Scholar] [CrossRef]
  26. Pendleton, P.; Wu, S.H.; Badalyan, A. Activated carbon oxygen content influence on water and surfactant adsorption. J. Colloid Interface Sci. 2002, 246, 235–240. [Google Scholar] [CrossRef] [PubMed]
  27. Kim, J.-H.; Wu, S.H.; Pendleton, P. Effect of surface properties of activated carbons on surfactant adsorption kinetics. Korean J. Chem. Eng. 2005, 22, 705–711. [Google Scholar] [CrossRef]
  28. Fendleton, P.; Wong, S.H.; Schumann, R.; Levay, G.; Denoyel, R.; Rouquerol, J. Properties of activated carbon controlling 2-methylisoborneol adsorption. Carbon 1997, 35, 1141–1149. [Google Scholar] [CrossRef]
  29. Nam, S.-W.; Choi, D.-J.; Kim, S.-K.; Herc, N.; Zoh, K.-D. Adsorption characteristics of selected hydrophilic and hydrophobic micropollutants in water using activated carbon. J. Hazard. Mater. 2014, 270, 144–152. [Google Scholar] [CrossRef] [PubMed]
  30. Tomul, F.; Arslan, Y.; Basoglu, F.T.; Babuccuoglu, Y.; Tran, H.N. Efficient removal of anti-inflammatory from solution by Fe-containing activated carbon: Adsorption kinetics, isotherms, and thermodynamics. J. Environ. Manag. 2019, 238, 296–306. [Google Scholar] [CrossRef]
  31. Majuste, D.; Bubani, F.C.; Bolmaro, R.E.; Martins, E.L.C.; Cetlin, P.R.; Ciminelli, V.S.T. Effect of organic impurities on the morphology and crystallographic texture of zinc electrodeposits. Hydrometallurgy 2017, 169, 330–338. [Google Scholar] [CrossRef]
Figure 1. Electrowinning test cell setup and electrode properties. (a) The electrowinning reactor consisted of a 1 l double jacket (insert Figure showed that 8.6g Pd-Ir-Sn-Ta/TiO2 as anode and aluminum plate as cathode). (b) The micrograph and (c) energy-dispersive X-ray analysis (EDAX) pattern of the 8.6 g Pd-Ir-Sn-Ta/TiO2 electrode.
Energies 12 02169 g001
Figure 2. Physical properties of ACs (○: Wood-ACs, □: Coal-ACs, and △: Coconut-ACs). (a) Nitrogen ad-/de-sorption isotherms and (b) pore size distribution for ACs.
Energies 12 02169 g002
Figure 3. The adsorbed amount as equilibrium concentration depends on a different type of ACs viz. Wood-ACs, Coal-ACs, and Coconut-ACs as PBR conditions, as shown in Table 3. (insert Figure means that the removal efficiency of adsorbate as ACs type and detected adsorbate after adsorption analyzed by n-Hexane method. CSTR conditions, as shown in Table 3).
Energies 12 02169 g003
Figure 4. The removal efficiency of adsorbate as adsorbent contents and adsorption temperature of 20–50 °C. Experimental conditions—CSTR, Adsorbents—5.0 g, Adsorbate contents—5.0 g in 100 mL of 3 M H2SO4 solvent, stirring speed—300 rpm).
Energies 12 02169 g004
Figure 5. The adsorbate removal efficiency and delta pressure at a liquid hourly space velocity of 0.005–0.026 h−1. (a) The removal efficiency as space velocity of 0.005–0.026 h−1 (insert Figure showed the solvents after adsorption test). (b) Delta pressure as space velocity of 0.005–0.026 h−1. Experimental conditions—1.0 g of ACs and flow rate of solvent was set to 1.0, 3.0, and 5.0 mL/min.
Energies 12 02169 g005
Figure 6. Removal efficiency depends on adsorbents at same space velocity conditions. (○: The flow rate of solvent is 0.5 mL/min and the weight of adsorbent is 1.0 g, □: The flow rate of solvent is 1.0 mL/min and the weight of adsorbent is 2.0 g).
Energies 12 02169 g006
Figure 7. Voltage as adsorbate contents from 0.0% to 2.0% for four hours.
Energies 12 02169 g007
Figure 8. Energy efficiency of Zn recovery and images after Zn electrowinning. (a) Zn recovery efficiency as adsorbate concentration and (b) the electrode surface images after Zn recovery.
Energies 12 02169 g008
Table 1. The list of ACs as adsorbents and their textural characteristics.
AdsorbentsWood-ACCoal-ACCoconut-AC
Raw MaterialWoodCoalCoconut
Surface Area (m2/g)139810301067
Total Pore volume (m3/g)1.190.520.45
Micropore size (A)6.566.165.38
Proximate analysis (wt.%)Moisture0.180.180.72
Volatile2.242.242.52
Fixed Carbon72.7088.6294.28
Ash20.908.962.48
Ultimate analysis (wt.%)Carbon68.888.294.2
Hydrogen1.00.40.4
Oxygen15.70.52.3
Nitrogen0.30.32.0
Sulphur0.10.00.0
Table 2. The scheme of reactors.
ReactorIdeal SchemeReal Scheme
(a) Continuous Stirred Tank Reactor (CSTR) Energies 12 02169 i001 Energies 12 02169 i002
Reaction conditionAdsorbent: Three types of activated carbons (ACs), Temperature: 20 °C~50 °C, Adsorbate: 2 M D2EPHA in Kerosene, Solvent: Adsorbate in 3 M H2SO4, Stirring: 1 h at 300 rpm
(b) 1-Packed Bed Reactor (1PBR) Energies 12 02169 i003 Energies 12 02169 i004
Reaction conditionAdsorbent: Three types of ACs, Temperature: 20 °C, Adsorbate: 2 M D2EPHA in Kerosene, Solvent: Adsorbate in H2SO4 (pH 2.2~2.3)
(c) 2-Packed Bed Reactor (2PBR) Energies 12 02169 i005 Energies 12 02169 i006
Reaction conditionAdsorbent: Wood-ACs, Temperature: 20 °C, Adsorbate: 2 M D2EPHA in Kerosene, Solvent: Adsorbate in H2SO4 (pH 2.2~2.3)
Table 3. The removal efficiency for investigated ACs.
AdsorbentsWood-ACsCoal-ACsCoconut-ACs
Removal efficiency (%)N-Hexane 199.7698.8392.81
Ave. TOC 298.2997.4595.10
1 CSTR conditions (Adsorbents—5.0 g, Adsorbate contents—5.0 g in 100 mL of 3 M H2SO4 solvent, stirring speed—300 rpm); 2 PBR conditions (flow rate—1.0 mL/min, Adsorbents—1.0 g, Adsorbate—1.0 g in 100 mL of pH 2.2–2.3 solvent (H2SO4 with D.I water).

