On the Influence of Renewable Energy Sources in Electricity Price Forecasting in the Iberian Market

 , , , and
Abstract
:1. Introduction
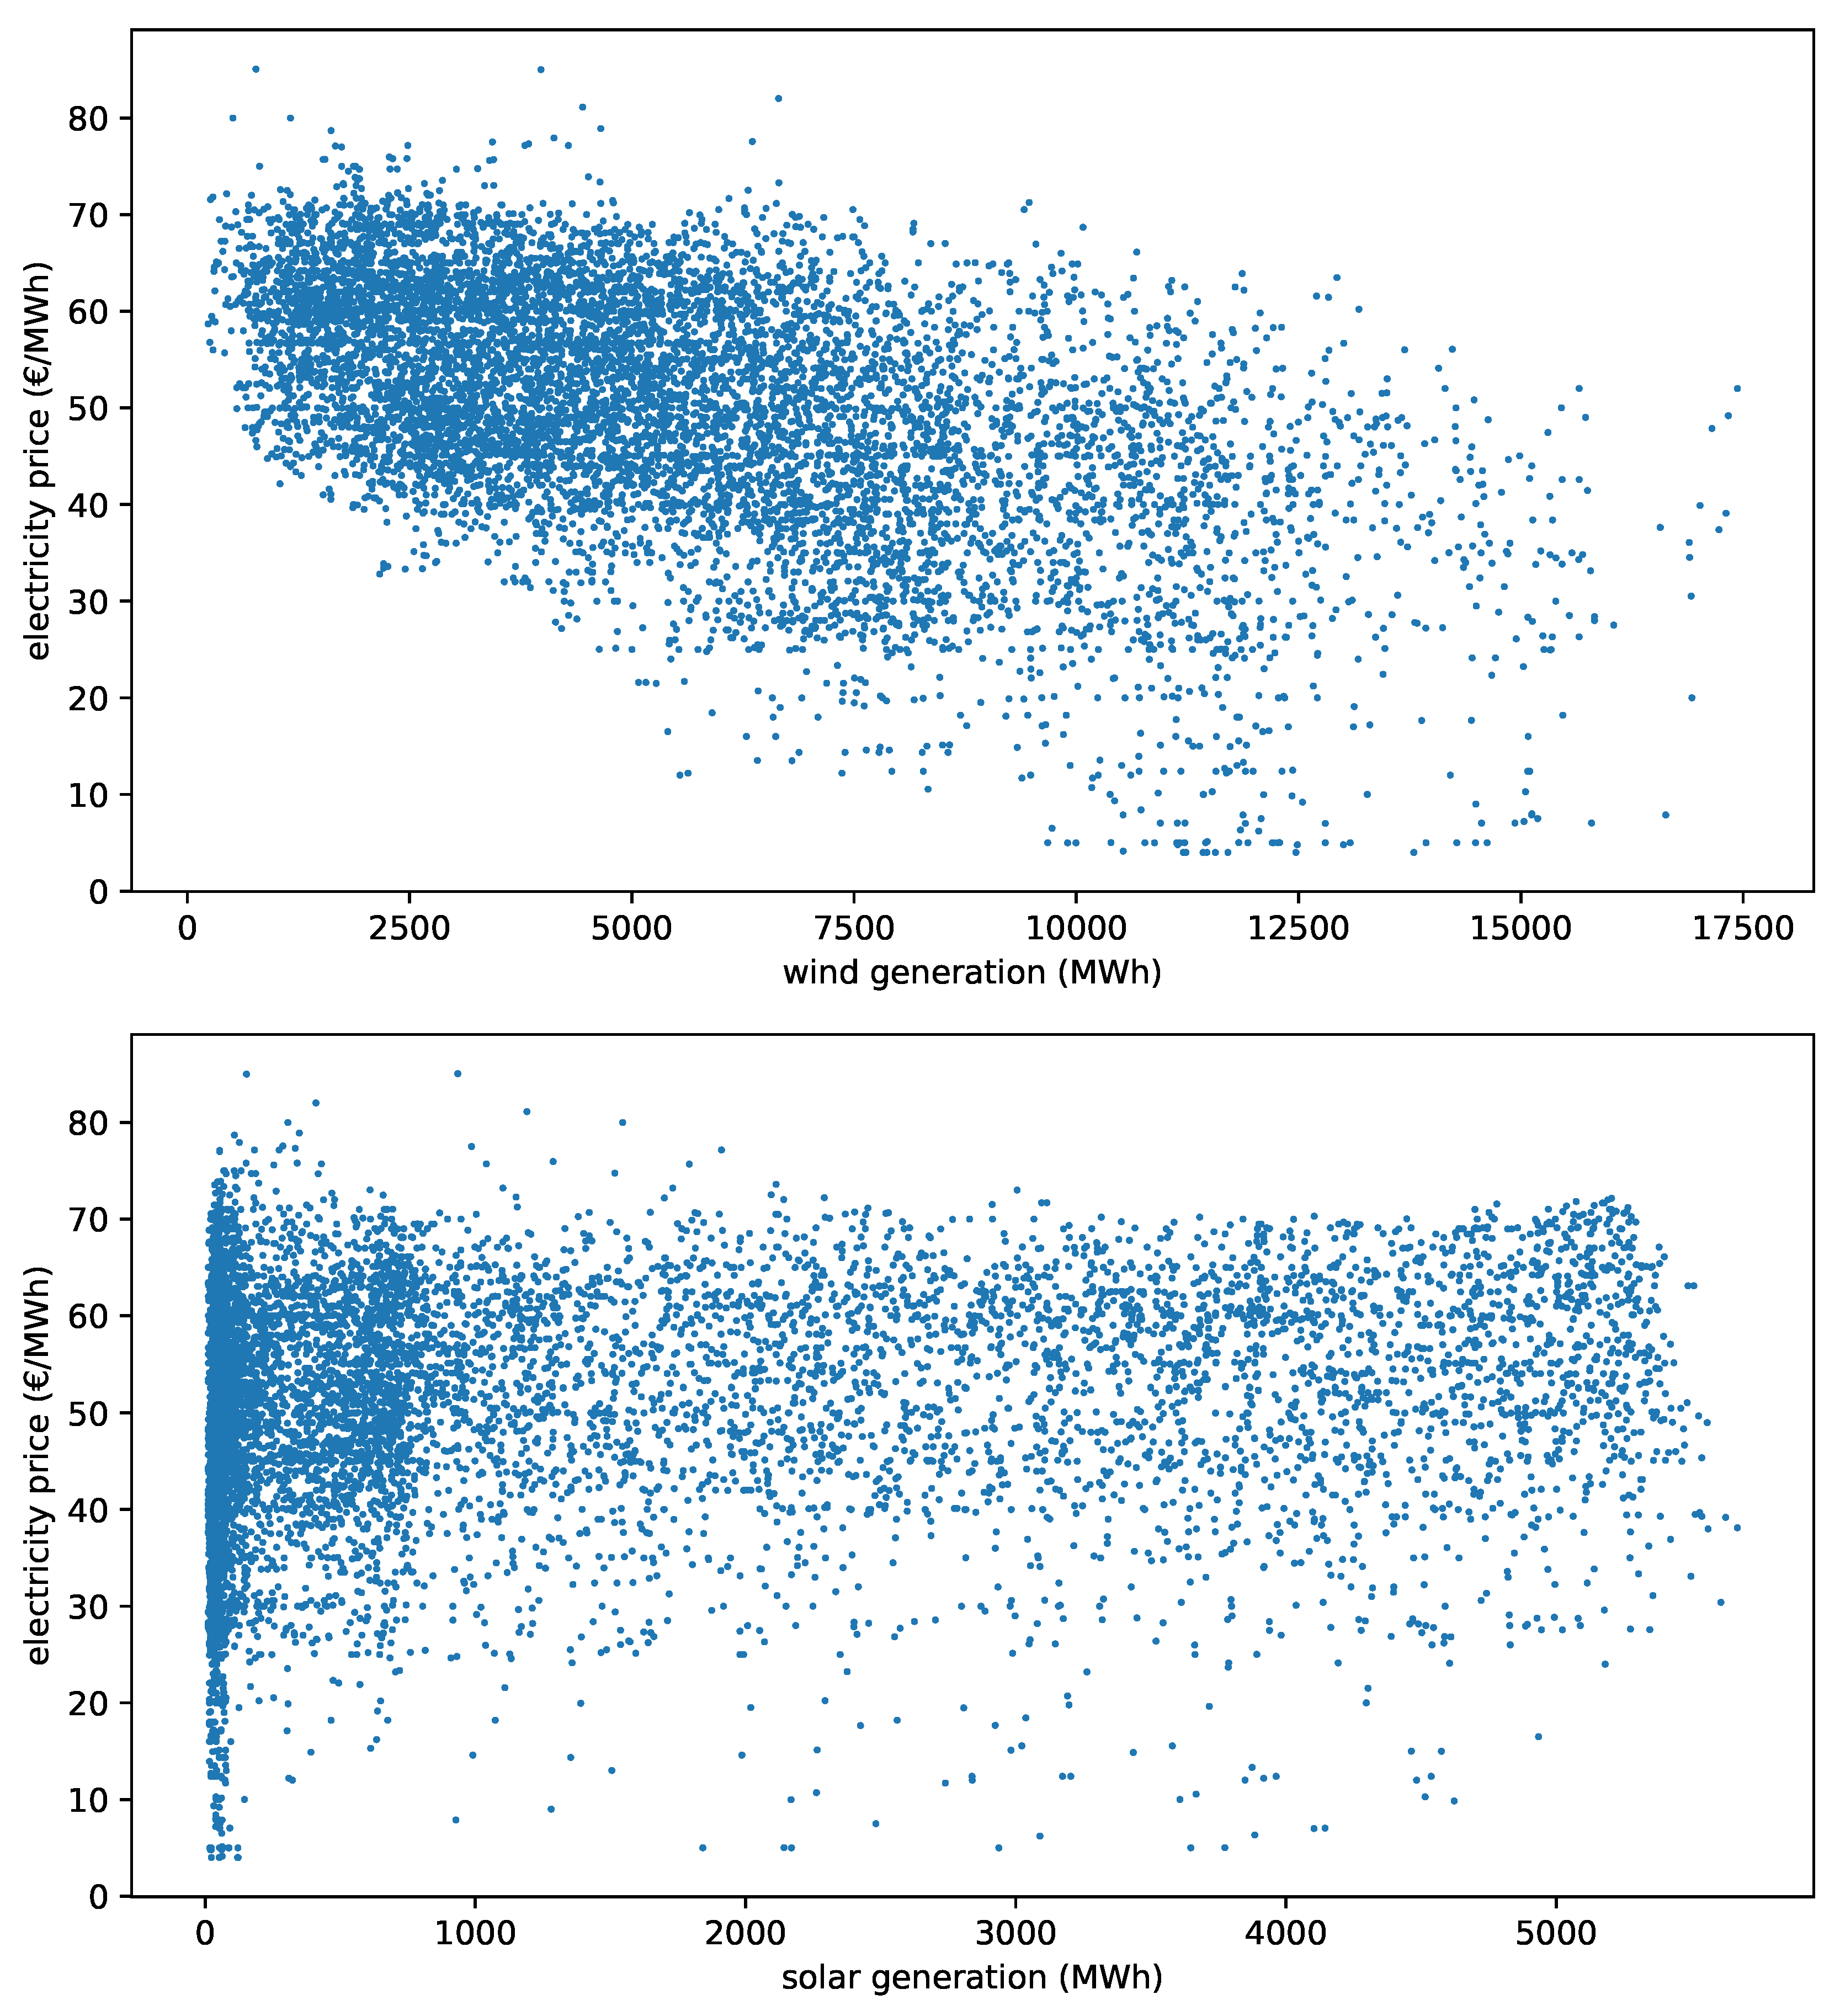
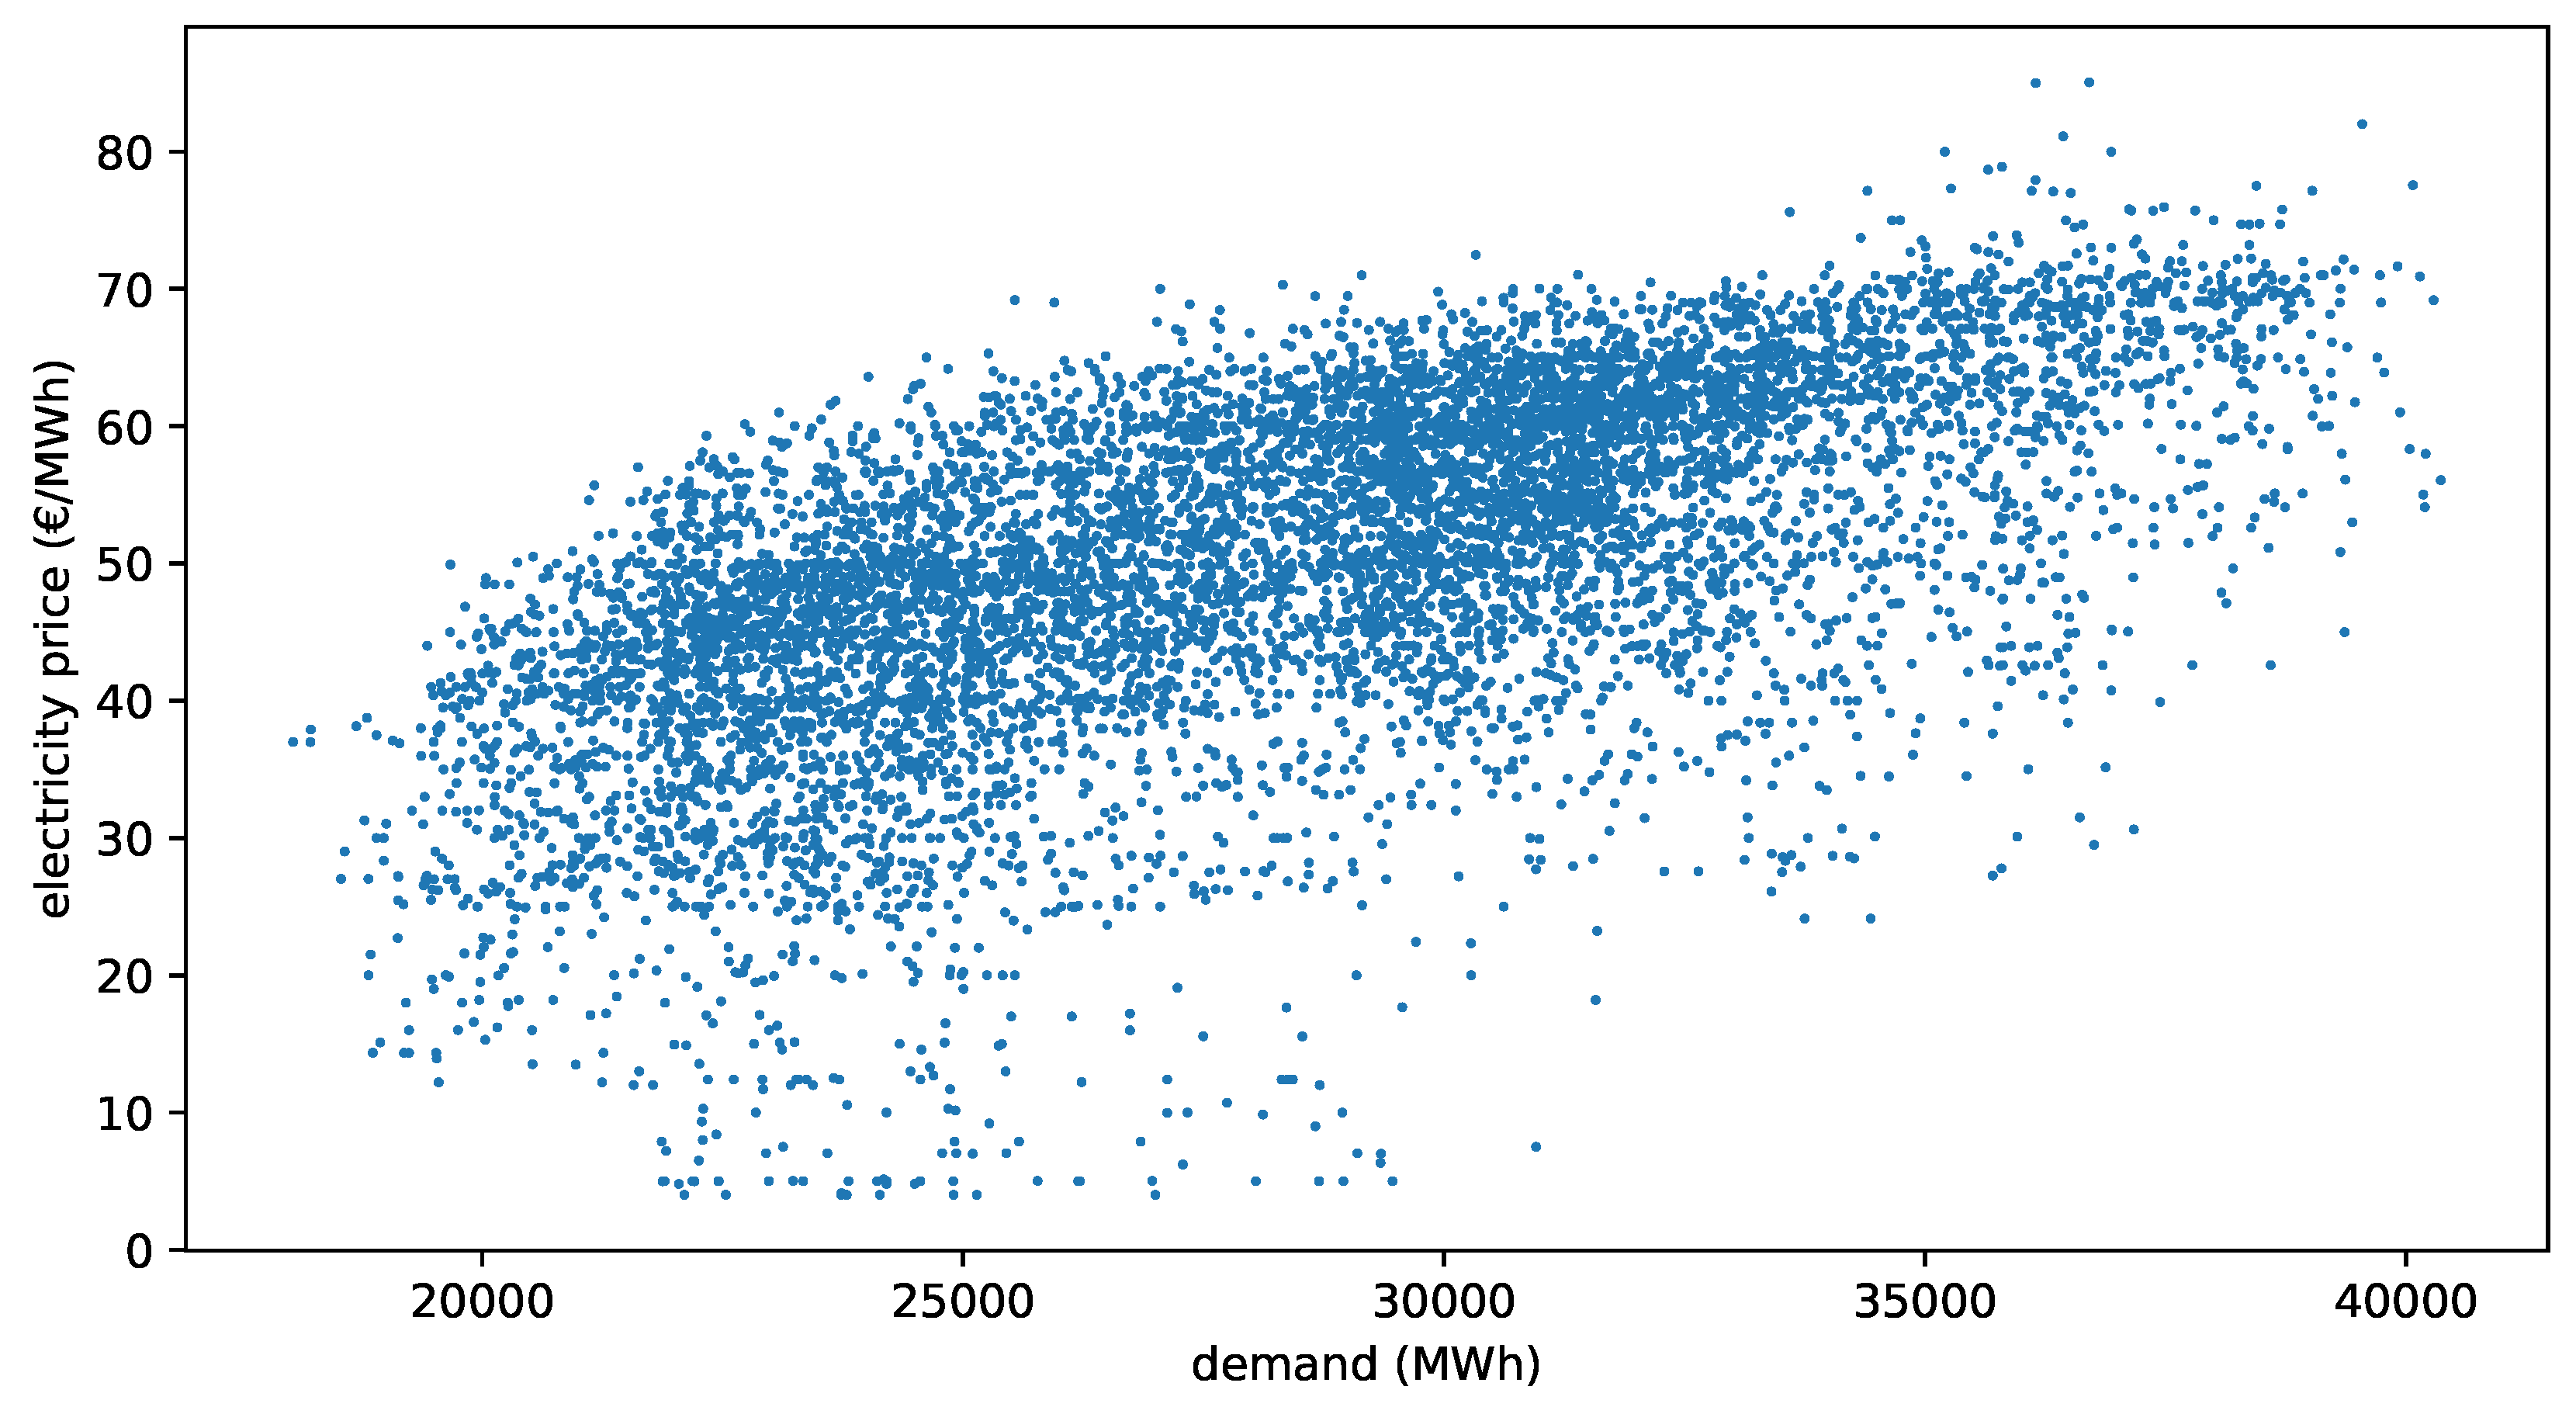
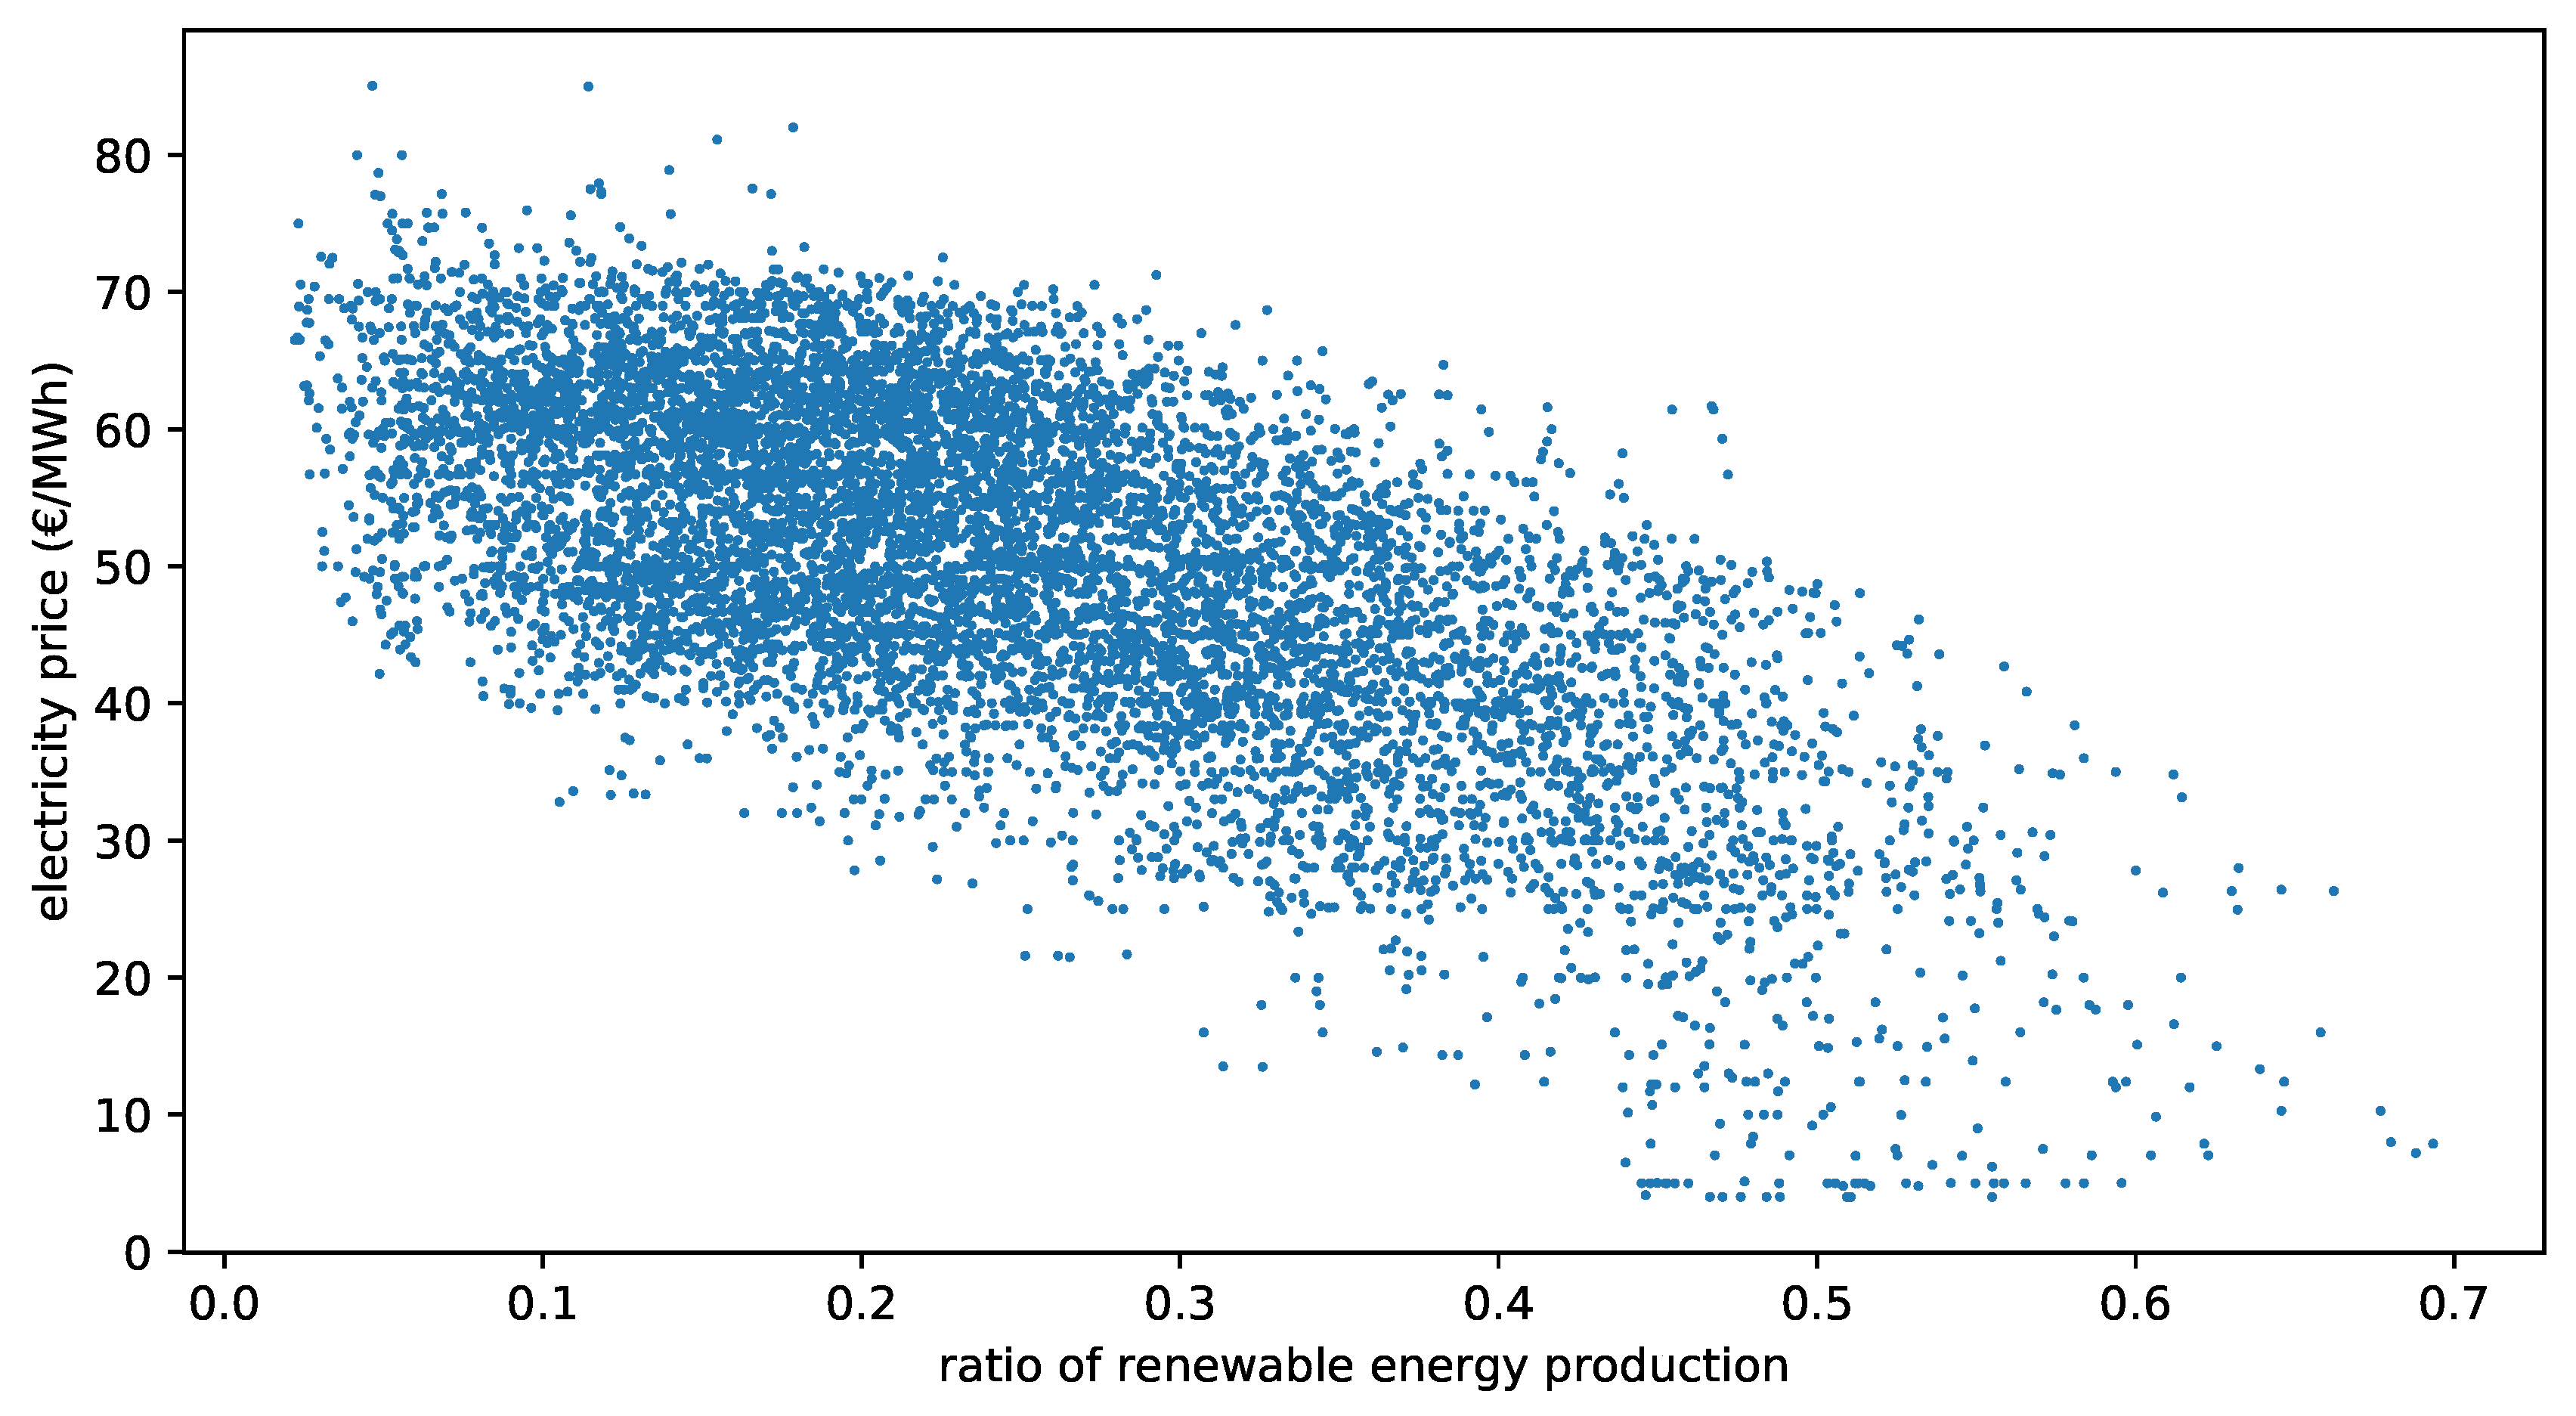
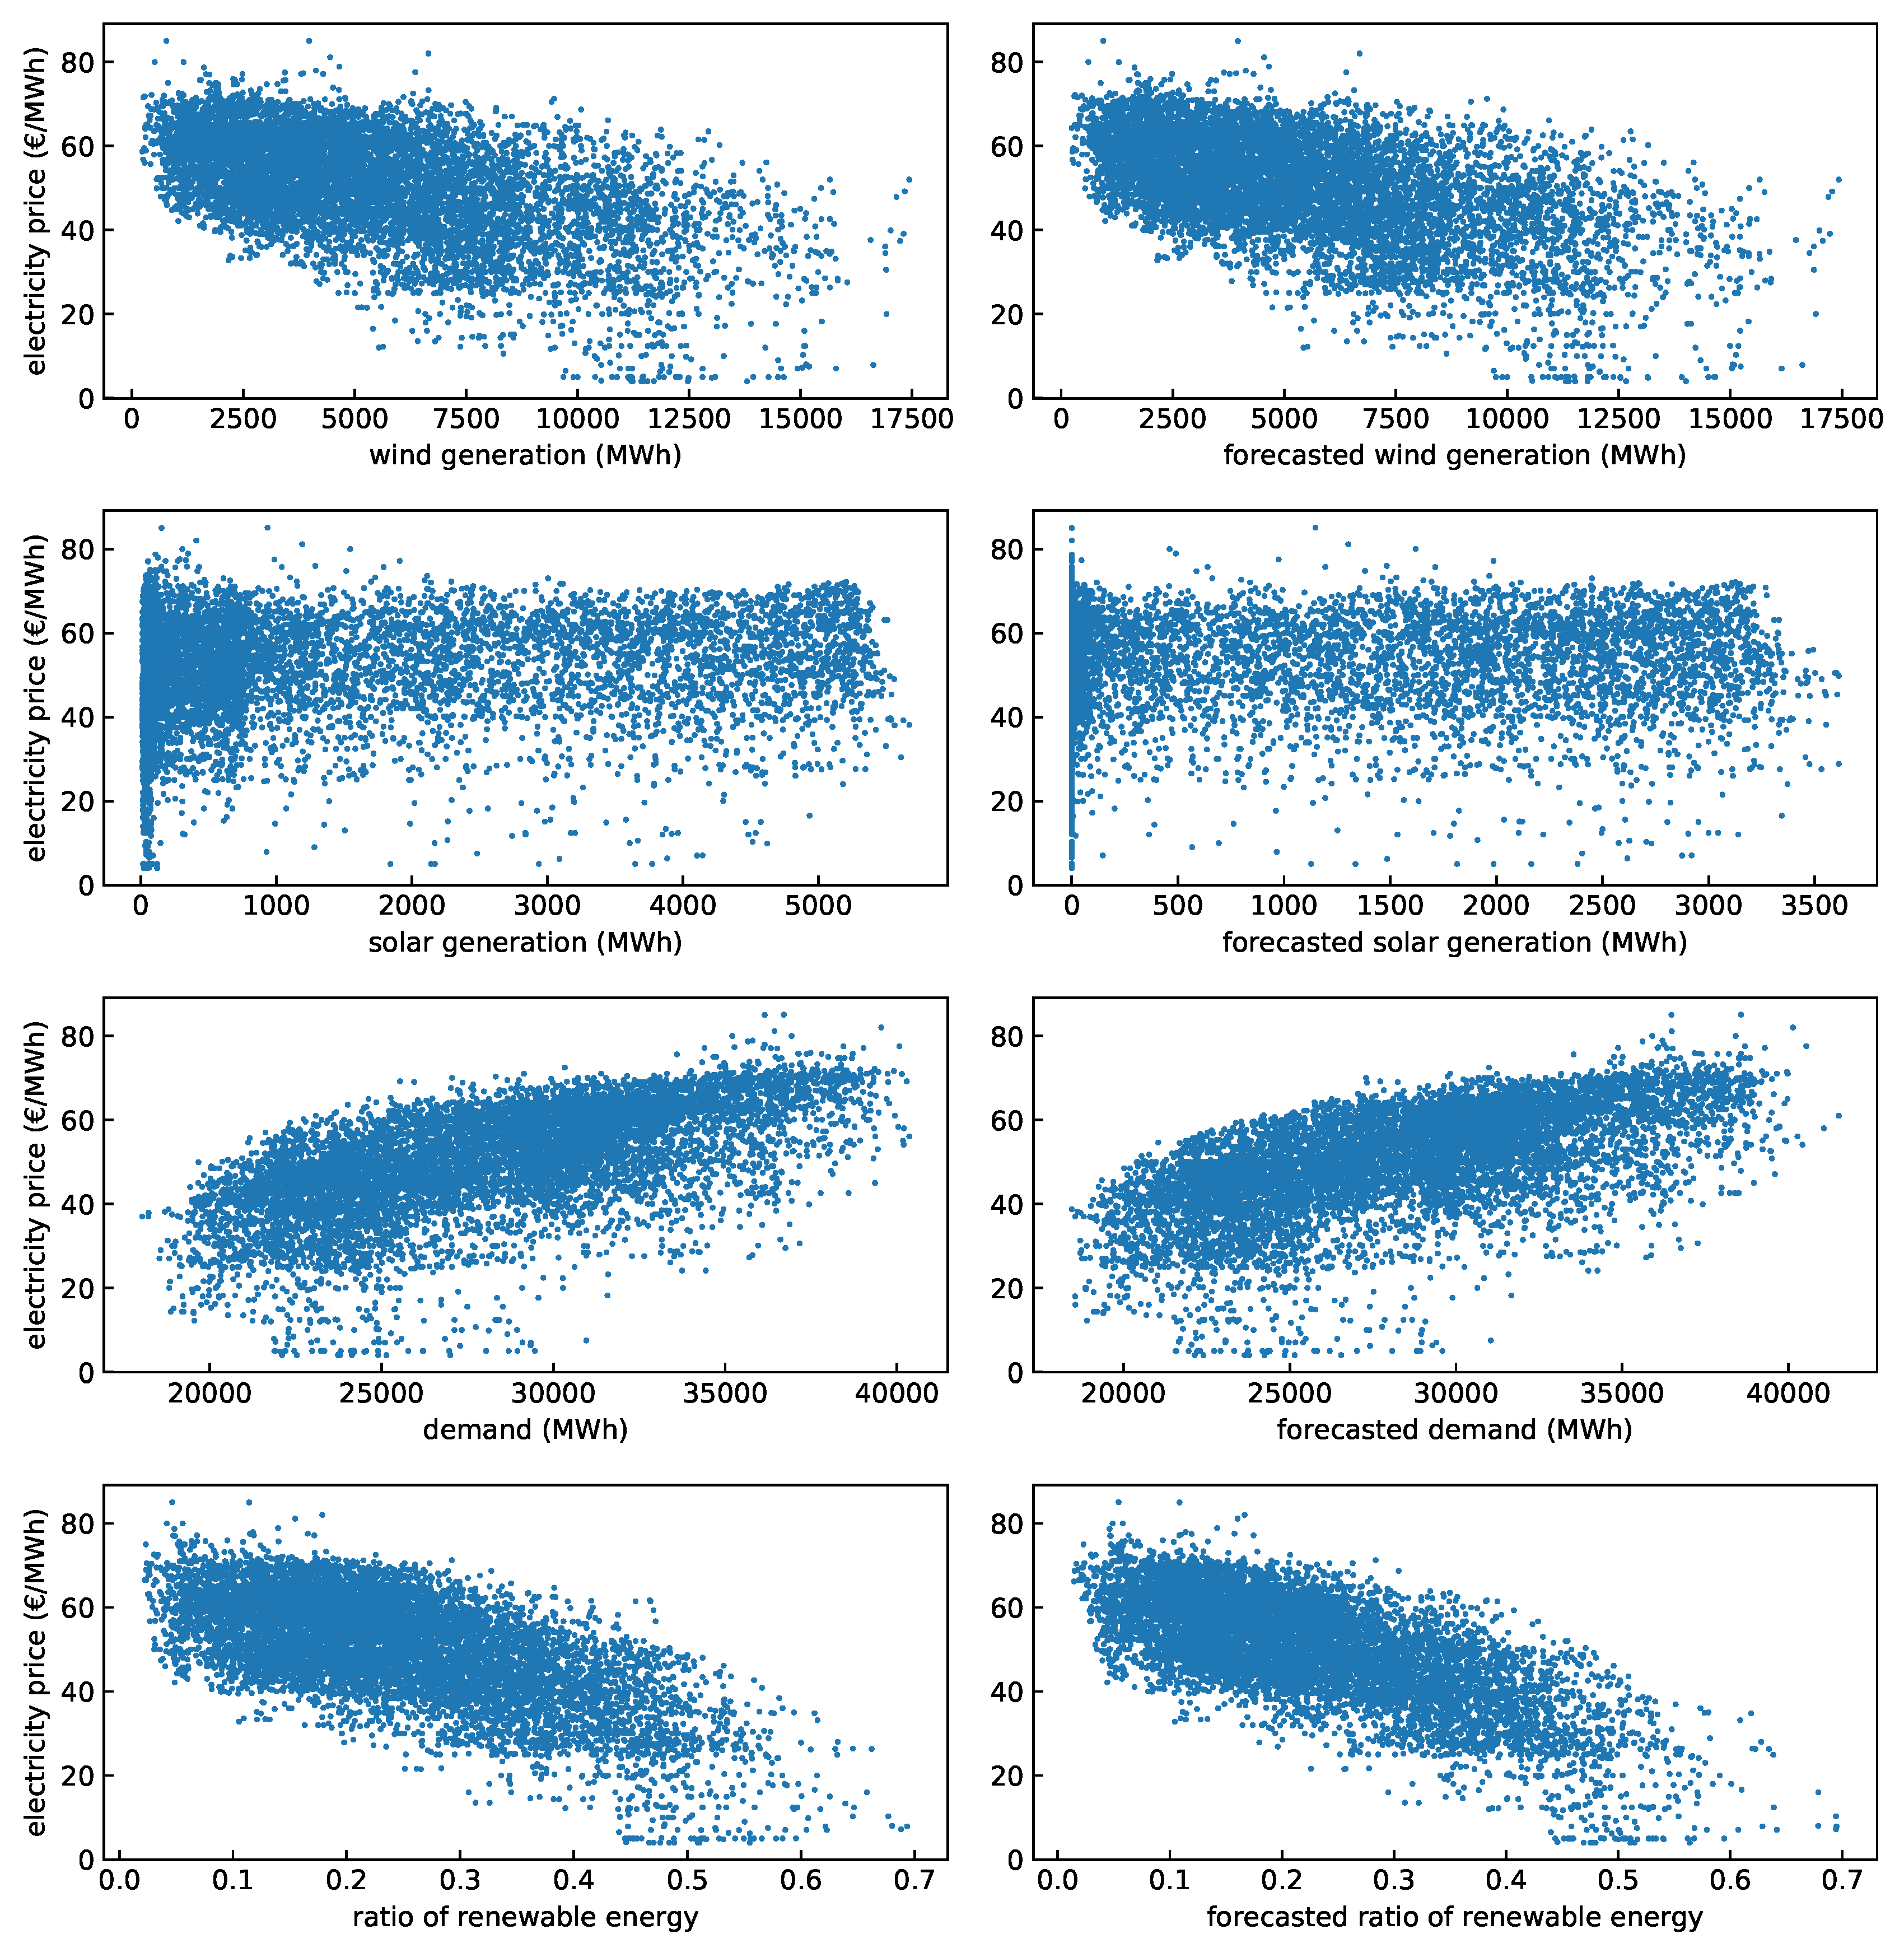
- can we find a correlation between renewable production and spot price? If so, can we find the same correlation with renewables forecasts?
- how does forecast of renewables affect prediction of price? is it a distorting variable or an aligned component for electricity price forecasting?
2. Related Work
3. Preliminaries
3.1. Feedforward Neural Networks
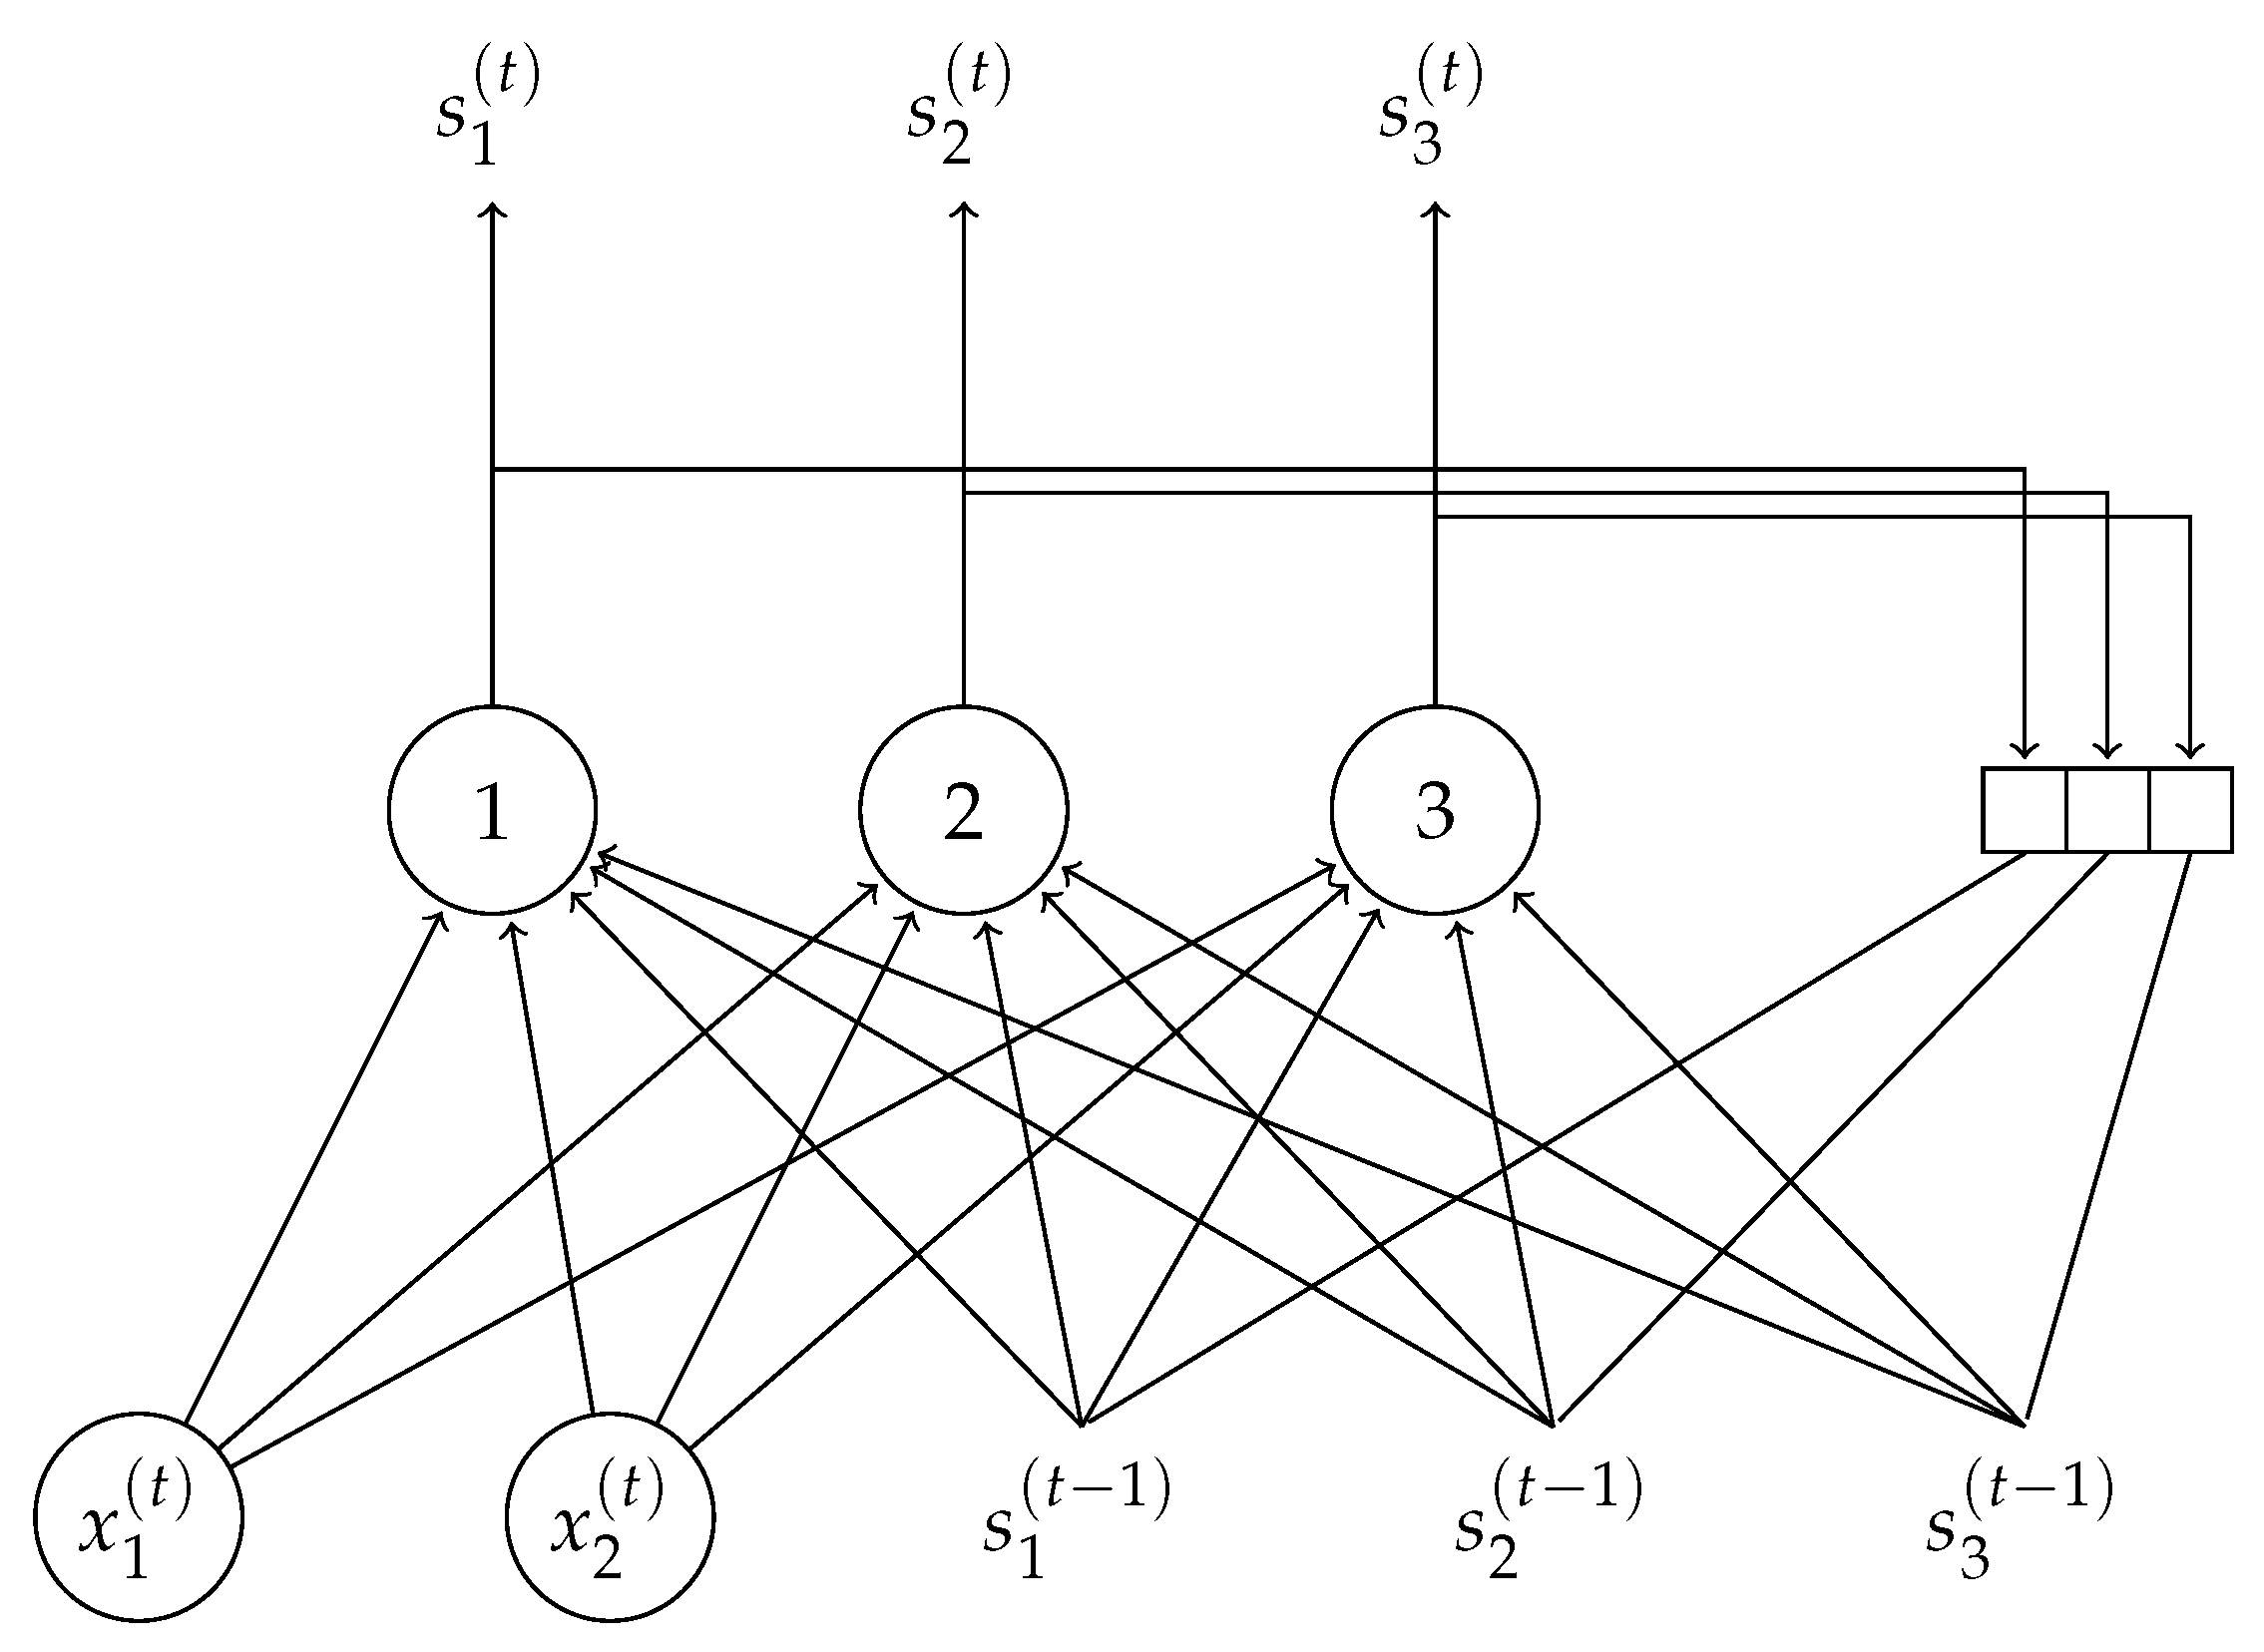
3.2. Recurrent Neural Networks
4. The Day-Ahead Iberian Electricity Market
4.1. Market Description
4.2. Analysis of Historical Data
5. Methodology
5.1. Dataset
- Day-ahead prices: the hourly prices of previous days are the basic input of almost all electricity forecasting systems. Various works have identified correlations between the prices of day d and the previous prices of days , and , reason why time lagged prices are regularly used in the EPF models presented in the literature [49,50]. Therefore, in order to predict the electricity price for a given hour h, , we used the lagged prices , and . This information was published each day after the day-ahead auction by the market operator, OMIE [4].
- Time and calendar: the hour corresponding to each entry in the dataset was registered using an integer variable . Additionally, we provided two other variables with calendar information, an integer for the day of the week, and a boolean to identify the existence or non-existence of a national holiday that day.
- Forecasted generation and demand: as a result of the findings of Section 4.2, we includeD the hourly forecast solar and wind power generation, as well as the hourly forecast demand. The methodology used for the demand forecast was explained in [51]. All three forecasts were provided by the system operator, REE, and can be obtained through its information system, e·sios (Sistema de Información del Operador del Sistema https://www.esios.ree.es/es).
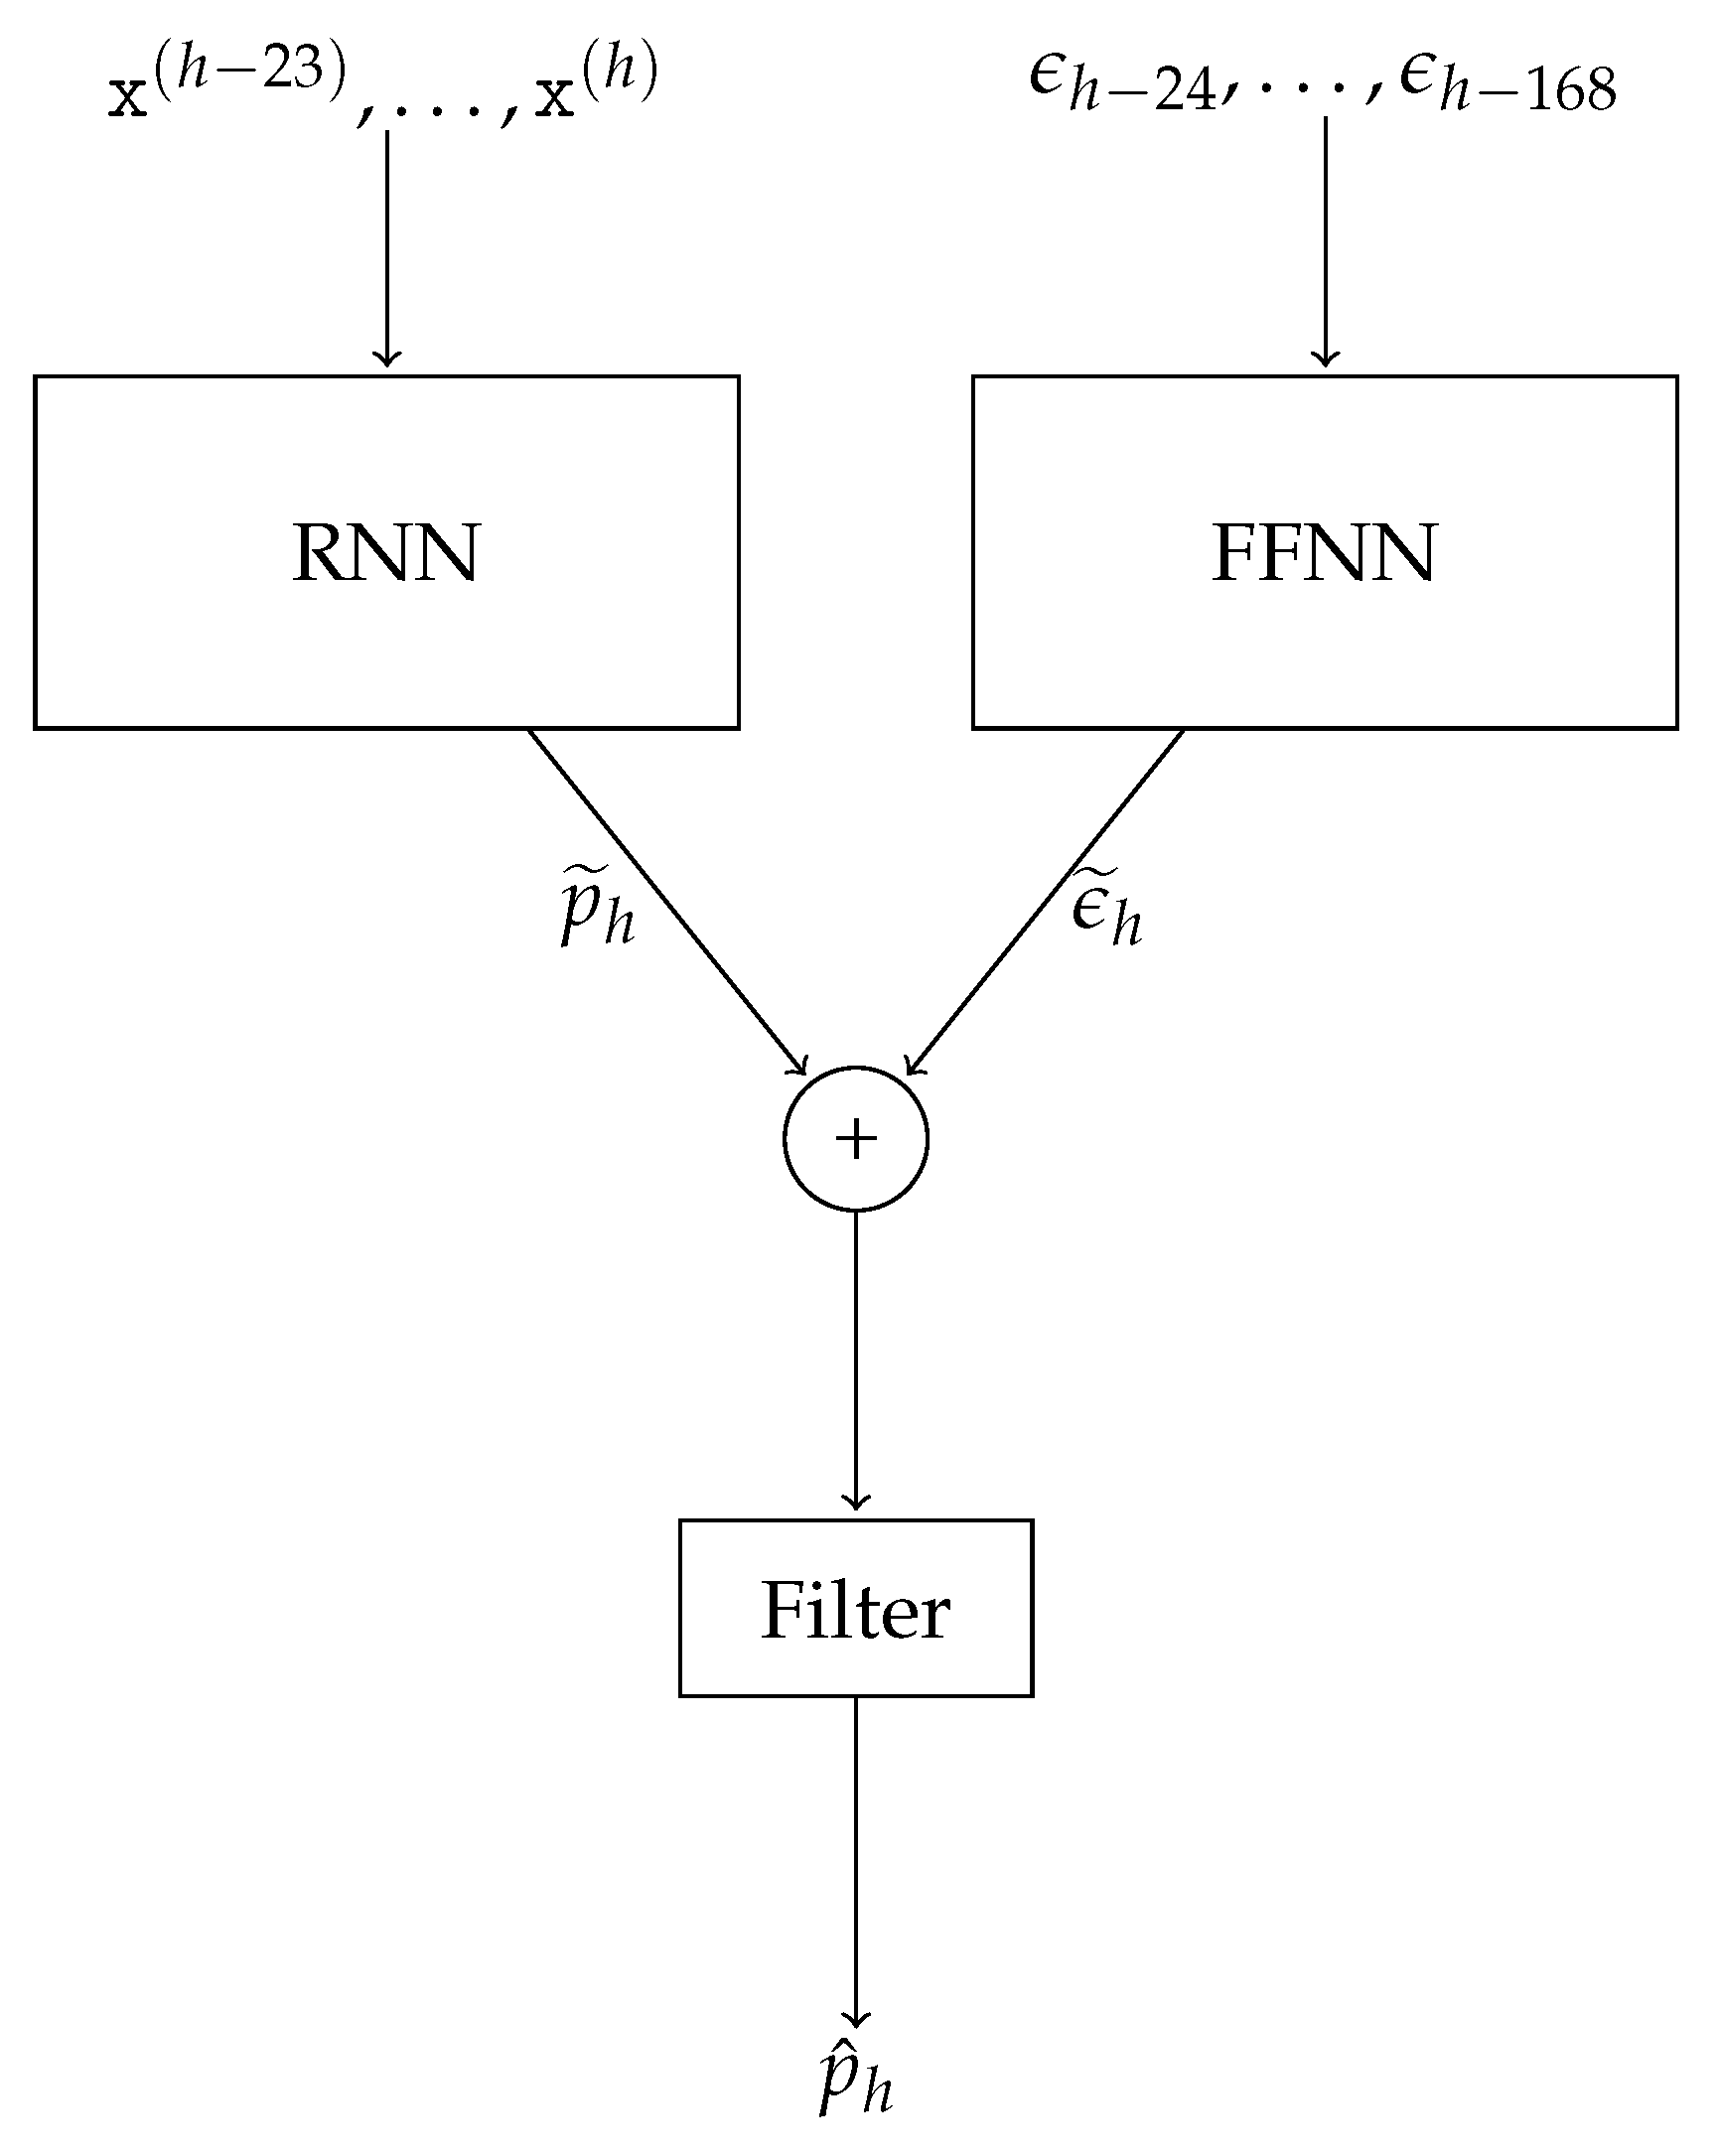
5.2. Proposed Model
- Exogenous variables: the proposed model supported an arbitrary number of exogenous variables, i.e., data outside the price time series. This allowed the inclusion of other explanatory variables, such as the ones presented in Section 5.1.
- Non-linearity: neural networks were able to learn nonlinear dependencies between variables.
- Seasonality: LSTM cells were particularly suitable for learning the order dependence of seasonal data.
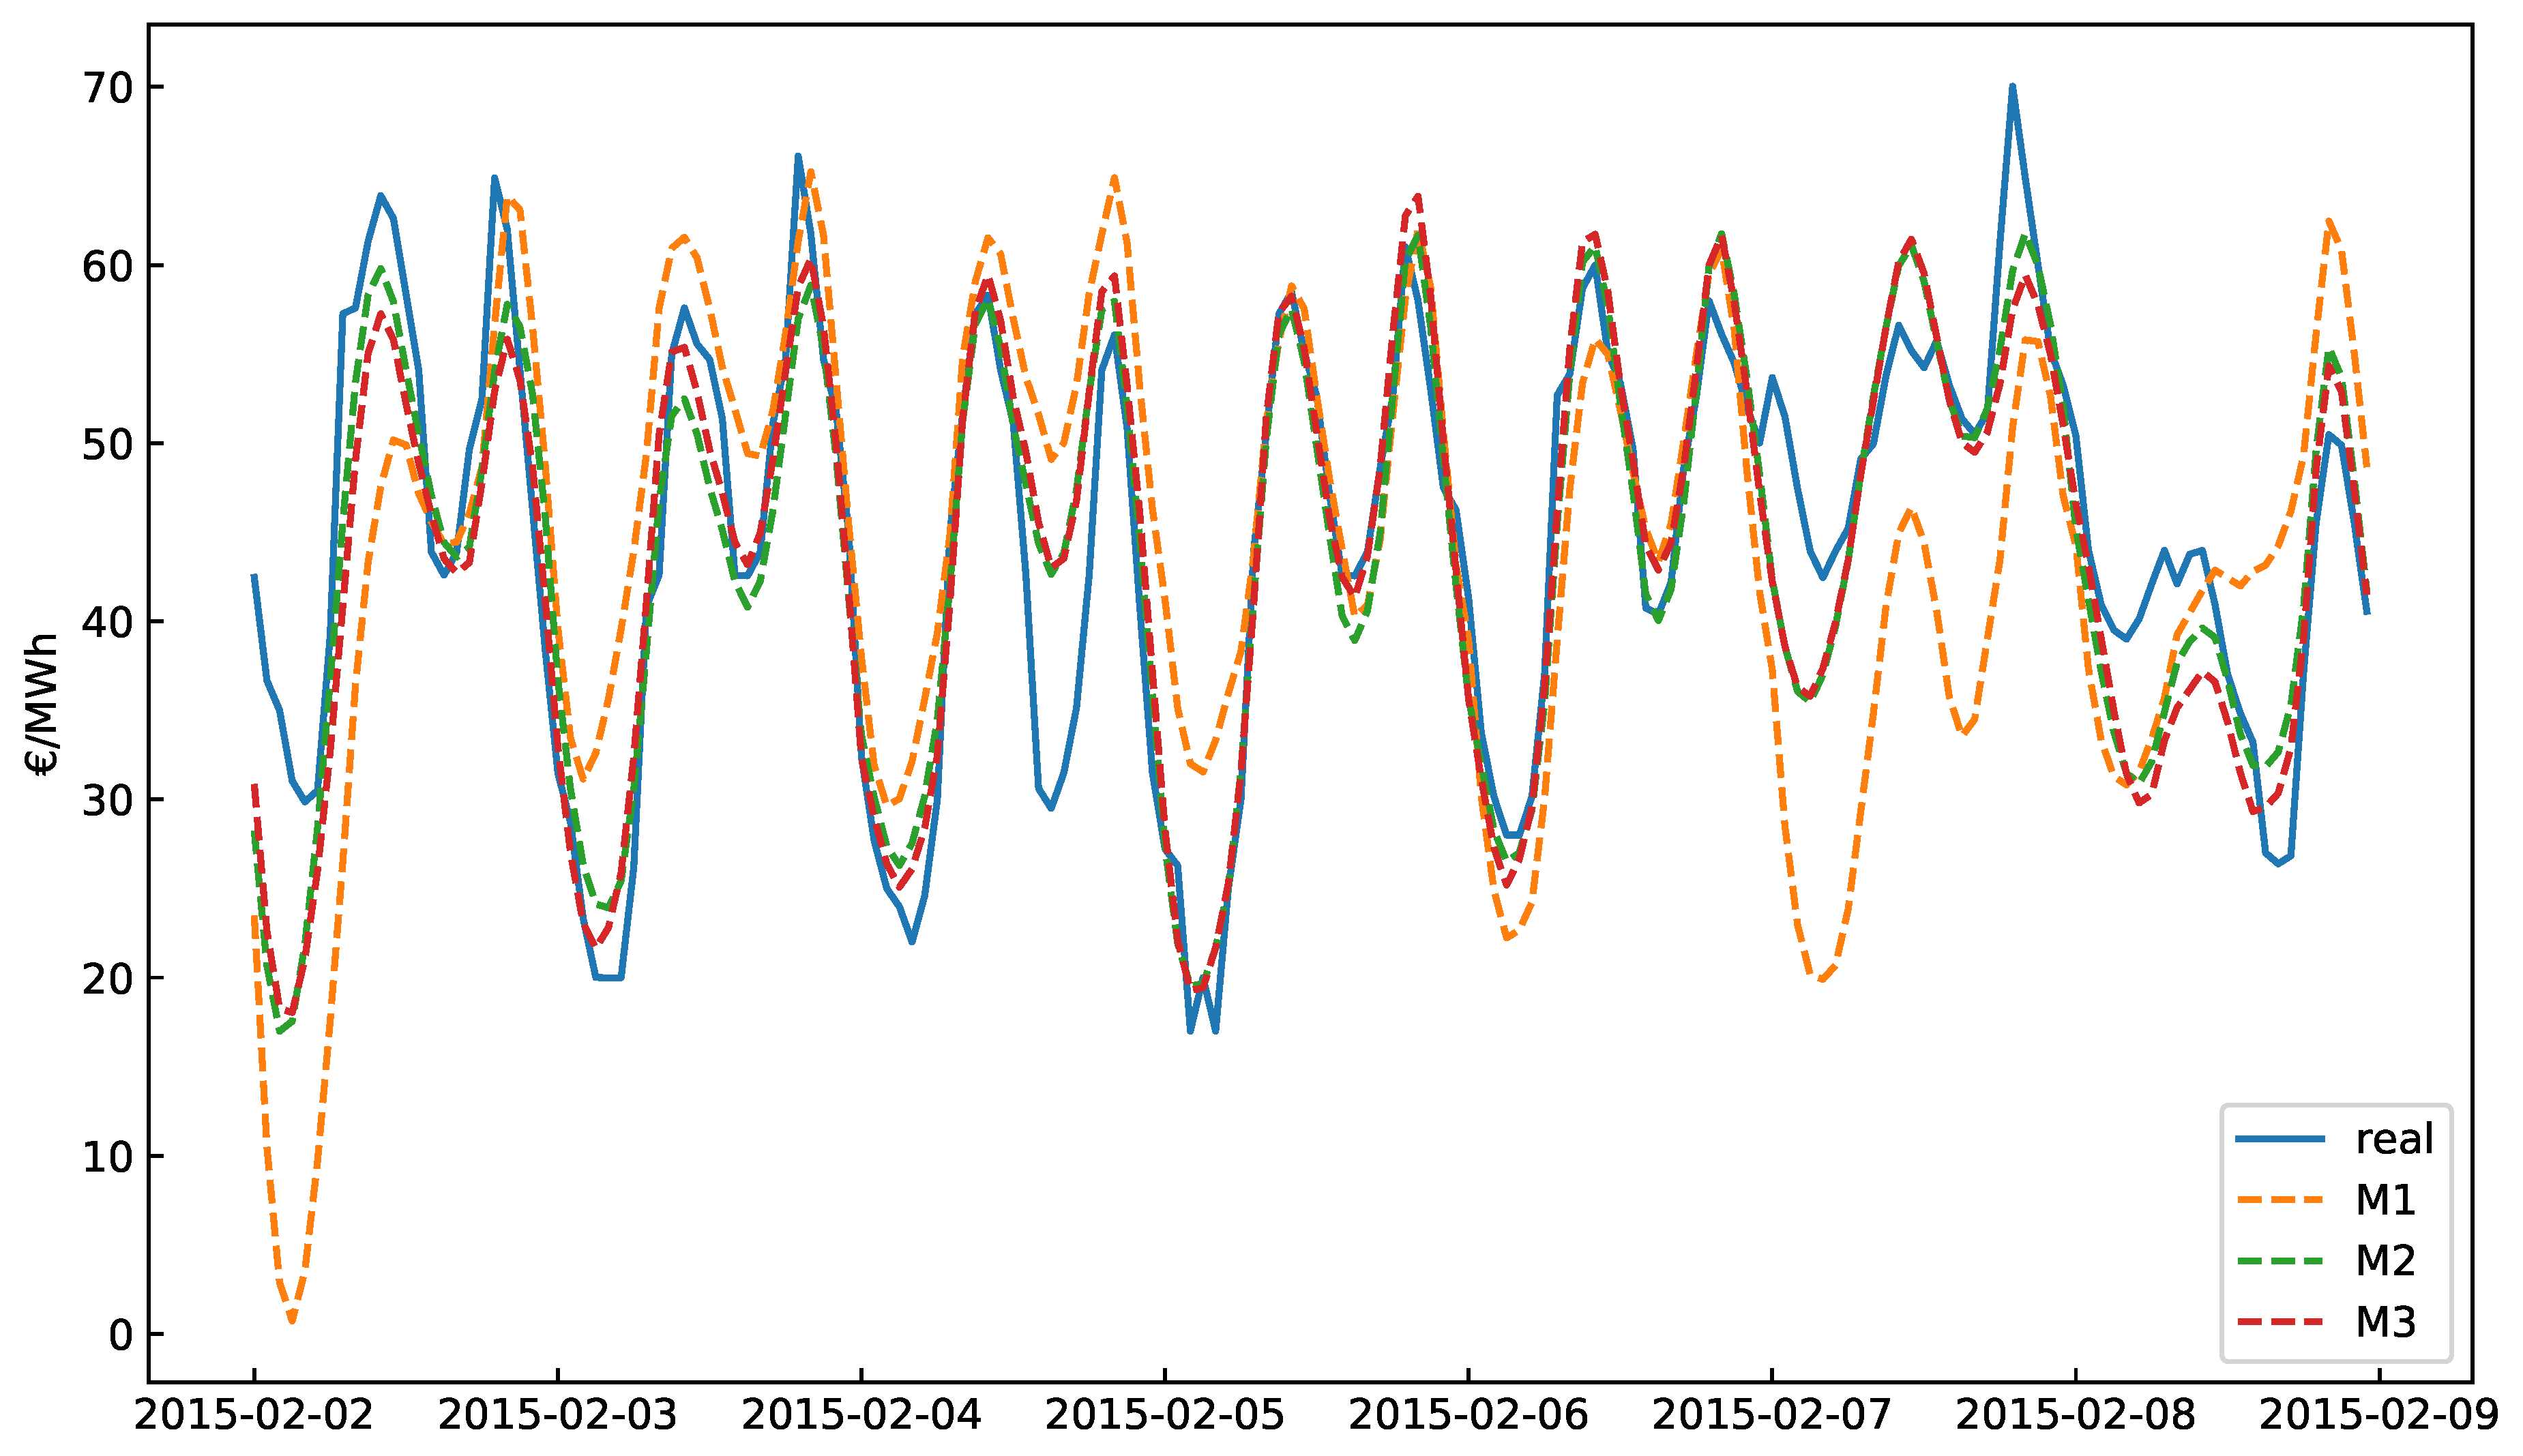
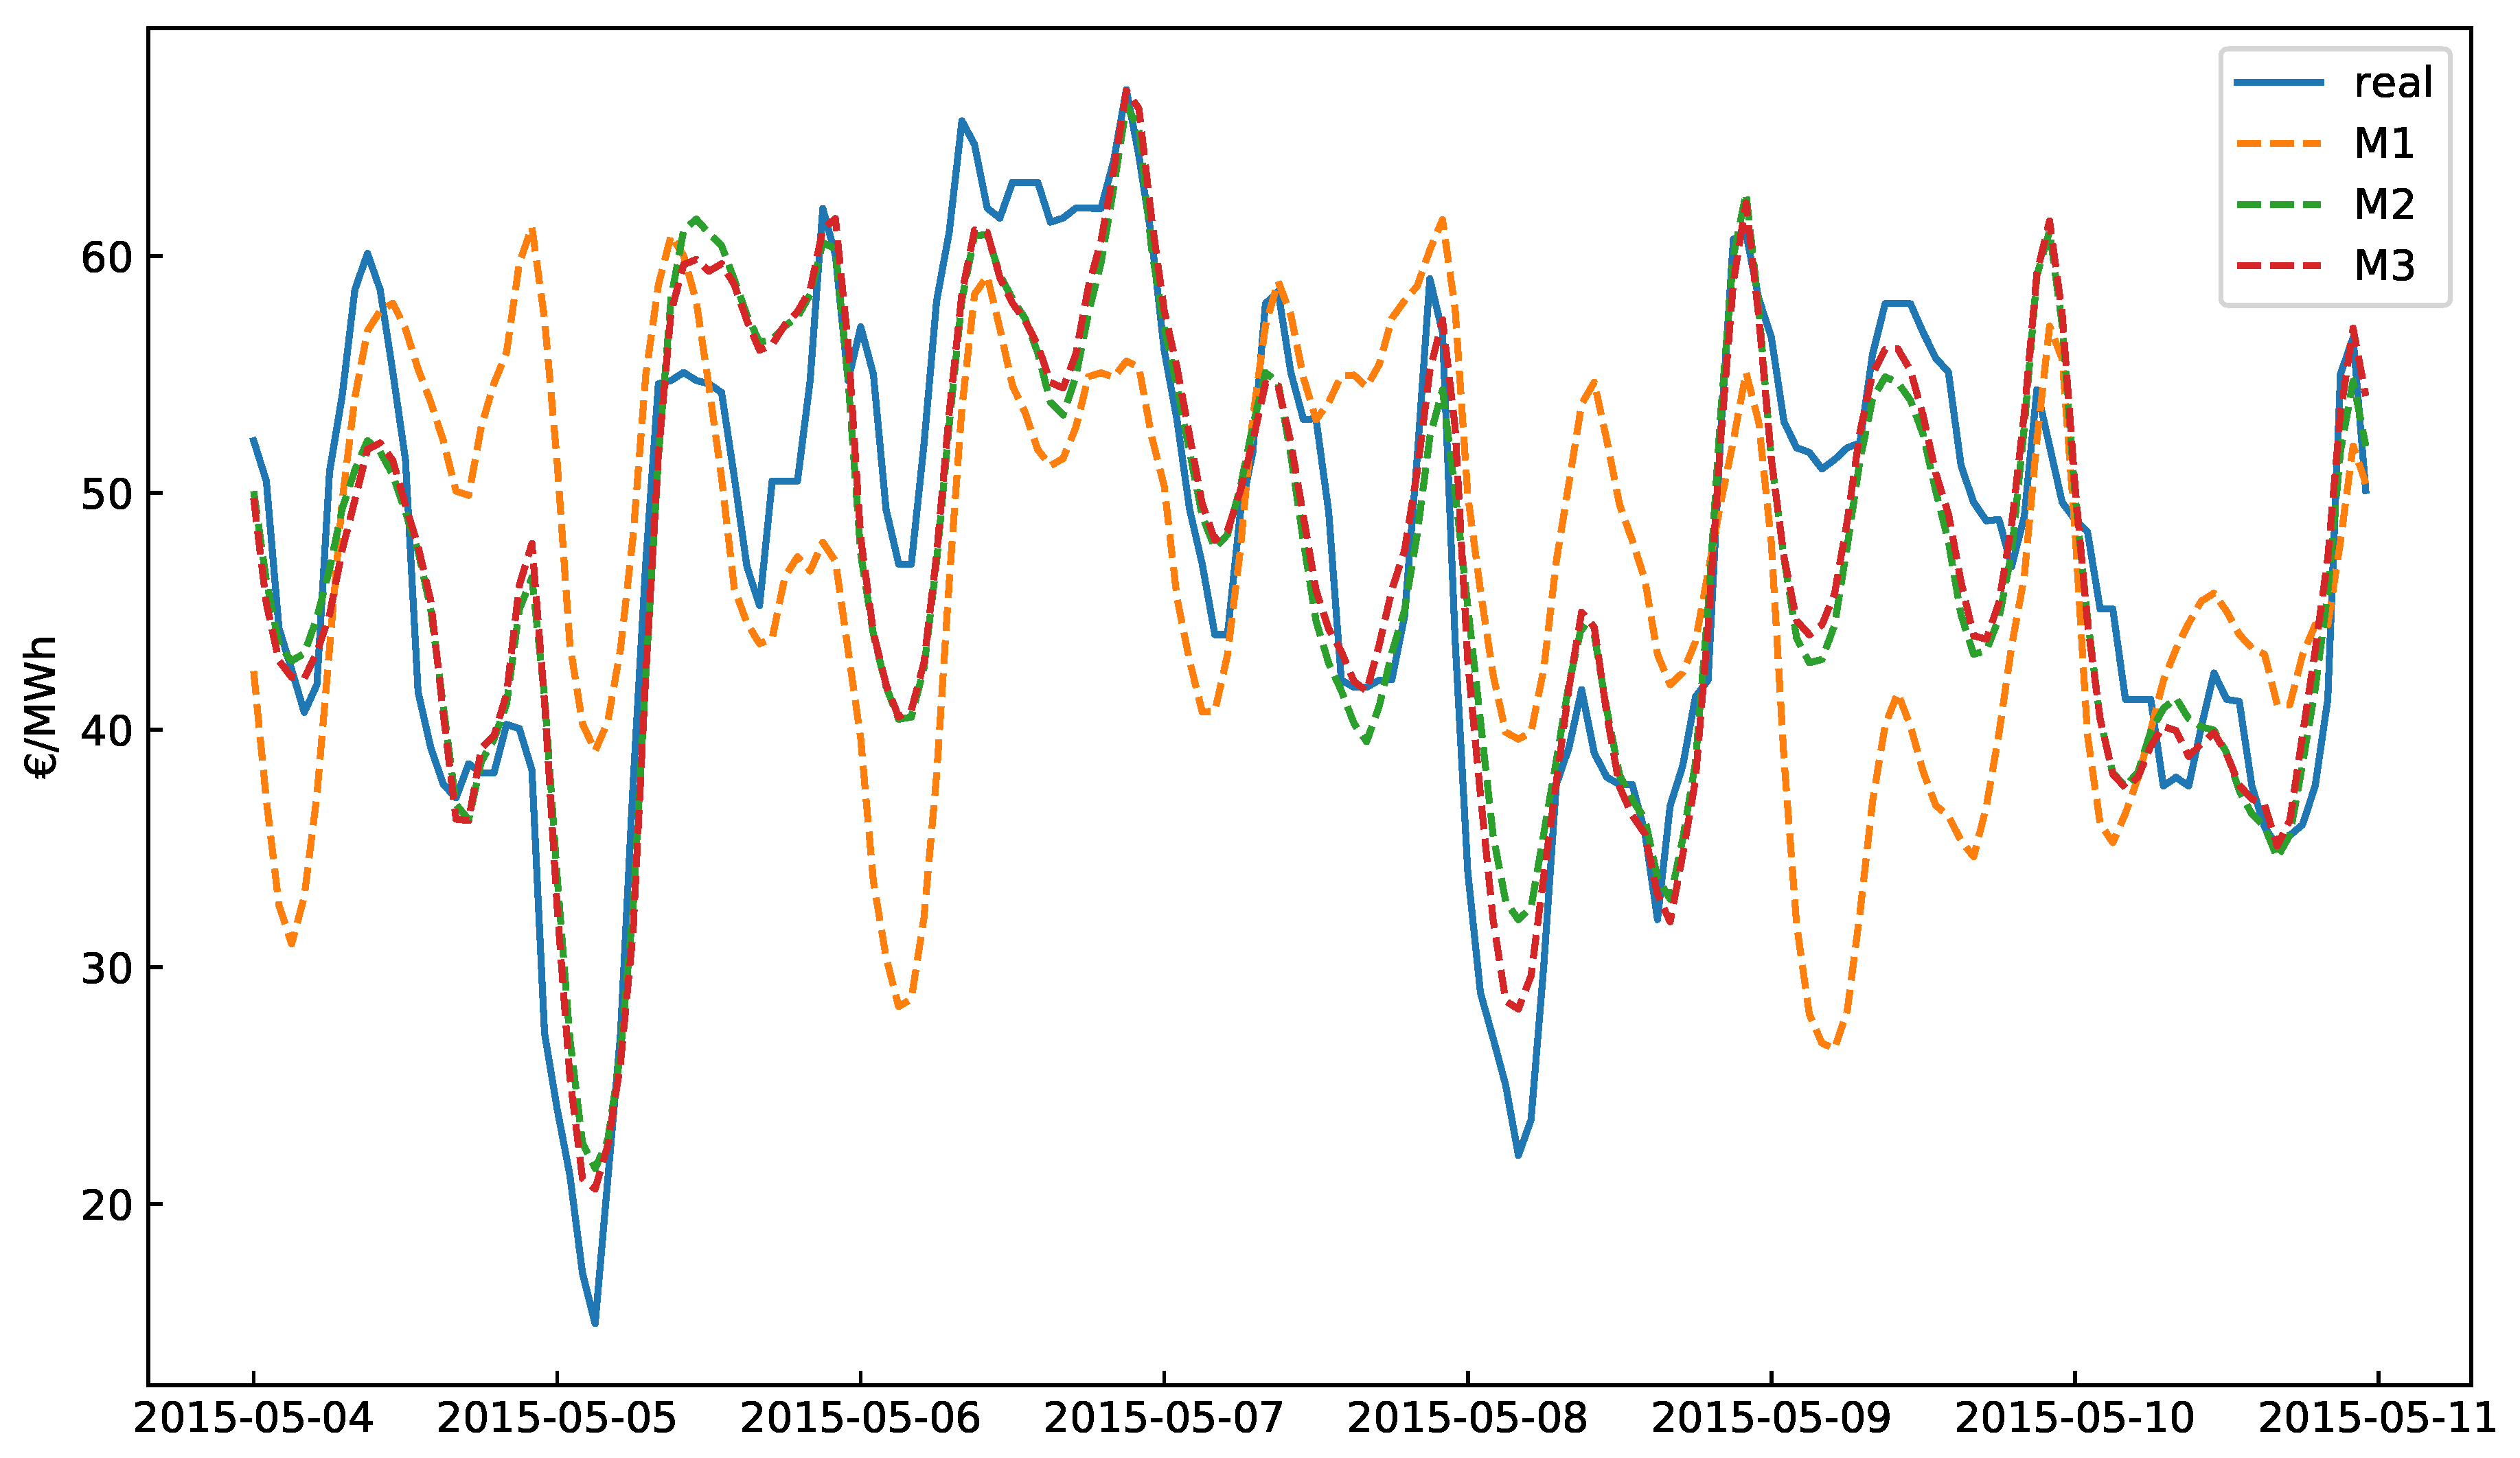
6. Experimental Results
7. Discussion
8. Conclusions
Author Contributions
Funding
Acknowledgments
Conflicts of Interest
References
- Conference of the Parties, Framework Convention on Climate Change, U.N. Adoption of the Paris Agreement. 12 December 2012. Available online: https://unfccc.int/resource/docs/2015/cop21/eng/l09r01.pdf (accessed on 28 April 2019).
- European Commission 2018—Vision for a Long-Term EU Strategy for Reducting Greenhouse Gas Emissions. 2018. Available online: https://ec.europa.eu/clima/policies/strategies/2050_en#tab-0-1 (accessed on 28 April 2019).
- Sanner, B.; Kalf, R.; Land, A.; Mutka, K.; Papillon, P.; Stryi-Hipp, G.; Weiss, W.; Bakker, M.; Froning, S.; Landolina, S.; et al. Common Vision for the Renewable Heating and Cooling Sector in Europe: 2020–2030–2050 of the Renewable Heating and Cooling Technology and Innovation Platform. January 2011. Available online: http://www.rhc-platform.org/publications/ (accessed on 28 April 2019).
- Operador del Mercado Ibérico de Energía—Polo Español—Resultados de mercado. Available online: http://www.omie.es/aplicaciones/datosftp/datosftp.jsp?path= (accessed on 30 September 2017).
- Lorenzo-Sáez, E.; Oliver-Villanueva, J.V.; Luzuriaga, J.E.; Ángel Mateo Pla, M.; Urchueguía, J.F.; Lemus-Zúñiga, L. A Cooperative Agent-Based Management Tool Proposal to Quantify GHG Emissions at Local Level. In KES International Symposium on Agent and Multi-Agent Systems: Technologies and Applications; Springer: Berlin, Germany, 2019; pp. 243–252. [Google Scholar]
- García-Martos, C.; Caro, E.; Jesús Sánchez, M. Electricity price forecasting accounting for renewable energies: optimal combined forecasts. J. Oper. Res. Soc. 2015, 66, 871–884. [Google Scholar] [CrossRef] [Green Version]
- Grossi, L.; Nan, F. Robust forecasting of electricity prices: Simulations, models and the impact of renewable sources. Technol. Forecast. Soc. Chang. 2019, 141, 305–318. [Google Scholar] [CrossRef]
- Madani, K.; Lund, J.R. Estimated impacts of climate warming on California’s high-elevation hydropower. Clim. Chang. 2010, 102, 521–538. [Google Scholar] [CrossRef]
- Moemken, J.; Reyers, M.; Feldmann, H.; Pinto, J.G. Future Changes of Wind Speed and Wind Energy Potentials in EURO-CORDEX Ensemble Simulations. J. Geophys. Res. Atmos. 2018, 123, 6373–6389. [Google Scholar] [CrossRef]
- Jerez, S.; Tobin, I.; Vautard, R.; Juan Pedro Montávez, J.M.L.R.; Thais, F.; Bartok, B.; Ole Bøssing Christensen, A.C.; Michel Déqué, G.N.; Kotlarski, S.; van Meijgaarda, E.; et al. The impact of climate change on photovoltaic power generation in Europe. Nat. Commun. 2015, 6, 10014. [Google Scholar] [CrossRef] [Green Version]
- Martiradonna, L. Robust against climate change. Nat. Mater. 2016, 15, 127. [Google Scholar] [CrossRef]
- Mideksa, T.K.; Kallbekken, S. The impact of climate change on the electricity market: A review. Energy Policy 2010, 38, 3579–3585. [Google Scholar] [CrossRef]
- Golombek, R.; Kittelsen, S.A.C.; Haddeland, I. Climate change: Impacts on electricity markets in Western Europe. Clim. Chang. 2012, 113, 357–370. [Google Scholar] [CrossRef]
- Giulietti, M.; Grossi, L.; Trujillo-Baute, E.; Waterson, M. Analysing the potential economic value of energy storage. Energy J. 2018, 39, 101–122. [Google Scholar] [CrossRef]
- Borenstein, S. The Private and Public Economics of Renewable Electricity Generation. J. Econ. Perspect. 2012, 26, 67–92. [Google Scholar] [CrossRef] [Green Version]
- Sanjeev Kumar Aggarwal, L.M.S.; Kumar, A. Electricity price forecasting in deregulated markets: A review and evaluation. Int. J. Electr. Power Energy Syst. 2009, 31, 13–22. [Google Scholar] [CrossRef]
- Notton, G.; Nivet, M.L.; Voyant, C.; Paoli, C.; Darras, C.; Motte, F.; Fouilloy, A. Intermittent and stochastic character of renewable energy sources: Consequences, cost of intermittence and benefit of forecasting. Renew. Sustain. Energy Rev. 2018, 87, 96–105. [Google Scholar] [CrossRef]
- Wozabal, D.; Graf, C.; Hirschmann, D. The effect of intermittent renewables on the electricity price variance. OR Spectr. 2016, 38, 687–709. [Google Scholar] [CrossRef]
- Green, R.; Vasilakos, N. Market behaviour with large amounts of intermittent generation. Energy Policy 2010, 38, 3211–3220. [Google Scholar] [CrossRef] [Green Version]
- Jacobsen, H.K.; Zvingilaite, E. Reducing the market impact of large shares of intermittent energy in Denmark. Energy Policy 2010, 38, 3403–3413. [Google Scholar] [CrossRef]
- Woo, C.; Horowitz, I.; Moore, J.; Pacheco, A. The impact of wind generation on the electricity spot-market price level and variance: The Texas experience. Energy Policy 2011, 39, 3939–3944. [Google Scholar] [CrossRef]
- Martinez-Anido, C.B.; Brinkman, G.; Hodge, B.M. The impact of wind power on electricity prices. Renew. Energy 2016, 94, 474–487. [Google Scholar] [CrossRef] [Green Version]
- Paraschiv, F.; Erni, D.; Pietsch, R. The impact of renewable energies on EEX day-ahead electricity prices. Energy Policy 2014, 73, 196–210. [Google Scholar] [CrossRef] [Green Version]
- Milstein, I.; Tishler, A. Can price volatility enhance market power? The case of renewable technologies in competitive electricity markets. Resour. Energy Econ. 2015, 41, 70–90. [Google Scholar] [CrossRef]
- Mulder, M.; Scholtens, B. The impact of renewable energy on electricity prices in The Netherlands. Renew. Energy 2013, 57, 94–100. [Google Scholar] [CrossRef]
- Weron, R. Electricity price forecasting: A review of the state-of-the-art with a look into the future. Int. J. Forecast. 2014, 30, 1030–1081. [Google Scholar] [CrossRef] [Green Version]
- Contreras, J.; Espinola, R.; Nogales, F.; Conejo, A. ARIMA models to predict next-day electricity prices. IEEE Trans. Power Syst. 2003, 18, 1014–1020. [Google Scholar] [CrossRef]
- Crespo Cuaresma, J.; Hlouskova, J.; Kossmeier, S.; Obersteiner, M. Forecasting electricity spot-prices using linear univariate time-series models. Appl. Energy 2004, 77, 87–106. [Google Scholar] [CrossRef]
- Conejo, A.J.; Contreras, J.; Espínola, R.; Plazas, M.A. Forecasting electricity prices for a day-ahead pool-based electric energy market. Int. J. Forecast. 2005, 21, 435–462. [Google Scholar] [CrossRef]
- Misiorek, A.; Trueck, S.; Weron, R. Point and Interval Forecasting of Spot Electricity Prices: Linear vs. Non-Linear Time Series Models. Stud. Nonlinear Dyn. Econom. 2006, 10, 1–34. [Google Scholar] [CrossRef]
- Garcia, R.; Contreras, J.; van Akkeren, M.; Garcia, J. A GARCH Forecasting Model to Predict Day-Ahead Electricity Prices. IEEE Trans. Power Syst. 2005, 20, 867–874. [Google Scholar] [CrossRef]
- Gareta, R.; Romeo, L.M.; Gil, A. Forecasting of electricity prices with neural networks. Energy Conv. Manag. 2006, 47, 1770–1778. [Google Scholar] [CrossRef]
- Catalão, J.; Mariano, S.; Mendes, V.; Ferreira, L. Short-term electricity prices forecasting in a competitive market: A neural network approach. Electr. Power Syst. Res. 2007, 77, 1297–1304. [Google Scholar] [CrossRef]
- Monteiro, C.; Fernandez-Jimenez, L.A.; Ramirez-Rosado, I.J. Explanatory information analysis for day-ahead price forecasting in the Iberian electricity market. Energies 2015, 8, 10464–10486. [Google Scholar] [CrossRef]
- Monteiro, C.; Ramirez-Rosado, I.J.; Fernandez-Jimenez, L.A.; Conde, P. Short-Term Price Forecasting Models Based on Artificial Neural Networks for Intraday Sessions in the Iberian Electricity Market. Energies 2016, 9, 721. [Google Scholar] [CrossRef]
- Saini, L.; Aggarwal, S.; Kumar, A. Parameter optimisation using genetic algorithm for support vector machine-based price-forecasting model in National electricity market. IET Gener. Transm. Distrib. 2010, 4, 36–49. [Google Scholar] [CrossRef]
- Juárez, I.; Mira-McWilliams, J.; González, C. Important variable assessment and electricity price forecasting based on regression tree models: Classification and regression trees, Bagging and Random Forests. IET Gener. Transm. Distrib. 2015, 9, 1120–1128. [Google Scholar]
- Lora, A.T.; Santos, J.R.; Santos, J.R.; Ramos, J.L.M.; Exposito, A.G. Electricity Market Price Forecasting: Neural Networks versus Weighted-Distance k Nearest Neighbours; Springer: Berlin/Heidelberg, Germany, 2002; pp. 321–330. [Google Scholar]
- Anbazhagan, S.; Kumarappan, N. Day-Ahead Deregulated Electricity Market Price Forecasting Using Recurrent Neural Network. IEEE Syst. J. 2013, 7, 866–872. [Google Scholar] [CrossRef]
- Sharma, V.; Srinivasan, D. A hybrid intelligent model based on recurrent neural networks and excitable dynamics for price prediction in deregulated electricity market. Eng. Appl. Artif. Intell. 2013, 26, 1562–1574. [Google Scholar] [CrossRef]
- Ugurlu, U.; Oksuz, I.; Tas, O. Electricity Price Forecasting Using Recurrent Neural Networks. Energies 2018, 11, 1255. [Google Scholar] [CrossRef]
- Kuo, P.H.; Huang, C.J. An Electricity Price Forecasting Model by Hybrid Structured Deep Neural Networks. Sustainability 2018, 10, 1280. [Google Scholar] [CrossRef]
- Lago, J.; Ridder, F.D.; Schutter, B.D. Forecasting spot electricity prices: Deep learning approaches and empirical comparison of traditional algorithms. Appl. Energy 2018, 221, 386–405. [Google Scholar] [CrossRef]
- Pórtoles, J.; González, C.; Moguerza, J.M. Electricity Price Forecasting with Dynamic Trees: A Benchmark Against the Random Forest Approach. Energies 2018, 11, 1588. [Google Scholar] [CrossRef]
- Monteiro, C.; Ramirez-Rosado, I.J.; Fernandez-Jimenez, L.A.; Ribeiro, M. New probabilistic price forecasting models: Application to the Iberian electricity market. Int. J. Electr. Power Energy Syst. 2018, 103, 483–496. [Google Scholar] [CrossRef]
- Rumelhart, D.E.; Hinton, G.E.; Williams, R.J. Learning representations by back-propagating errors. Nature 1986, 323, 533–536. [Google Scholar] [CrossRef]
- Hochreiter, S.; Schmidhuber, J. Long short-term memory. Neural Comput. 1997, 9, 1735–1780. [Google Scholar] [CrossRef]
- EUPHEMIA Public Description - PCR Market Coupling Algorithm. Available online: http://m.omie.es/files/16_11_28_Euphemia%20Public%20Description.pdf?m=yes (accessed on 25 October 2018).
- Nogales, F.; Contreras, J.; Conejo, A.; Espinola, R. Forecasting next-day electricity prices by time series models. IEEE Trans. Power Syst. 2002, 17, 342–348. [Google Scholar] [CrossRef]
- Amjady, N.; Keynia, F. Day-ahead price forecasting of electricity markets by mutual information technique and cascaded neuro-evolutionary algorithm. IEEE Trans. Power Syst. 2009, 24, 306–318. [Google Scholar] [CrossRef]
- Cancelo, J.R.; Espasa, A.; Grafe, R. Forecasting the electricity load from one day to one week ahead for the Spanish system operator. Int. J. Forecast. 2008, 24, 588–602. [Google Scholar] [CrossRef] [Green Version]
- Ministerio de Industria, T.Y.C. Real Decreto 1578/2008, de 26 de Septiembre, de Retribución de la Actividad de Producción de Energía Eléctrica Mediante Tecnología Solar Fotovoltaica para Instalaciones Posteriores a la Fecha Límite de Mantenimiento de la Retribución del Real Decreto 661/2007, de 25 de mayo, para Dicha Tecnología. 2008. Available online: https://www.boe.es/boe/dias/2008/09/27/pdfs/A39117-39125.pdf (accessed on 6 April 2019).
- Ministerio Para La Transición Ecológica. Real Decreto 244/2019, de 5 de abril, por el que se Regulan las Condiciones Administrativas, Técnicas y Económicas del Autoconsumo de Energía Eléctrica. 2019. Available online: https://www.boe.es/boe/dias/2019/04/06/pdfs/BOE-A-2019-5089.pdf (accessed on 6 April 2019).


| Variable | Category | Description | Range |
|---|---|---|---|
| V1 | Day-ahead prices | 0–110 €/MWh | |
| V2 | Day-ahead prices | 0–110 €/MWh | |
| V3 | Day-ahead prices | 0–110 €/MWh | |
| V4 | Time and calendar | Hour | 0–23 |
| V5 | Time and calendar | Week day | 0–6 |
| V6 | Time and calendar | National holiday | 0–1 |
| V7 | Forecasted generation and demand | Forecasted solar generation for h | 0–3650.2 MWh |
| V8 | Forecasted generation and demand | Forecasted wind generation for h | 277–17,385 MWh |
| V9 | Forecasted generation and demand | Forecasted demand for h | 17,599–40,050 MWh |
| V10 | Derived variable | forecasted ratio of renewable energy for h | 0–1 |
| Variable | Description | M1 | M2 | M3 |
|---|---|---|---|---|
| V1 | √ | √ | √ | |
| V2 | √ | √ | √ | |
| V3 | √ | √ | √ | |
| V4 | Hour | √ | √ | √ |
| V5 | Week day | √ | √ | √ |
| V6 | National holiday | √ | √ | √ |
| V7 | Forecasted wind generation for h | - | √ | √ |
| V8 | Forecasted solar generation for h | - | √ | √ |
| V9 | Forecasted demand for h | - | √ | √ |
| V10 | Forecasted ratio of renewable energy for h | - | - | √ |
| Week | Period | Season |
|---|---|---|
| W1 | 2 February–8 February | Winter |
| W2 | 4 May–10 May | Spring |
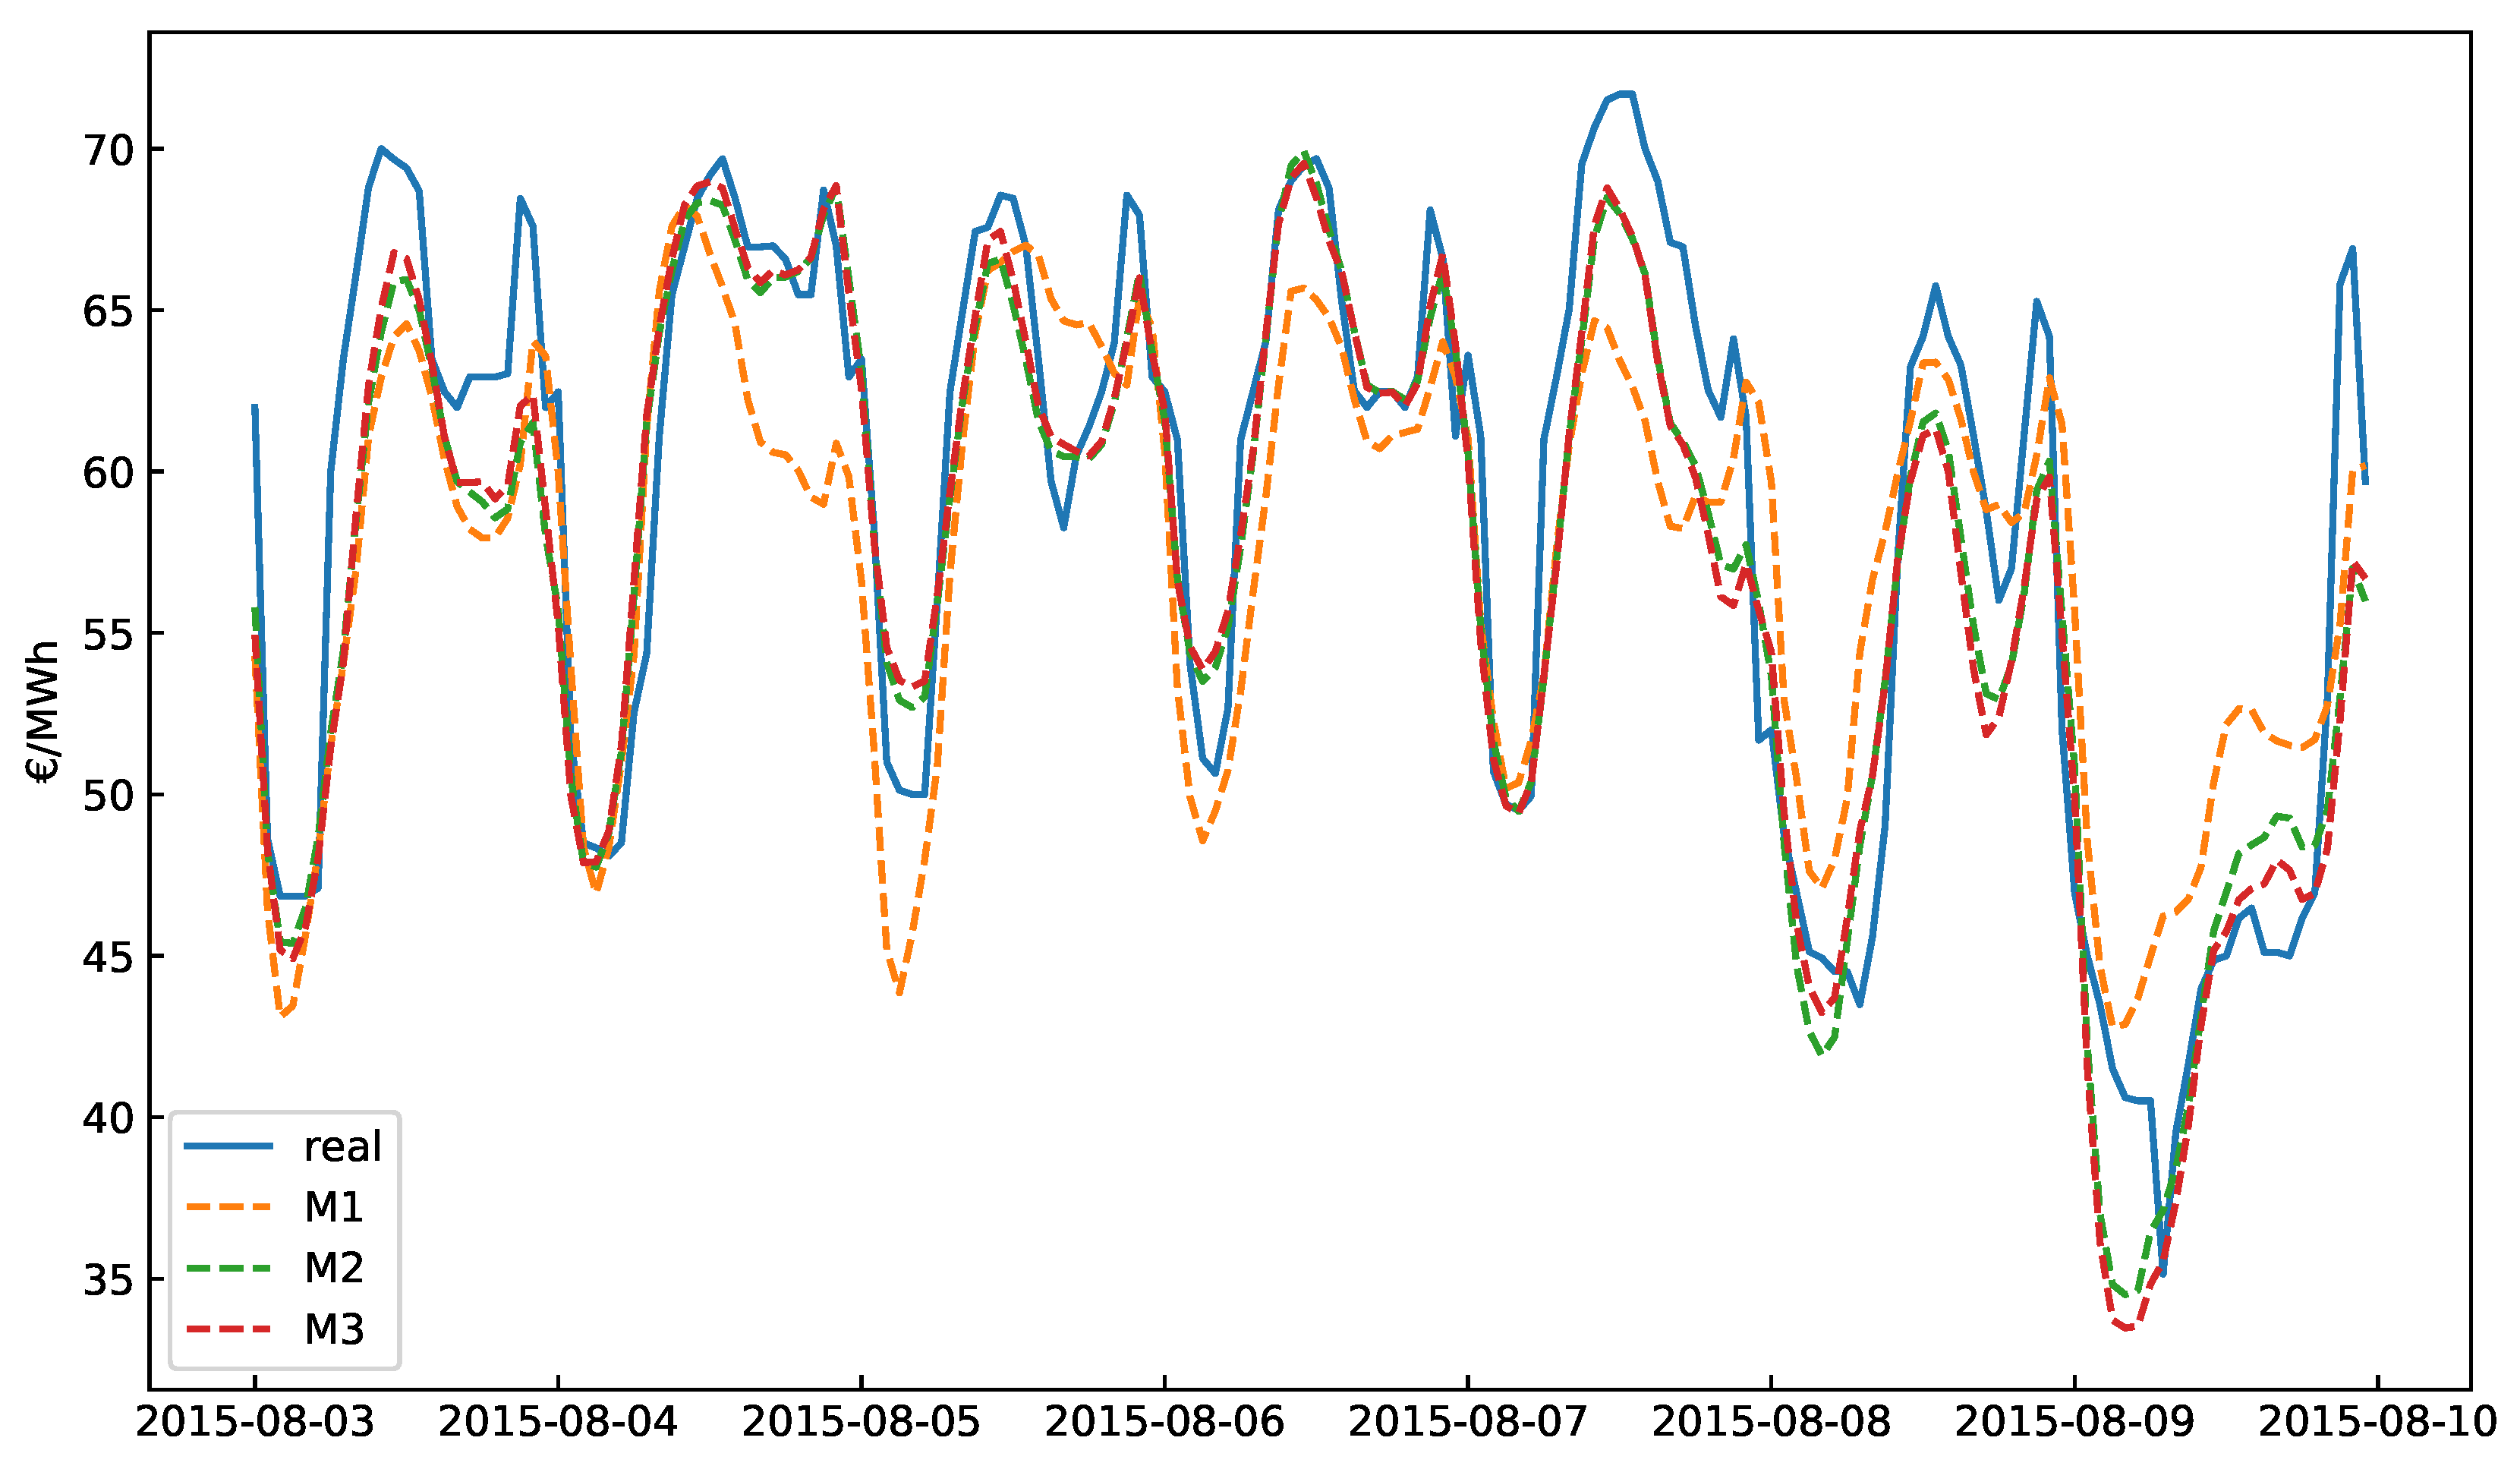
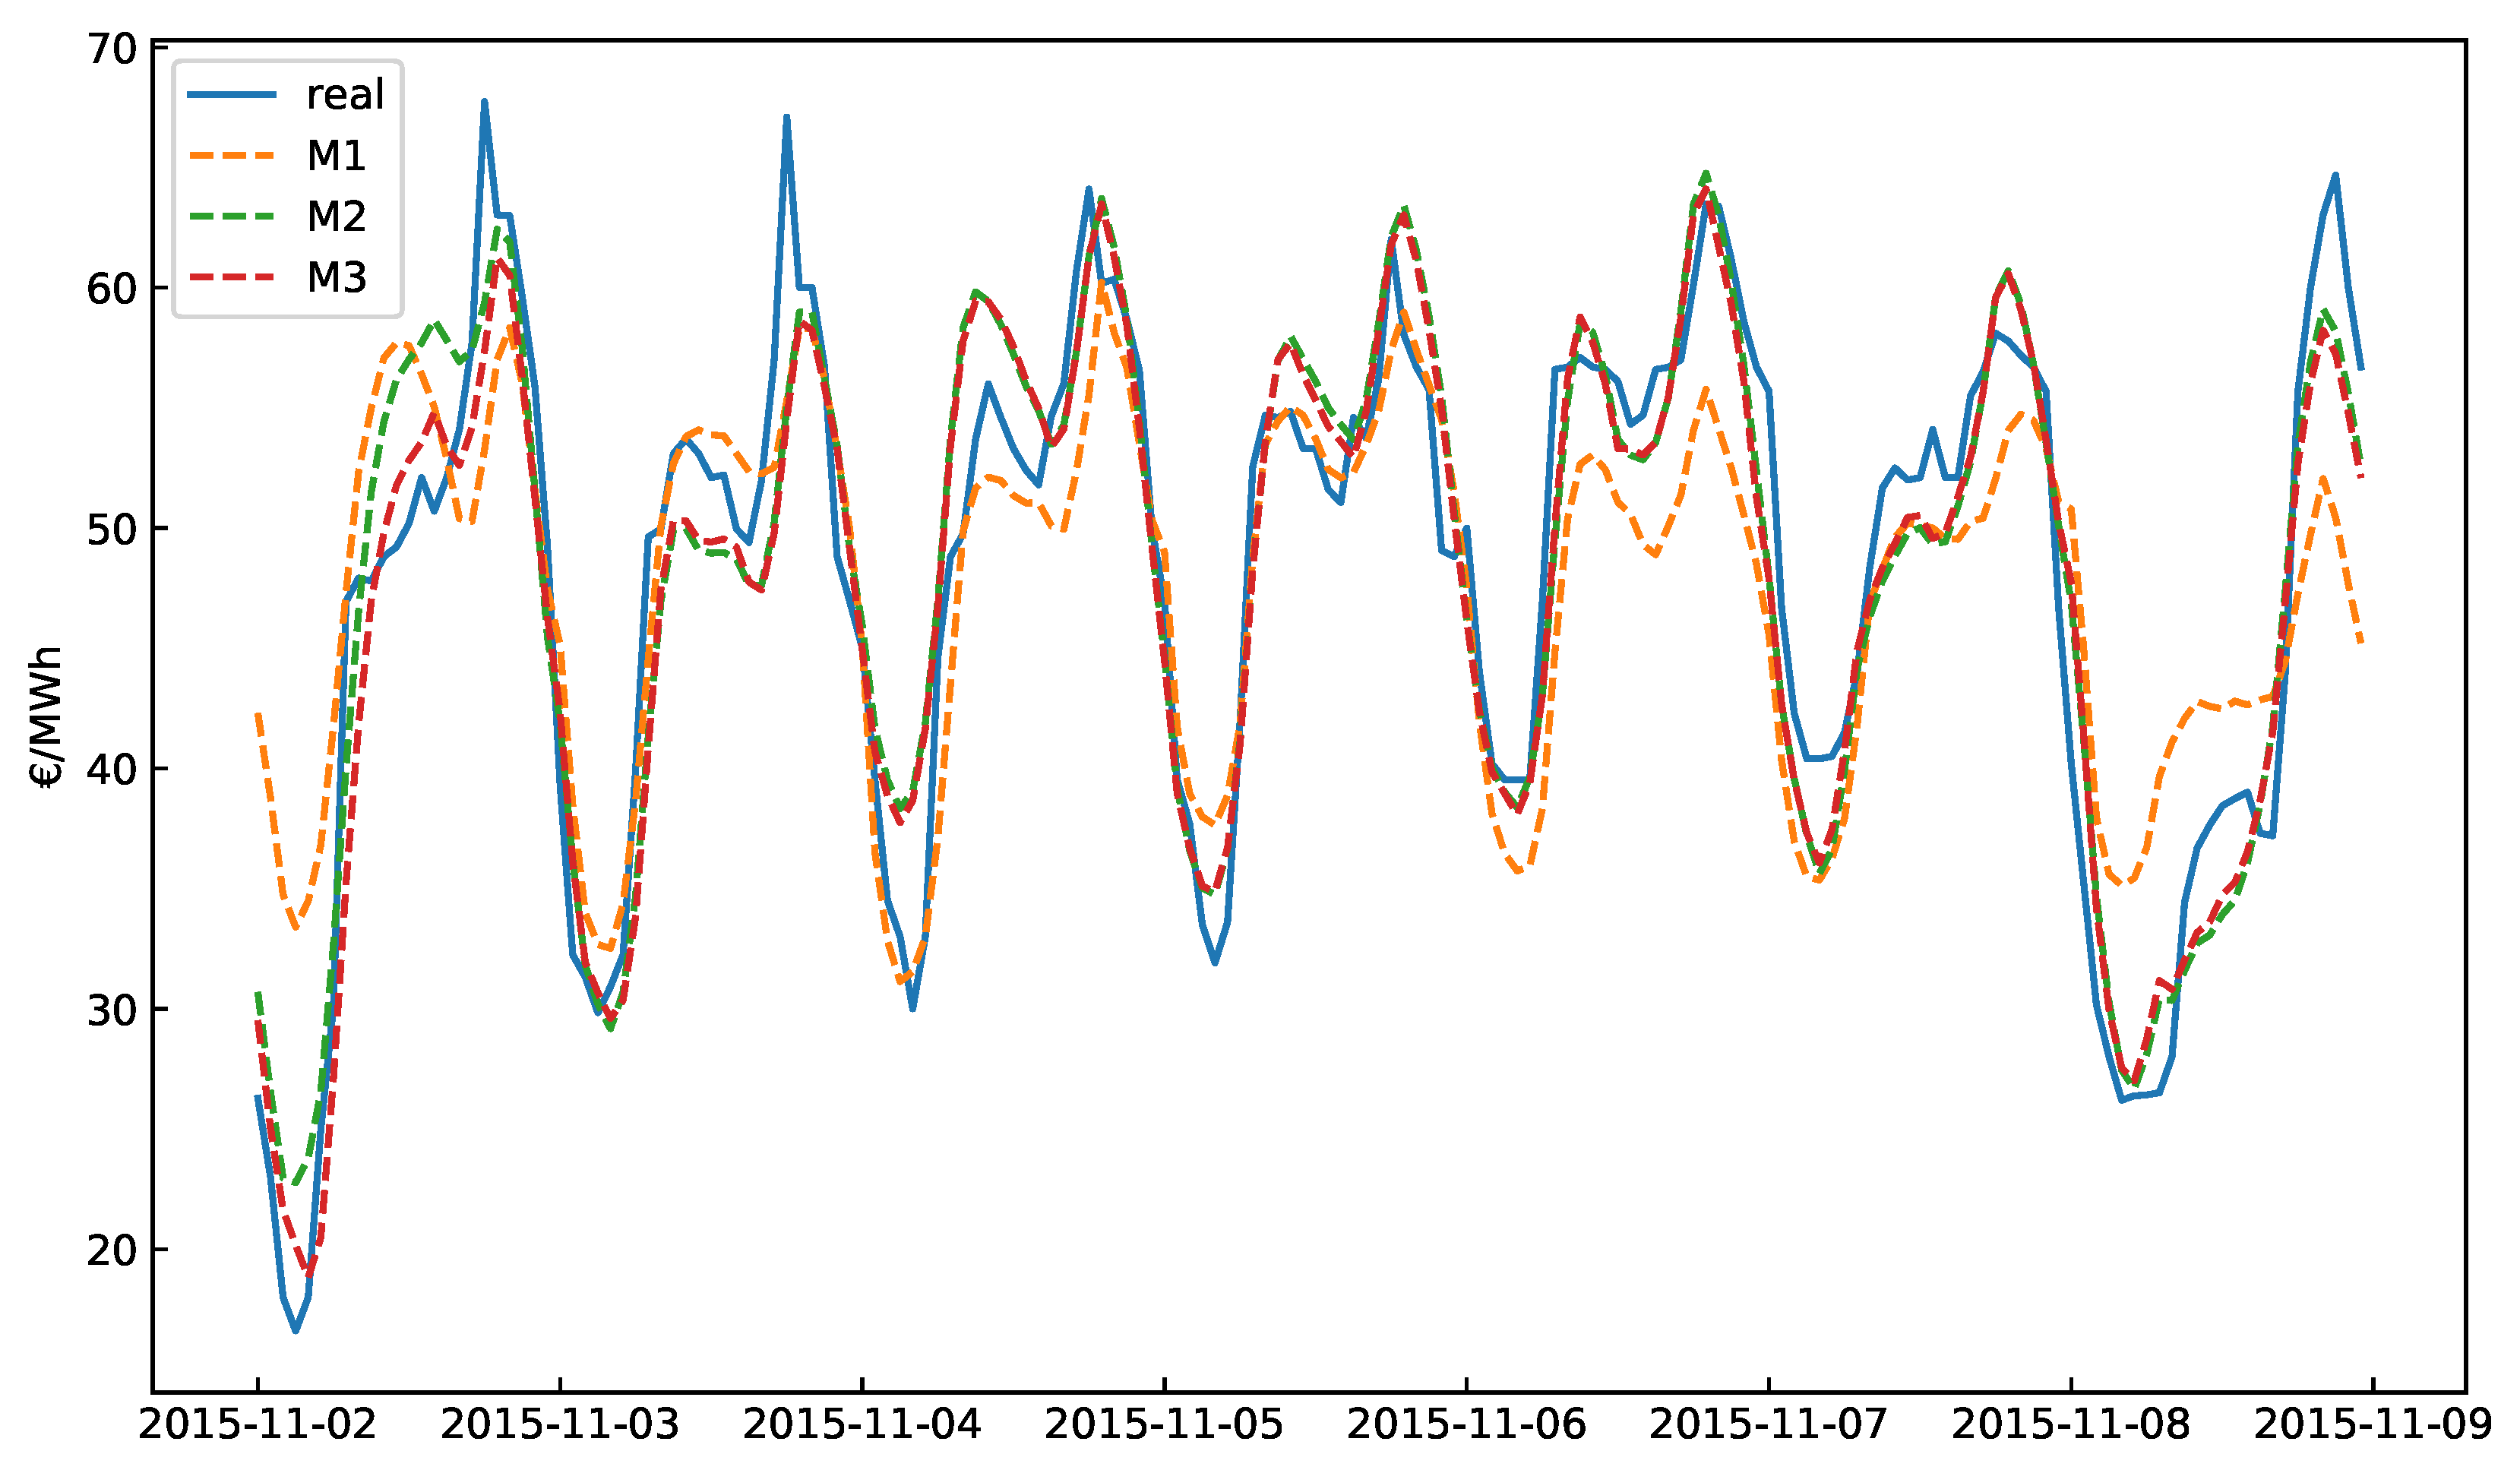
| W3 | 3 August–9 August | Summer |
| W4 | 2 November–8 November | Autumn |
| Week | M1 | M2 | M3 |
|---|---|---|---|
| W1 | 24.22 | 9.99 | 9.83 |
| W2 | 24.72 | 9.93 | 9.13 |
| W3 | 7.51 | 5.07 | 5.01 |
| W4 | 12.17 | 7.23 | 6.69 |
© 2019 by the authors. Licensee MDPI, Basel, Switzerland. This article is an open access article distributed under the terms and conditions of the Creative Commons Attribution (CC BY) license (http://creativecommons.org/licenses/by/4.0/).
Share and Cite
Aineto, D.; Iranzo-Sánchez, J.; Lemus-Zúñiga, L.G.; Onaindia, E.; Urchueguía, J.F. On the Influence of Renewable Energy Sources in Electricity Price Forecasting in the Iberian Market. Energies 2019, 12, 2082. https://doi.org/10.3390/en12112082
Aineto D, Iranzo-Sánchez J, Lemus-Zúñiga LG, Onaindia E, Urchueguía JF. On the Influence of Renewable Energy Sources in Electricity Price Forecasting in the Iberian Market. Energies. 2019; 12(11):2082. https://doi.org/10.3390/en12112082
Chicago/Turabian StyleAineto, Diego, Javier Iranzo-Sánchez, Lenin G. Lemus-Zúñiga, Eva Onaindia, and Javier F. Urchueguía. 2019. "On the Influence of Renewable Energy Sources in Electricity Price Forecasting in the Iberian Market" Energies 12, no. 11: 2082. https://doi.org/10.3390/en12112082