Unsteady Flow Numerical Simulations on Internal Energy Dissipation for a Low-Head Centrifugal Pump at Part-Load Operating Conditions


Abstract
:1. Introduction
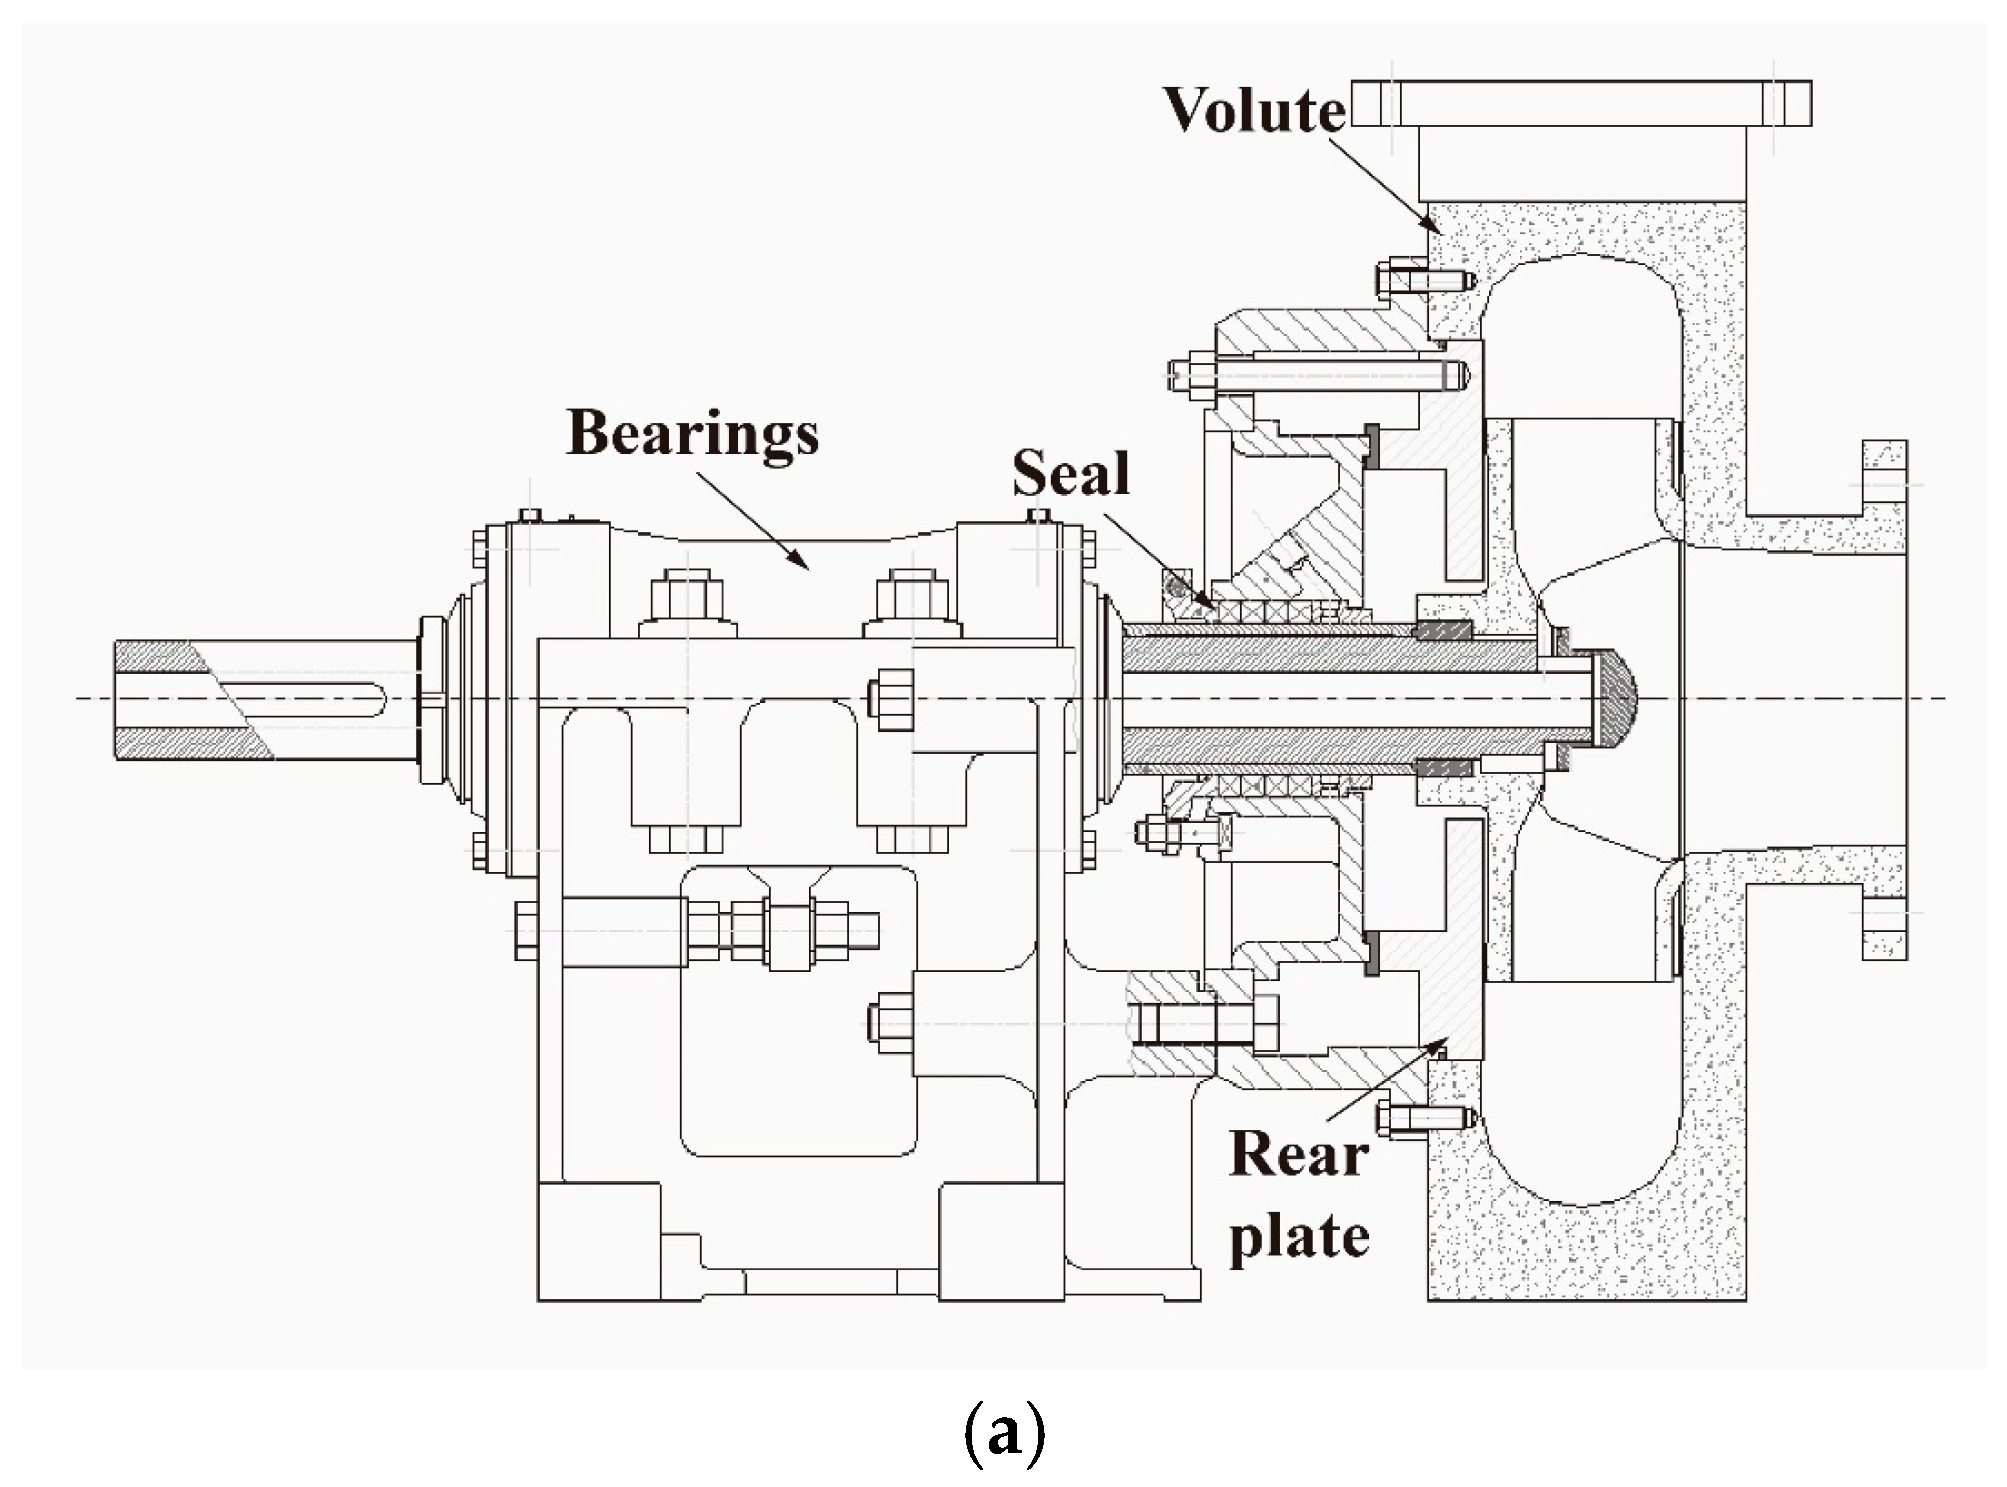
2. Case Study
3. Methodology
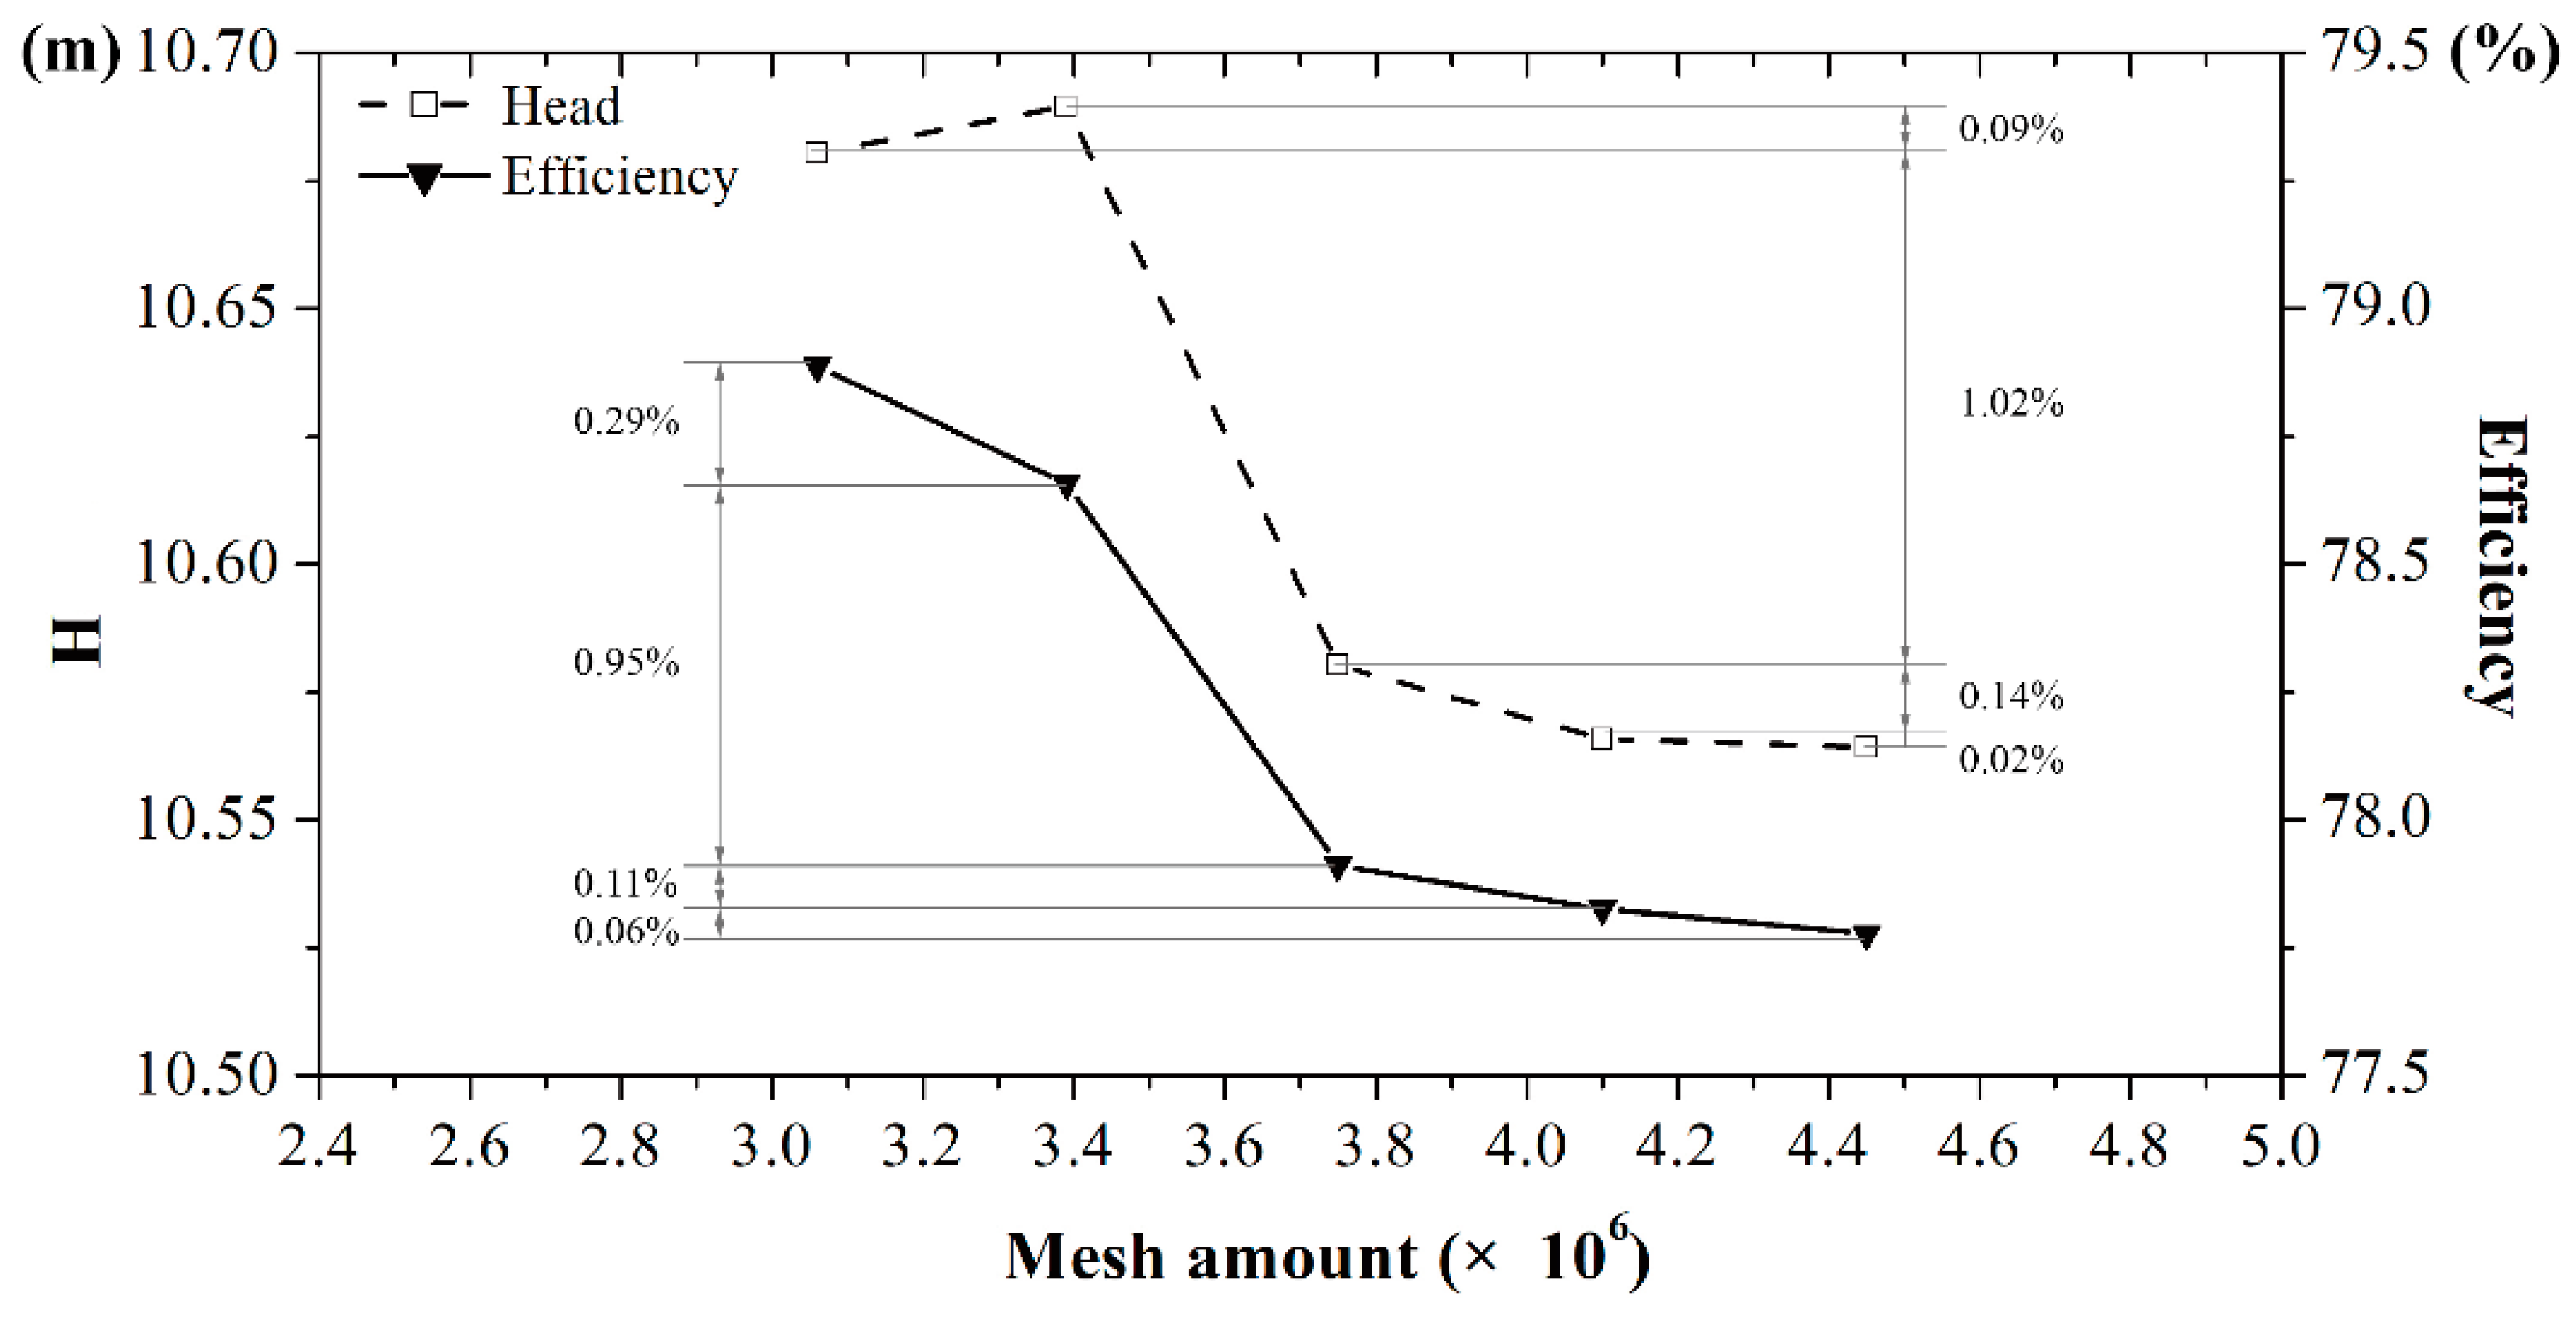
3.1. Governing Equations and Numerical Setup
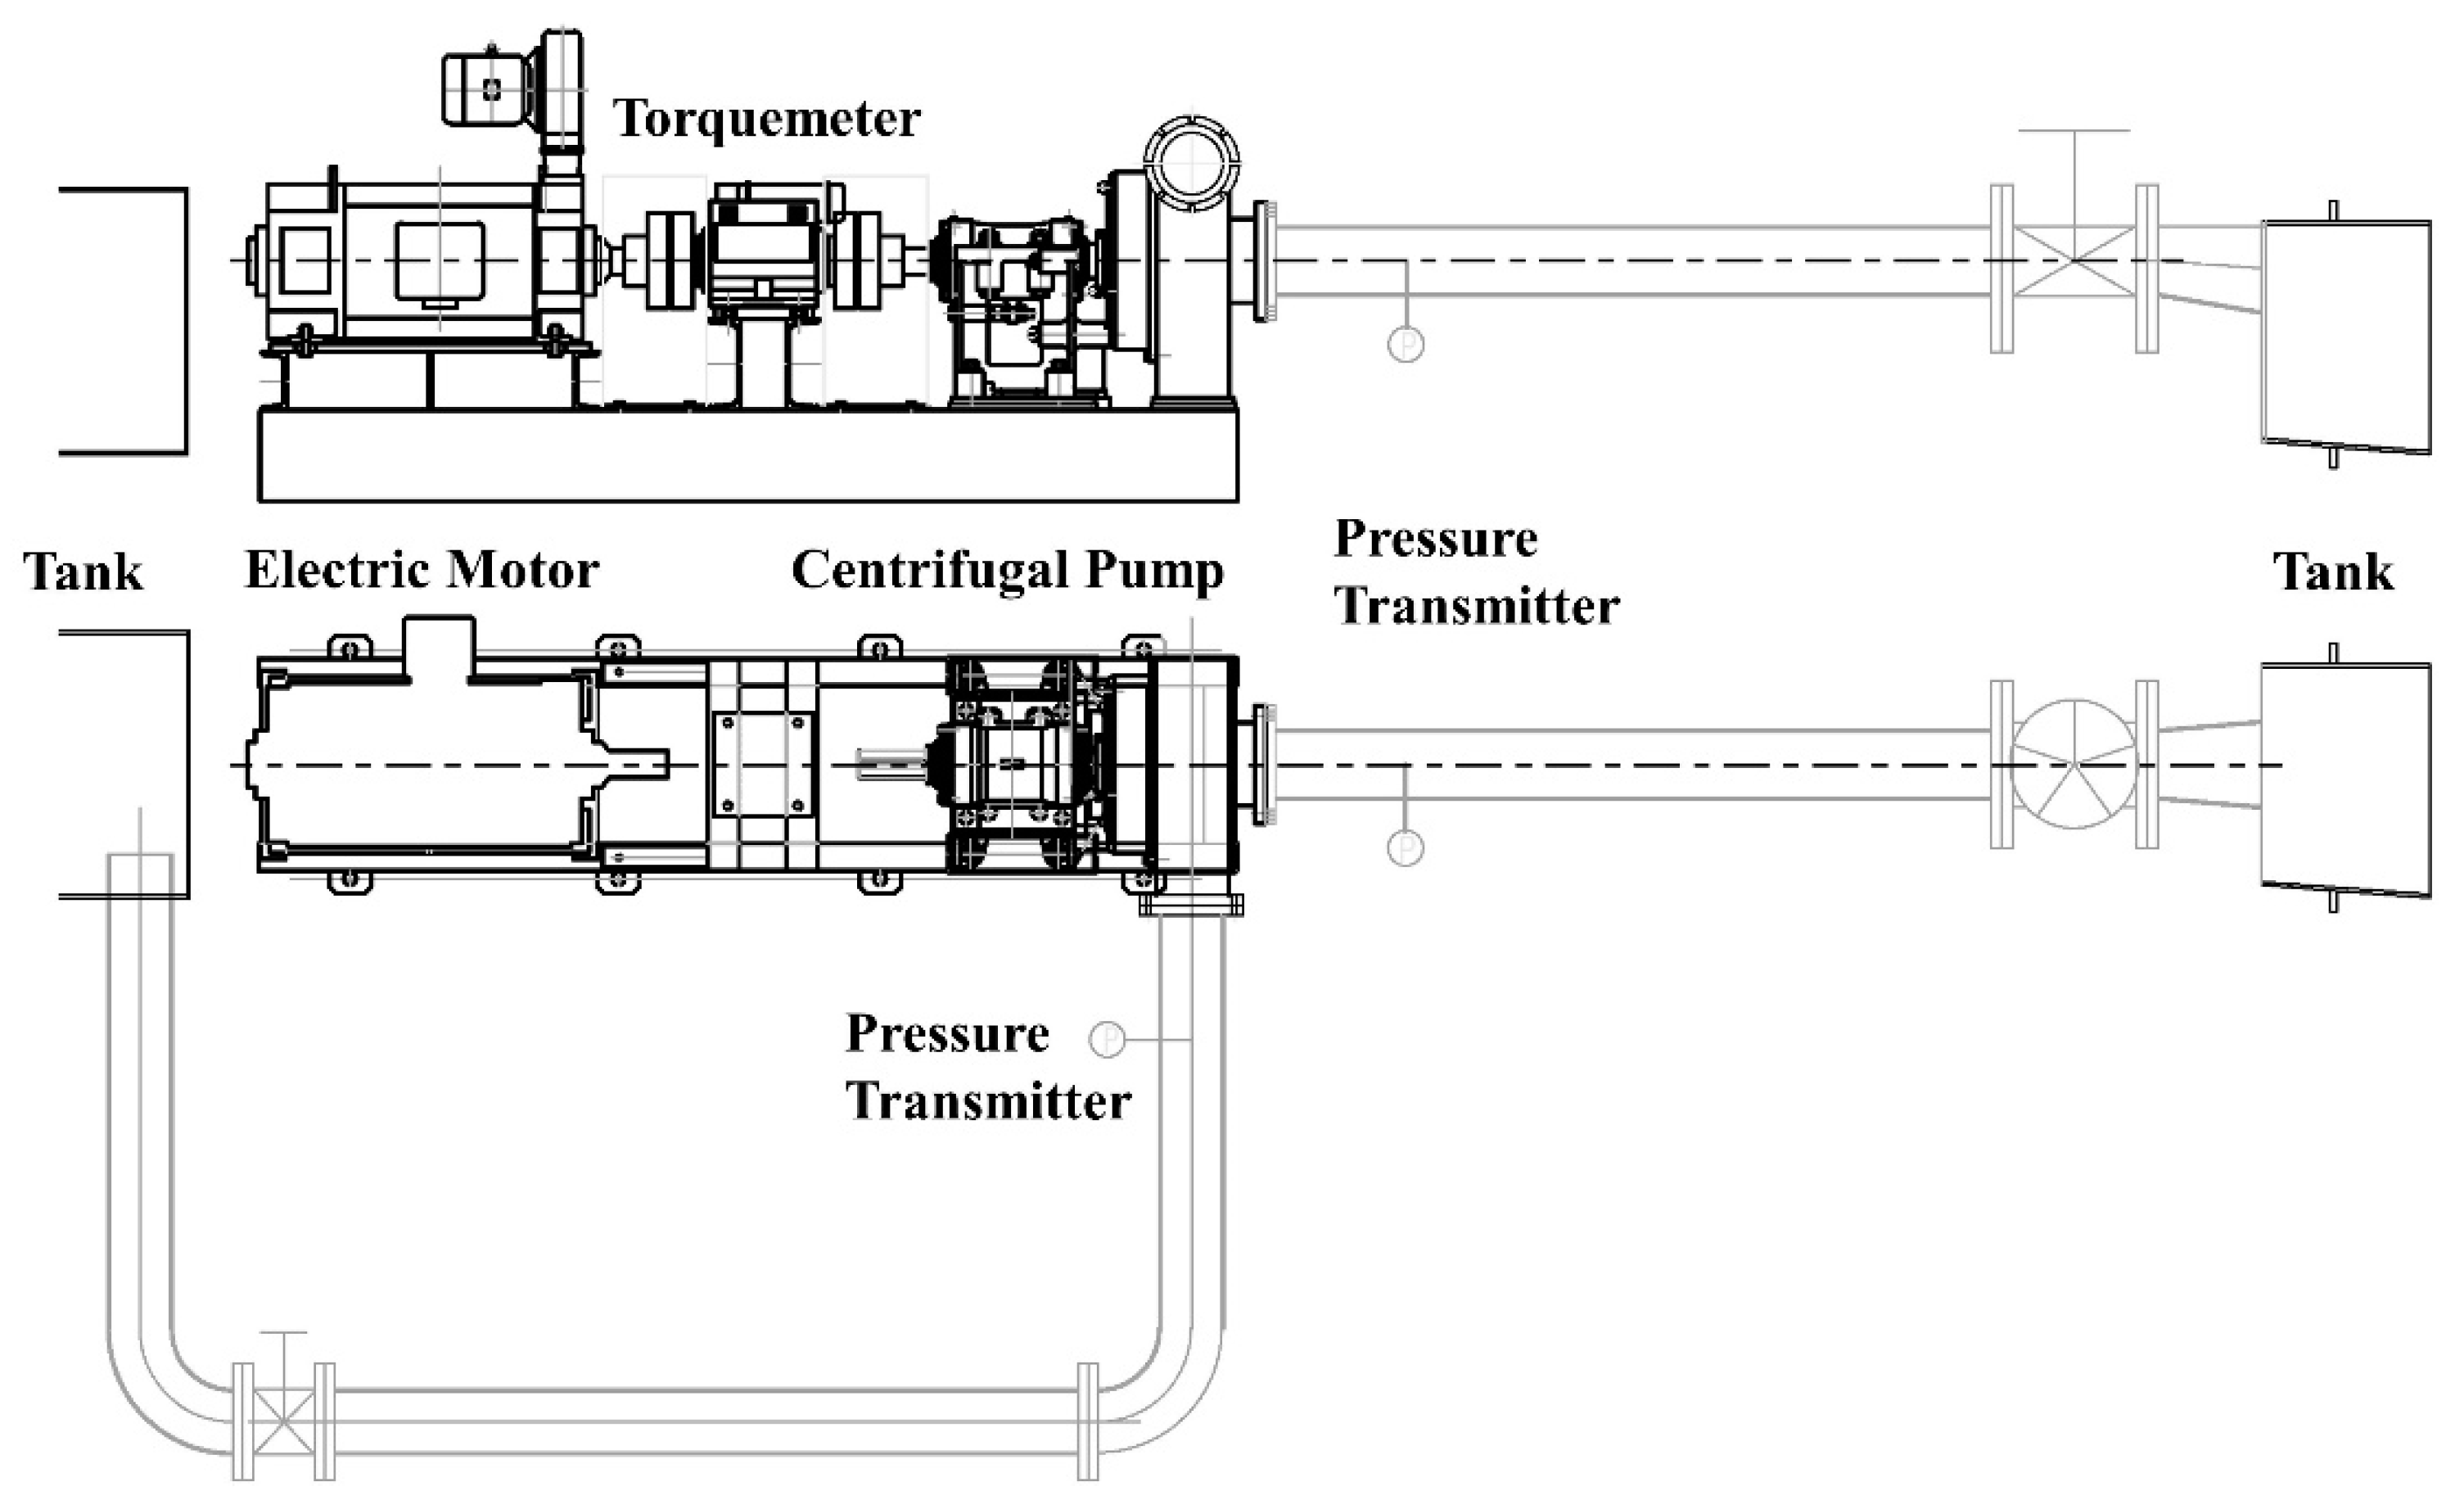
3.2. Experimental Setup
3.3. Energy Analysis Method
4. Results
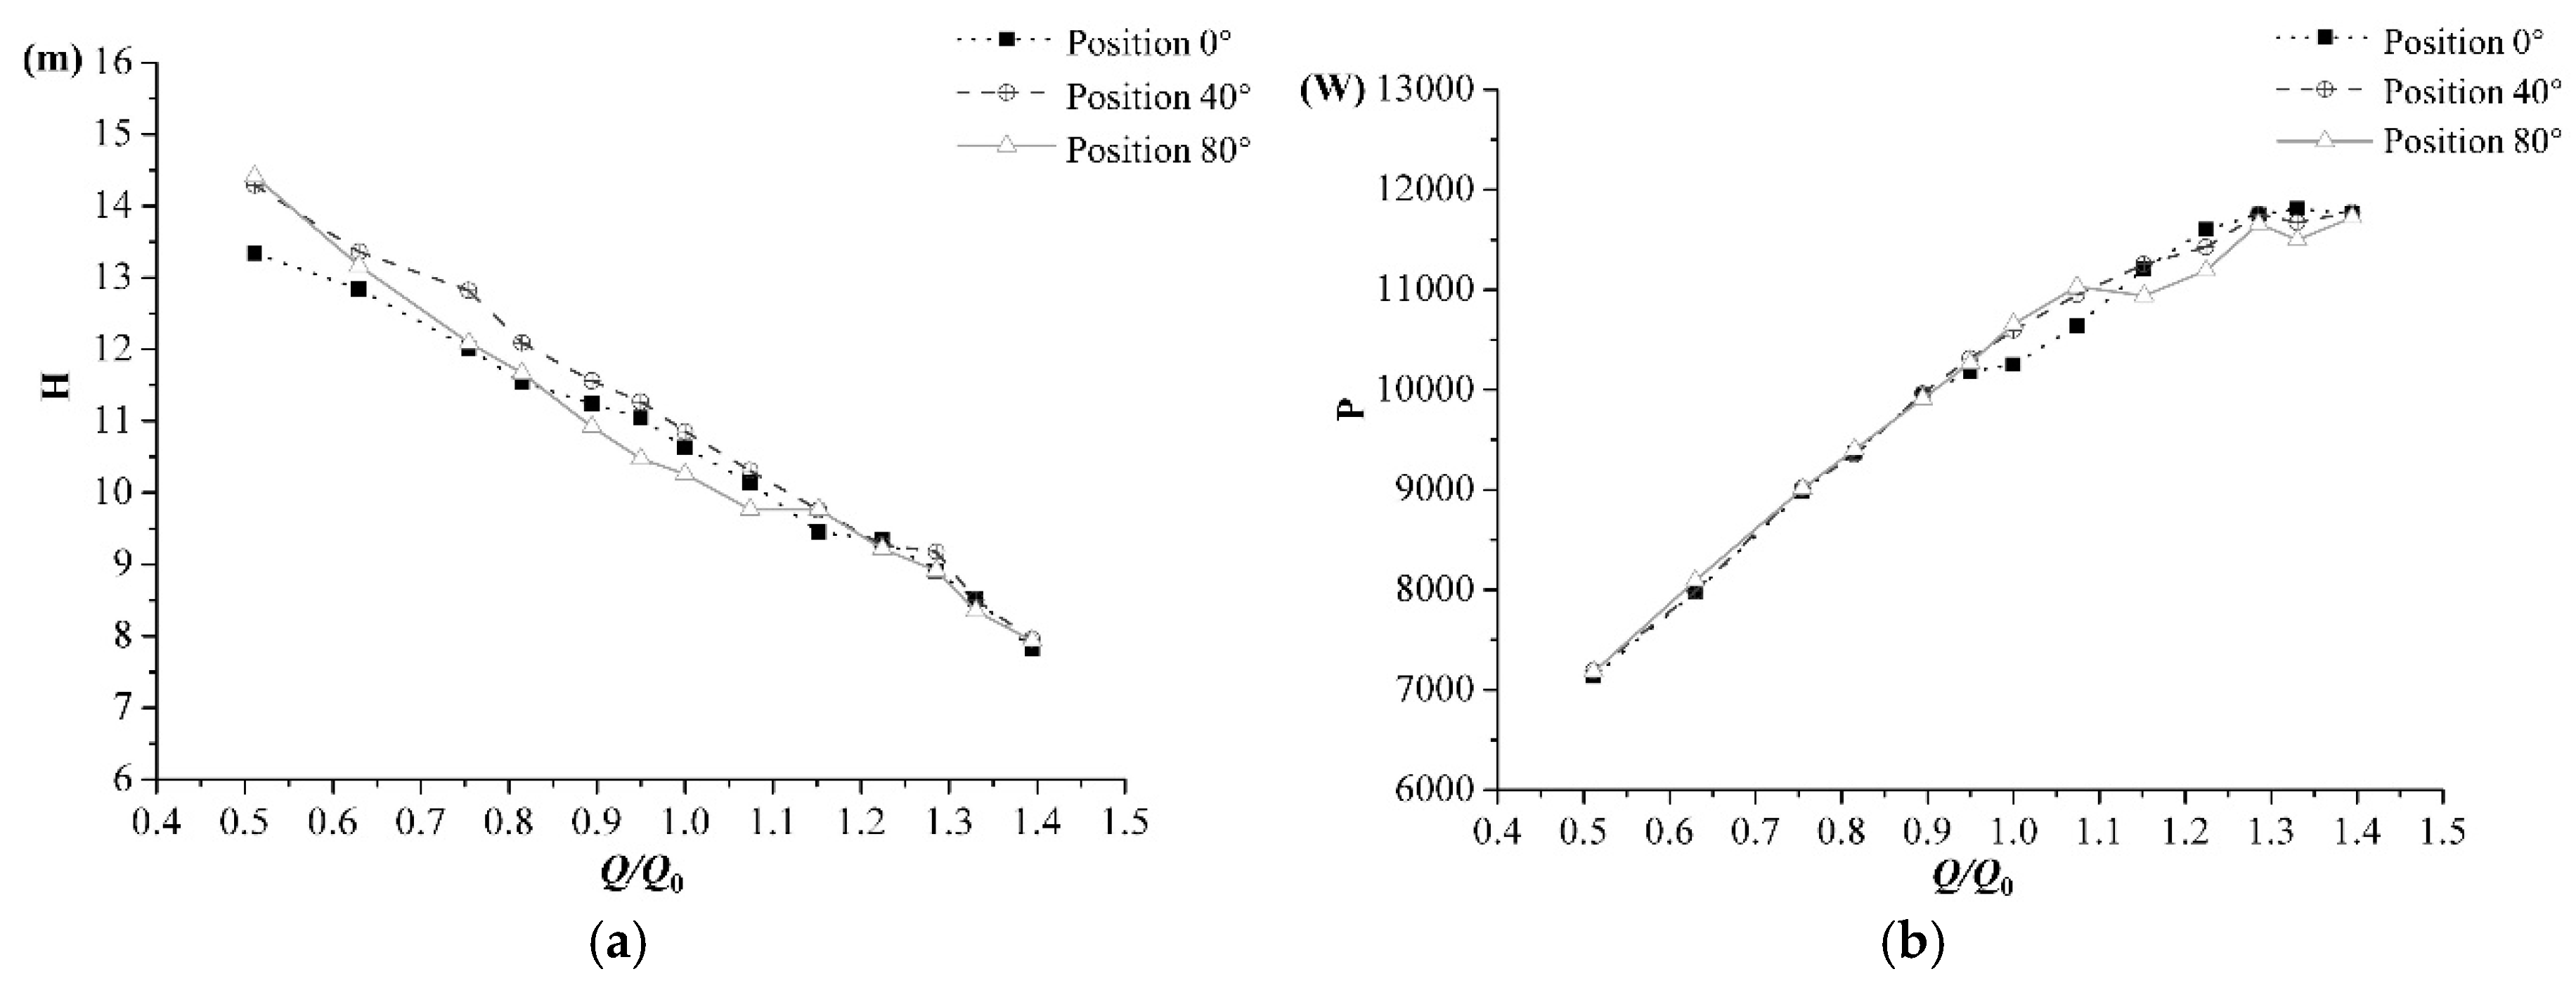
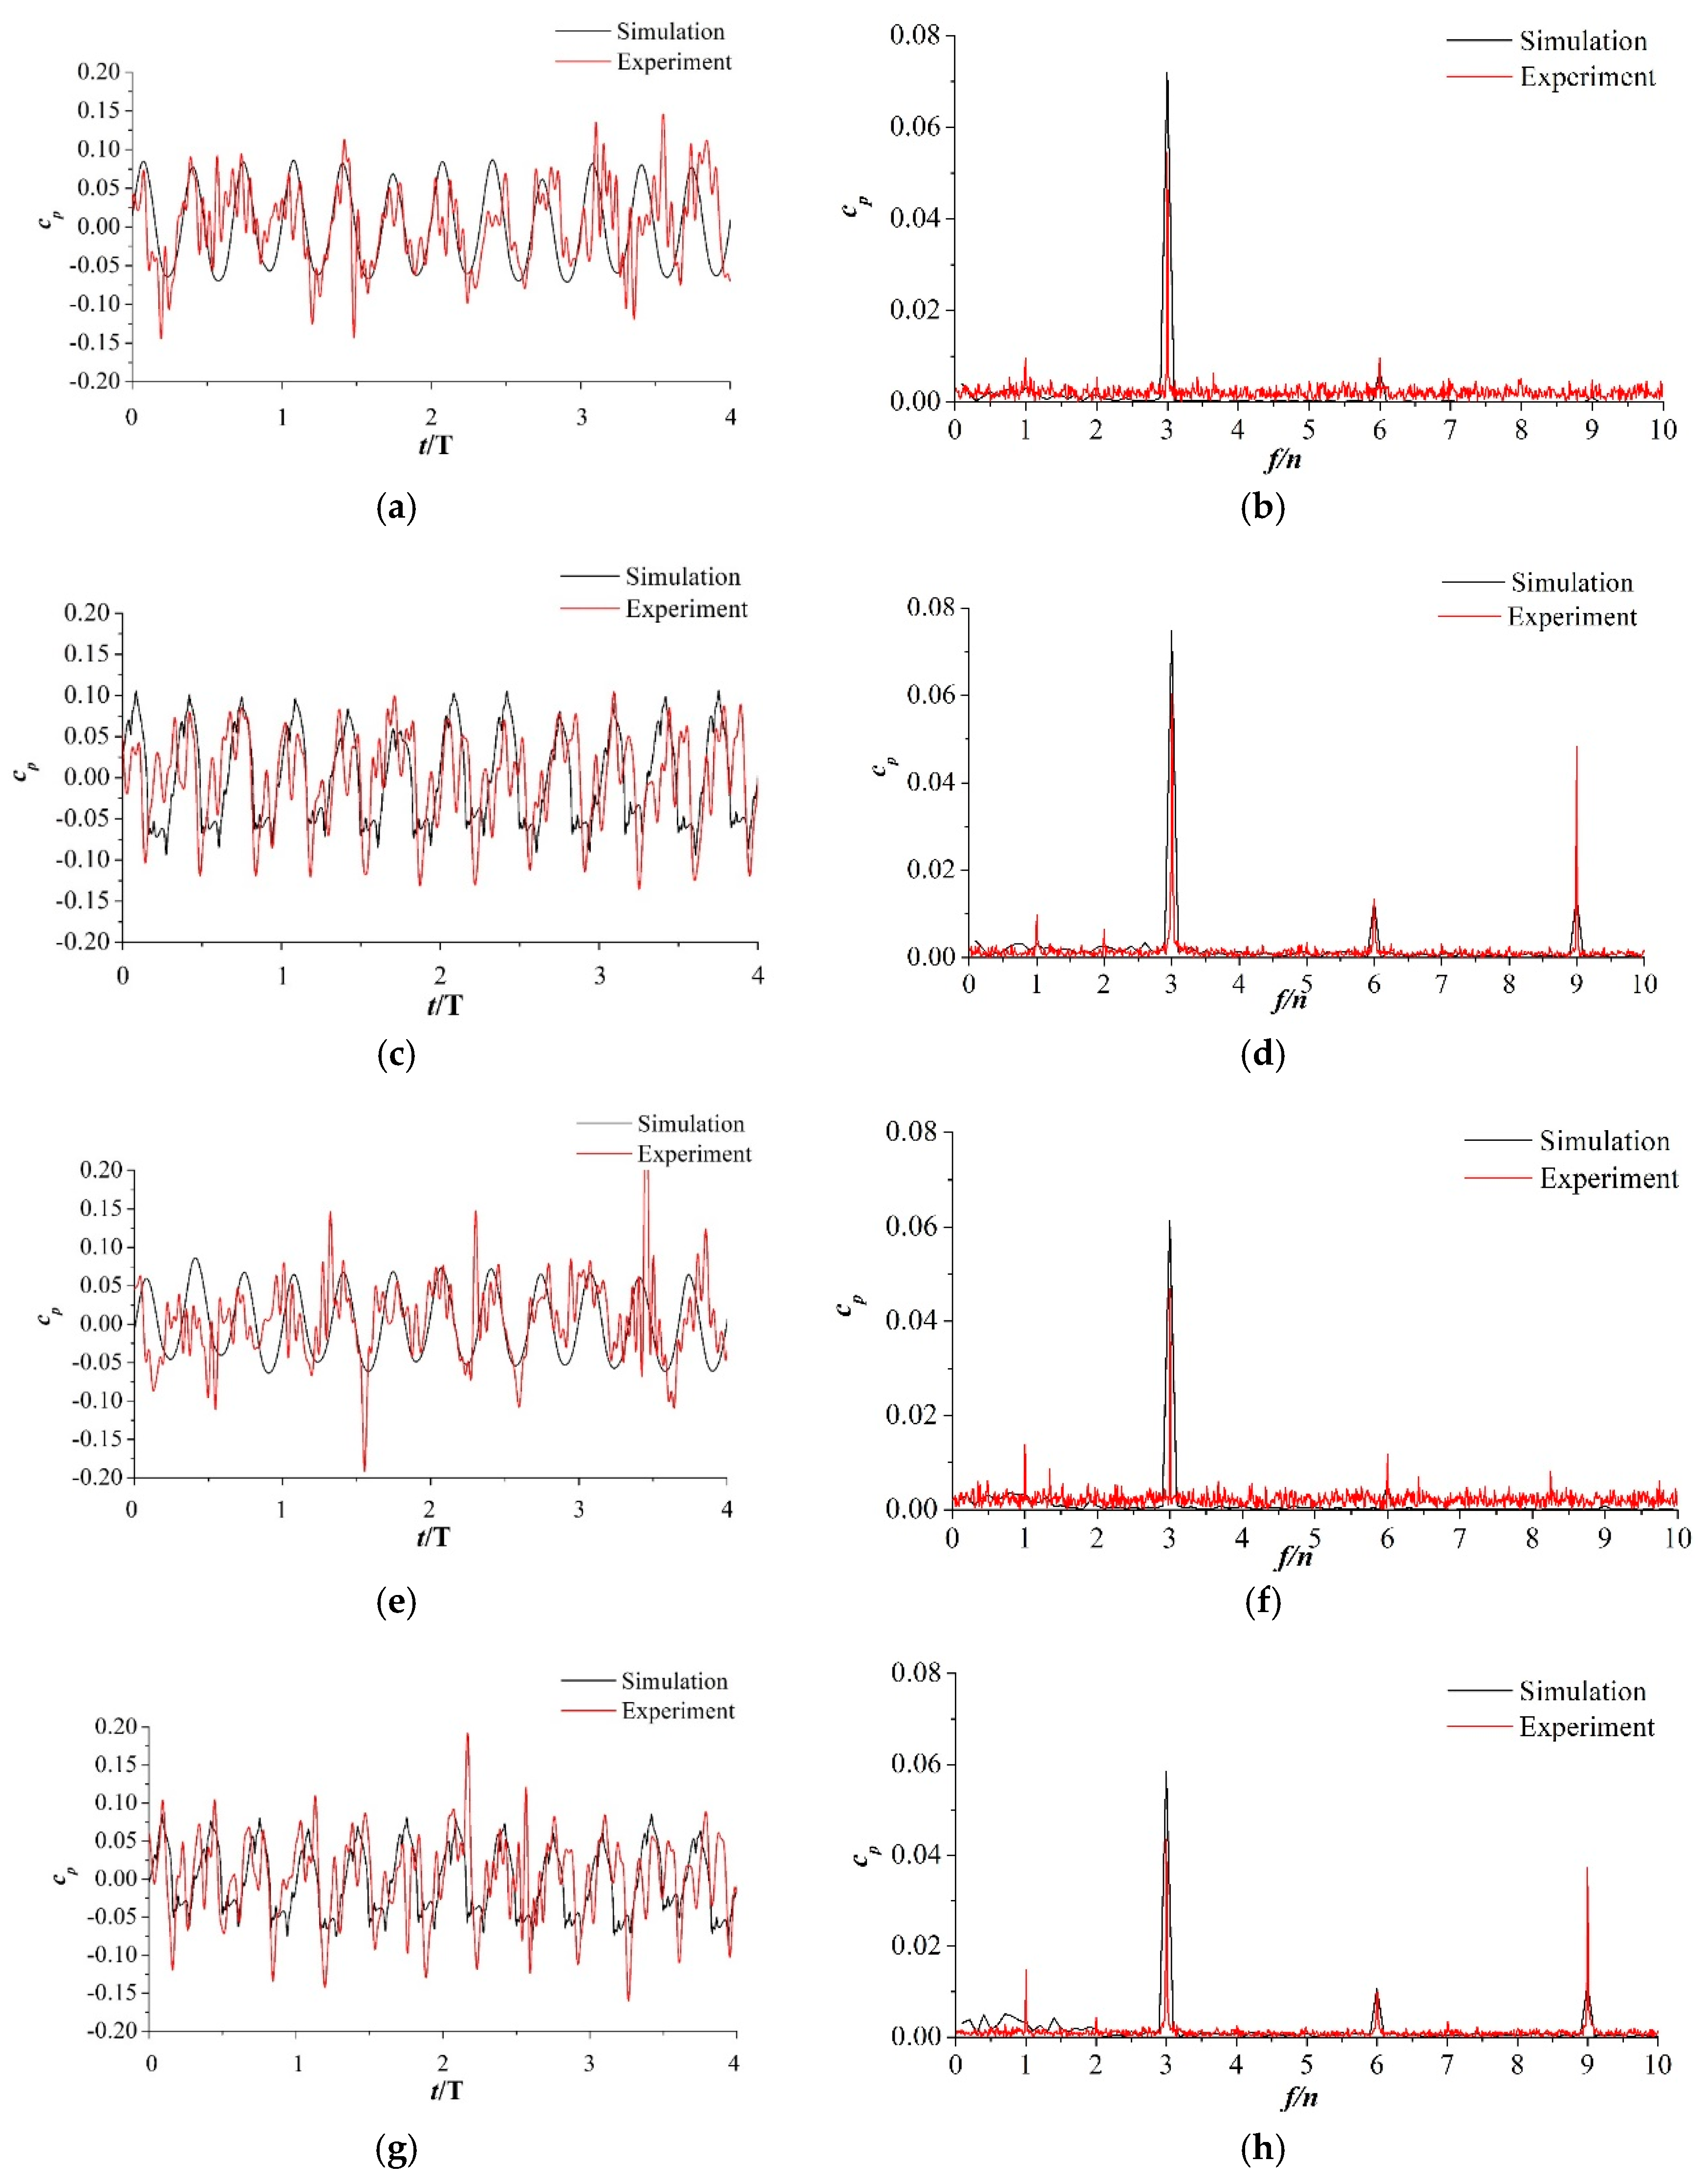
4.1. Validation of Numerical Simulating Results
4.2. Internal Power Loss
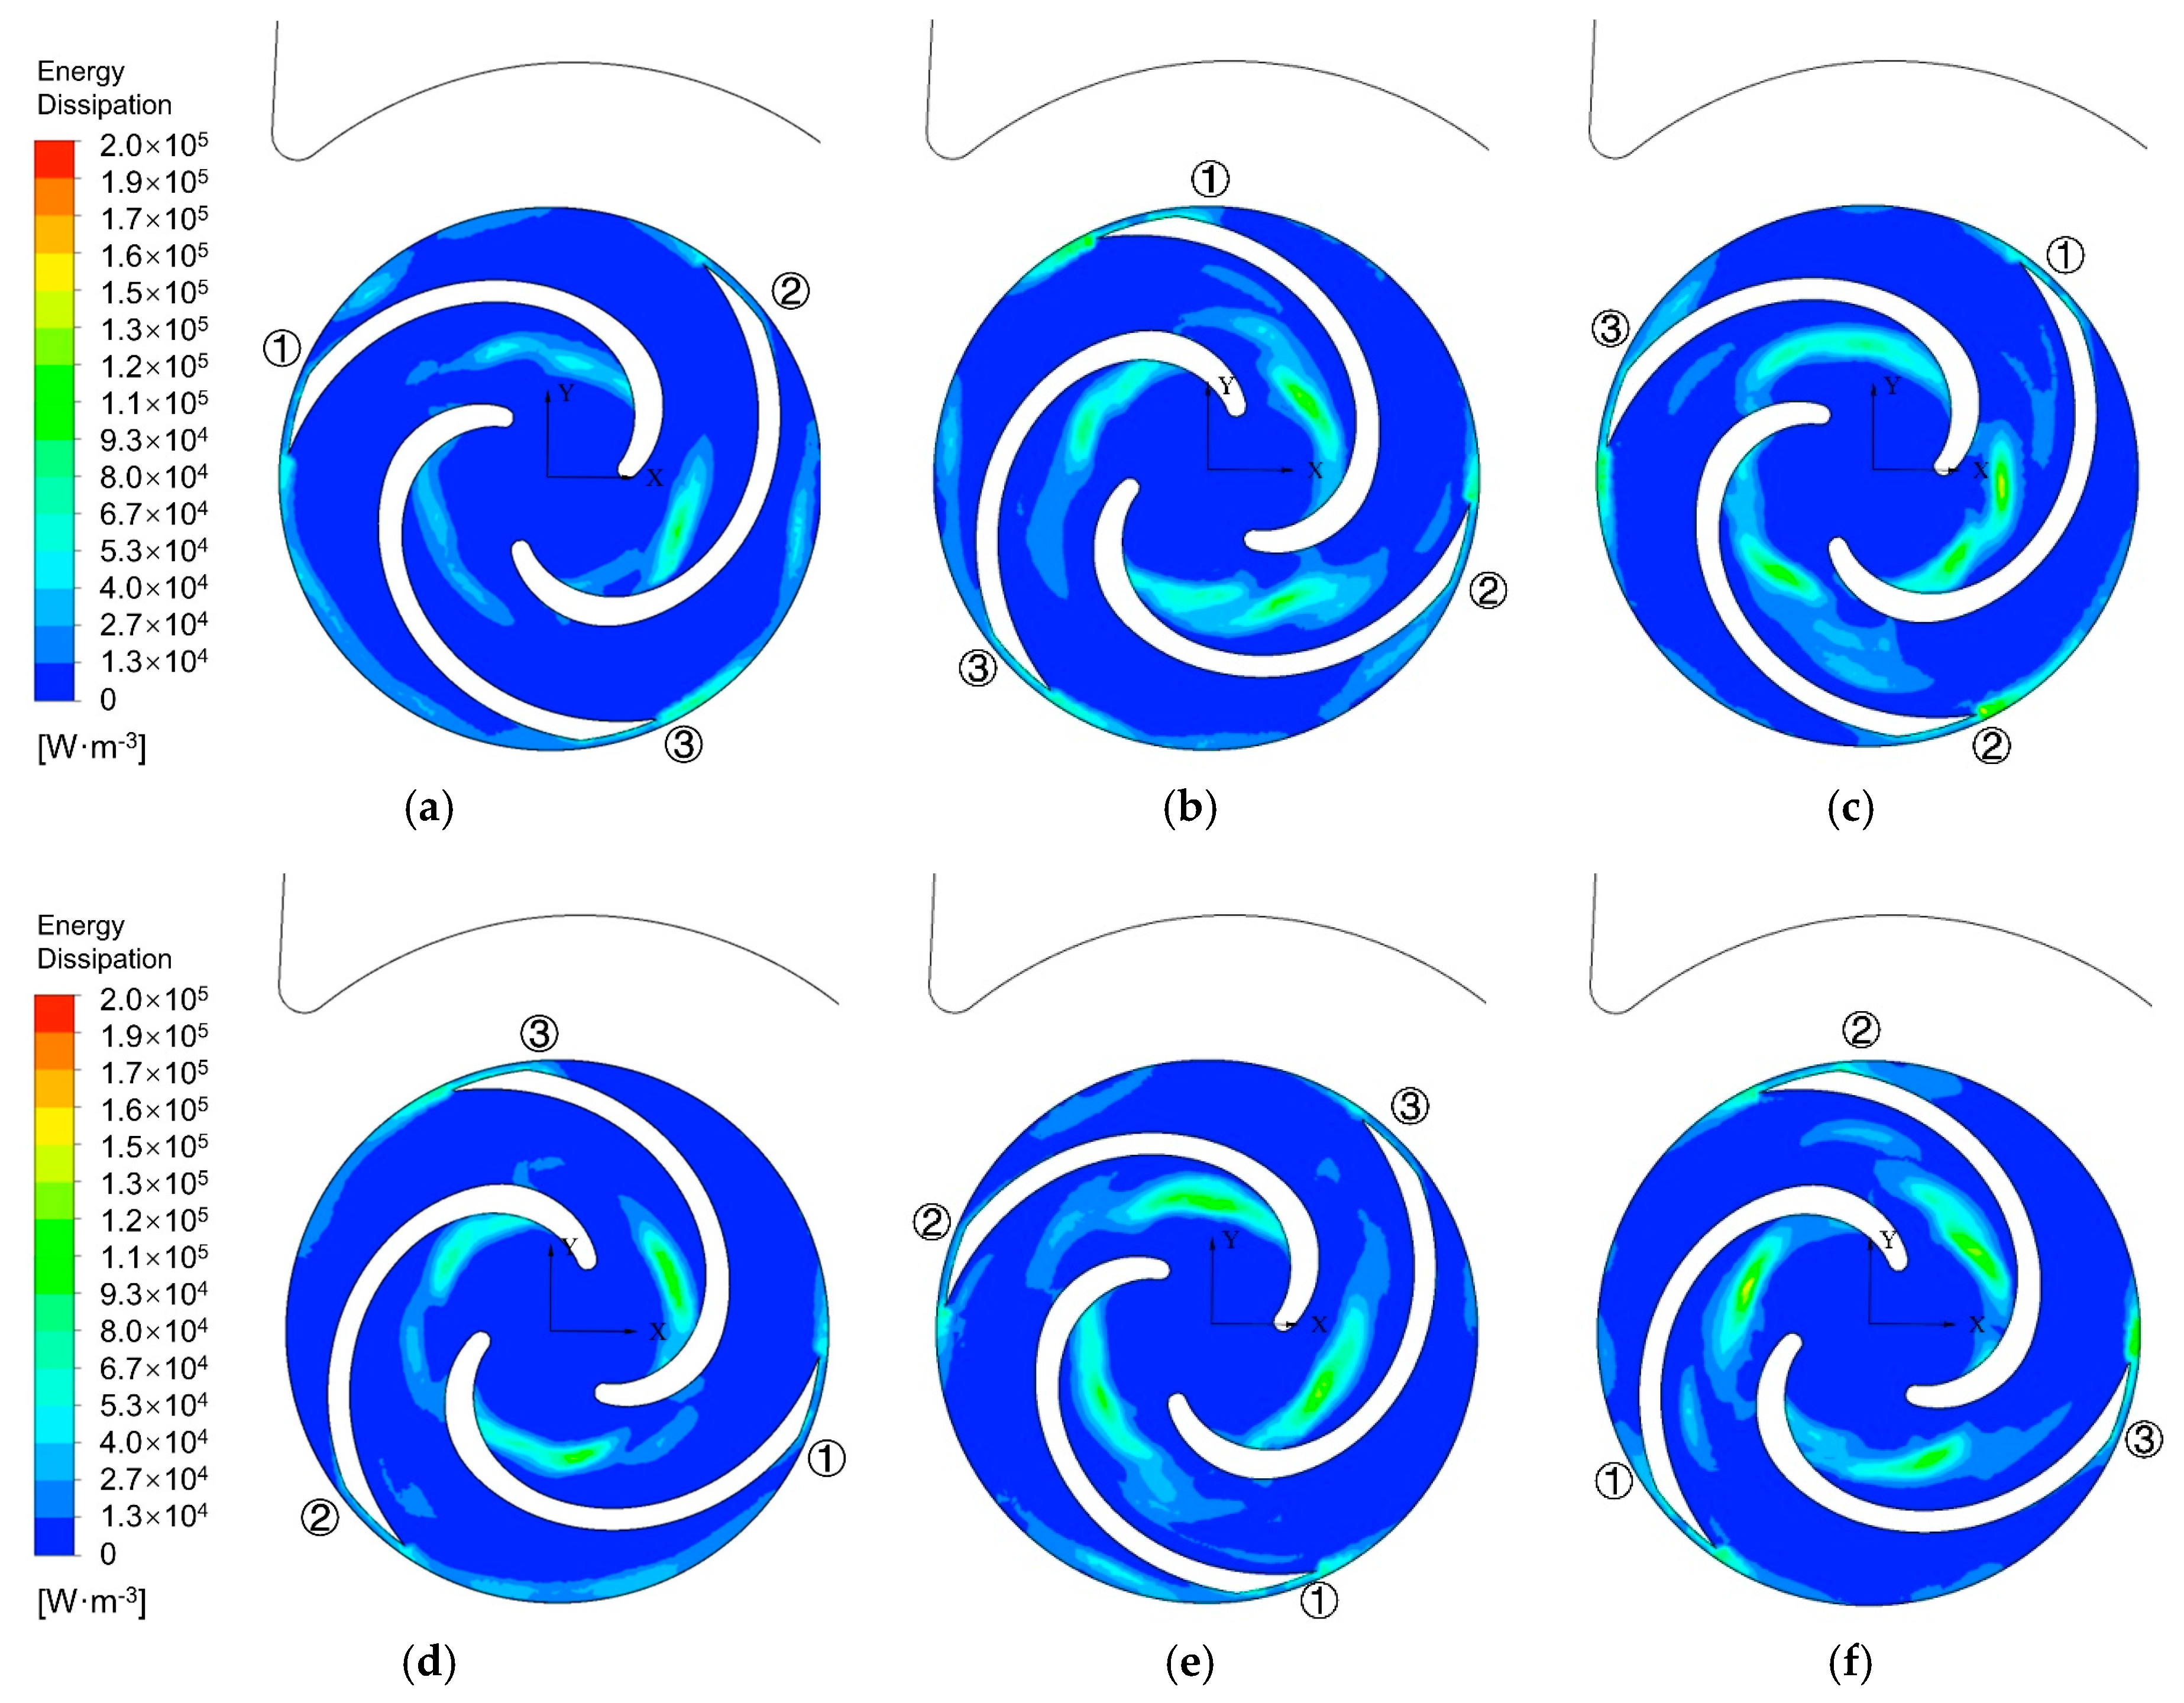
4.3. Local Internal Energy Dissipation in the Impeller
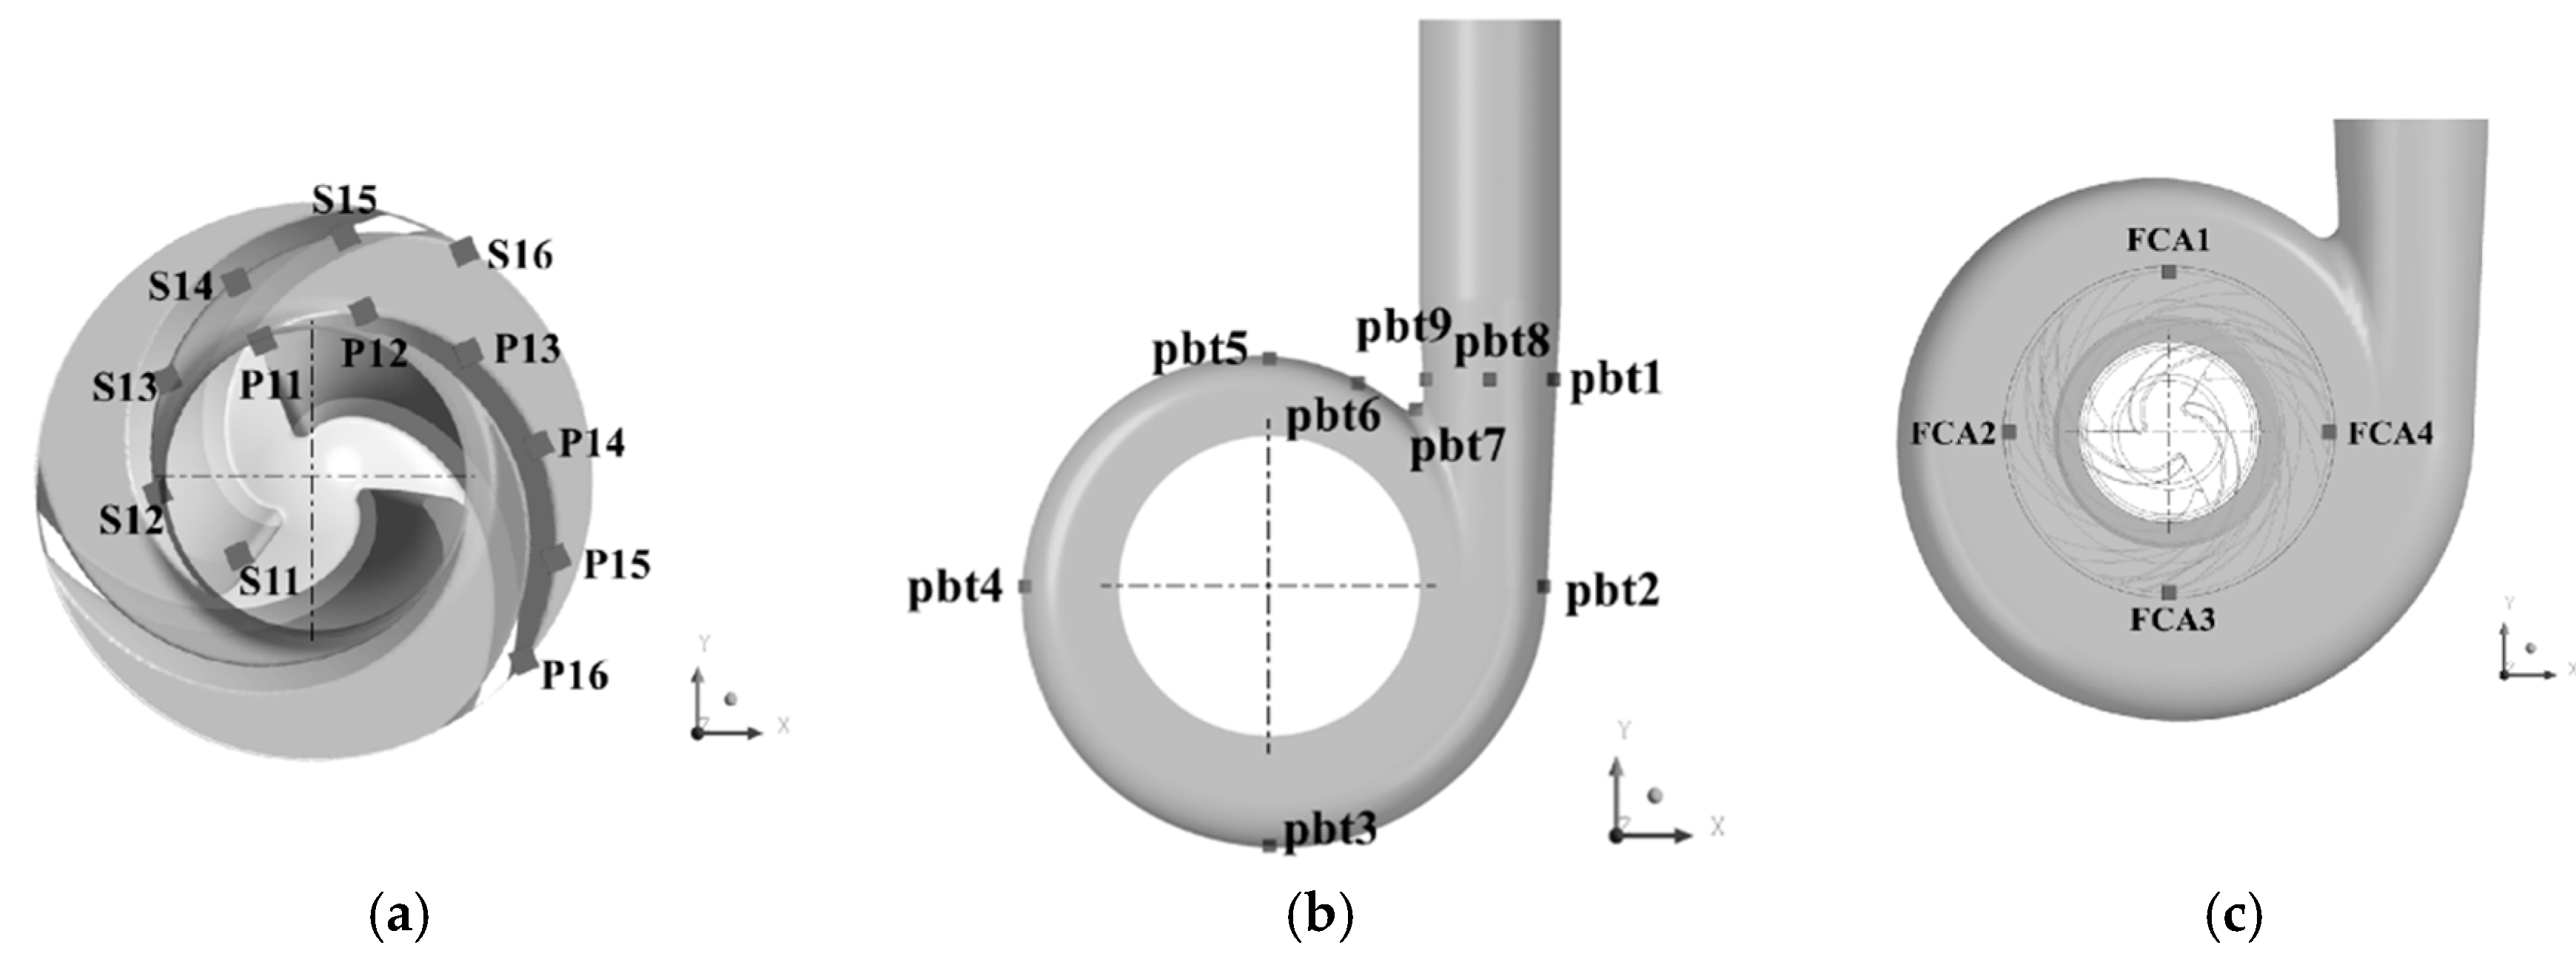
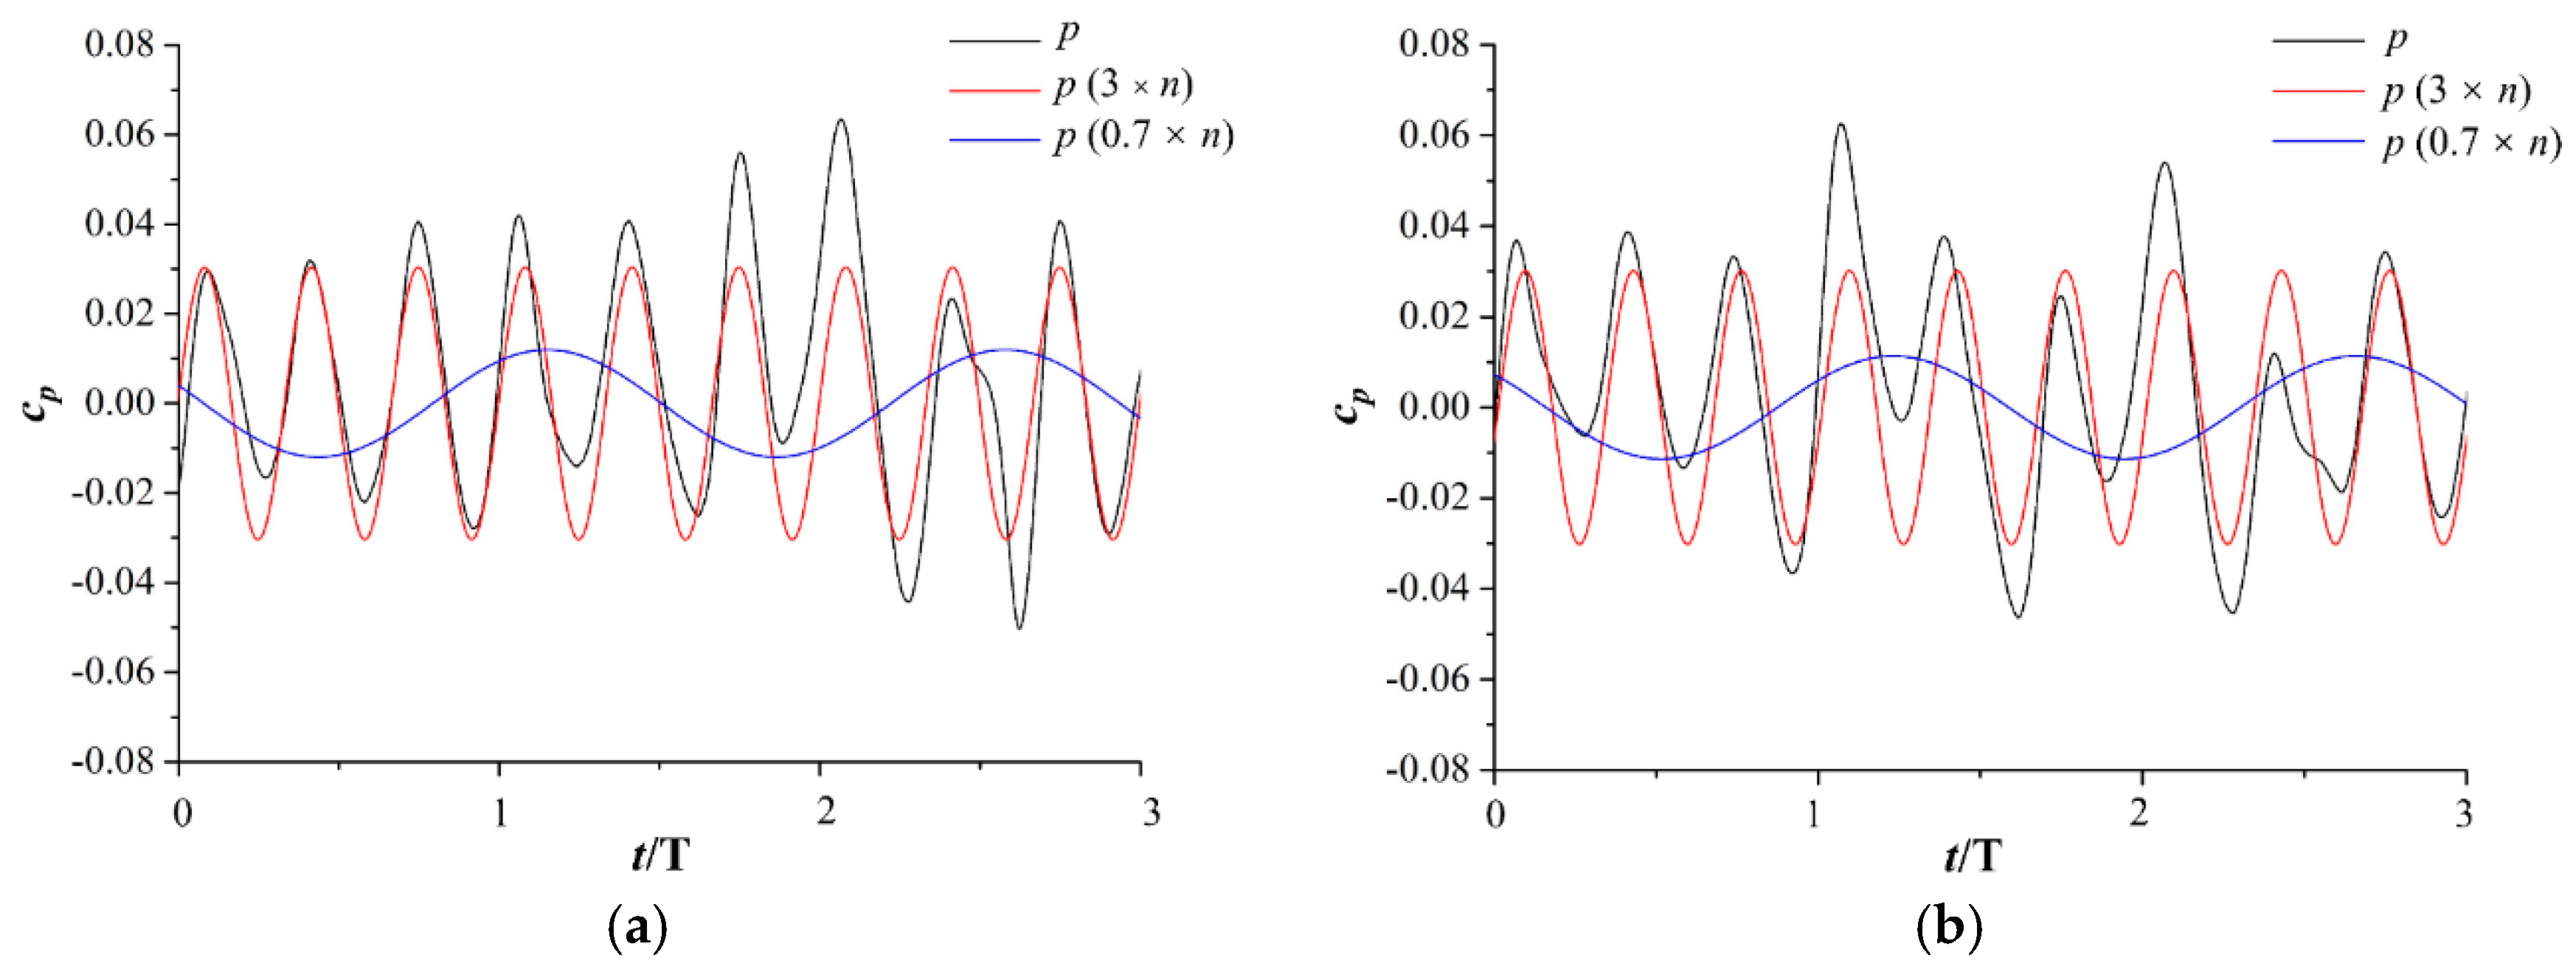
4.4. Pressure Fluctuations in the Impeller
5. Discussion
6. Conclusions
Author Contributions
Funding
Acknowledgments
Conflicts of Interest
Nomenclature
| A | Area (m2) |
| Ain | Inlet boundary area (m2) |
| Aout | Outlet boundary area (m2) |
| cp | Pressure normalization (-) |
| Flow velocity (m·s−1) | |
| D | Impeller diameter (m) |
| Strain rate tensor (s−1) | |
| e | Specific internal energy (J·kg−1) |
| Specific energy factor at design operating condition (-) | |
| g | Gravitational acceleration (m·s−2) |
| h | Specific enthalpy (J·kg−1) |
| htot | Specific total enthalpy (J·kg−1) |
| H | Head (m) |
| H0 | Rated head (m) |
| Unit tensor (-) | |
| n | Rotating speed (s−1) |
| NQE | Specific speed (-) |
| p | Pressure (Pa) |
| P | Power (W) |
| Total stress tensor (Pa) | |
| Ploss,A | Internal power loss near wall (W) |
| Ploss,h | Hydraulic power loss (W) |
| Ploss,i | Internal power loss (W) |
| Heat flux (W·m−2) | |
| Q | Discharge (m3·s−1) |
| Q0 | Design discharge (m3·s−1) |
| Discharge factor at design operating condition (-) | |
| R | Radial coordinate (m) |
| t | Time (s) |
| T | Temperature (K) |
| Tt | Torque (N·m) |
| U2 | Circumferential velocity at the impeller outlet (m·s−1) |
| V | Volume (m3) |
| y+ | Dimensionless wall distance (-) |
| Z | Height coordinate (m) |
| Turbulence dissipation rate (m2·s−3) | |
| Effective thermal conductivity (W·K−1·m−1) | |
| Thermal conductivity (W·K−1·m−1) | |
| Efficiency (-) | |
| Dynamic viscosity (kg·m−1·s−1) | |
| Eddy viscosity (kg·m−1·s−1) | |
| Density (kg·m−3) | |
| Wall shear stress (Pa) | |
| Angular coordinate (°) |
References
- Tarodiya, R.; Gandhi, B. Hydraulic performance and erosive wear of centrifugal slurry pumps—A review. Powder Technol. 2017, 305, 27–38. [Google Scholar] [CrossRef]
- Nishi, Y.; Matsuo, N.; Fukutomi, J. A study on internal flow in a new type of sewage pump. J. Fluid Sci. Technol. 2009, 4, 648–660. [Google Scholar] [CrossRef]
- Pei, J.; Yuan, S.; Wang, W. Numerical analysis of pressure fluctuation intensity for a low-speed sewage centrifugal pump. Adv. Mech. Eng. 2014, 2014, 929672. [Google Scholar] [CrossRef]
- Steffen, M.; Tim, M.; Stephan, S.; Tobias, K.; Romuald, S. Experimental and numerical investigation of the transient characteristics and volute casing wall pressure fluctuations of a single-blade pump. Proc. Inst. Mech. Eng. Part E J. Process Mech. Eng. 2018, 233, 280–291. [Google Scholar] [CrossRef]
- Munts, E.; Dasselaar, S.; Bugdayci, H.; Goeree, J.; Rhee, C. Numerical investigation of sand-water mixture behavior in a centrifugal dredge pump. In Proceedings of the 19th International Conference on Hydrotransport 2014, Golden, CO, USA, 24–26 September 2014; pp. 29–41. [Google Scholar]
- Peng, G.; Luo, Y.; Wang, Z. Research on wear properties of centrifugal dredge pump based on liquid-solid two-phase fluid simulations. IOP Conf. Ser. Mater. Sci. Eng. 2015, 72, 042048. [Google Scholar] [CrossRef] [Green Version]
- Kara Omar, A.; Khaldi, A.; Ladouani, A. Prediction of centrifugal pump performance using energy loss analysis. Aust. J. Mech. Eng. 2017, 15, 210–221. [Google Scholar] [CrossRef]
- El-Naggar, M.A. A one-dimensional flow analysis for the prediction of centrifugal pump performance characteristics. Int. J. Rotating Mach. 2013, 2013, 473512. [Google Scholar] [CrossRef]
- Klas, R.; Pochylý, F.; Rudolf, P. Analysis of novel low specific speed pump designs. IOP Conf. Ser. Earth Environ. Sci. 2014, 22, 012010. [Google Scholar] [Green Version]
- Posa, A.; Lippolis, A.; Balaras, E. Investigation of Separation Phenomena in a Radial Pump at Reduced Flow Rate by Large-Eddy Simulation. ASME J. Fluids Eng. 2016, 138, 121101. [Google Scholar] [CrossRef]
- Zhang, H.; Deng, S.; Qu, Y. Numerical investigation of periodic fluctuations in energy efficiency in centrifugal pumps at different working points. Energies 2017, 10, 342. [Google Scholar] [CrossRef]
- Barrio, R.; Parrondo, J.; Blanco, E. Numerical analysis of the unsteady flow in the near-tongue region in a volute-type centrifugal pump for different operating points. Comput. Fluids 2010, 39, 859–870. [Google Scholar] [CrossRef]
- Pacot, O.; Kato, C.; Guo, Y.; Yamade, Y.; Avellan, F. Large eddy simulation of the rotating stall in a pump-turbine operated in pumping mode at a part-load condition. ASME J. Fluids Eng. 2016, 138, 111102. [Google Scholar] [CrossRef]
- Asim, T.; Mishra, R. Large-Eddy-Simulation-based analysis of complex flow structures within the volute of a vaneless centrifugal pump. Sādhanā 2017, 42, 505–516. [Google Scholar] [Green Version]
- Miorini, R.L.; Wu, H.; Katz, J. The internal structure of the tip leakage vortex within the rotor of an axial waterjet pump. J. Turbomach. 2012, 134, 031018. [Google Scholar] [CrossRef]
- Zhou, P.; Wang, F.; Yang, Z.; Mou, G. Investigation of rotating stall for a centrifugal pump impeller using various SGS models. J. Hydrodyn. Ser. B 2017, 29, 235–242. [Google Scholar] [CrossRef]
- Paul, G.; Rezaienia, A.; Avital, E.; Korakianitis, T. Machinability and optimization of shrouded centrifugal impellers for implantable blood pumps. J. Med. Devices 2017, 11, 021005. [Google Scholar] [CrossRef]
- Shigemitsu, T.; Fukutomi, J.; Wada, T.; Shinohara, H. Performance analysis of mini centrifugal pump with splitter blades. J. Therm. Sci. 2013, 22, 573–579. [Google Scholar] [CrossRef]
- Grigoriev, S.; Mayorov, S.; Polyakov, R. Centrifugal pump’s impeller optimization using methods of calculation hydrodynamics. IOP Conf. Ser. Mat. Sci. Eng. 2017, 233, 012009. [Google Scholar] [CrossRef]
- Zheng, L.; Dou, H.; Jiang, W.; Chen, X.; Zhu, Z.; Cui, B. Influence of rotor-stator interaction on flow stability in centrifugal pump based on energy gradient method. Int. J. Turbo Jet Eng. 2016, 33, 413–419. [Google Scholar] [CrossRef]
- Keller, J.; Blanco, E.; Barrio, R.; Parrondo, J. PIV measurements of the unsteady flow structures in a volute centrifugal pump at a high flow rate. Exp. Fluids 2014, 55, 1820. [Google Scholar] [CrossRef]
- Hou, H.; Zhang, Y.; Xu, C.; Zhang, J.; Li, Z. Effects of radial diffuser hydraulic design on a double-suction centrifugal pump. IOP Conf. Ser. Mat. Sci. Eng. 2006, 129, 012017. [Google Scholar] [CrossRef]
- Kocaaslan, O.; Ozgoren, M.; Babayigit, O.; Aksoy, M.H. Numerical investigation of the effect of number of blades on centrifugal pump performance. AIP Conf. Proc. 2017, 1863, 030028. [Google Scholar]
- Posa, A.; Lippolis, A.; Balaras, E. Large-eddy simulation of a mixed-flow pump at off-design conditions. ASME J. Fluids Eng. 2015, 137, 101302. [Google Scholar] [CrossRef]
- Chen, R.; Zeng, Y.; Liu, X. Research on Effects of Blade Thickness on the Low-specific-speed Centrifugal Pump Performance. Mach. Mater. Sci. Energy Eng. 2015, 207–214. [Google Scholar] [CrossRef]
- Heo, M.; Ma, S.; Shim, H.; Kim, K. High-efficiency design optimization of a centrifugal pump. J. Mech. Sci. Technol. 2016, 30, 3917–3927. [Google Scholar] [CrossRef]
- Kocaaslan, O.; Ozgoren, M.; Aksoy, M.H.; Babayigit, O. Experimental and Numerical Investigation of Coating Effect on Pump Impeller and Volute. J. Appl. Fluid Mech. 2016, 9, 2475–2487. [Google Scholar] [CrossRef]
- Yuan, Y.; Yuan, S. Analyzing the effects of splitter blade on the performance characteristics for a high-speed centrifugal pump. Adv. Mech. Eng. 2017, 9. [Google Scholar] [CrossRef]
- Roberts, P.; Webster, D. Turbulent Diffusion; ASCE Press: Reston, VA, USA, 2002. [Google Scholar]
- Pope, S. Turbulent Flows; Cambridge University Press: Cambridge, UK, 2000. [Google Scholar]
- Staff Fluid Machinery Group. Centrifugal Pumps: State of the Art and New Opportunities; Ta Engineering Civil Engineering: London, UK, 2004. [Google Scholar]
- Lobanoff, V.; Ross, R. Centrifugal Pumps: Design and Application; Gulf Publishing Company: Houston, TX, USA, 1992. [Google Scholar]
- Menter, F. A comparison of some recent eddy-viscosity turbulence models. ASME J. Fluids Eng. 1996, 118, 514–519. [Google Scholar] [CrossRef]
- Suh, S.; Kim, K.; Kim, H.; Yoon, I.; Cho, M. A study on energy saving rate for variable speed condition of multistage centrifugal pump. J. Therm. Sci. 2015, 24, 566–573. [Google Scholar] [CrossRef]
- Tao, R.; Xiao, R.; Wang, Z. Influence of blade leading-edge shape on cavitation in a centrifugal pump impeller. Energies 2018, 11, 2588. [Google Scholar] [CrossRef]
- Braun, O.; Avellan, F.; Dupont, P. Unsteady numerical simulations of the flow related to the unstable energy-discharge characteristic of a medium specific speed double suction pump. In Proceedings of the Fluids Engineering Division Summer Meeting, San Diego, CA, USA, 30 July–2 August 2007; Volume 2, pp. 971–977. [Google Scholar]
- Menter, F.R.; Egorov, Y. The scale-adaptive simulation method for unsteady turbulent flow predictions. Part 1: Theory and model description. Flow Turbul. Combust. 2010, 85, 113–138. [Google Scholar] [CrossRef]
- Lucius, A.; Brenner, G. Unsteady CFD simulations of a pump in part load conditions using scale-adaptive simulation. Int. J. Heat Fluid Flow 2010, 31, 1113–1118. [Google Scholar] [CrossRef]
- Trivedi, C.; Cervantes, M.; Gandhi, B. Investigation of a high head Francis turbine at runaway operating conditions. Energies 2016, 9, 149. [Google Scholar] [CrossRef]
- Si, Q.; Yuan, J.; Yuan, S.; Wang, W.; Zhu, L.; Bois, G. Numerical investigation of pressure fluctuation in centrifugal pump volute based on SAS model and experimental validation. Adv. Mech. Eng. 2014, 6, 972081. [Google Scholar] [CrossRef]
- Spalart, P.R.; Shur, M. On the sensitization of turbulence models to rotation and curvature. Aerosp. Sci. Technol. 1997, 1, 297–302. [Google Scholar] [CrossRef]
- Tao, R.; Xiao, R.; Yang, W.; Wang, F. A comparative assessment of Spalart-Shur rotation/curvature correction in RANS simulations in a centrifugal pump impeller. Math. Probl. Eng. 2014, 2014, 342905. [Google Scholar] [CrossRef]
- Sun, J.; Kuhn, D.; Naterer, G. Eddy viscosity and Reynolds stress models of entropy generation in turbulent channel flows. ASME J. Fluids Eng. 2017, 139, 034501. [Google Scholar] [CrossRef]
- Li, D.; Wang, H.; Qin, Y.; Han, L.; Qin, D. Entropy production analysis of hysteresis characteristic of a pump-turbine model. Energy Convers. Manag. 2017, 149, 175–191. [Google Scholar] [CrossRef]
- Berten, S.; Dupont, P.; Fabre, L.; Kayal, M.; Avellan, F.; Farhat, M. Experimental investigation of flow instabilities and rotating stall in a high-energy centrifugal pump stage. In Proceedings of the ASME 2009 Fluids Engineering Division Summer Meeting, Vail, CO, USA, 2–6 August 2009; pp. 505–513. [Google Scholar]
- Leguizamón, S.; Ségoufin, C.; Hai-Trieu, P.; Avellan, F. On the Efficiency Alteration Mechanisms Due to Cavitation in Kaplan Turbines. ASME J. Fluids Eng. 2017, 139, 061301. [Google Scholar] [CrossRef]
- Ubaldi, M.; Zunino, P.; Barigozzi, G.; Cattanei, A. An experimental investigation of stator induced unsteadiness on centrifugal impeller outflow. J. Turbomach. 1996, 118, 41–51. [Google Scholar] [CrossRef]
- Shuai, Z.; Jiang, C.; Wang, D.; Zhou, Z.; Li, F. Numerical simulation of dynamic flow characteristics in a centrifugal water pump with three-vaned diffuser. Adv. Mech. Eng. 2015, 7. [Google Scholar] [CrossRef] [Green Version]
- Krause, N.; Zähringer, K.; Pap, E. Time-Resolved Particle Imaging Velocimetry for the Investigation of Rotating Stall in a Radial Pump. Exp. Fluids 2005, 39, 192–201. [Google Scholar] [CrossRef]
- Zhao, X.; Xiao, Y.; Wang, Z.; Luo, Y.; Cao, L. Unsteady Flow and Pressure Pulsation Characteristics Analysis of Rotating Stall in Centrifugal Pumps Under Off-Design Conditions. ASME J. Fluids Eng. 2017, 140, 021105. [Google Scholar] [CrossRef]
- Hasmatuchi, V.; Farhat, M.; Roth, S.; Botero, F.; Avellan, F. Experimental evidence of rotating stall in a pump-turbine at off-design conditions in generating mode. ASME J. Fluids Eng. 2011, 133, 051104. [Google Scholar] [CrossRef]
- Shibata, A.; Hiramatsu, H.; Komaki, S.; Miyagawa, K.; Maeda, M.; Kamei, S.; Hazama, R.; Sano, T.; Iino, M. Study of Flow Instability in Off Design Operation of a Multistage Centrifugal Pump. J. Mech. Sci. Technol. 2016, 30, 493–498. [Google Scholar] [CrossRef]


| References | NQE | Number of Blades | References | NQE | Number of Blades |
|---|---|---|---|---|---|
| 3 | 0.17 | 1 | 21 | 0.09 | 6 |
| 8 | 0.09 | 4 | 22 | 0.20 | 5 |
| 9 | 0.03 | 7 | 23 | 0.02 | 7 |
| 10 | 0.17 | 6 | 25 | 0.04 | 4 |
| 11 | 0.13 | 5 | 26 | 0.06 | 5 |
| 12 | 0.07 | 7 | 27 | 0.08 | 7 |
| 16 | 0.08 | 6 | 28 | 0.04 | 6 |
| 18 | 0.07 | 6 | - | - | - |
| Monitor Point | Z (m) | R (m) | θ (°) | Monitor Point | Z (m) | R (m) | θ (°) |
|---|---|---|---|---|---|---|---|
| S11 | 0.053 | 0.060 | 171.8 | pbt1 | 0.000 | 0.374 | 36.1 |
| S12 | 0.047 | 0.089 | 131.7 | pbt2 | 0.000 | 0.292 | 0.0 |
| S13 | 0.035 | 0.100 | 92.7 | pbt3 | 0.000 | 0.277 | −90.0 |
| S14 | 0.035 | 0.119 | 58.5 | pbt4 | 0.000 | 0.260 | 180.0 |
| S15 | 0.035 | 0.137 | 30.0 | pbt5 | 0.000 | 0.242 | 90.0 |
| S16 | 0.035 | 0.153 | −3.9 | pbt6 | 0.000 | 0.236 | 66.3 |
| P11 | 0.053 | 0.084 | 58.2 | pbt7 | 0.000 | 0.270 | 52.8 |
| P12 | 0.037 | 0.098 | 20.8 | FCA1 | 0.055 | 0.155 | 90.0 |
| P13 | 0.036 | 0.112 | −13.4 | FCA2 | 0.055 | 0.155 | 180.0 |
| P14 | 0.036 | 0.127 | −44.0 | FCA3 | 0.055 | 0.155 | 270.0 |
| P15 | 0.036 | 0.142 | −71.1 | FCA4 | 0.055 | 0.155 | 0.0 |
| P16 | 0.036 | 0.154 | −93.7 | - | - | - | - |
| Discharge | Position | Characteristic Frequency | Maximum |cp| | Monitor Point with Maximum |cp| |
|---|---|---|---|---|
| 1.0 × Q0 | Pressure Side | n | 0.079 | P15 |
| 1.0 × Q0 | Suction Side | n | 0.065 | S16 |
| 0.8 × Q0 | Pressure Side | n | 0.050 | P15 |
| 0.8 × Q0 | Pressure Side | 0.5 × n | 0.011 | P16 |
| 0.8 × Q0 | Suction Side | n | 0.043 | S16 |
| 0.8 × Q0 | Suction Side | 0.5 × n | 0.008 | S14 |
| 0.5 × Q0 | Pressure Side | 3 × n | 0.030 | P11 |
| 0.5 × Q0 | Pressure Side | 0.7 × n | 0.012 | P11 |
| 0.5 × Q0 | Suction Side | 3 × n | 0.034 | S11 |
| 0.5 × Q0 | Suction Side | 0.7 × n | 0.011 | S13 |
© 2019 by the authors. Licensee MDPI, Basel, Switzerland. This article is an open access article distributed under the terms and conditions of the Creative Commons Attribution (CC BY) license (http://creativecommons.org/licenses/by/4.0/).
Share and Cite
Zhao, X.; Luo, Y.; Wang, Z.; Xiao, Y.; Avellan, F. Unsteady Flow Numerical Simulations on Internal Energy Dissipation for a Low-Head Centrifugal Pump at Part-Load Operating Conditions. Energies 2019, 12, 2013. https://doi.org/10.3390/en12102013
Zhao X, Luo Y, Wang Z, Xiao Y, Avellan F. Unsteady Flow Numerical Simulations on Internal Energy Dissipation for a Low-Head Centrifugal Pump at Part-Load Operating Conditions. Energies. 2019; 12(10):2013. https://doi.org/10.3390/en12102013
Chicago/Turabian StyleZhao, Xiaoran, Yongyao Luo, Zhengwei Wang, Yexiang Xiao, and François Avellan. 2019. "Unsteady Flow Numerical Simulations on Internal Energy Dissipation for a Low-Head Centrifugal Pump at Part-Load Operating Conditions" Energies 12, no. 10: 2013. https://doi.org/10.3390/en12102013