Current Status Investigation and Predicting Carbon Dioxide Emission in Latin American Countries by Connectionist Models

 ,
,  and
and
Abstract
:1. Introduction
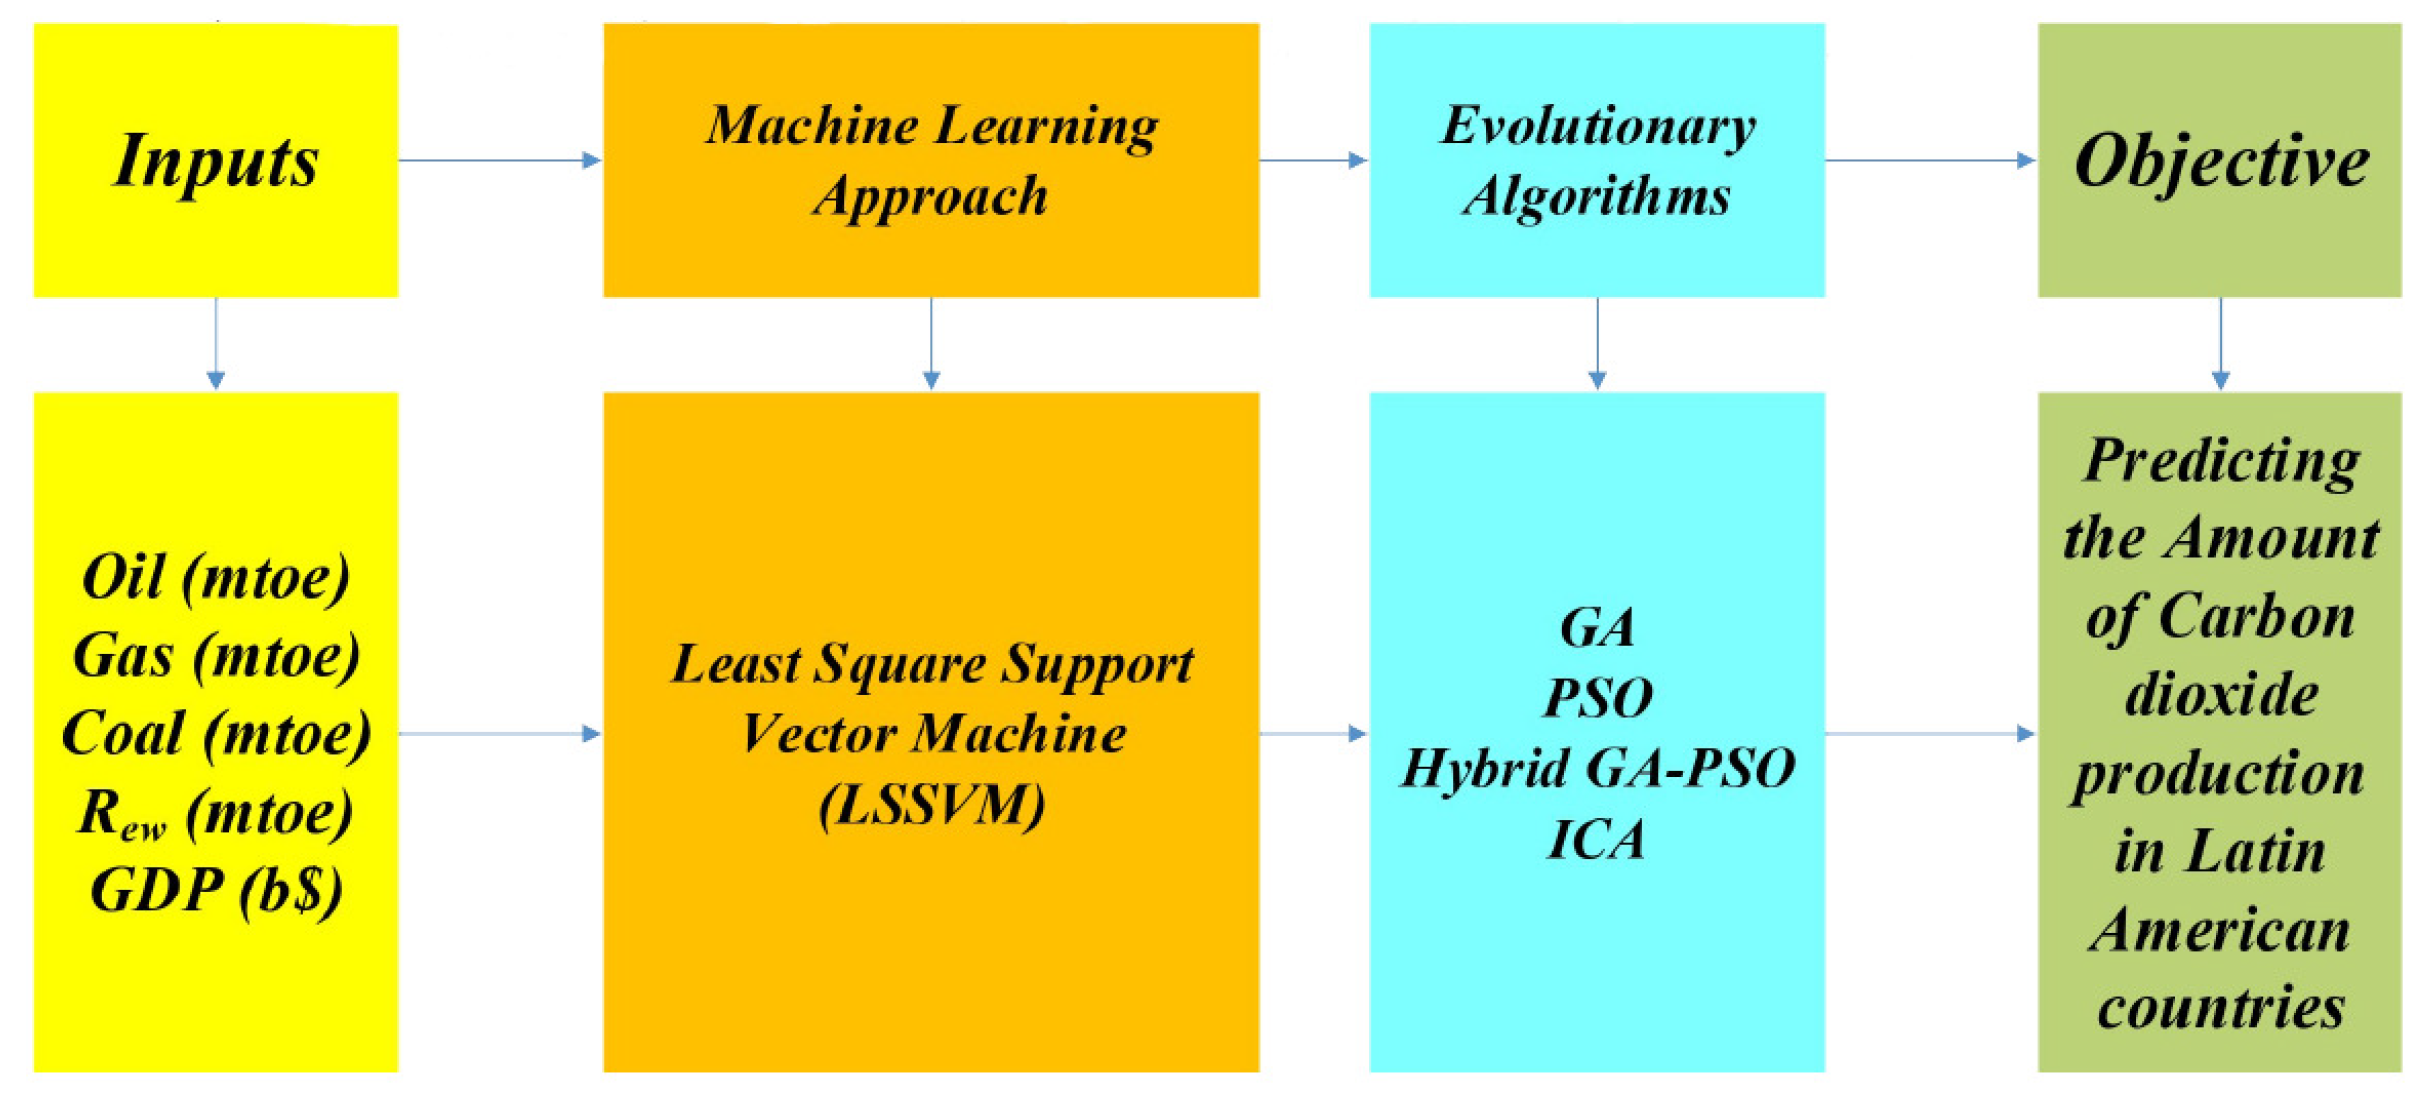
2. Methodology
2.1. Least Squares Support Vector Machine
2.2. Evolutionary Algorithms
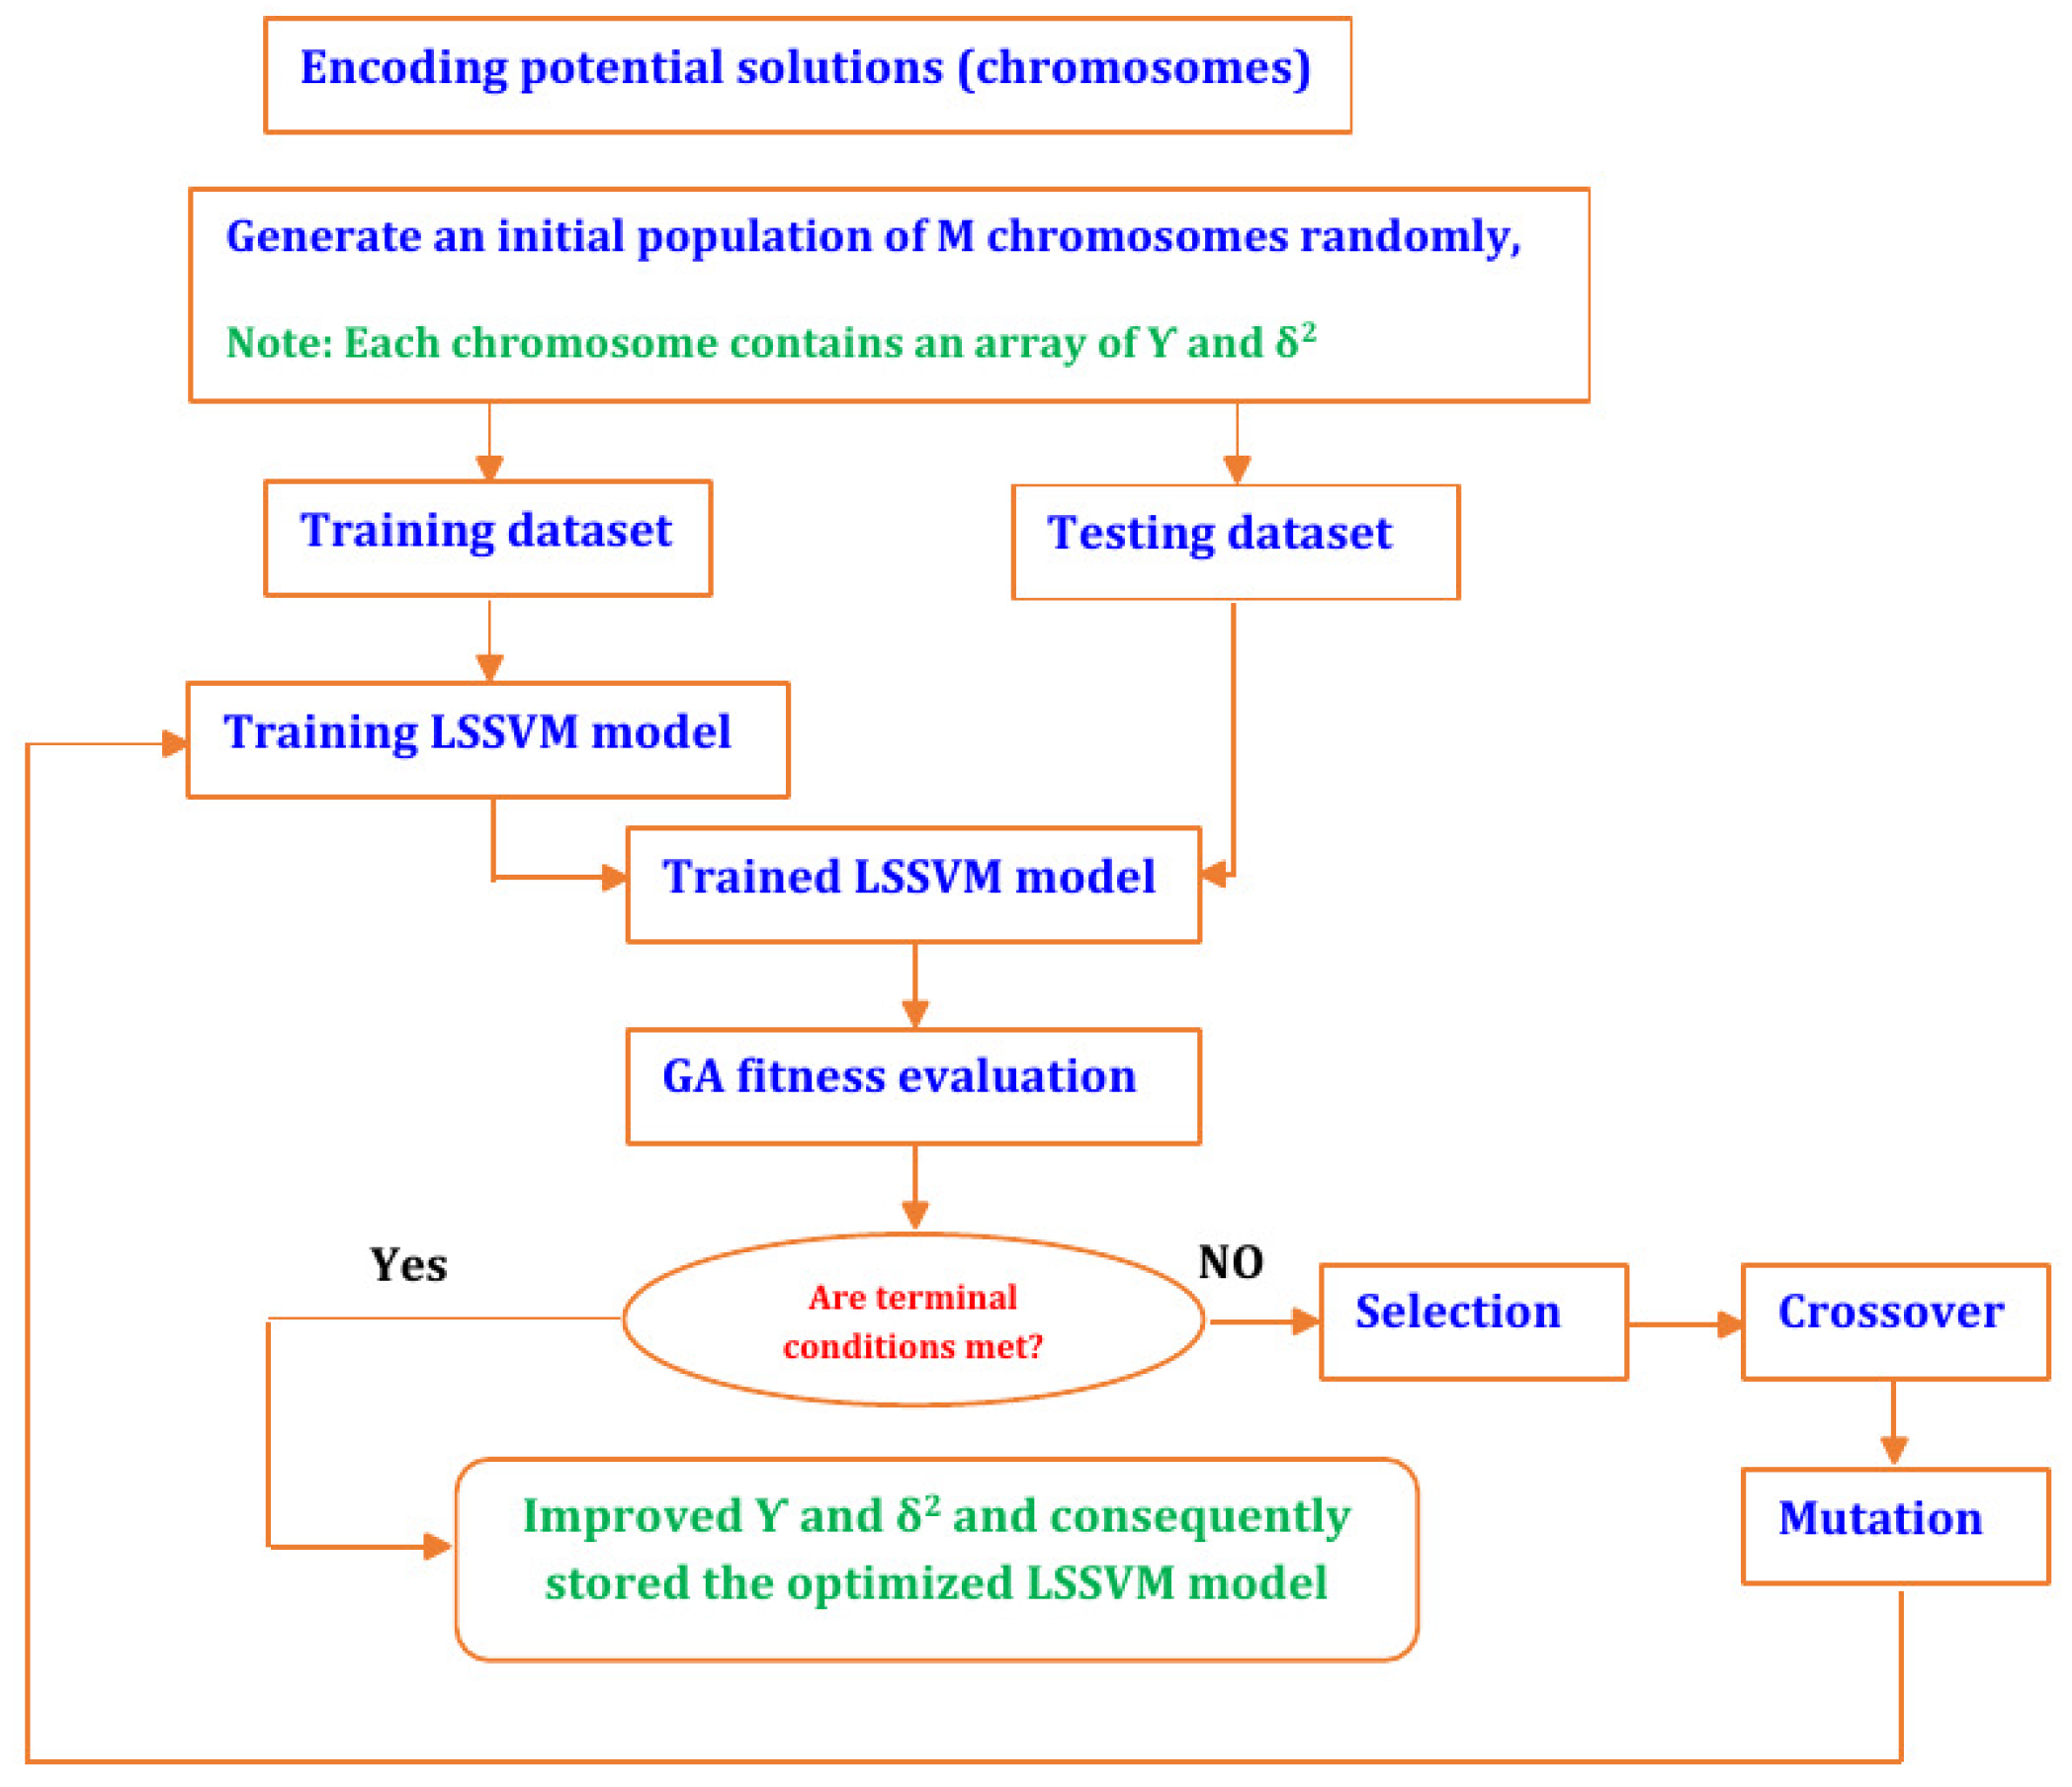
2.2.1. Genetic Algorithm
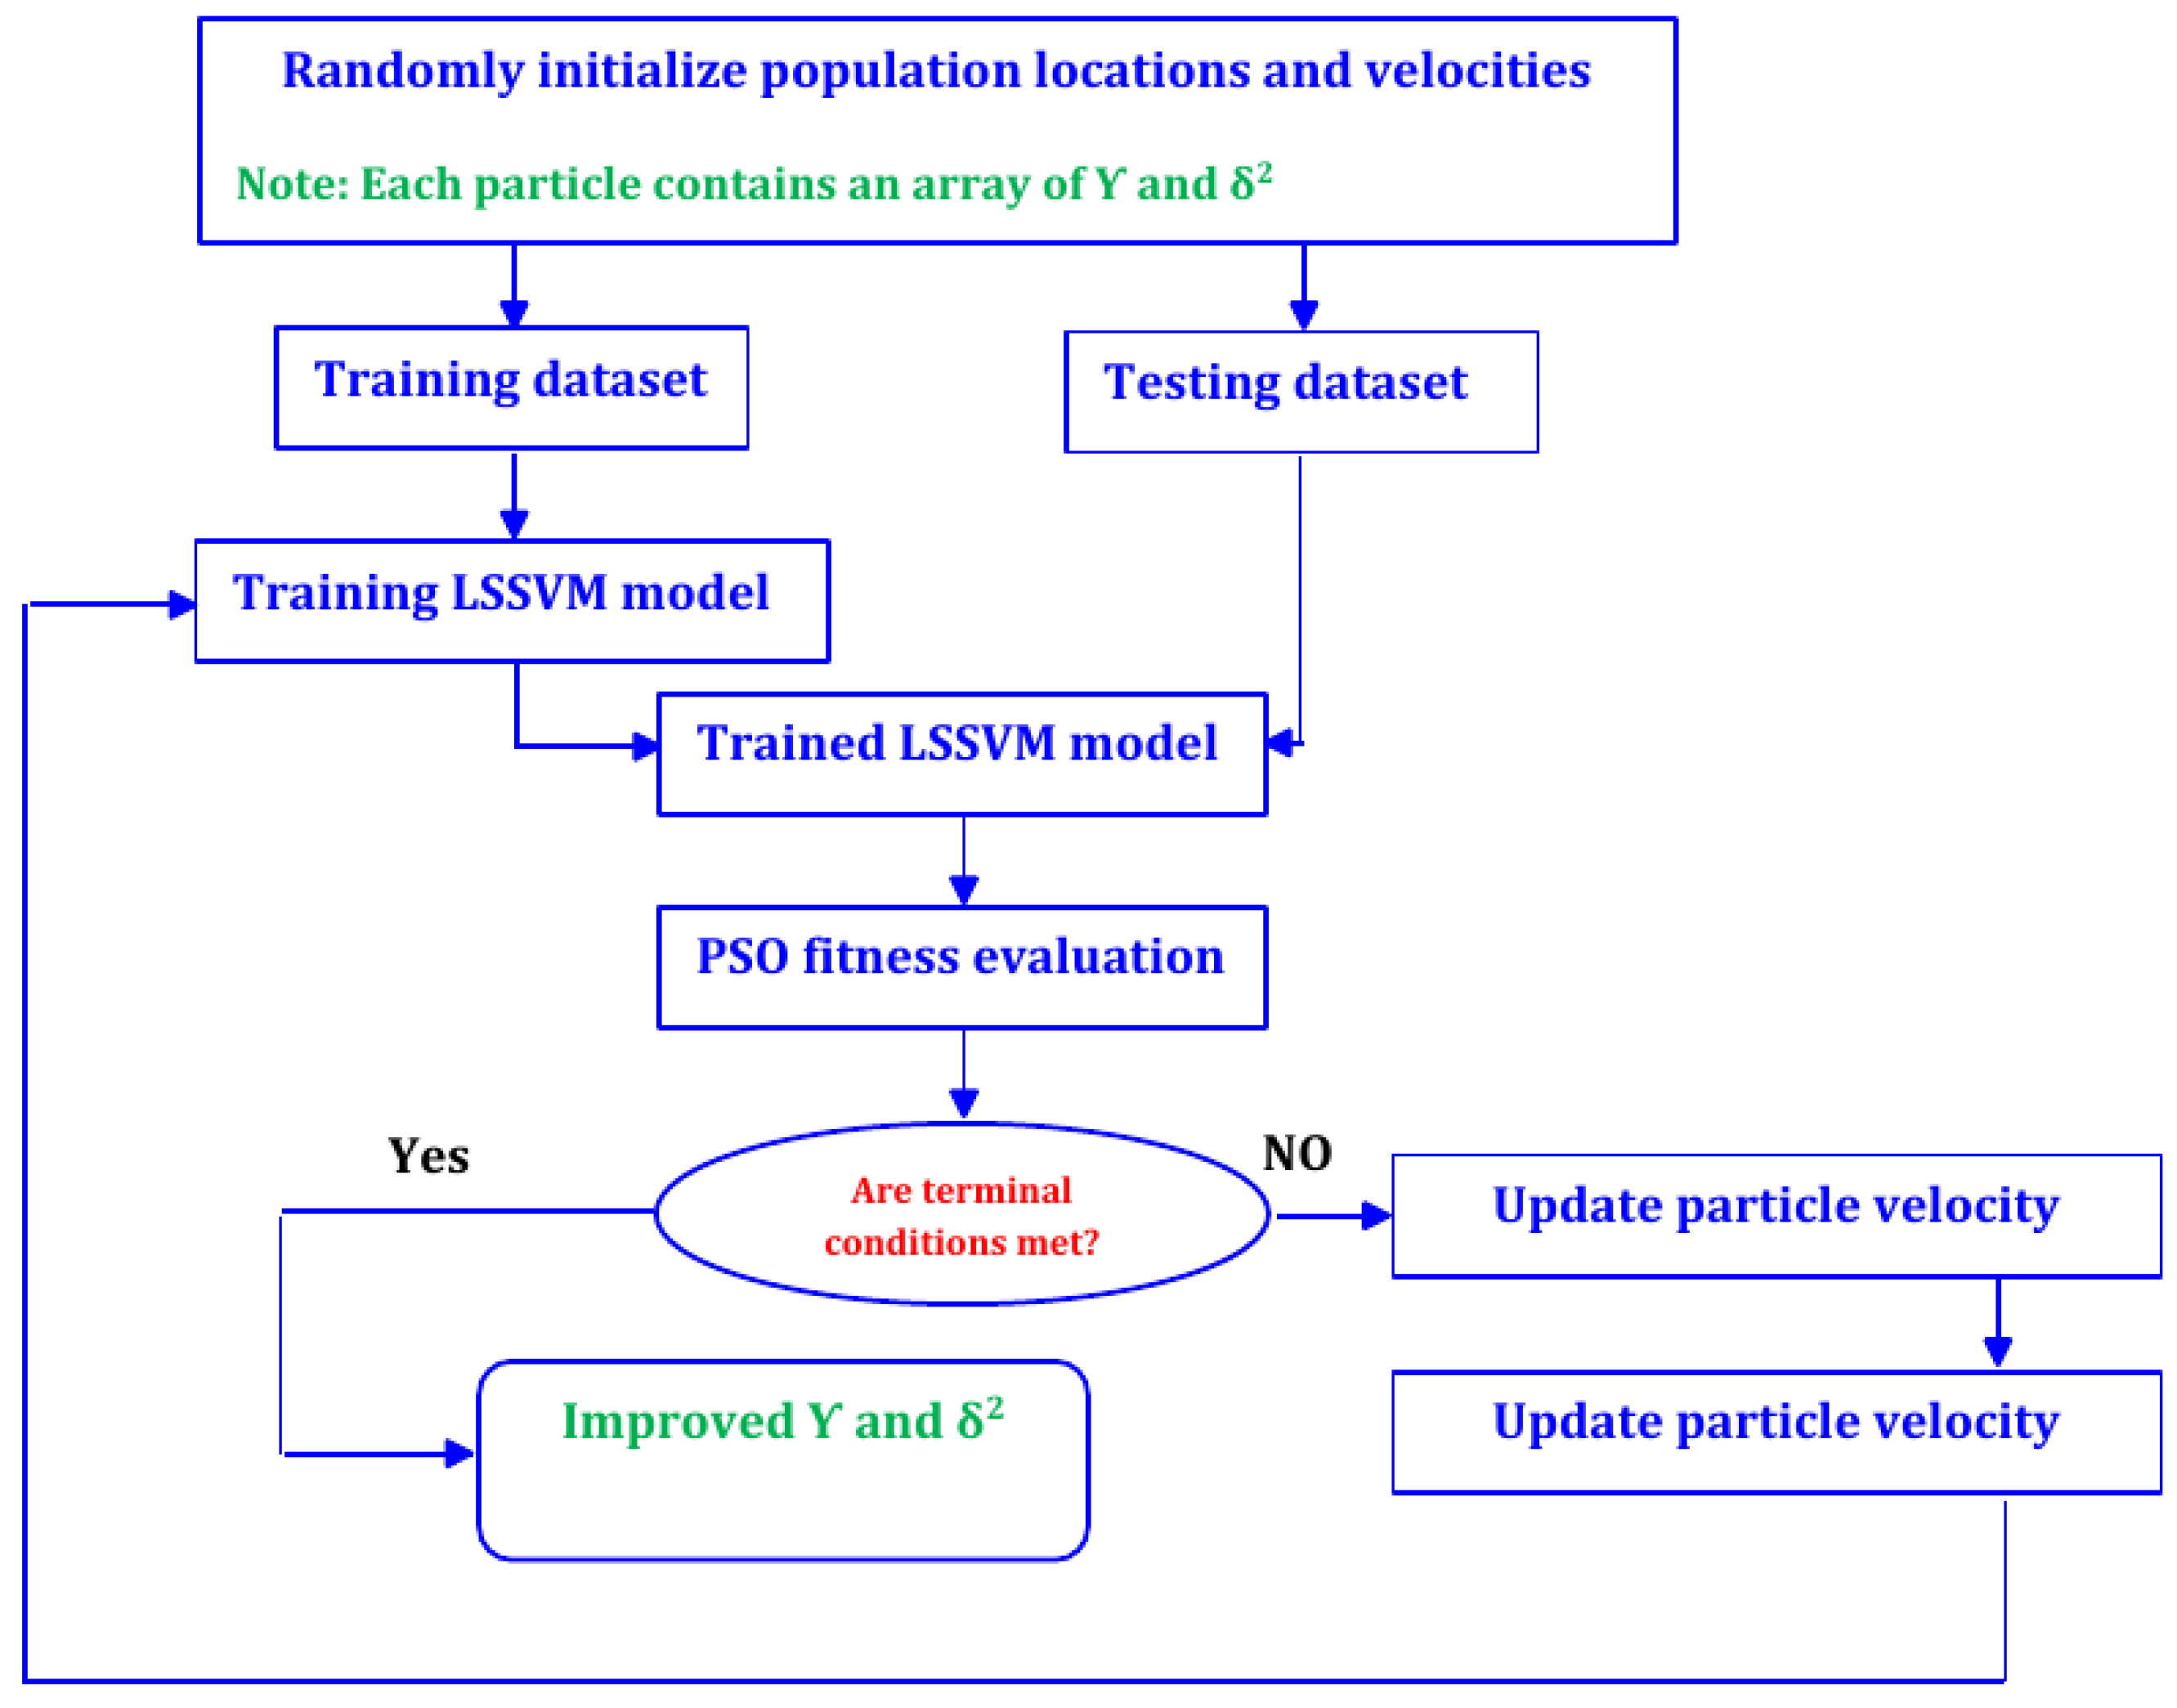
2.2.2. Particle Swarm Optimization
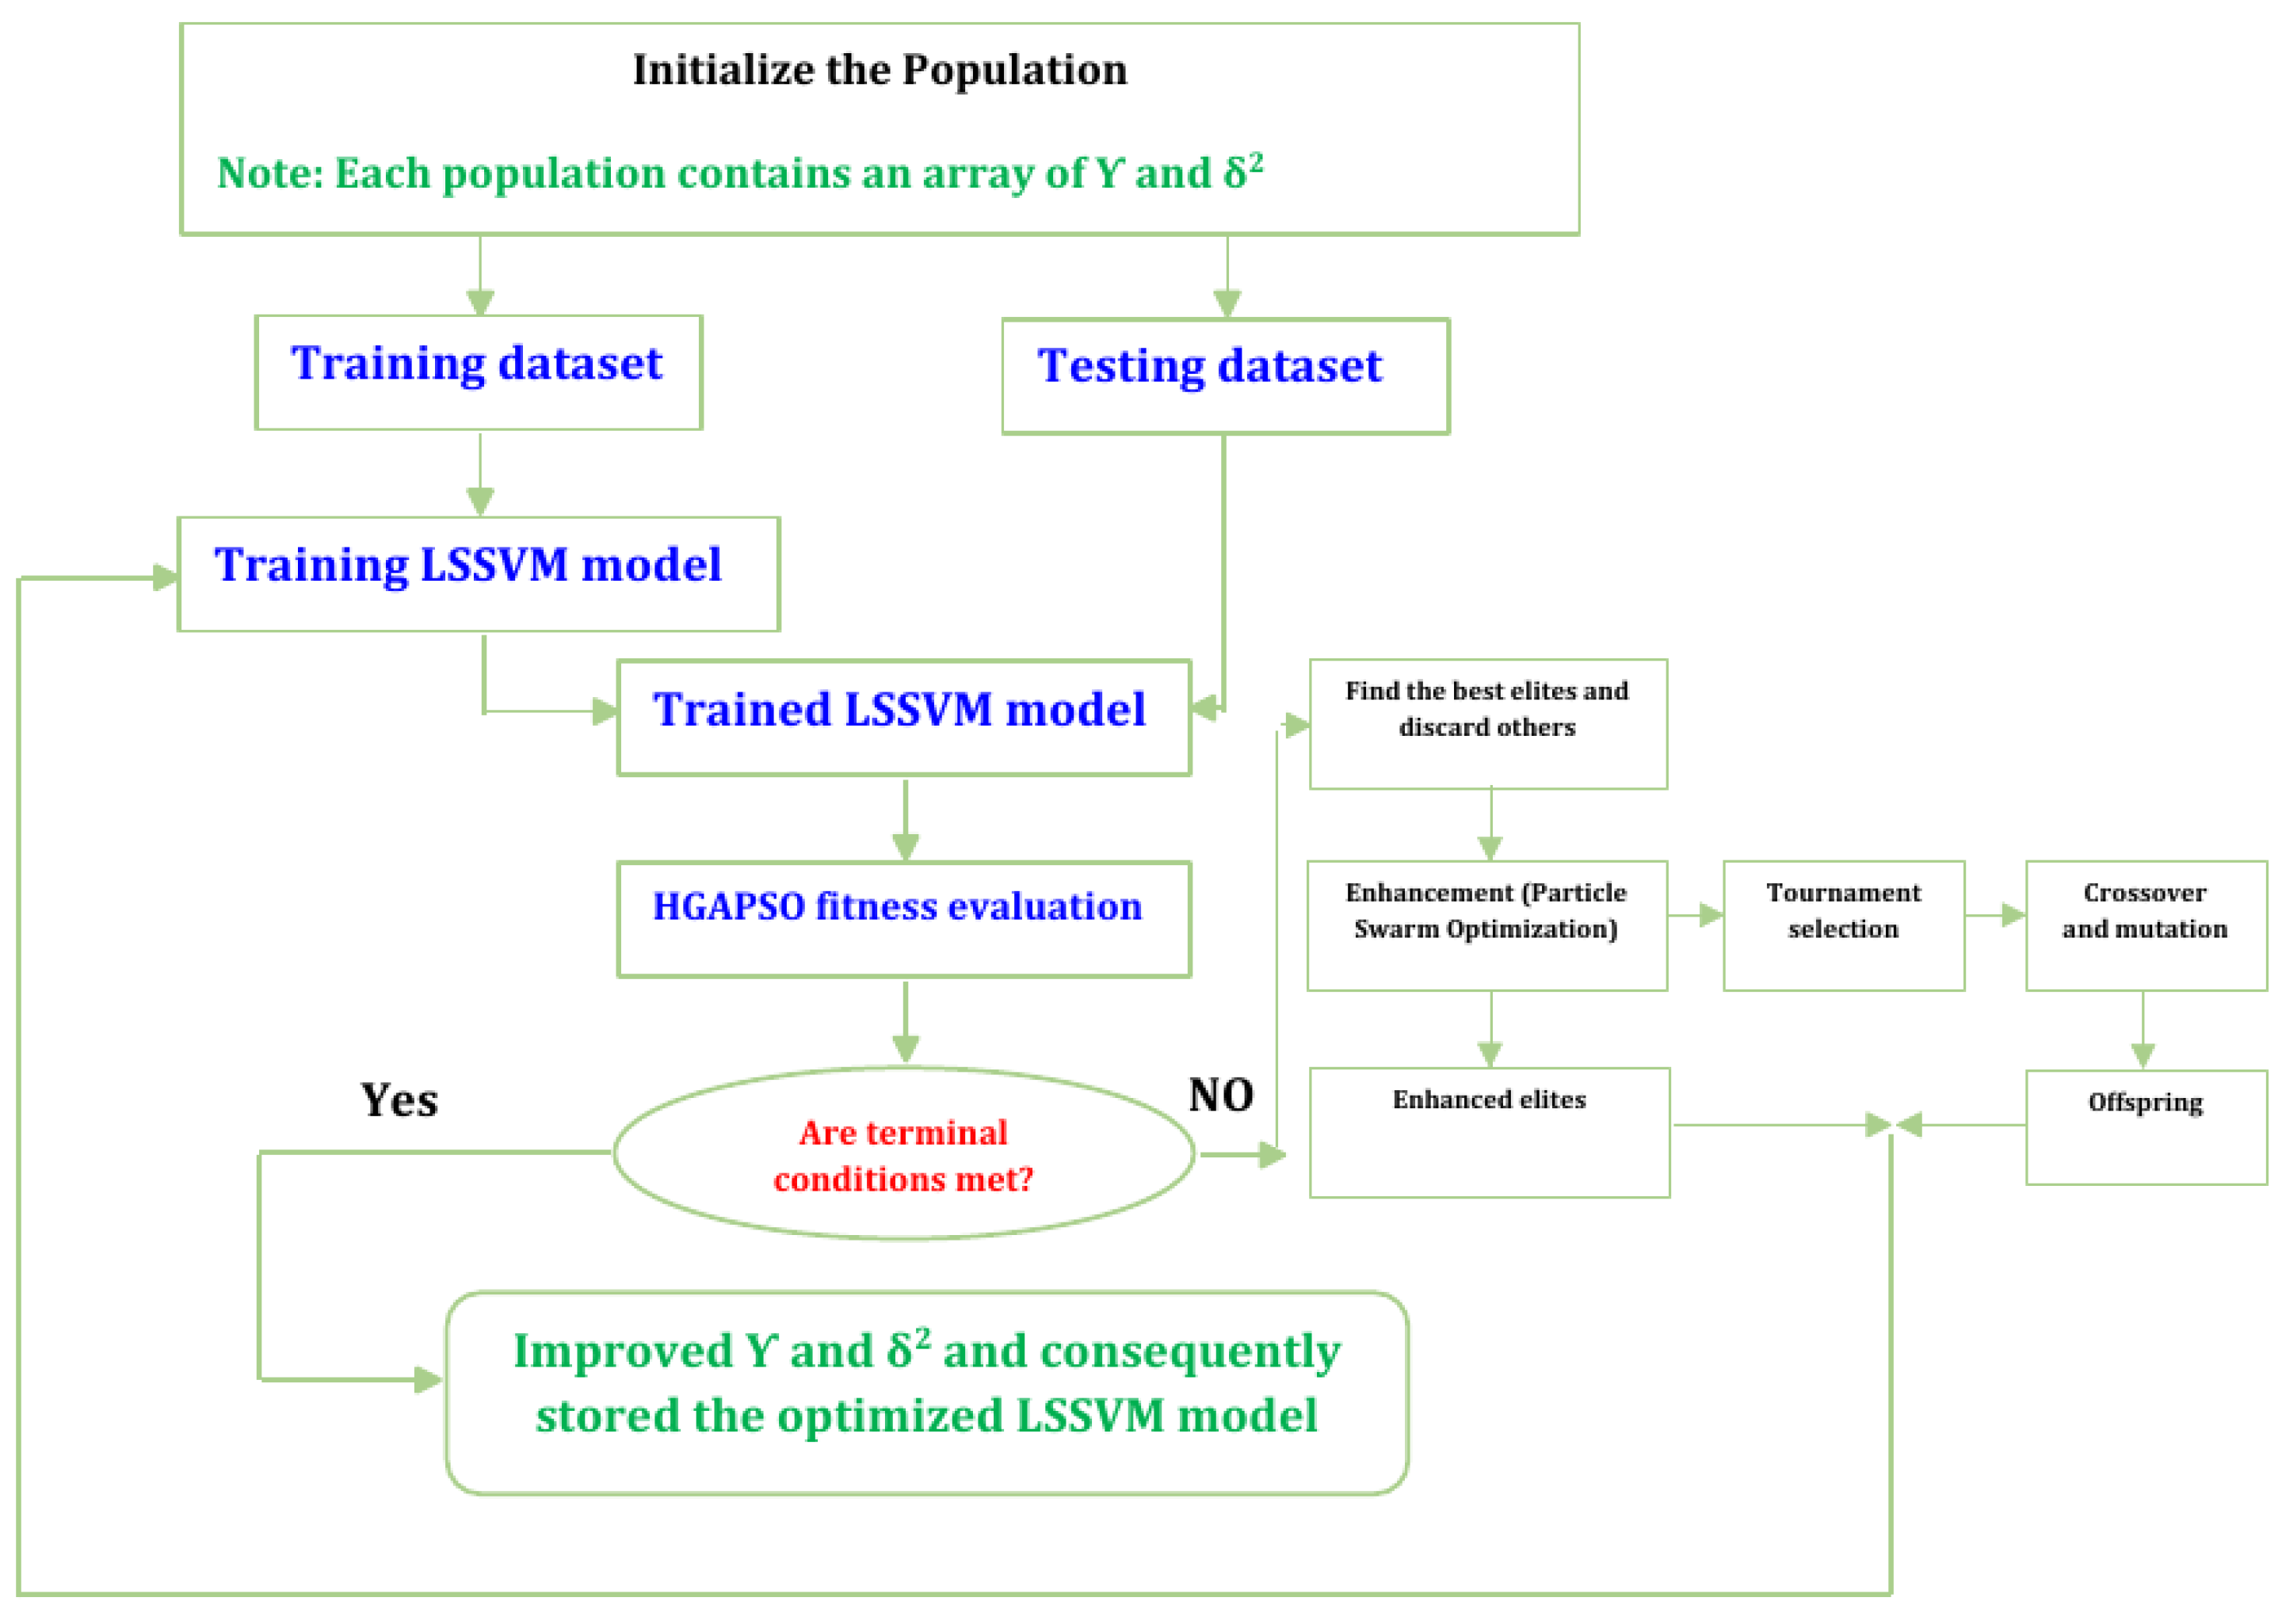
2.2.3. Hybrid PSO and GA
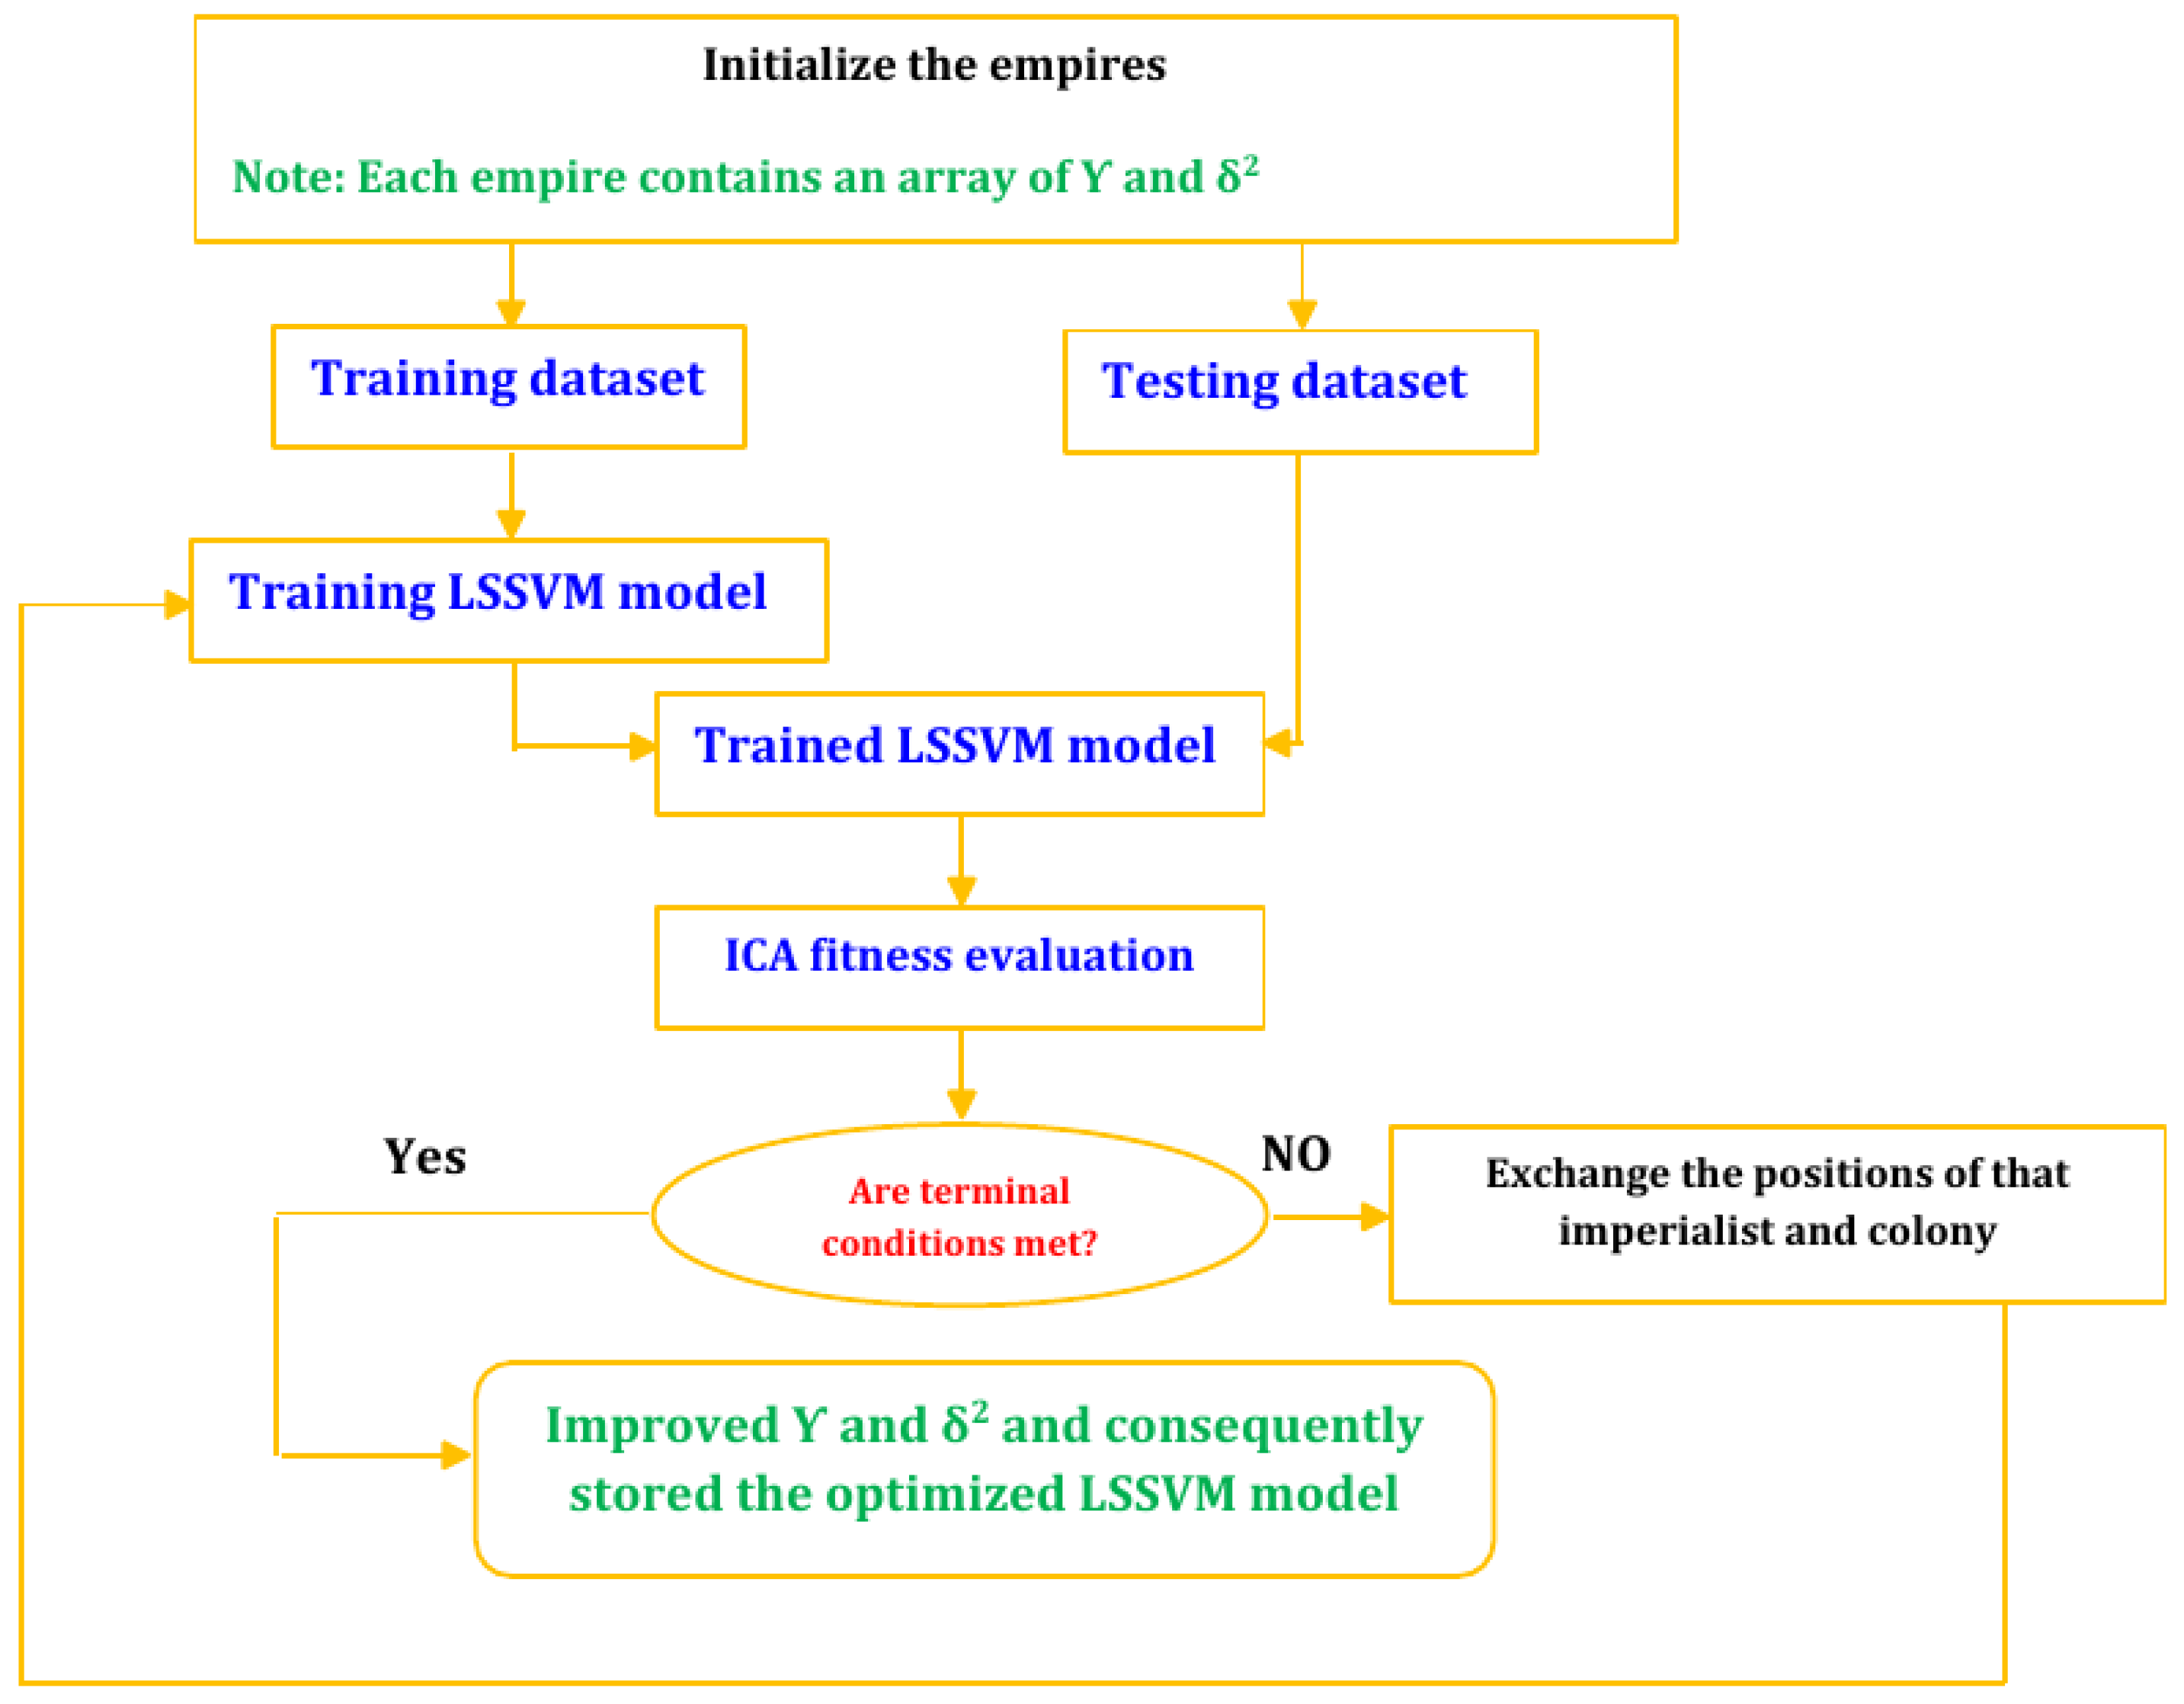
2.2.4. Imperialist Competitive Algorithm
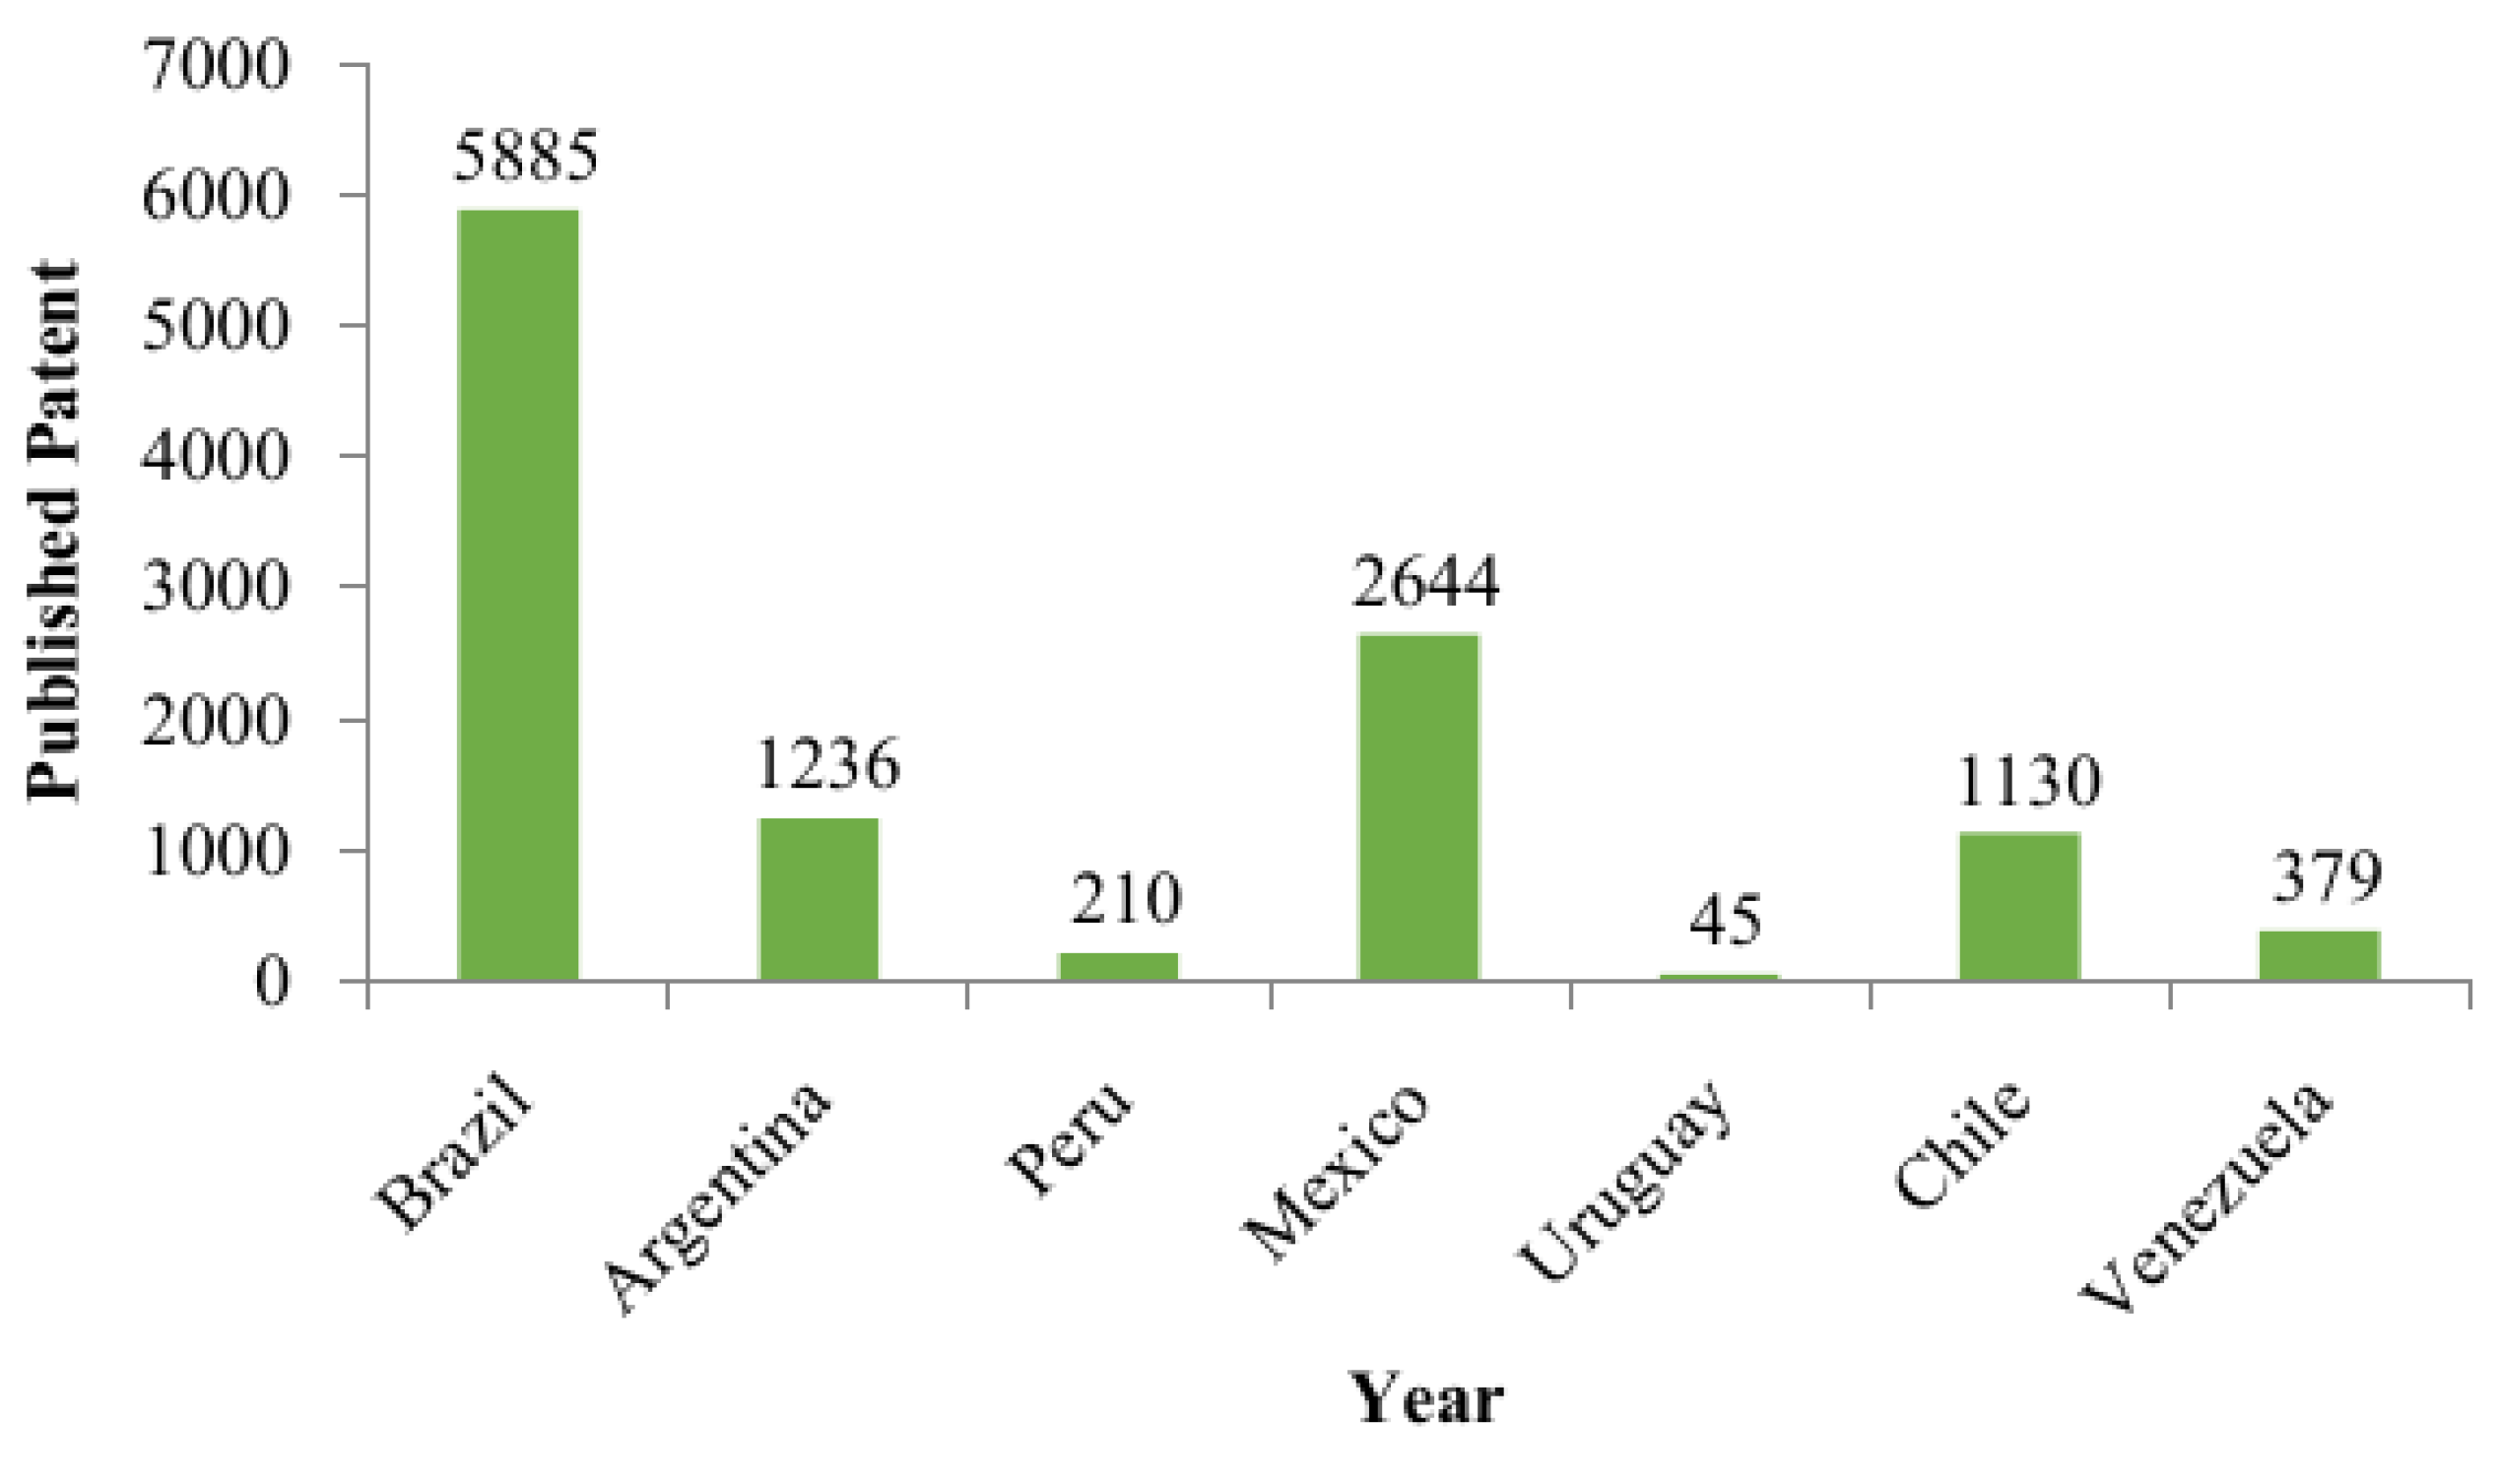
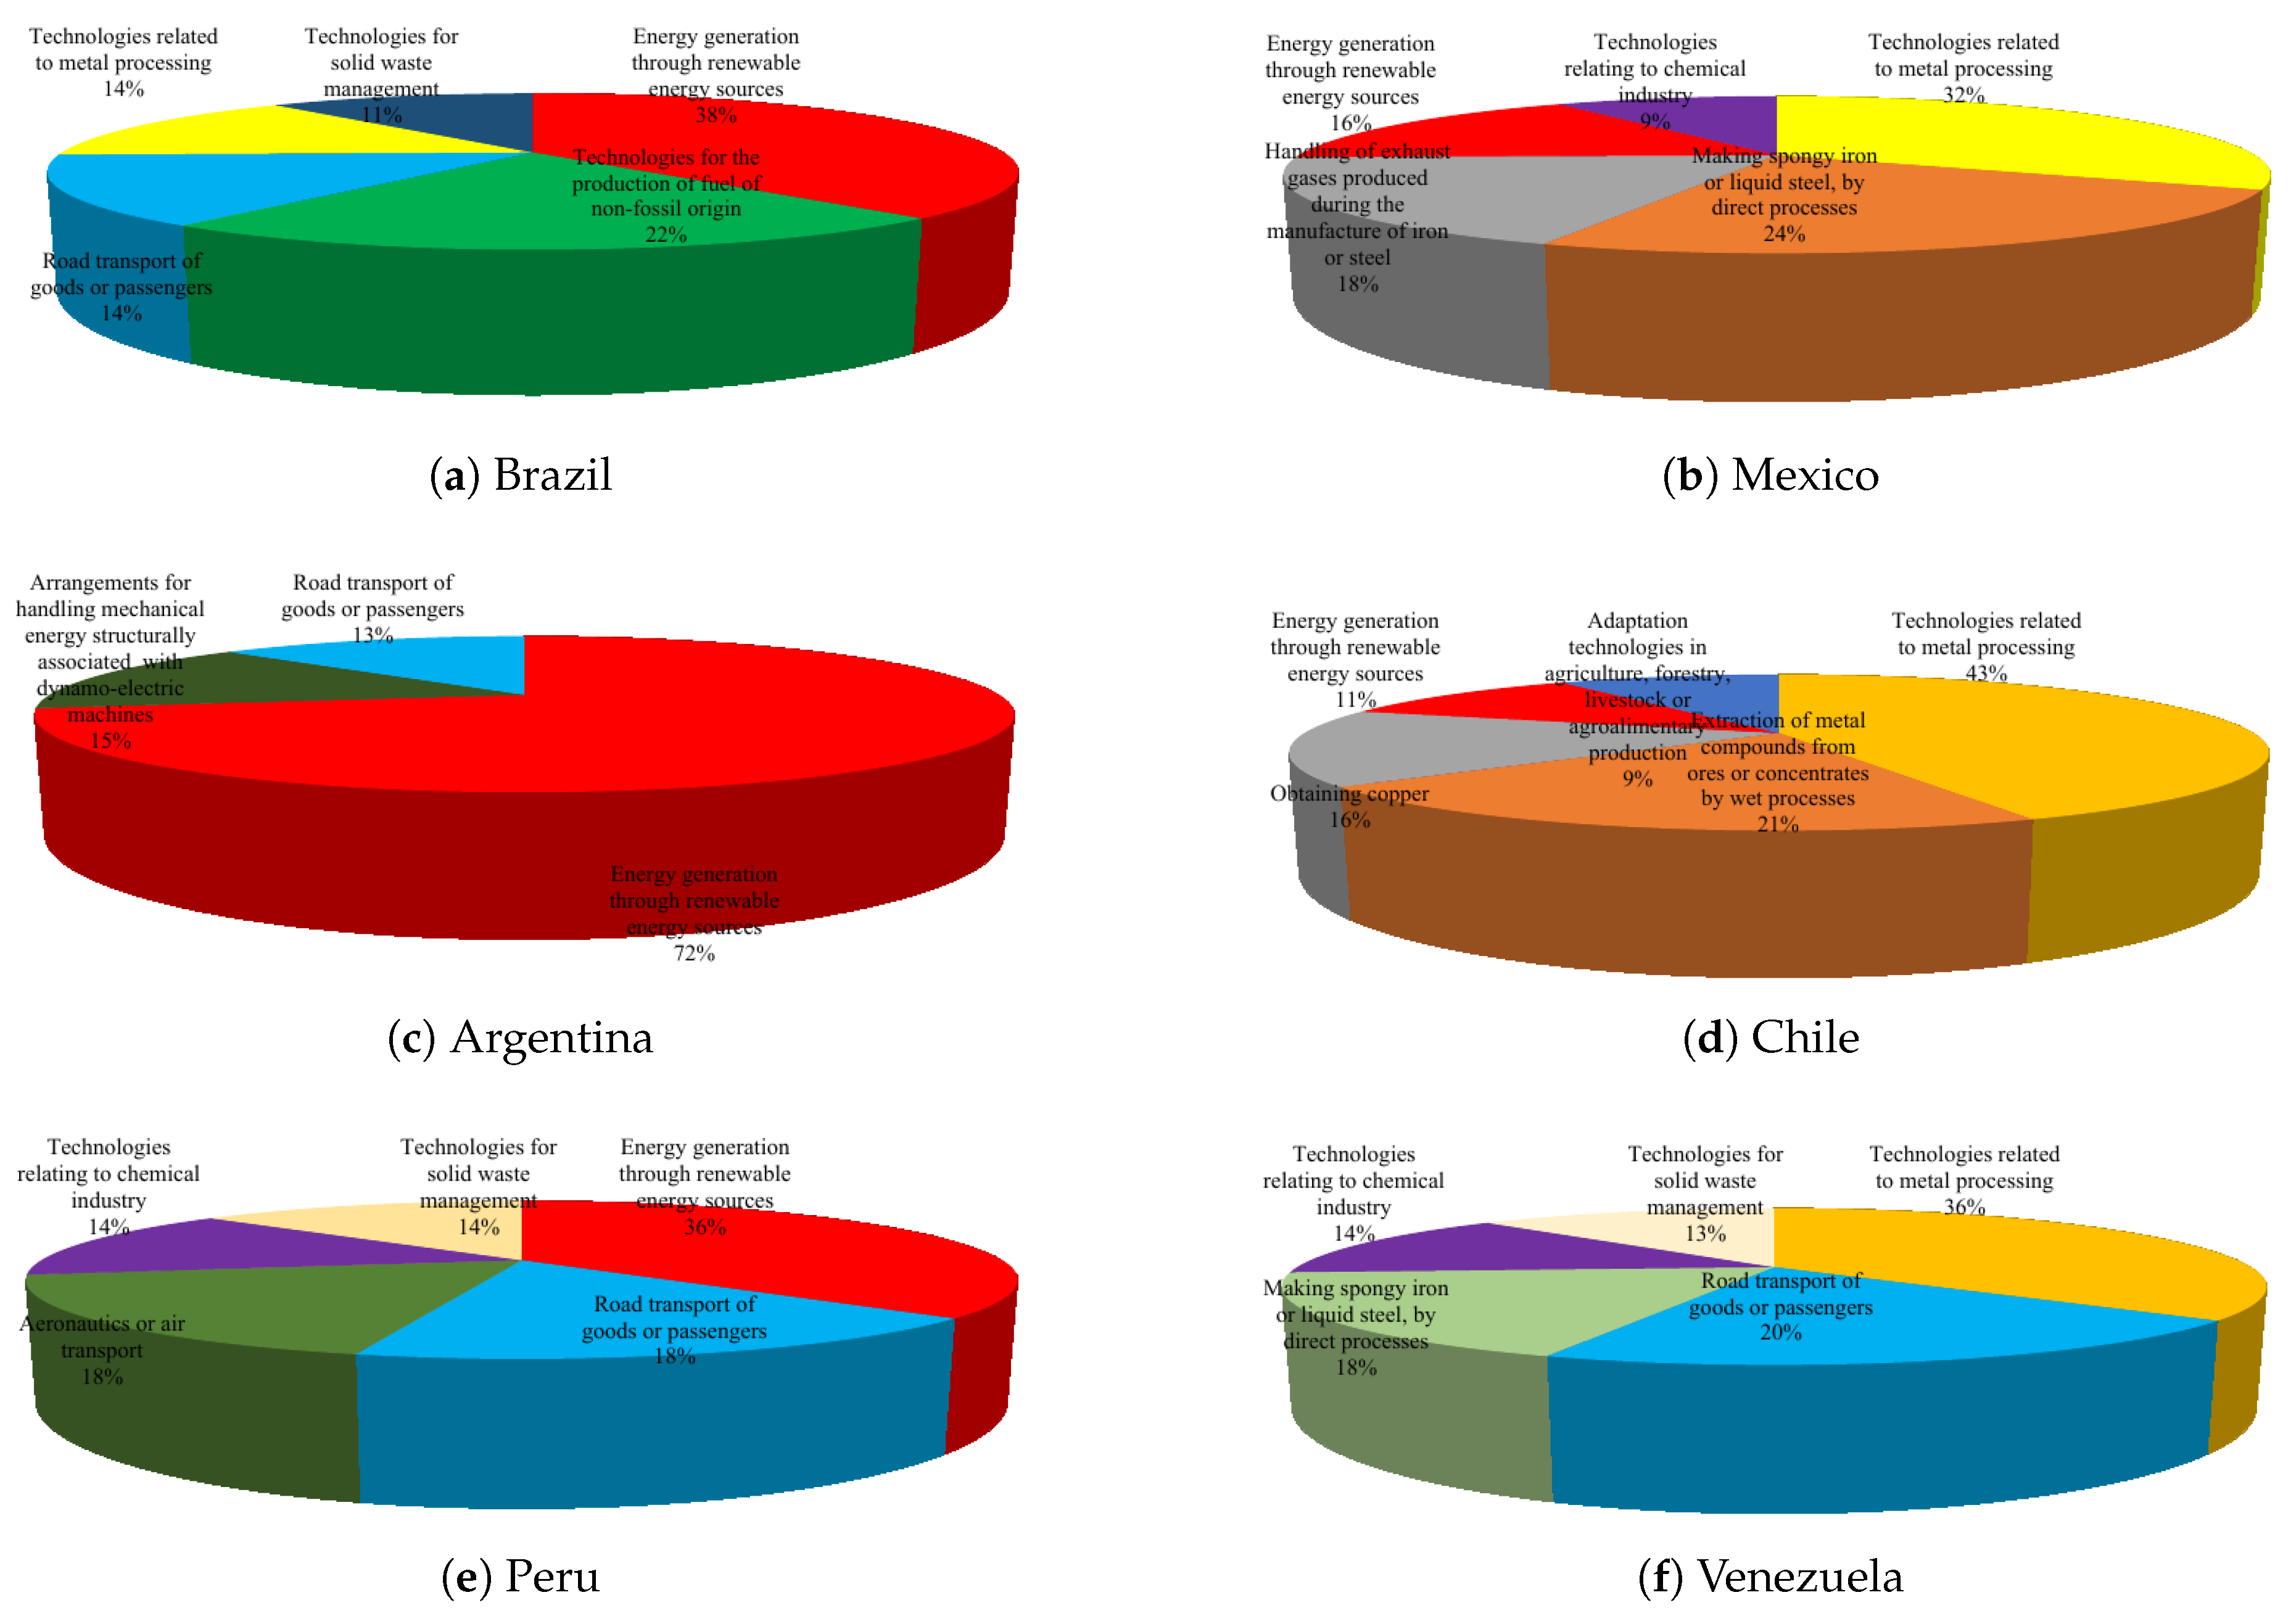
3. Patent Analysis
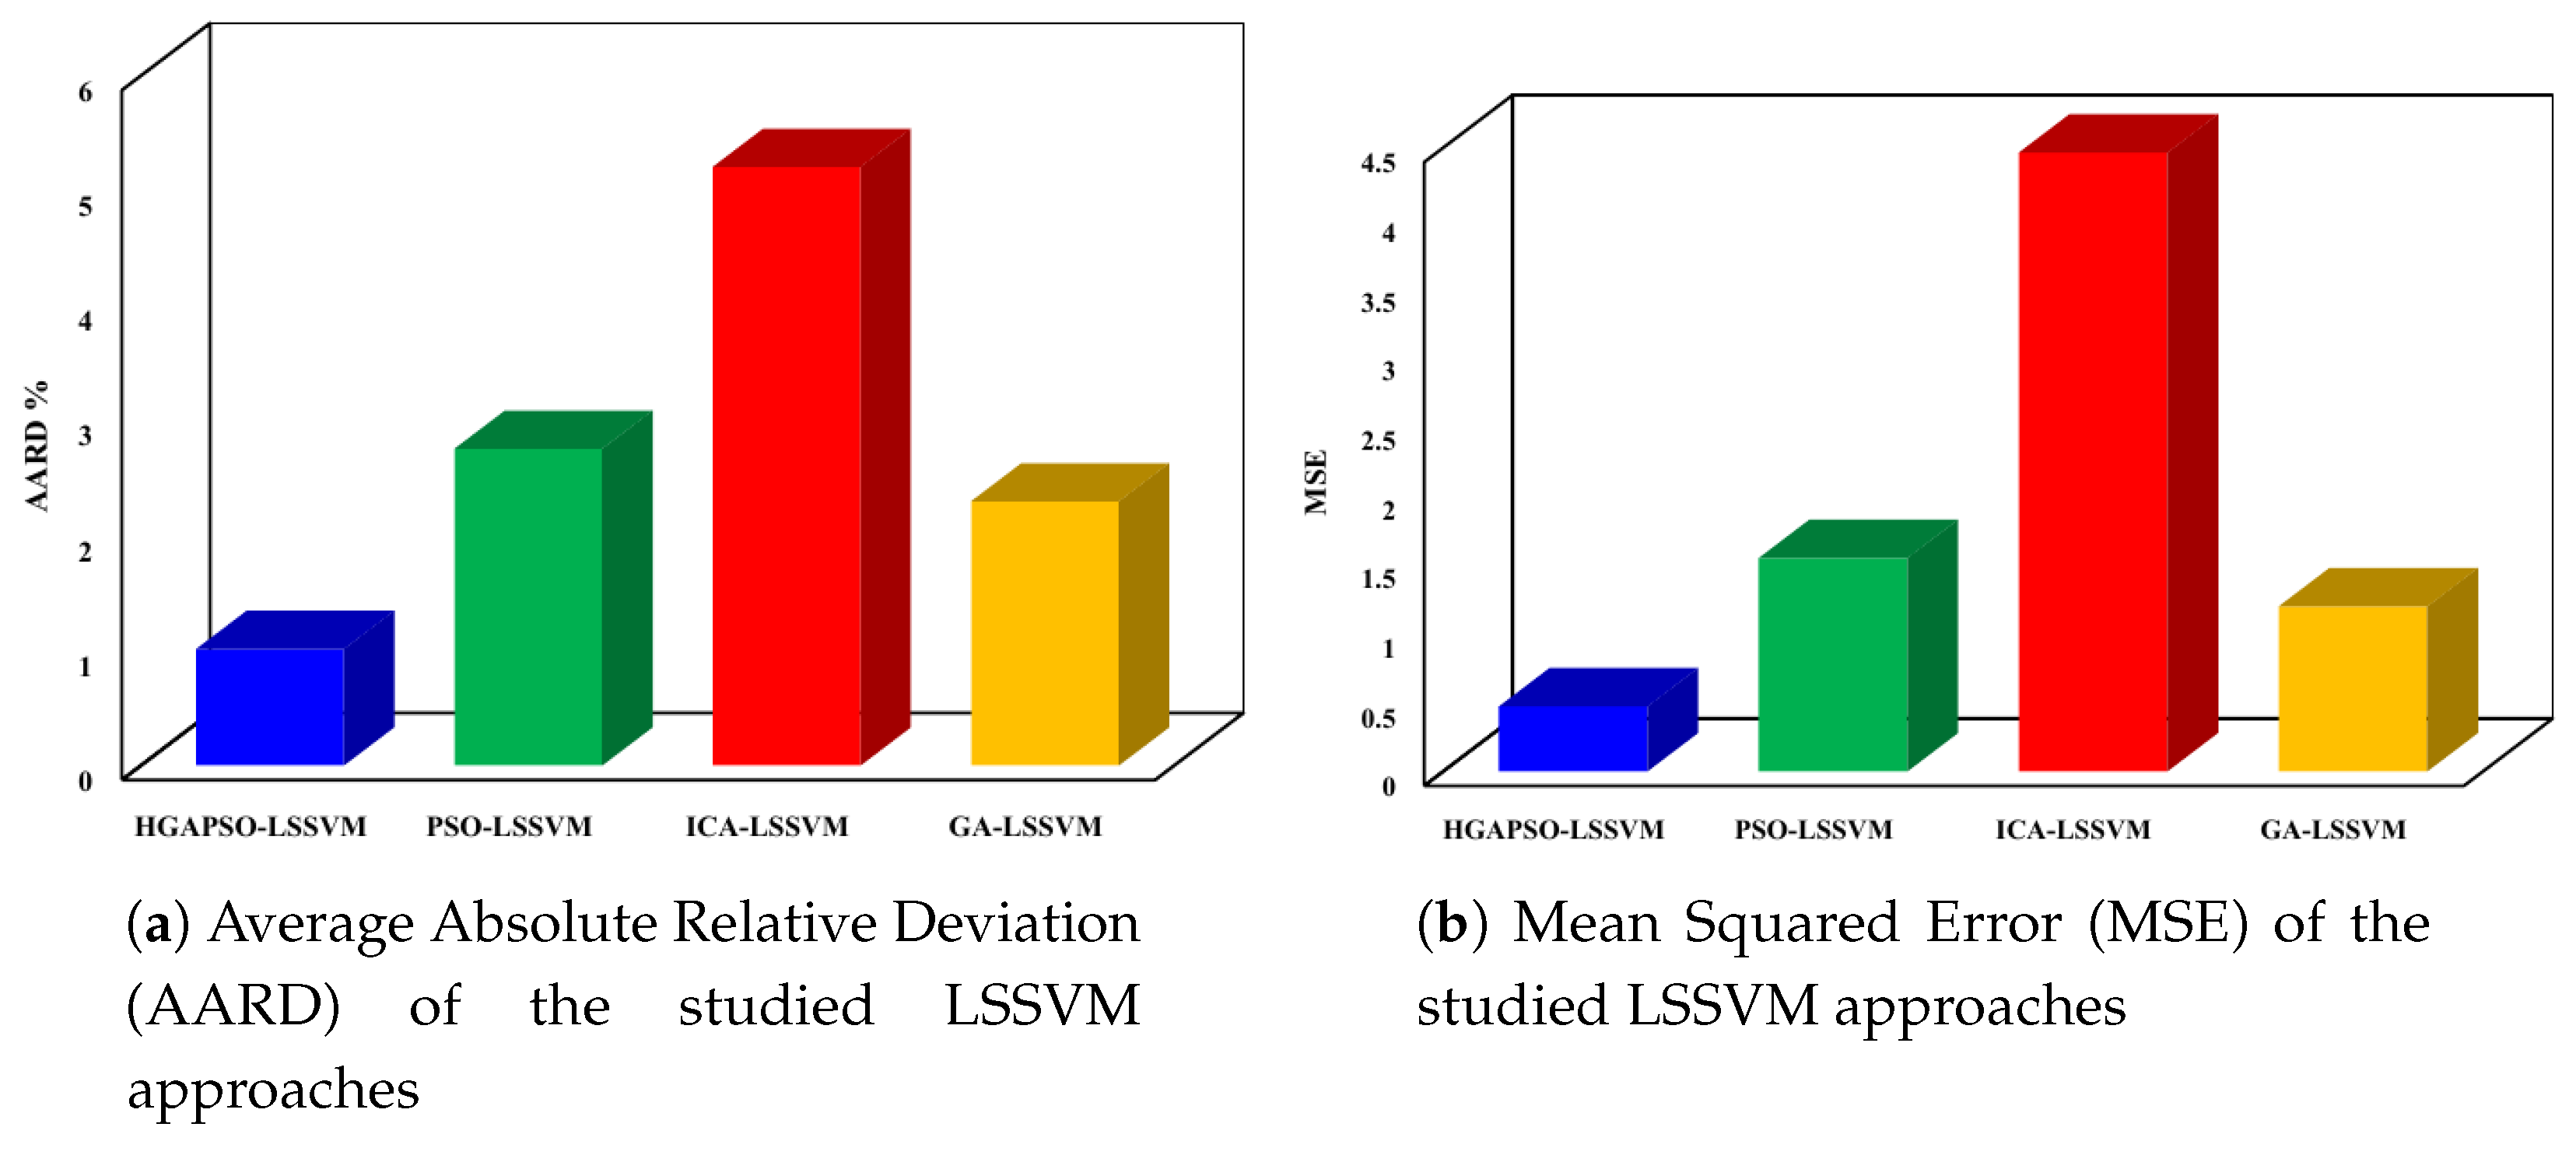
4. Results and Discussion
5. Conclusions
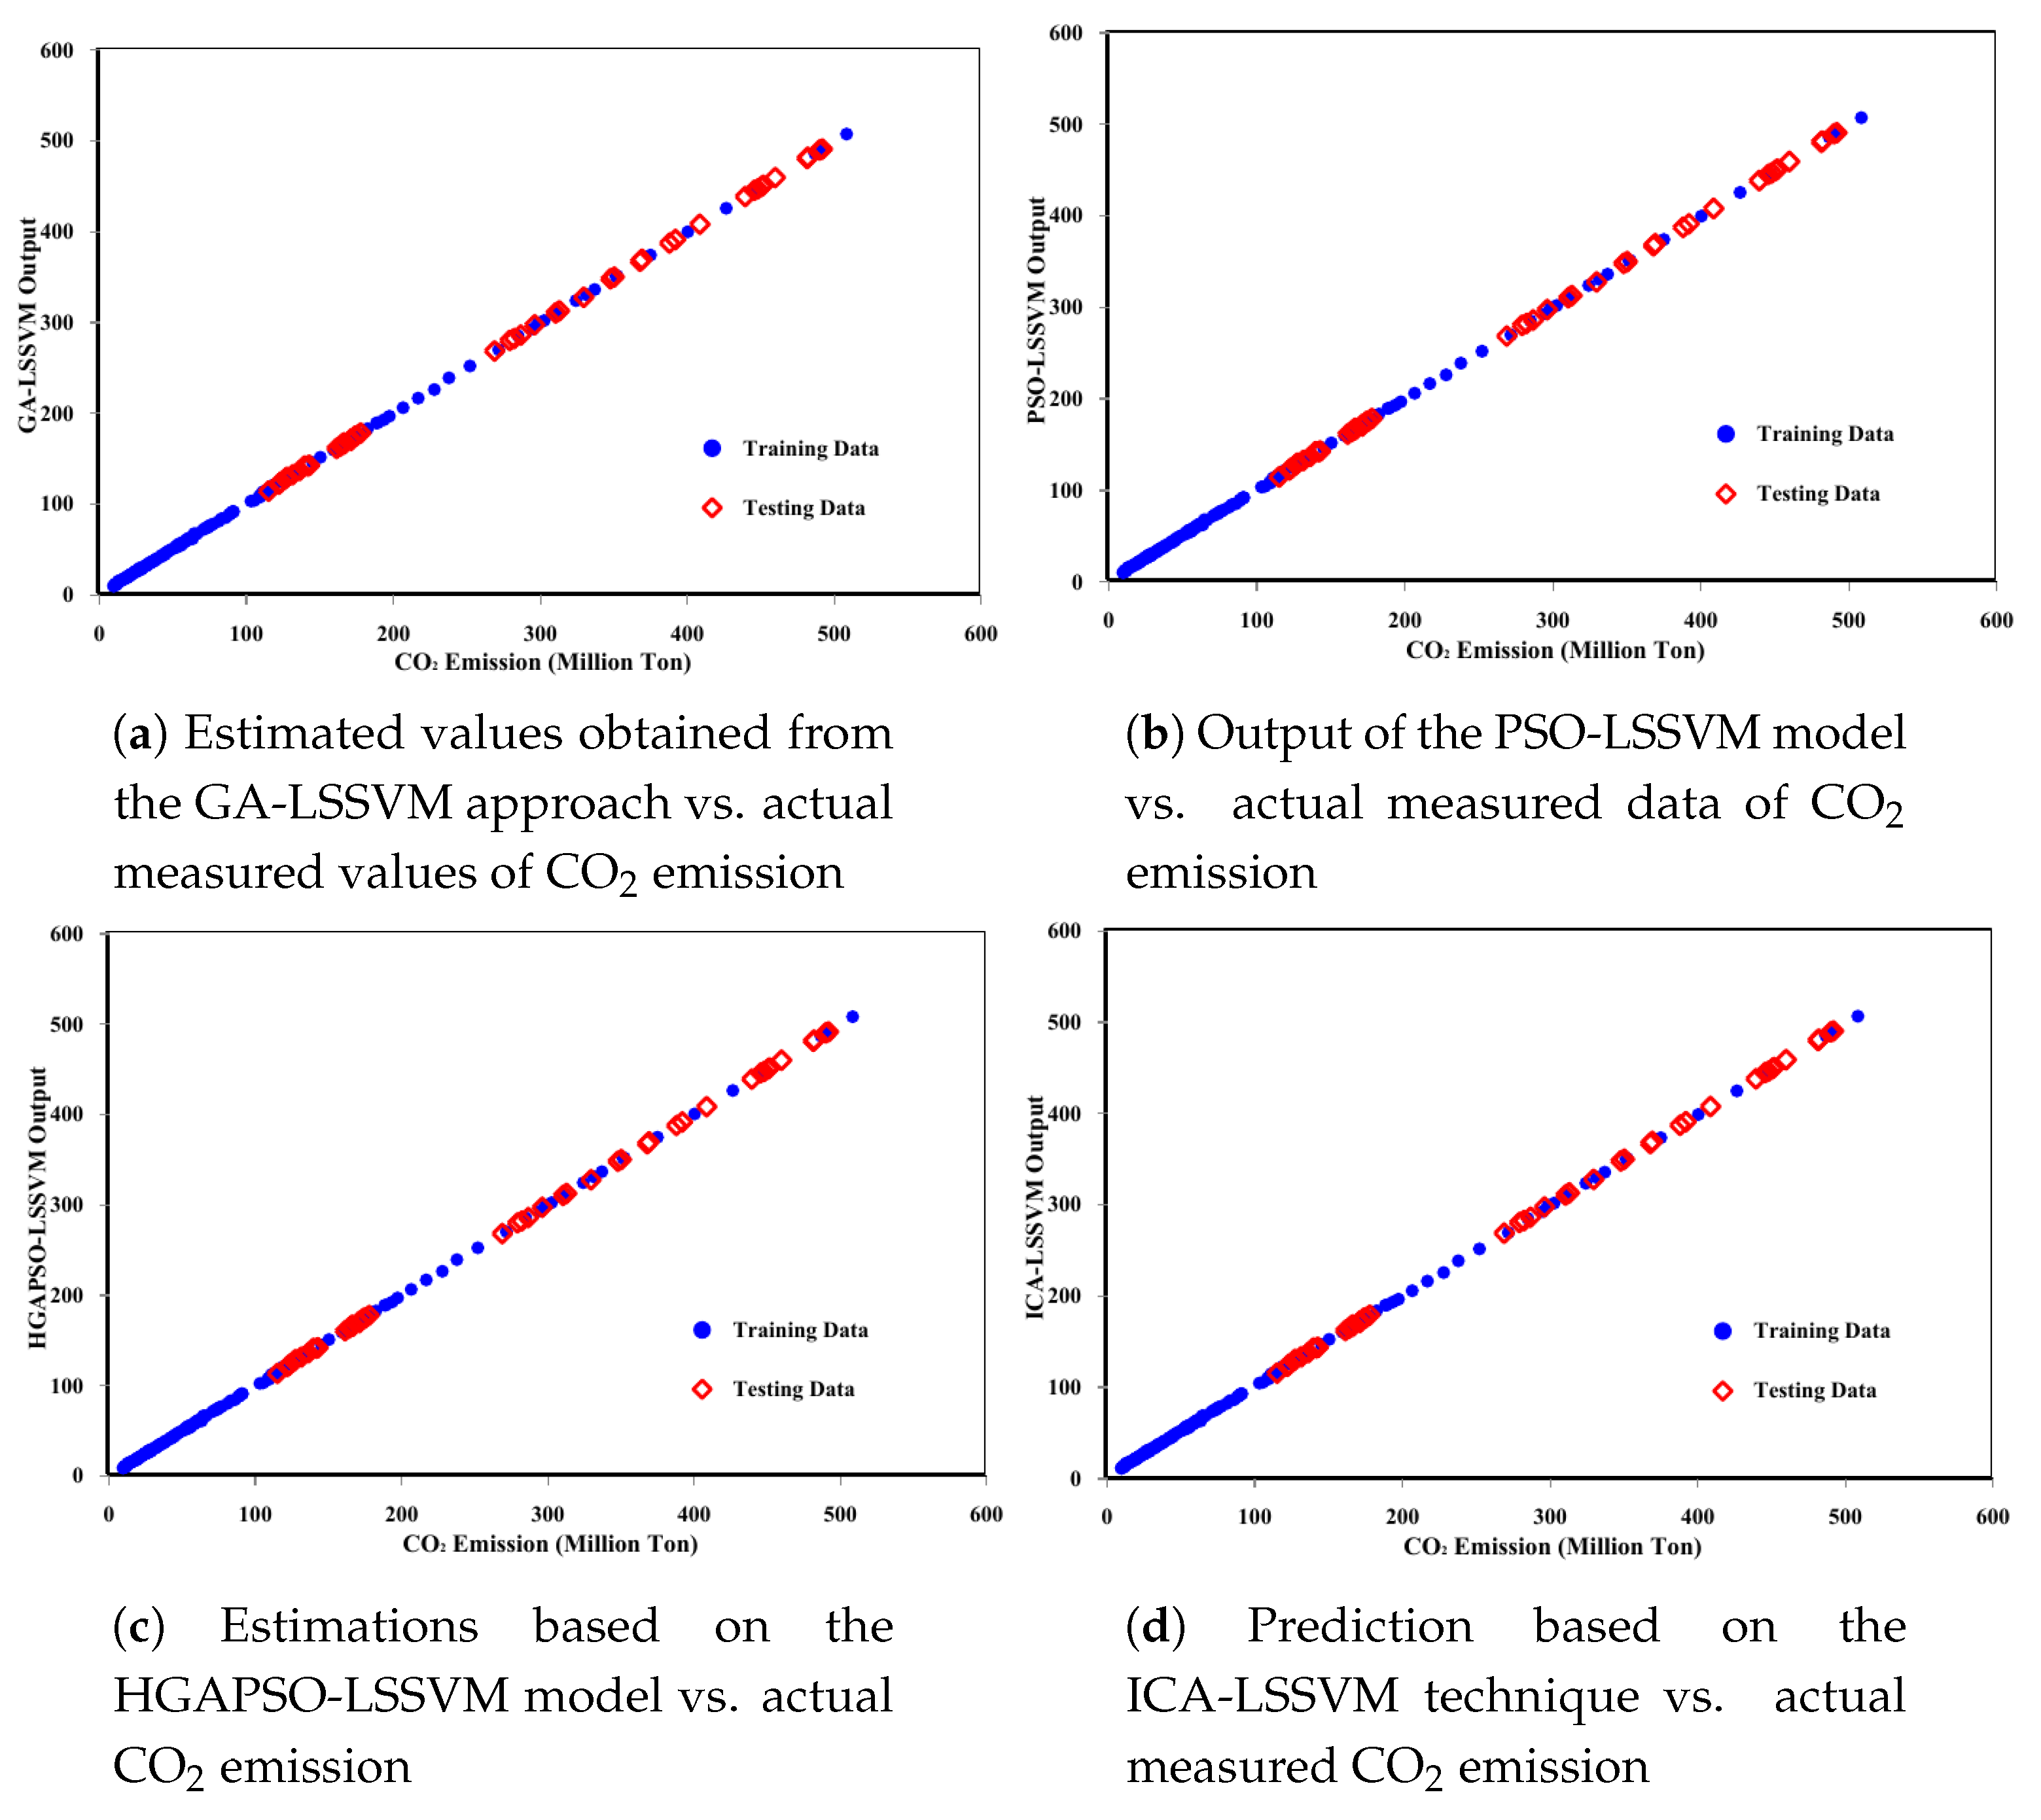
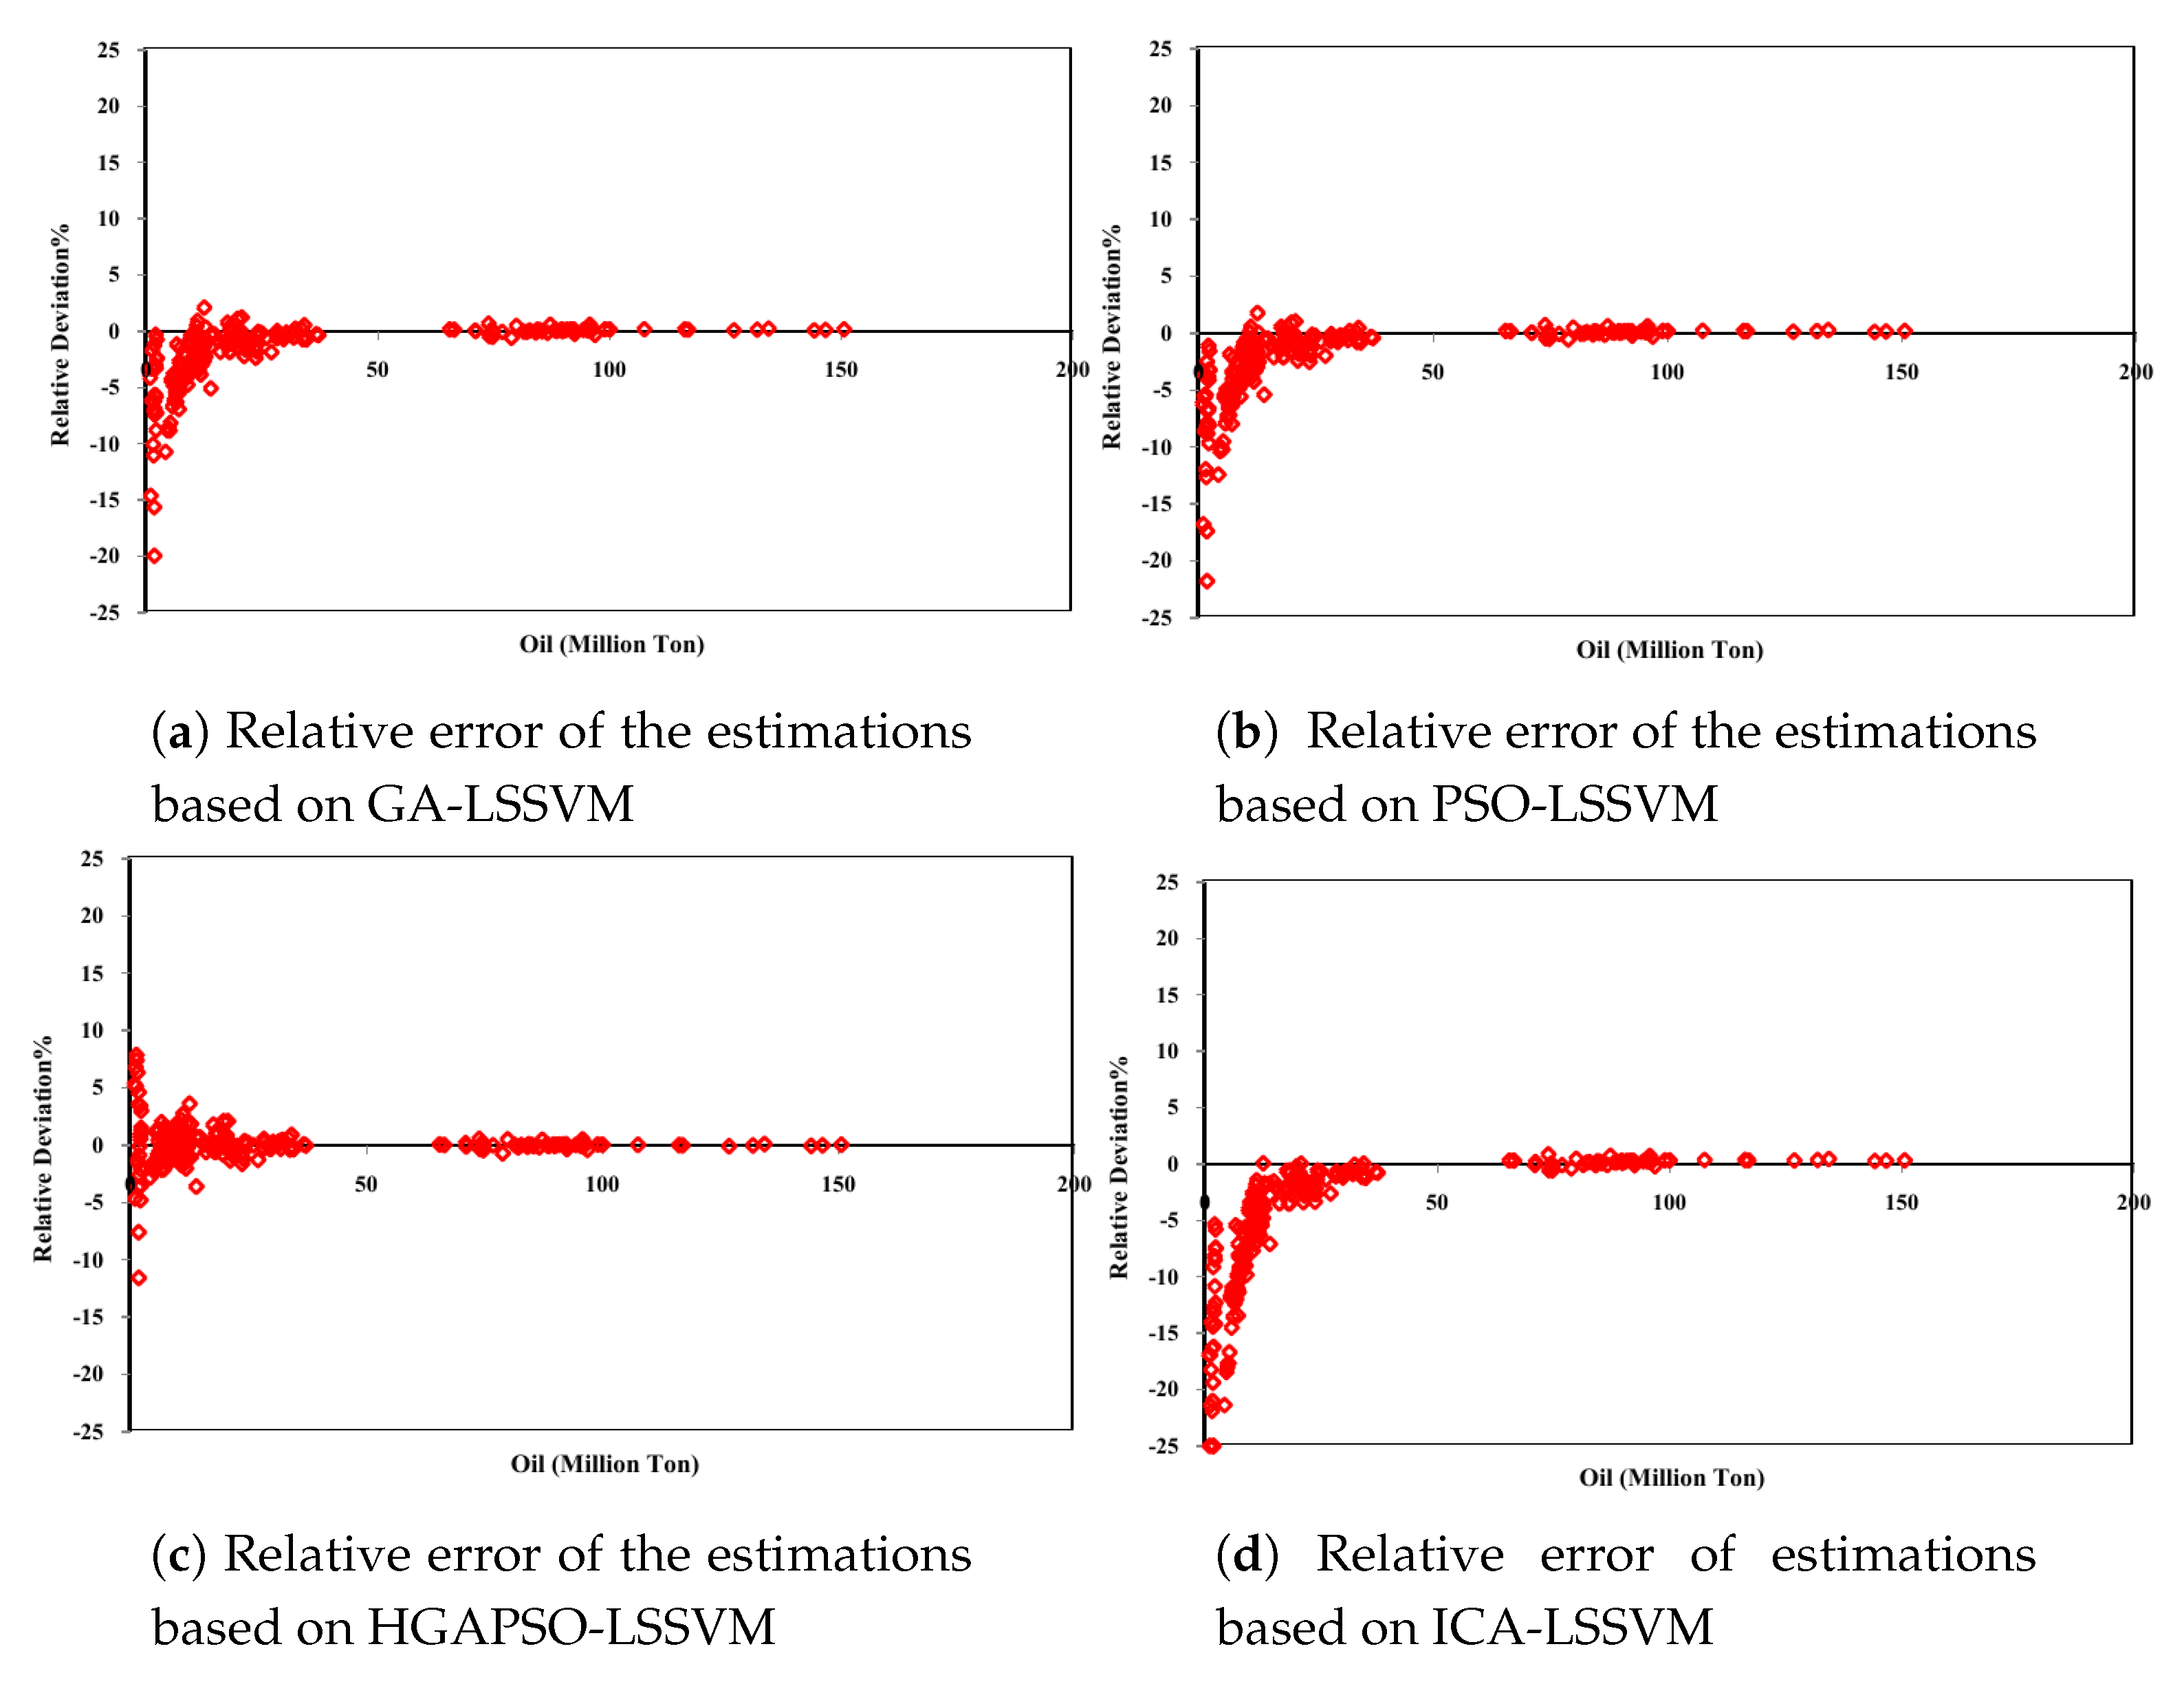
- All of the discussed optimization approaches showed agreement for forecasting the amount of carbon dioxide emission. However, HGAPSO-LSSVM demonstrated a more accurate result and showed a higher reliability and compatibility. In addition, under specific circumstances with restricted field information, the significance of these methods was highlighted more than other predicting techniques.
- The HGAPSO has the potential to be integrated with other evolutionary algorithms in order to optimize its parameters and additionally enhance its strength and accuracy.
Author Contributions
Funding
Conflicts of Interest
References
- Shirmohammadi, R.; Soltanieh, M.; Romeo, L.M. Thermoeconomic analysis and optimization of post-combustion CO2 recovery unit utilizing absorption refrigeration system for a natural-gas-fired power plant. Environ. Prog. Sustain. Energy 2018, 37, 1075–1084. [Google Scholar] [CrossRef]
- Bistline, J.E.; Rai, V. The role of carbon capture technologies in greenhouse gas emissions-reduction models: A parametric study for the US power sector. Energy Policy 2010, 38, 1177–1191. [Google Scholar] [CrossRef]
- Bowen, F. Carbon capture and storage as a corporate technology strategy challenge. Energy Policy 2011, 39, 2256–2264. [Google Scholar] [CrossRef]
- Rai, V.; Victor, D.G.; Thurber, M.C. Carbon capture and storage at scale: Lessons from the growth of analogous energy technologies. Energy Policy 2010, 38, 4089–4098. [Google Scholar] [CrossRef]
- Mathiesen, B.V.; Lund, H.; Karlsson, K. 100% Renewable energy systems, climate mitigation and economic growth. Appl. Energy 2011, 88, 488–501. [Google Scholar] [CrossRef]
- Romeo, L.M.; Calvo, E.; Valero, A.; De Vita, A. Electricity consumption and CO2 capture potential in Spain. Energy 2009, 34, 1341–1350. [Google Scholar] [CrossRef]
- Landi, D.; Consolini, A.; Germani, M.; Favi, C. Comparative life cycle assessment of electric and gas ovens in the Italian context: An environmental and technical evaluation. J. Clean. Prod. 2019, 221, 189–201. [Google Scholar] [CrossRef]
- Hdom, H.A. Examining carbon dioxide emissions, fossil & renewable electricity generation and economic growth: Evidence from a panel of South American countries. Renew. Energy 2019, 139, 186–197. [Google Scholar]
- Mardones, C.; Baeza, N. Economic and environmental effects of a CO2 tax in Latin American countries. Energy Policy 2018, 114, 262–273. [Google Scholar] [CrossRef]
- Ozturk, I. Measuring the impact of alternative and nuclear energy consumption, carbon dioxide emissions and oil rents on specific growth factors in the panel of Latin American countries. Prog. Nucl. Energy 2017, 100, 71–81. [Google Scholar] [CrossRef]
- Ruiz-Mendoza, B.J.; Sheinbaum-Pardo, C. Electricity sector reforms in four Latin-American countries and their impact on carbon dioxide emissions and renewable energy. Energy Policy 2010, 38, 6755–6766. [Google Scholar] [CrossRef]
- Jardón, A.; Kuik, O.; Tol, R.S. Economic growth and carbon dioxide emissions: An analysis of Latin America and the Caribbean. Atmósfera 2017, 30, 87–100. [Google Scholar] [CrossRef] [Green Version]
- Zaman, K.; Abd-el Moemen, M. The influence of electricity production, permanent cropland, high technology exports, and health expenditures on air pollution in Latin America and the Caribbean Countries. Renew. Sustain. Energy Rev. 2017, 76, 1004–1010. [Google Scholar] [CrossRef]
- Hanif, I. Economics-energy-environment nexus in Latin America and the Caribbean. Energy 2017, 141, 170–178. [Google Scholar] [CrossRef]
- Aslani, A.; Antila, E.; Wong, K.F.V. Comparative analysis of energy security in the Nordic countries: The role of renewable energy resources in diversification. J. Renew. Sustain. Energy 2012, 4, 062701. [Google Scholar] [CrossRef]
- Ardakani, S.R.; Hossein, S.M.; Aslani, A. Statistical Approaches to Forecasting Domestic Energy Consumption and Assessing Determinants: The Case of Nordic Countries. Strateg. Plan. Energy Environ. 2018, 38, 26–71. [Google Scholar] [CrossRef]
- Aslani, A.; Hamlehdar, M.; Saeedi, R. Robustness of Norway Economy and Energy Supply/Demand. Int. J. Green Comput. (IJGC) 2017, 8, 1–19. [Google Scholar] [CrossRef]
- Ahmadi, M.H.; Sayyaadi, H.; Dehghani, S.; Hosseinzade, H. Designing a solar powered Stirling heat engine based on multiple criteria: Maximized thermal efficiency and power. Energy Convers. Manag. 2013, 75, 282–291. [Google Scholar] [CrossRef]
- Ahmadi, M.H.; Sayyaadi, H.; Mohammadi, A.H.; Barranco-Jimenez, M.A. Thermo-economic multi-objective optimization of solar dish-Stirling engine by implementing evolutionary algorithm. Energy Convers. Manag. 2013, 73, 370–380. [Google Scholar] [CrossRef]
- Ahmadi, M.H.; Mohammadi, A.H.; Dehghani, S.; Barranco-Jimenez, M.A. Multi-objective thermodynamic-based optimization of output power of Solar Dish-Stirling engine by implementing an evolutionary algorithm. Energy Convers. Manag. 2013, 75, 438–445. [Google Scholar] [CrossRef]
- Maleki, A.; Pourfayaz, F.; Ahmadi, M.H. Design of a cost-effective wind/photovoltaic/hydrogen energy system for supplying a desalination unit by a heuristic approach. Sol. Energy 2016, 139, 666–675. [Google Scholar] [CrossRef]
- Luo, X.; Wang, J.; Dooner, M.; Clarke, J. Overview of current development in electrical energy storage technologies and the application potential in power system operation. Appl. Energy 2015, 137, 511–536. [Google Scholar] [CrossRef] [Green Version]
- Chu, S.; Cui, Y.; Liu, N. The path towards sustainable energy. Nat. Mater. 2017, 16, 16–22. [Google Scholar] [CrossRef] [PubMed]
- Wang, C.; Zhang, S.; Yan, W.; Wang, R.; Liu, J.; Wang, Y. Evaluating renewable natural resources flow and net primary productivity with a GIS-Emergy approach: A case study of Hokkaido, Japan. Sci. Rep. 2016, 6, 37552. [Google Scholar] [CrossRef] [PubMed] [Green Version]
- Jensen, T.V.; Pinson, P. RE-Europe, a large-scale dataset for modelling a highly renewable European electricity system. Sci. Data 2017, 4, 170175. [Google Scholar] [CrossRef]
- King, L.C.; Van Den Bergh, J.C. Implications of net energy-return-on-investment for a low-carbon energy transition. Nat. Energy 2018, 3, 334–340. [Google Scholar] [CrossRef]
- Carley, S.; Davies, L.L.; Spence, D.B.; Zirogiannis, N. Empirical evaluation of the stringency and design of renewable portfolio standards. Development 2018, 8, 13. [Google Scholar] [CrossRef]
- Ksentini, A.; Bensalem, A.; Azzag, E.B. Management and technical economic analysis of a hybrid system (wind/diesel) in Southern Algeria. Int. J. Energy Technol. Policy 2016, 12, 60–83. [Google Scholar] [CrossRef]
- Rau, G.H.; Willauer, H.D.; Ren, Z.J. The global potential for converting renewable electricity to negative-CO2-emissions hydrogen. Nat. Clim. Chang. 2018, 8, 621–625. [Google Scholar] [CrossRef]
- Jacobson, M.Z.; Delucchi, M.A. SuStAinABle energy. Scientific American, November 2009. [Google Scholar]
- Markard, J. The next phase of the energy transition and its implications for research and policy. Nat. Energy 2018, 3, 628–633. [Google Scholar] [CrossRef]
- Naseri, A.; Bidi, M.; Ahmadi, M.H. Thermodynamic and exergy analysis of a hydrogen and permeate water production process by a solar-driven transcritical CO2 power cycle with liquefied natural gas heat sink. Renew. Energy 2017, 113, 1215–1228. [Google Scholar] [CrossRef]
- Nazari, M.A.; Ahmadi, M.H.; Ghasempour, R.; Shafii, M.B.; Mahian, O.; Kalogirou, S.; Wongwises, S. A review on pulsating heat pipes: From solar to cryogenic applications. Appl. Energy 2018, 222, 475–484. [Google Scholar] [CrossRef]
- Zaragoza, G.; Andrés-Mañas, J.; Ruiz-Aguirre, A. Commercial scale membrane distillation for solar desalination. NPJ Clean Water 2018, 1, 20. [Google Scholar] [CrossRef]
- Chiavazzo, E.; Morciano, M.; Viglino, F.; Fasano, M.; Asinari, P. Passive solar high-yield seawater desalination by modular and low-cost distillation. Nat. Sustain. 2018, 1, 763. [Google Scholar] [CrossRef]
- Chaichan, M.T.; Kazem, H.A.; Abaas, K.I.; Al-Waeli, A.A. Homemade solar desalination system for Omani families. Int. J. Sci. Eng. Res. 2016, 7, 1499–1504. [Google Scholar]
- Chandrashekara, M.; Yadav, A. Water desalination system using solar heat: A review. Renew. Sustain. Energy Rev. 2017, 67, 1308–1330. [Google Scholar]
- Mashaly, A.F.; Alazba, A.; Al-Awaadh, A. Assessing the performance of solar desalination system to approach near-ZLD under hyper arid environment. Desalin. Water Treat. 2016, 57, 12019–12036. [Google Scholar] [CrossRef]
- Ahmadi, M.H.; Ahmadi, M.A.; Bayat, R.; Ashouri, M.; Feidt, M. Thermo-economic optimization of Stirling heat pump by using non-dominated sorting genetic algorithm. Energy Convers. Manag. 2015, 91, 315–322. [Google Scholar] [CrossRef]
- Sadatsakkak, S.A.; Ahmadi, M.H.; Bayat, R.; Pourkiaei, S.M.; Feidt, M. Optimization density power and thermal efficiency of an endoreversible Braysson cycle by using non-dominated sorting genetic algorithm. Energy Convers. Manag. 2015, 93, 31–39. [Google Scholar] [CrossRef]
- Ahmadi, M.H.; Ahmadi, M.A.; Pourfayaz, F.; Bidi, M. Thermodynamic analysis and optimization for an irreversible heat pump working on reversed Brayton cycle. Energy Convers. Manag. 2016, 110, 260–267. [Google Scholar] [CrossRef]
- Baghban, A.; Kahani, M.; Nazari, M.A.; Ahmadi, M.H.; Yan, W.M. Sensitivity analysis and application of machine learning methods to predict the heat transfer performance of CNT/water nanofluid flows through coils. Int. J. Heat Mass Transf. 2019, 128, 825–835. [Google Scholar] [CrossRef]
- Baghban, A.; Jalali, A.; Shafiee, M.; Ahmadi, M.H.; Chau, K.w. Developing an ANFIS-based swarm concept model for estimating the relative viscosity of nanofluids. Eng. Appl. Comput. Fluid Mech. 2019, 13, 26–39. [Google Scholar] [CrossRef]
- Ahmadi, M.H.; Nazari, M.A.; Ghasempour, R.; Madah, H.; Shafii, M.B.; Ahmadi, M.A. Thermal conductivity ratio prediction of Al2O3/water nanofluid by applying connectionist methods. Colloids Surf. A Physicochem. Eng. Asp. 2018, 541, 154–164. [Google Scholar] [CrossRef]
- Zheng, H.; Zhang, Y.; Liu, J.; Wei, H.; Zhao, J.; Liao, R. A novel model based on wavelet LS-SVM integrated improved PSO algorithm for forecasting of dissolved gas contents in power transformers. Electr. Power Syst. Res. 2018, 155, 196–205. [Google Scholar] [CrossRef]
- Sharma, G.; Panwar, A.; Nasiruddin, I.; Bansal, R.C. Non-linear LS-SVM with RBF-kernel-based approach for AGC of multi-area energy systems. IET Gener. Transm. Distrib. 2018, 12, 3510–3517. [Google Scholar] [CrossRef]
- Aydogdu, M.; Firat, M. Estimation of failure rate in water distribution network using fuzzy clustering and LS-SVM methods. Water Resour. Manag. 2015, 29, 1575–1590. [Google Scholar] [CrossRef]
- Mojumder, J.C.; Ong, H.C.; Chong, W.T.; Shamshirband, S. Application of support vector machine for prediction of electrical and thermal performance in PV/T system. Energy Build. 2016, 111, 267–277. [Google Scholar] [CrossRef]
- Malvoni, M.; De Giorgi, M.G.; Congedo, P.M. Data on Support Vector Machines (SVM) model to forecast photovoltaic power. Data Brief 2016, 9, 13–16. [Google Scholar] [CrossRef] [Green Version]
- Zhang, Y.; Wang, P.; Ni, T.; Cheng, P.; Lei, S. Wind power prediction based on LS-SVM model with error correction. Adv. Electr. Comput. Eng. 2017, 17, 3–9. [Google Scholar] [CrossRef]
- Arabloo, M.; Bahadori, A.; Ghiasi, M.M.; Lee, M.; Abbas, A.; Zendehboudi, S. A novel modelling approach to optimize oxygen–steam ratios in coal gasification process. Fuel 2015, 153, 1–5. [Google Scholar] [CrossRef]
- Ahmadi, M.A.; Bahadori, A.; Shadizadeh, S.R. A rigorous model to predict the amount of dissolved calcium carbonate concentration throughout oil field brines: Side effect of pressure and temperature. Fuel 2015, 139, 154–159. [Google Scholar] [CrossRef]
- Ahmadi, M.A. Connectionist approach estimates gas–oil relative permeability in petroleum reservoirs: Application to reservoir simulation. Fuel 2015, 140, 429–439. [Google Scholar] [CrossRef]
- Suykens, J.A. Least Squares Support Vector Machines; World Scientific: Singapore, 2002. [Google Scholar]
- Ahmadi, M.A.; Mahmoudi, B. Development of robust model to estimate gas–oil interfacial tension using least square support vector machine: Experimental and modelling study. J. Supercrit. Fluids 2016, 107, 122–128. [Google Scholar] [CrossRef]
- Van Gestel, T.; Suykens, J.A.; Baesens, B.; Viaene, S.; Vanthienen, J.; Dedene, G.; De Moor, B.; Vandewalle, J. Benchmarking least squares support vector machine classifiers. Mach. Learn. 2004, 54, 5–32. [Google Scholar] [CrossRef]
- Ahmadi, M.A.; Ebadi, M. Evolving smart approach for determination dew point pressure through condensate gas reservoirs. Fuel 2014, 117, 1074–1084. [Google Scholar] [CrossRef]
- Cortes, C.; Vapnik, V. Support-vector networks. Mach. Learn. 1995, 20, 273–297. [Google Scholar] [CrossRef] [Green Version]
- Pelckmans, K.; Suykens, J.A.; Van Gestel, T.; De Brabanter, J.; Lukas, L.; Hamers, B.; De Moor, B.; Vandewalle, J. LS-SVMlab: A Matlab/c Toolbox for Least Squares Support Vector Machines; Tutorial; KULeuven-ESAT: Leuven, Belgiumm, 2002; Volume 142, pp. 1–2. [Google Scholar]
- Suykens, J.A.; Vandewalle, J. Least squares support vector machine classifiers. Neural Process. Lett. 1999, 9, 293–300. [Google Scholar] [CrossRef]
- Ahmadi, M.H.; Ahmadi, M.A.; Ashouri, M.; Astaraei, F.R.; Ghasempour, R.; Aloui, F. Prediction of performance of Stirling engine using least squares support machine technique. Mech. Ind. 2016, 17. [Google Scholar] [CrossRef]
- Ahmadi, M.A.; Ebadi, M.; Marghmaleki, P.S.; Fouladi, M.M. Evolving predictive model to determine condensate-to-gas ratio in retrograded condensate gas reservoirs. Fuel 2014, 124, 241–257. [Google Scholar] [CrossRef]
- Fazeli, H.; Soleimani, R.; Ahmadi, M.A.; Badrnezhad, R.; Mohammadi, A.H. Experimental study and modelling of ultrafiltration of refinery effluents using a hybrid intelligent approach. Energy Fuels 2013, 27, 3523–3537. [Google Scholar] [CrossRef]
- Curilem, M.; Acuña, G.; Cubillos, F.; Vyhmeister, E. Neural networks and support vector machine models applied to energy consumption optimization in semiautogeneous grinding. Chem. Eng. Trans. 2011, 25, 761–766. [Google Scholar]
- Kahani, M.; Ahmadi, M.H.; Tatar, A.; Sadeghzadeh, M. Development of multilayer perceptron artificial neural network (MLP-ANN) and least square support vector machine (LSSVM) models to predict Nusselt number and pressure drop of TiO2/water nanofluid flows through non-straight pathways. Numer. Heat Transf. Part A Appl. 2018, 74, 1190–1206. [Google Scholar] [CrossRef]
- Ahmadi, M.H.; Tatar, A.; Seifaddini, P.; Ghazvini, M.; Ghasempour, R.; Sheremet, M.A. Thermal conductivity and dynamic viscosity modelling of Fe2O3/water nanofluid by applying various connectionist approaches. Numer. Heat Transf. Part A Appl. 2018, 74, 1301–1322. [Google Scholar] [CrossRef]
- Ahmadi, M.H.; Ahmadi, M.A.; Sadatsakkak, S.A.; Feidt, M. Connectionist intelligent model estimates output power and torque of stirling engine. Renew. Sustain. Energy Rev. 2015, 50, 871–883. [Google Scholar] [CrossRef]
- Jefferys, E. Design applications of genetic algorithms. In SPE Annual Technical Conference and Exhibition; Society of Petroleum Engineers: Houston, TX, USA, 1993. [Google Scholar]
- Romero, C.; Carter, J. Using genetic algorithms for reservoir characterisation. J. Pet. Sci. Eng. 2001, 31, 113–123. [Google Scholar] [CrossRef]
- Ahmadi, M.A. Toward reliable model for prediction Drilling Fluid Density at wellbore conditions: A LSSVM model. Neurocomputing 2016, 211, 143–149. [Google Scholar] [CrossRef]
- Ahmadi, M.A.; Ebadi, M.; Samadi, A.; Siuki, M.Z. Phase equilibrium modelling of clathrate hydrates of carbon dioxide+ 1,4-dioxine using intelligent approaches. J.Dispers. Sci. Technol. 2015, 36, 236–244. [Google Scholar] [CrossRef]
- Ahmadi, M.A.; Ebadi, M.; Hosseini, S.M. Prediction breakthrough time of water coning in the fractured reservoirs by implementing low parameter support vector machine approach. Fuel 2014, 117, 579–589. [Google Scholar] [CrossRef]
- Ali Ahmadi, M.; Ahmadi, A. Applying a sophisticated approach to predict CO2 solubility in brines: Application to CO2 sequestration. Int. J. Low-Carbon Technol. 2016, 11, 325–332. [Google Scholar] [CrossRef]
- Ahmadi, M.A.; Shadizadeh, S.R. New approach for prediction of asphaltene precipitation due to natural depletion by using evolutionary algorithm concept. Fuel 2012, 102, 716–723. [Google Scholar] [CrossRef]
- Shafiei, A.; Ahmadi, M.A.; Zaheri, S.H.; Baghban, A.; Amirfakhrian, A.; Soleimani, R. Estimating hydrogen sulfide solubility in ionic liquids using a machine learning approach. J. Supercrit. Fluids 2014, 95, 525–534. [Google Scholar] [CrossRef]
- Ahmadi, M.A.; Soleimani, R.; Bahadori, A. A computational intelligence scheme for prediction equilibrium water dew point of natural gas in TEG dehydration systems. Fuel 2014, 137, 145–154. [Google Scholar] [CrossRef]
- Ahmadi, M.A.; Golshadi, M. Neural network based swarm concept for prediction asphaltene precipitation due to natural depletion. J. Pet. Sci. Eng. 2012, 98, 40–49. [Google Scholar] [CrossRef]
- Ahmadi, M.A.; Chen, Z. Analysis of gas production data via an intelligent model: Application to natural gas production. First Break 2018, 36, 91–98. [Google Scholar]
- Ahmadi, M.A. Prediction of asphaltene precipitation using artificial neural network optimized by imperialist competitive algorithm. J. Pet. Explor. Prod. Technol. 2011, 1, 99–106. [Google Scholar] [CrossRef] [Green Version]
- Ahmadi, M.A.; Masoumi, M.; Askarinezhad, R. Evolving connectionist model to monitor the efficiency of an in situ combustion process: Application to heavy oil recovery. Energy Technol. 2014, 2, 811–818. [Google Scholar] [CrossRef]
- Huang, Y.; Huang, G.; Dong, M.; Feng, G. Development of an artificial neural network model for predicting minimum miscibility pressure in CO2 flooding. J. Pet. Sci. Eng. 2003, 37, 83–95. [Google Scholar] [CrossRef]
- Emera, M.K.; Sarma, H.K. Use of genetic algorithm to estimate CO2–oil minimum miscibility pressure—A key parameter in design of CO2 miscible flood. J. Pet. Sci. Eng. 2005, 46, 37–52. [Google Scholar] [CrossRef]
- Avaullee, L.; Trassy, L.; Neau, E.; Jaubert, J.N. Thermodynamic modelling for petroleum fluids I. Equation of state and group contribution for the estimation of thermodynamic parameters of heavy hydrocarbons. Fluid Phase Equilib. 1997, 139, 155–170. [Google Scholar] [CrossRef]
- Madvar, M.D.; Khosropour, H.; Khosravanian, A.; Mirafshar, M.; Azaribeni, A.; Rezapour, M.; Nouri, B. Patent-Based Technology Life Cycle Analysis: The Case of the Petroleum Industry. Popcant 2016, 10, 72–79. [Google Scholar] [CrossRef]
- Madavar, M.D.; Nezhad, M.G.; Aslani, A.; Naaranoja, M. Analysis of generations of wind power technologies based on technology life cycle approach. Distrib. Gener. Altern. Energy J. 2017, 32, 52–79. [Google Scholar] [CrossRef]
- Hong, S. The Magic of Patent Information. Available online: https://www.wipo.int/sme/en/documents/patent_information_fulltext.html (accessed on 11 May 2019).
- Octaviano, C.; Paltsev, S.; Gurgel, A.C. Climate change policy in Brazil and Mexico: Results from the MIT EPPA model. Energy Econ. 2016, 56, 600–614. [Google Scholar] [CrossRef] [Green Version]
- Knoema. Peru—CO2 Emissions per Capita. 2017. Available online: https://knoema.com/atlas/Peru/CO2-emissions-per-capita (accessed on 17 March 2019).
- WorldBank. Moving towards a Sustainable Low-Carbon Economy in Uruguay 2016. Available online: http://www.worldbank.org/en/results/2016/10/13/moving-towards-a-sustainable-low-carbon-economy-in-uruguay (accessed on 17 March 2019).
- Knoema. Chile—CO2 Emissions per Capita. 2017. Available online: http://www.knoema.com/atlas/Chile/CO$_2$-emissions-per-capita (accessed on 17 March 2019).
- UNFCC. ORIENTAL REPUBLIC OF URUGUAY First Nationally Determined Contribution to the Paris Agreement. 2017. Available online: https://www4.unfccc.int/sites/ndcstaging/Pages/Home.aspx (accessed on 17 March 2019).
- BrazilGovNews. Brazil Will Reduce Greenhouse Gas Emissions in 10% by 2028 2018. 2017. Available online: http://www.brazilgovnews.gov.br/news/2018/06/brazil-will-reduce-greenhouse-gas-emissionsin-10-by-2028 (accessed on 17 March 2019).
- Santos, L.; Garaffa, R.; Lucena, A.; Szklo, A. Impacts of Carbon Pricing on Brazilian Industry: Domestic Vulnerability and International Trade Exposure. Sustainability 2018, 10, 2390. [Google Scholar] [CrossRef]
- Rojas-Cardenas, J.C.; Hasanbeigi, A.; Sheinbaum-Pardo, C.; Price, L. Energy efficiency in the Mexican iron and steel industry from an international perspective. J. Clean. Prod. 2017, 158, 335–348. [Google Scholar] [CrossRef]
- Hübner, C. Climate Report 2017: Argentina; Technical Report; Konrad Adenauer Stiftung. Available online: https://www.kas.de/single-title/-/content/klimareport-2017-argentinien (accessed on 11 May 2019).
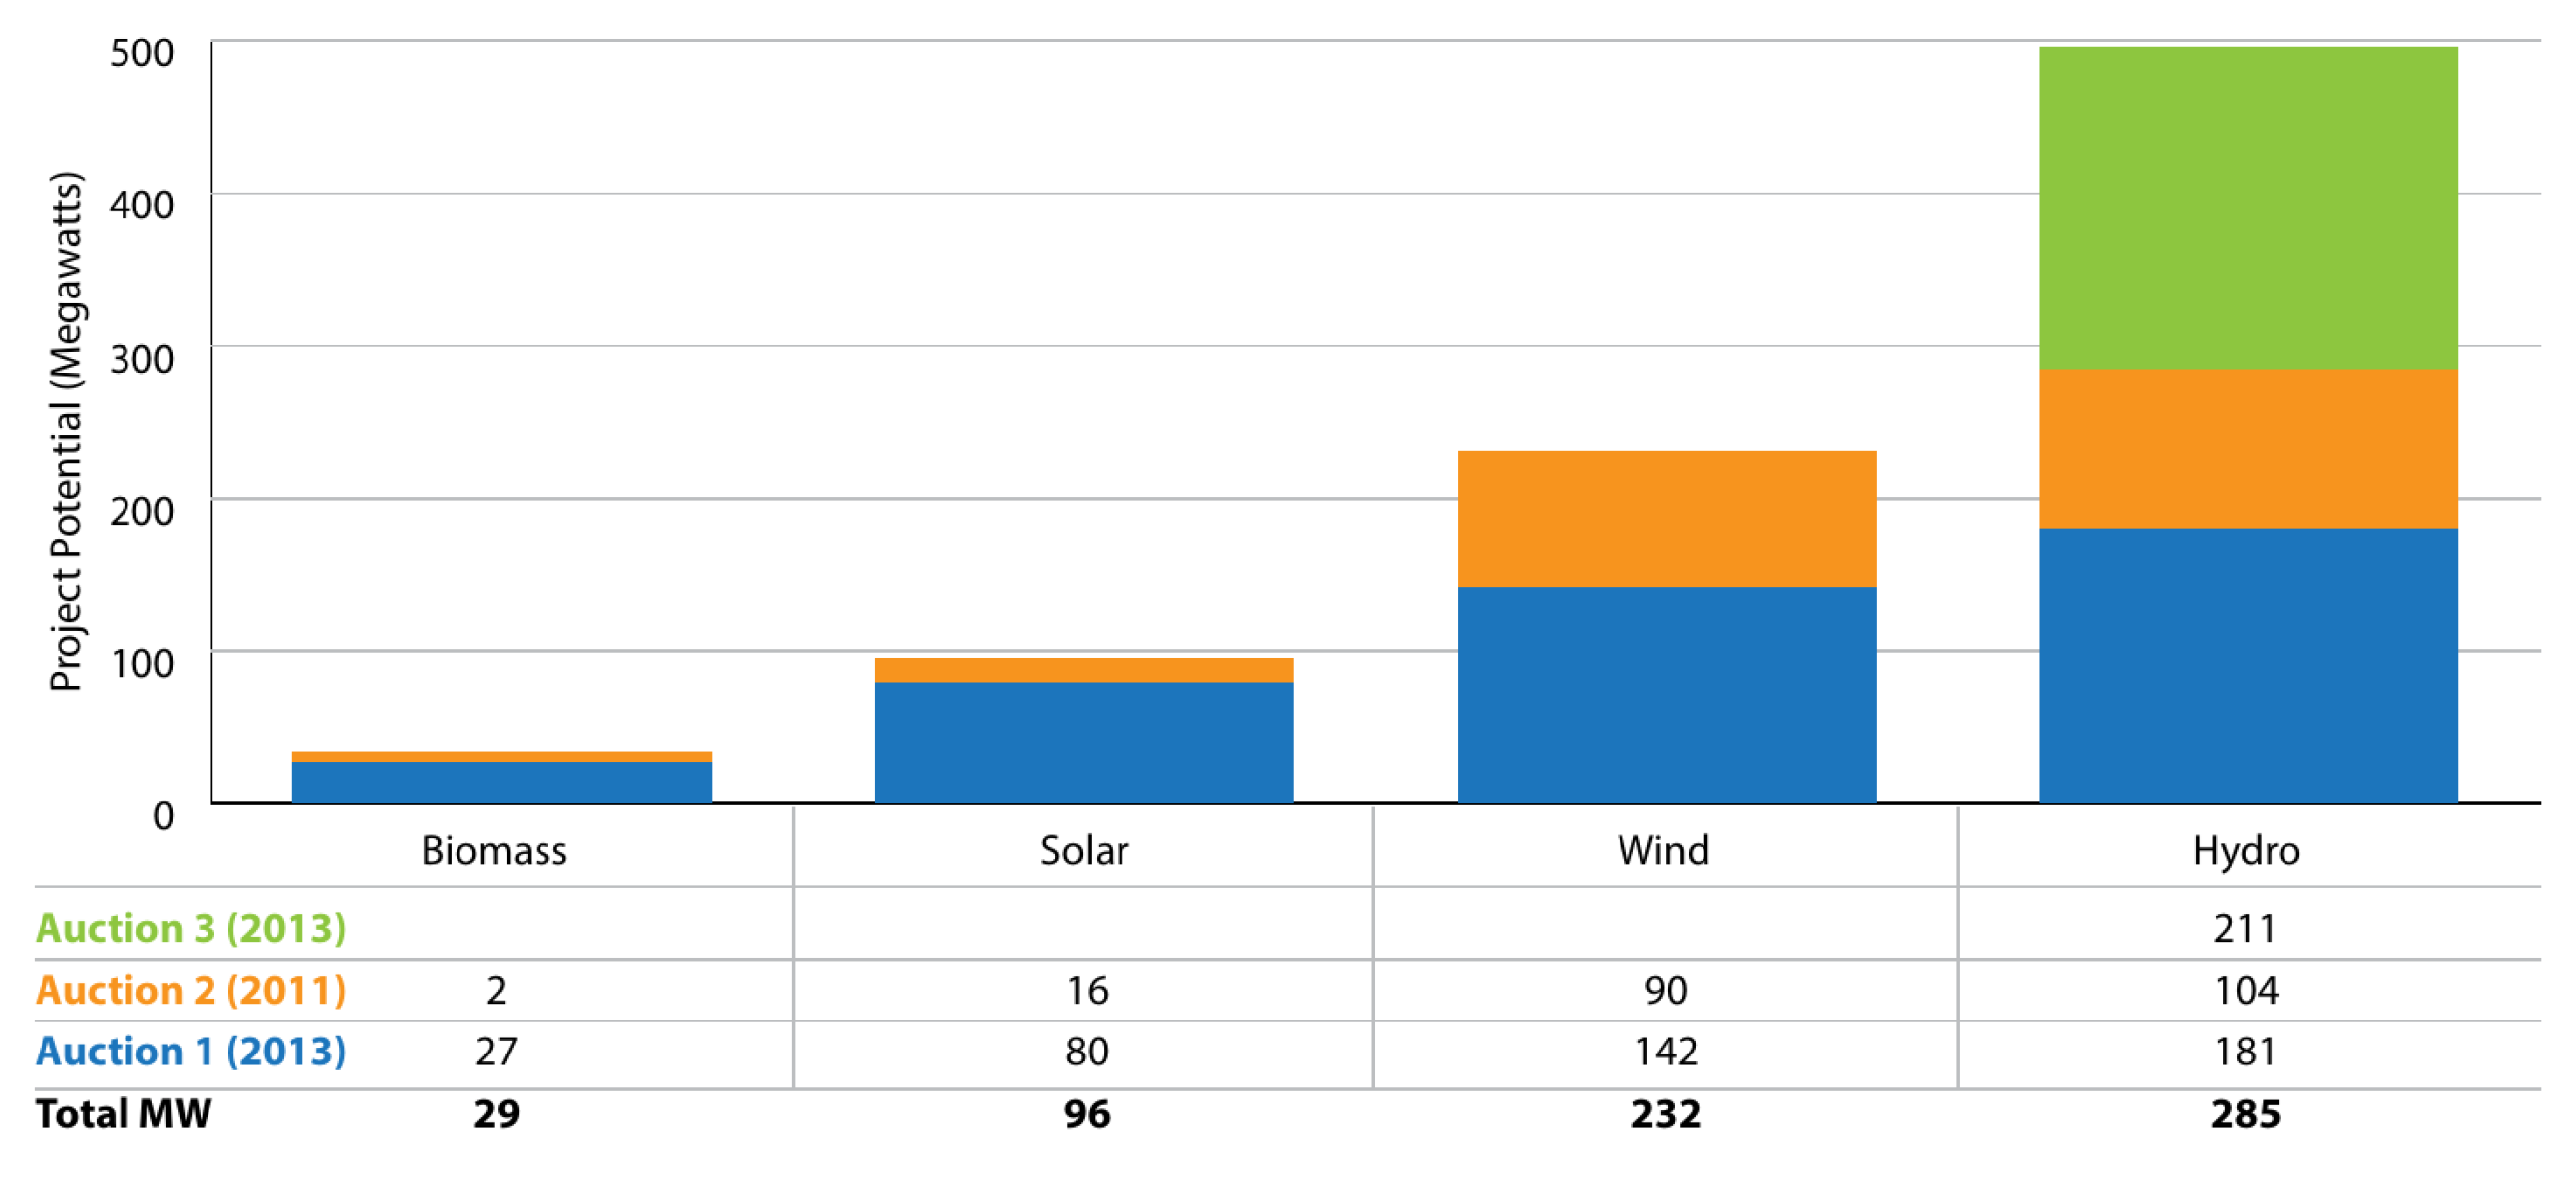
- IEA. Argentina Renewable Energy Auctions; Technical Report, RenovAr Program (Round 1). Available online: https://www.iea.org/policiesandmeasures/pams/argentina/name-158884-en.php (accessed on 11 May 2019).
- Fernandez, V. Copper mining in Chile and its regional employment linkages. Resour. Policy 2018. [Google Scholar] [CrossRef]
- Maxwell, A.; Herrera, C. Acting Now on Climate: How is Peru Addressing Climate Change and Moving toward a Low-Carbon Future? NRDC Issue Brief. Available online: https://www.nrdc.org/resources/acting-now-climate-how-peru-addressing-climate-change-and-moving-toward-low-carbon-future (accessed on 11 May 2019).


| Section | Class | Subclass | Definition |
|---|---|---|---|
| Y02A | Technologies for adaptation to climate change | ||
| Y02B | Indexing scheme related to buildings | ||
| Y02C | Capture, storage, sequestration or disposal of greenhouse gases | ||
| Y | Y02 | Y02D | Information and communication technologies |
| Y02E | Reduction of GHG emission related to energy generation and distribution | ||
| Y02P | Production or processing of goods | ||
| Y02T | Transportation | ||
| Y02W | Wastewater treatment or waste management |
| Genetic Algorithm (GA) | 5.32 | 51,088.13 |
| Particle Swarm Optimization (PSO) | 5.3178 | 51,037.11 |
| Imperialist Competitive Algorithm (ICA) | 5.3069 | 50,099.84 |
| Hybrid GAPSO (HGAPSO) | 5.3296 | 52,039.38 |
© 2019 by the authors. Licensee MDPI, Basel, Switzerland. This article is an open access article distributed under the terms and conditions of the Creative Commons Attribution (CC BY) license (http://creativecommons.org/licenses/by/4.0/).
Share and Cite
Ahmadi, M.H.; Dehghani Madvar, M.; Sadeghzadeh, M.; Rezaei, M.H.; Herrera, M.; Shamshirband, S. Current Status Investigation and Predicting Carbon Dioxide Emission in Latin American Countries by Connectionist Models. Energies 2019, 12, 1916. https://doi.org/10.3390/en12101916
Ahmadi MH, Dehghani Madvar M, Sadeghzadeh M, Rezaei MH, Herrera M, Shamshirband S. Current Status Investigation and Predicting Carbon Dioxide Emission in Latin American Countries by Connectionist Models. Energies. 2019; 12(10):1916. https://doi.org/10.3390/en12101916
Chicago/Turabian StyleAhmadi, Mohammad Hossein, Mohammad Dehghani Madvar, Milad Sadeghzadeh, Mohammad Hossein Rezaei, Manuel Herrera, and Shahaboddin Shamshirband. 2019. "Current Status Investigation and Predicting Carbon Dioxide Emission in Latin American Countries by Connectionist Models" Energies 12, no. 10: 1916. https://doi.org/10.3390/en12101916