Article

Theoretical and Empirical Differences between Diagonal and Full BEKK for Risk Management

by
David E. Allen
1,2,3 and
Michael McAleer
4,5,6,7,8,9,*
1
School of Mathematics and Statistics, University of Sydney, Sydney 2006, NSW, Australia
2
Department of Finance, Asia University, Wufeng 413, Taiwan
3
School of Business and Law, Edith Cowan University, Joondalup 6027, Australia
4
Department of Finance, College of Management, Asia University, Taichung 413, Taiwan
5
Discipline of Business Analytics, Business School, University of Sydney, Sydney 2006, NSW, Australia
6
Econometric Institute Erasmus School of Economics, Erasmus University Rotterdam, 3000 Rotterdam, The Netherlands
7
Department of Economic Analysis and ICAE Complutense, University of Madrid, 28040 Madrid, Spain
8
Department of Mathematics and Statistics, University of Canterbury, Christchurch 8041, New Zealand
9
Institute of Advanced Sciences, Yokohama National University, Yokohama 240-8501, Japan
*
Author to whom correspondence should be addressed.
Energies 2018, 11(7), 1627; https://doi.org/10.3390/en11071627
Submission received: 1 March 2018 / Revised: 26 May 2018 / Accepted: 31 May 2018 / Published: 22 June 2018
(This article belongs to the Special Issue Multivariate Modelling of Fossil Fuel and Carbon Emission Prices)

Abstract

:
The purpose of the paper is to explore the relative biases in the estimation of the Full BEKK model as compared with the Diagonal BEKK model, which is used as a theoretical and empirical benchmark. Chang and McAleer et al., 2017 show that univariate GARCH is not a special case of multivariate GARCH, specifically, the Full BEKK model, and demonstrate that Full BEKK, which, in practice, is estimated almost exclusively, has no underlying stochastic process, regularity conditions, or asymptotic properties. Diagonal BEKK (DBEKK) does not suffer from these limitations, and hence provides a suitable benchmark. We use simulated financial returns series to contrast estimates of the conditional variances and covariances from DBEKK and BEKK. The results of non-parametric tests suggest evidence of considerable bias in the Full BEKK estimates. The results of quantile regression analysis show there is a systematic relationship between the two sets of estimates as we move across the quantiles. Estimates of conditional variances from Full BEKK, relative to those from DBEKK are relatively lower in the left tail and higher in the right tail. The BEKK model is a commonly applied multivariate volatility model frequently used in modelling and forecasting volatilities in financial applications. Our results suggest that it is subject to considerable bias and this should be considered by potential users.
JEL Classification:
C13; C21; C58

1. Introduction

Conditional volatility models are the most widely estimated univariate and multivariate models of time-varying volatility (or dynamic risk) applied to financial data, in the high frequency data domains that are measured in days, hours and minutes. The stochastic processes, regularity conditions and asymptotic properties of these popular univariate conditional volatility models, such as GARCH (see Engle [1] and Bollerslev [2]) and GJR (see Glosten and Runkle [3]), are well established in the literature. Nevertheless, McAleer and Hafner [4] raised caveats about the existence of the stochastic process and statistical properties underlying exponential GARCH (EGARCH) (see [5,6]).
The situation with respect to multivariate conditional volatility models is considerably different. For example, the Full BEKK model, (see Baba and [7], and Engle and Kroner [8]) is subject to uncertainty regarding the existence of its underlying stochastic processes, regularity conditions, and asymptotic properties. These properties have either not yet been established, or are simply assumed rather than derived, yet these conditions and properties are essential for the existence of the likelihood function, and hence valid statistical analysis of the empirical estimates. This means that when the model is estimated its coefficients and statistical properties are subject to uncertainty and may not be valid. These limitations do not apply to the DBEKK model, which is used as a benchmark in this study.
The focus of this paper is to explore the potential and empirical biases that may exist in the typical estimation of the multivariate Full BEKK model, as referenced in the Rats statistical software (Estima 1560 Sherman Ave, Suite 1029 Evanston, IL 60201, USA).
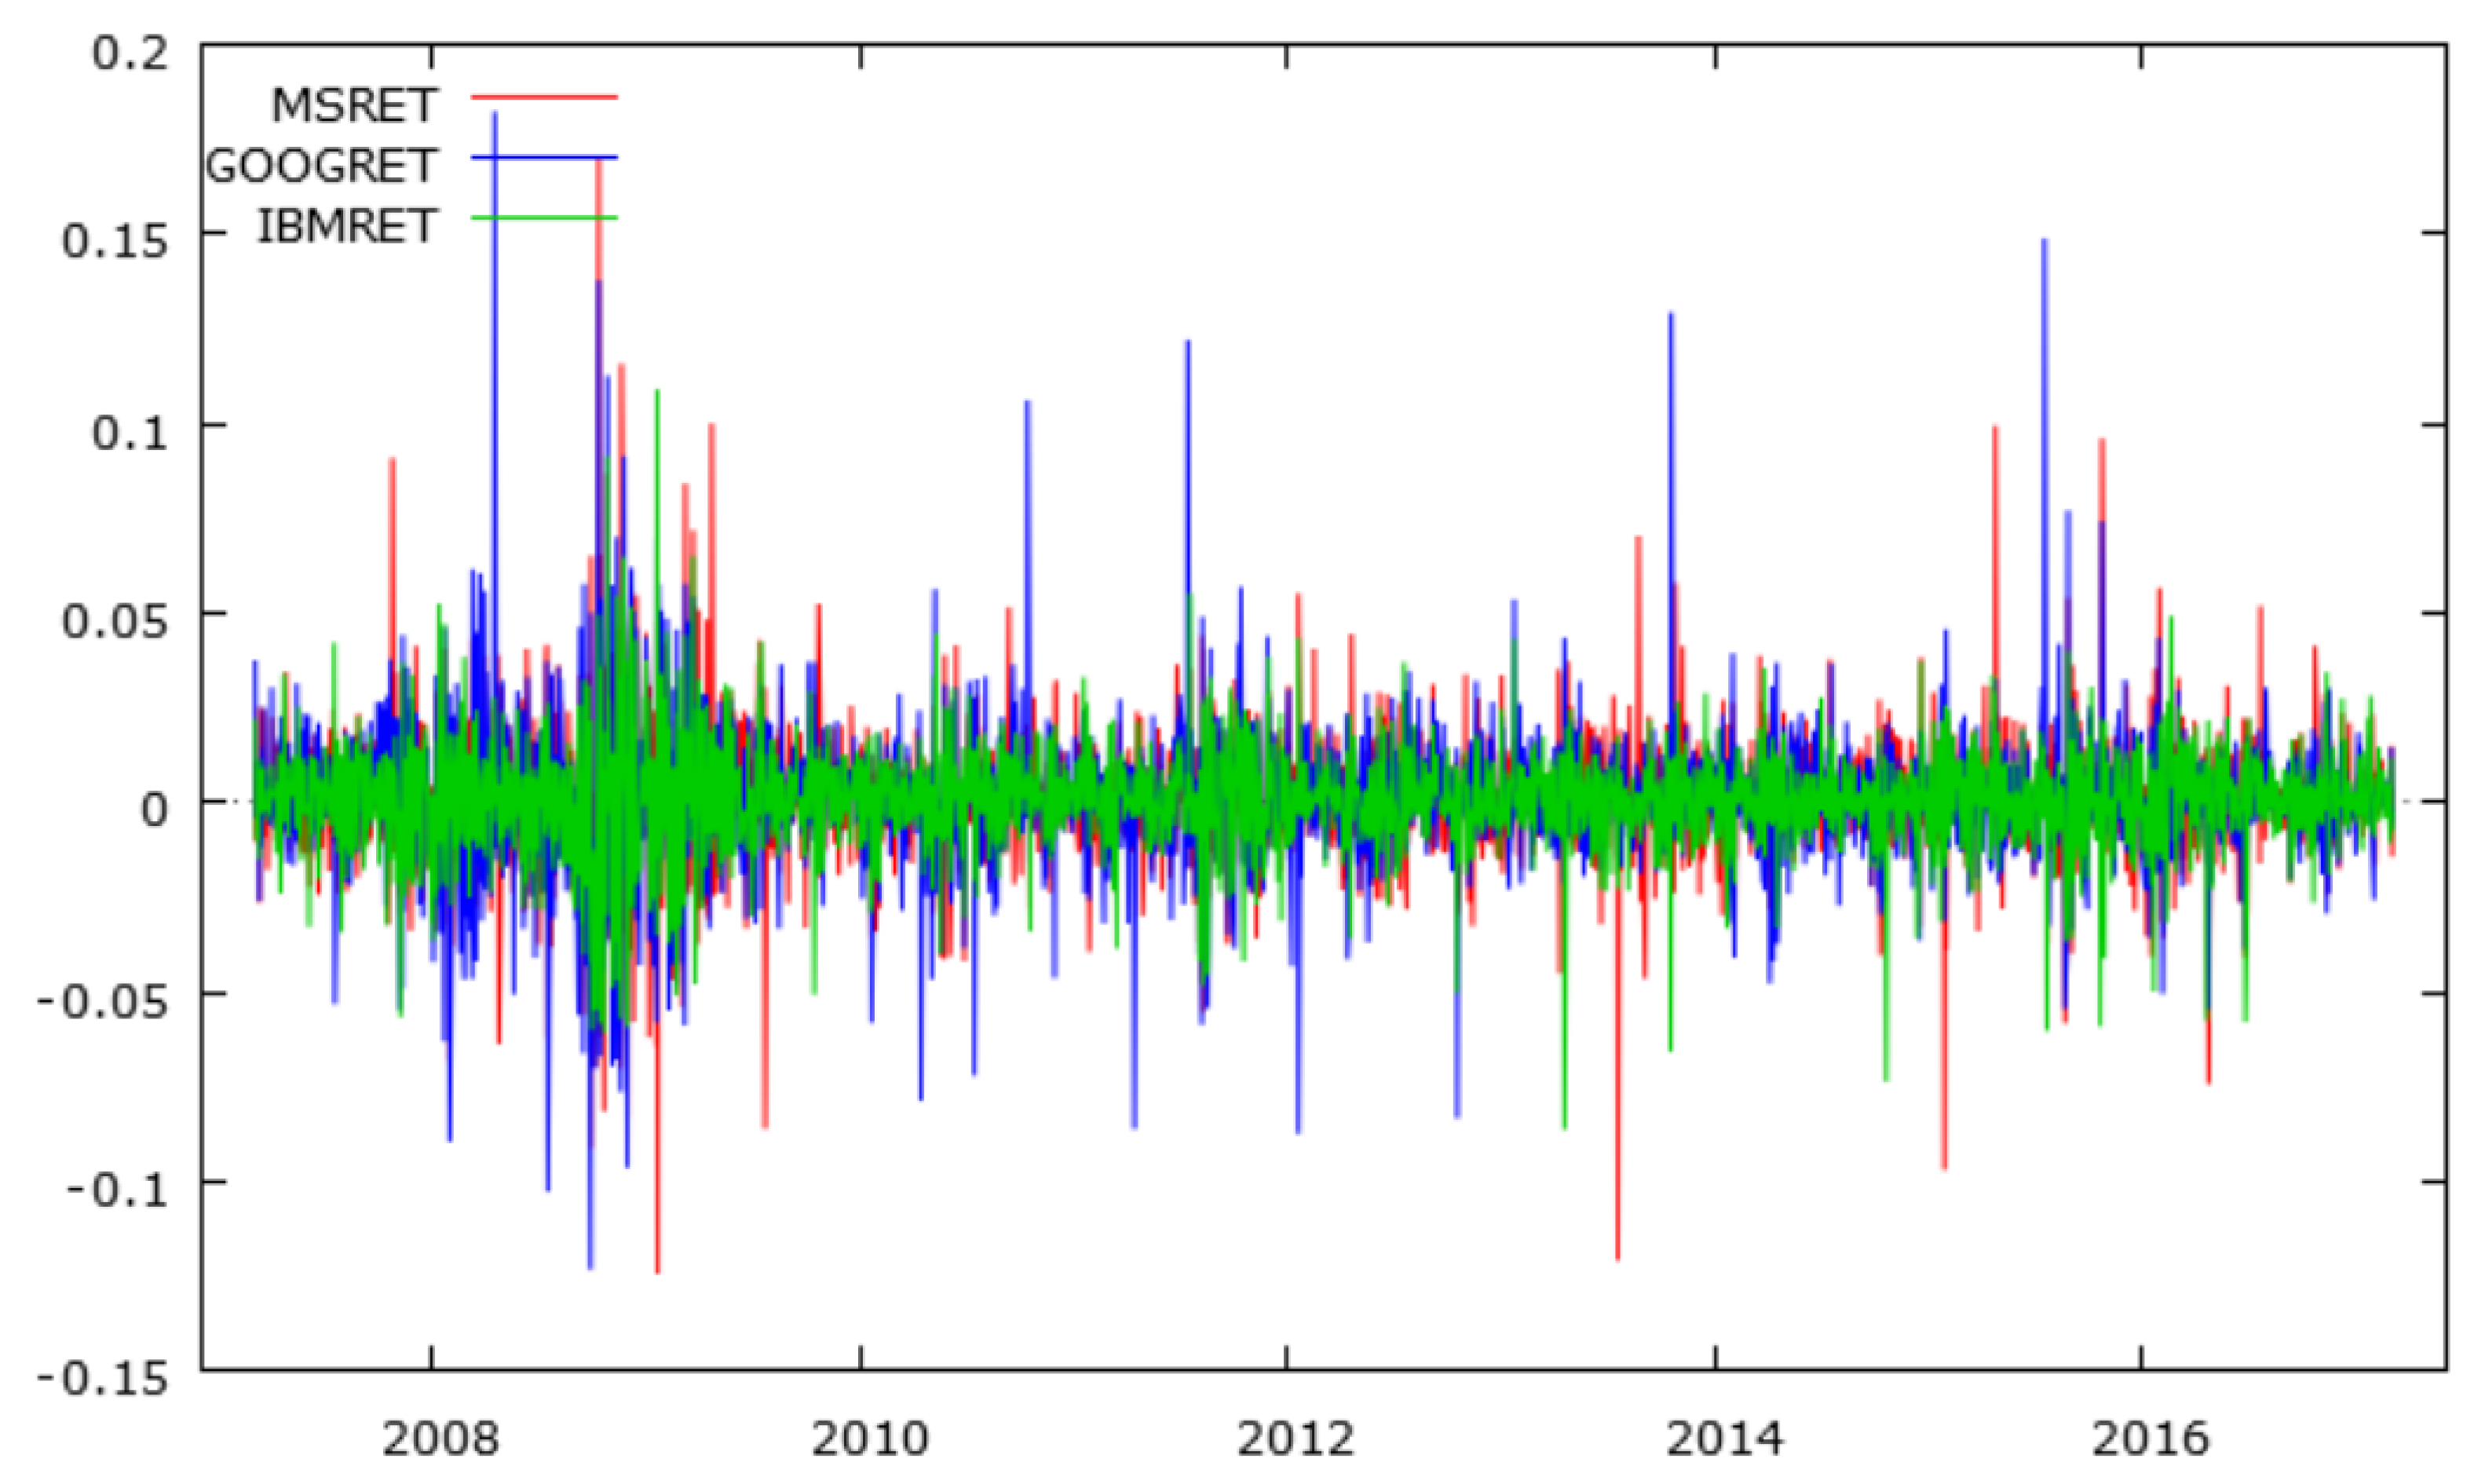
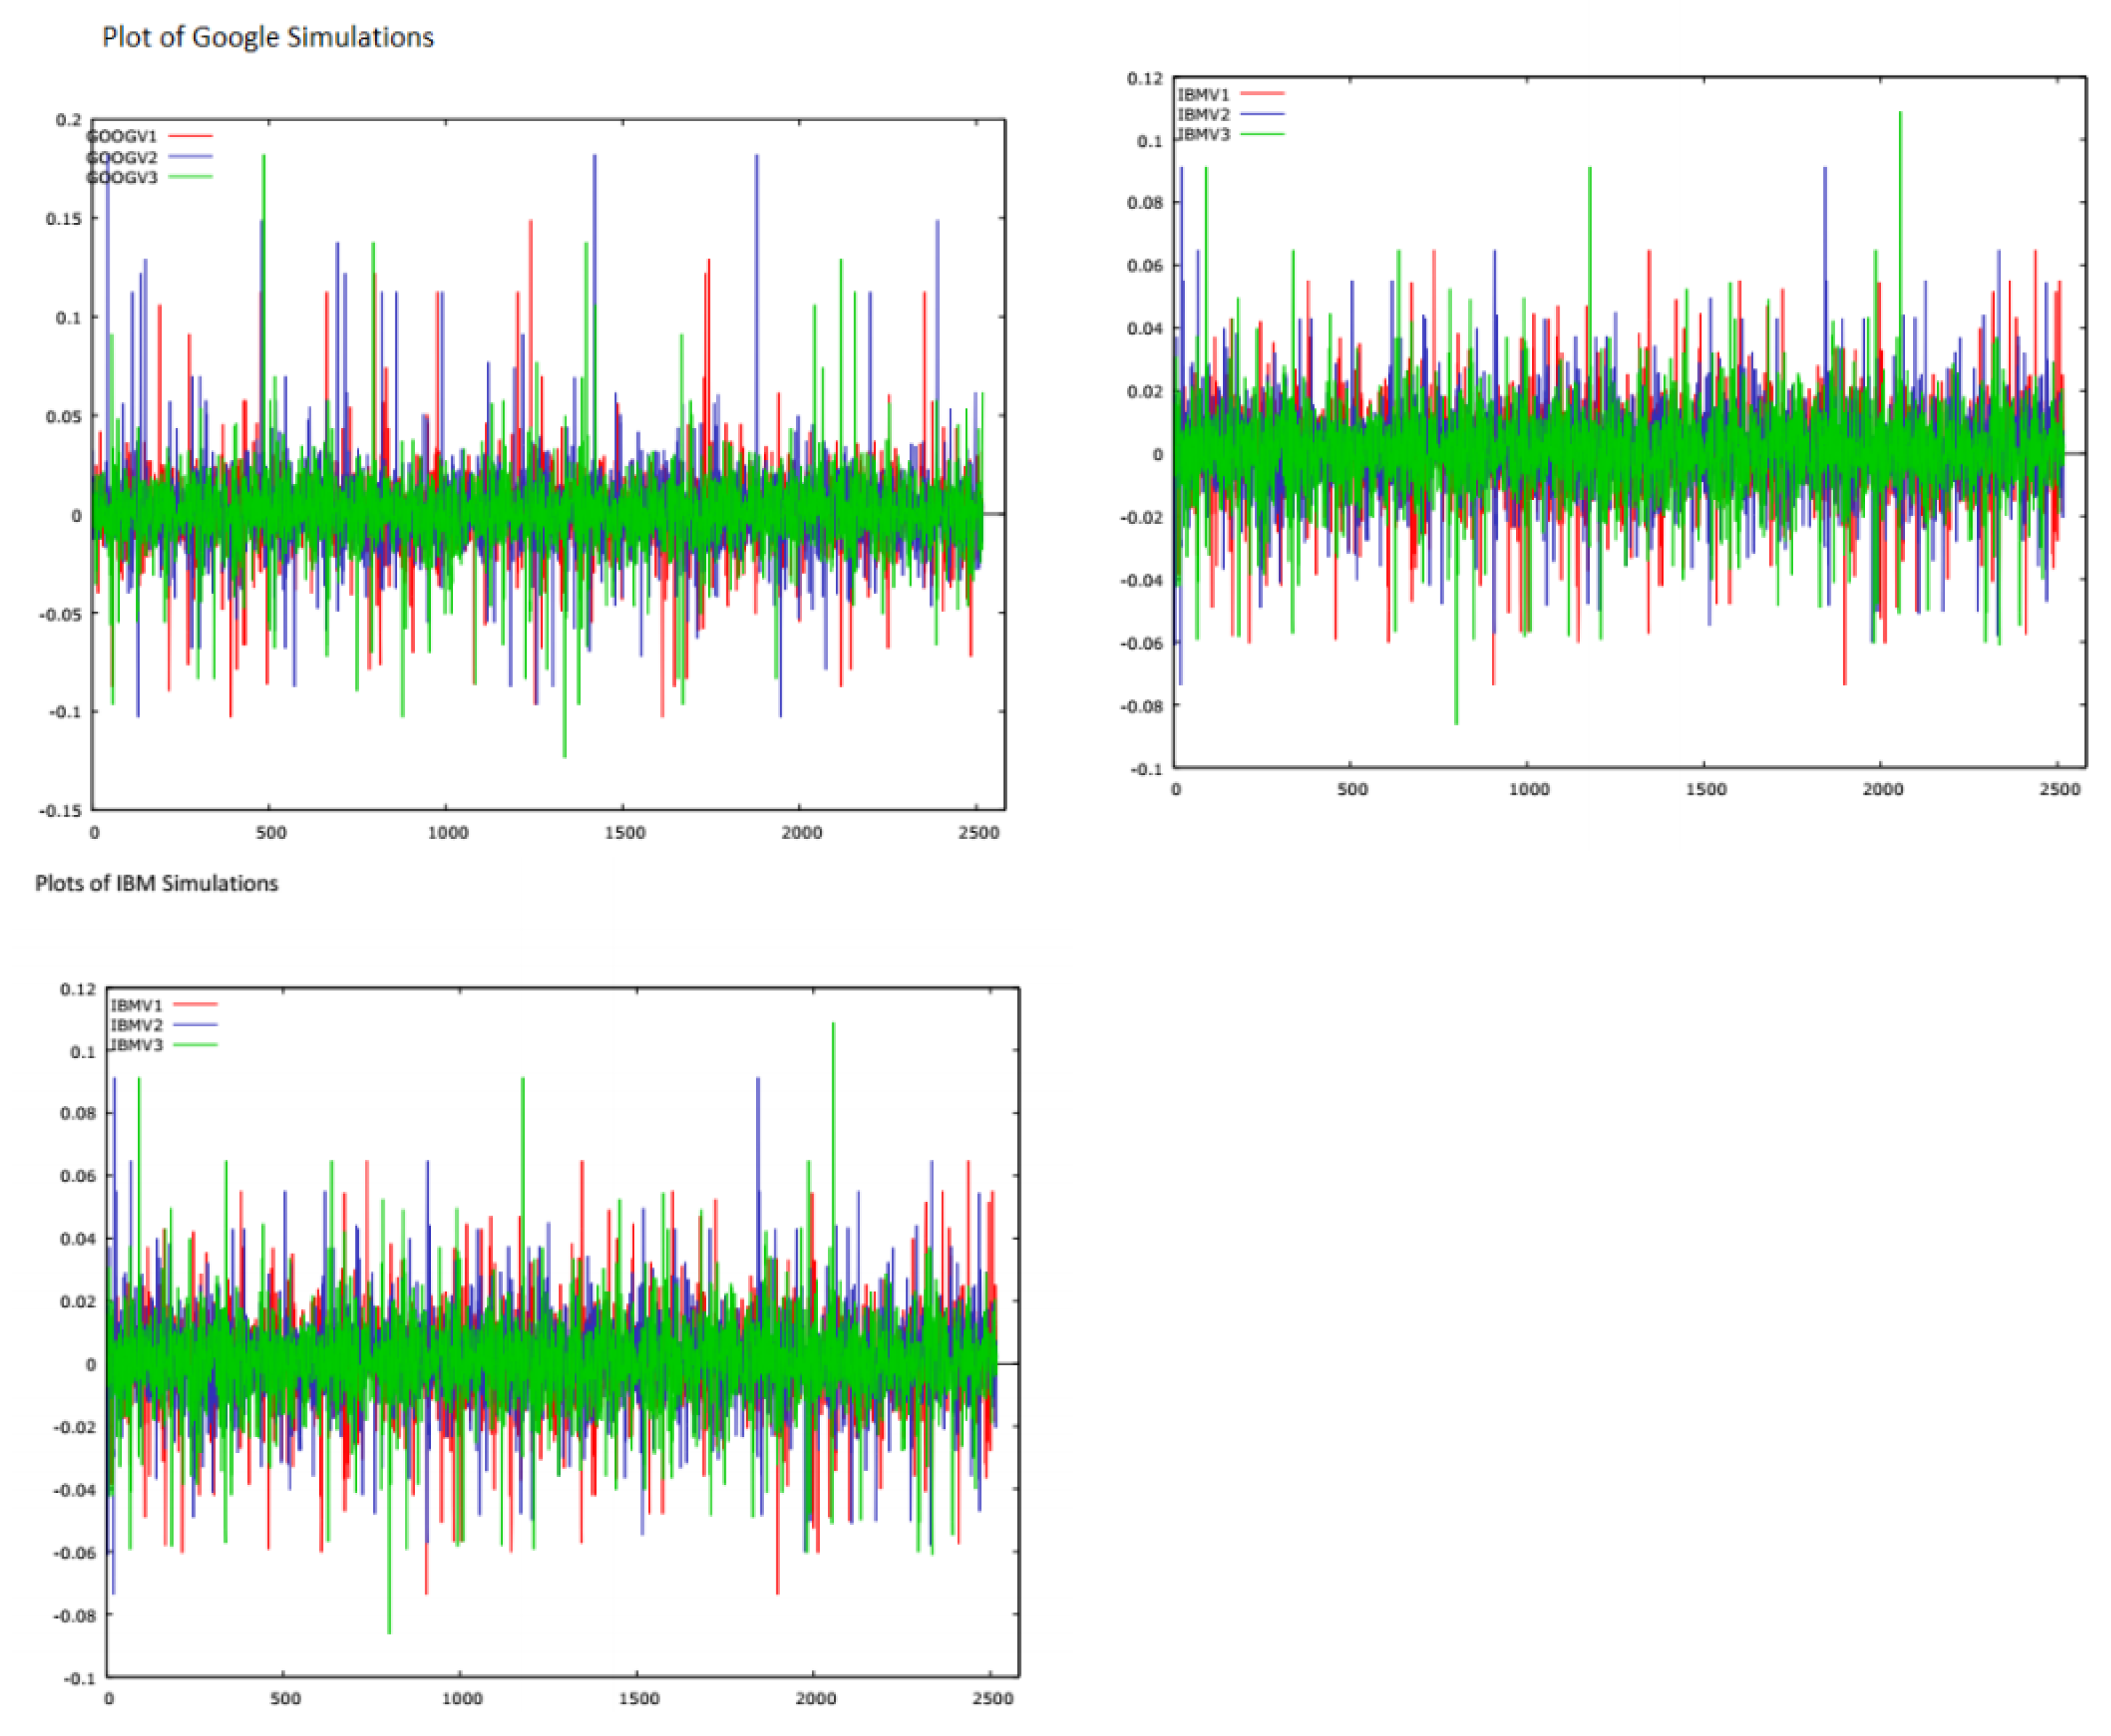
We use three simulated sets of daily returns derived from ten years of daily data, from 5 March 2007 to 3 March 2017, for Google , IBM and Microsoft. (Data accessed on 6 March 2017, in Perth, Western Australia). The original adjusted return series were downloaded from Yahoo Finance. The random simulations, created in R, are done in blocks, including five lags so as to preserve autocorrelations and ARCH effects. We use the estimated coeffcients of the conditional variances and conditional covariances derived from Diagonal BEKK (DBEKK), which has appropriate regularity conditions and statistical properties, as the benchmark.
McAleer and Lieberman [9] showed that the QMLE of the parameters of DBEKK models are consistent and asymptotically normal, so that standard statistical inference for testing hypotheses is valid. These are compared with estimates of the same coefficients using the Full BEKK model. Non-parametric tests reveal statistically significant bias in the Full BEKK coefficient estimates for the conditional variances and covariances.
Engle and Kroner [8], in their original extended discussion of multivariate ARCH models, suggest that: “Very little is currently known about the properties of maximum likelihood estimators in univariate GARCH models, let alone in multivariate GARCH-in-mean models, despite the fact that this estimator permeates the multivariate GARCH-in-mean literature”. This issue is a central focus of the current paper, which is developed from the fact that, in the current extant literature, the relevant statistical properties required for the estimation of full BEKK models are assumed rather than proven. This is not the case for the DBEKK model, so we apply the former as a lense, which can be used to assess potential biases in the latter, the BEKK model.
It is important, for both investment purposes and in the interests of informed financial policy making, that any limitations and biases in the estimation and application of the BEKK model are understood. In practice, the model is frequently utilised. For example, in recent studies, Gounopoulos [10] used a BEKK model to examine linkages between stock returns and currency exposures of a sample of US, UK, and Japanese banks and insurance companies. Long and Zhang [11], similarly apply a BEKK model to analyze the conditional time-varying currency betas in five developed and six emerging financial markets. Caporale and Spagnolo [12] test the impact of exchange rate uncertainty on net equity and net bond flows and on their dynamic linkages applying a BEKK model. Cardona and Agudelo [13] use a BEKK model to explore volatility transmission effects between US and Latin American financial markets.
The paper is divided into four sections. The introductory section is followed by Section 2, which describes the data sets, their statistical characteristics, and the models and empirical methods used. Section 3 presents the empirical results, and Section 4 provides some concluding remarks.

2. Data and Research Method

2.1. Data

The original data series comprised ten years of daily price-adjusted data, from 5 March 2007 to 3 March 2017, for Google, IBM and Microsoft, which were downloaded from Yahoo Finance. Descriptive statistics for the three original series, each comprising 2518 observations, are shown in Table 1.
The statistics show that the three series display characteristics that are typical of financial return series, displaying skewness and excess kurtosis. Plots of the original sample of daily adjusted returns are shown in Figure 1. The QQplots of the series shown in Figure 2 reveal that they have fat tails and do not conform to a normal distribution.
The original three series are stationary, as confirmed by the Augmented Dickey–Fuller tests using constant and trend, and also display significant ARCH effects. The results of these tests are shown in Table 2.

2.2. Research Models, Simulations and Tests

2.2.1. Univariate Conditional Volatility Models

Chang and McAleer [14] show that Full BEKK has no underlying stochastic process, regularity conditions, or asymptotic properties. They point out that, in the development of GARCH, the conditional mean of financial returns for commodity i, in a financial portfolio of m assets, can be developed as follows:
y i t = E ( y i t I t 1 ) + ε i t , 1 = 1 , 2 , , m .
In Equation (1) above, the returns, y i t , represent the log difference of financial asset prices, I t 1 is the information set for all prices at time t 1 , E ( y i t I t 1 ) is the conditional expected returns, and ε i t is a conditionally heteroscedastic error term. The conditional volatility specifications are based on the stochastic specification presumed to underlie the return shocks, ε i t . Chang and McAleer [14] consider the random coefficient autoregressive process underlying the returns shocks ε i t , as shown below:
ε i t = ϕ i t ε i t 1 + η i t ,
where ϕ i t i i d ( 0 , α i ) , α i 0 , η i t i i d ( 0 ω i ) , ω k i > 0 , η i t = ε k i t / h i t is the standardised residual, and h i t is the conditional volatility of asset i. Tsay [15] suggested the following formulation for the conditional volatility of asset i as an ARCH process:
E ( ε i t 2 I t 1 ) h i t = ω i + α i ε i t 1 , 2 i = 1 , 2 , , m , m > 1 .
A lagged dependent variable, h i t 1 , is typically added to Equation (3) to improve the empirical fit:
E ( ε i t 2 I t 1 ) = ω i + α i ε i t 1 2 + β i h i t 1 , β i ( 1 , 1 ) .
The specification in Equation (2) suggests that α i and ω i should be positive because they are the unconditional variances of two different stochastic processes. Equation (4) is a GARCH(1,1) model for asset i (see Bollerslev [2]). The stability condition requires that β i ( 1 , 1 ) . Given that the stochastic process in Equation (2) follows a random coefficient autoregressive process, under normality (non-normality) of the random errors, the maximum likelihood estimators (quasi-maximum likelihood estimators, QMLE) of the parameters will be consistent and asymptotically normal.

2.2.2. Multivariate Conditional Volatility Models

The multivariate extension of the univariate ARCH and GARCH models is given in Baba et al. [7] and Engle and Kroner [8]. The relationship between the returns shocks and the standardised residuals, in the multivariate case, can be written as η i t = ε i t / h i t .
The multivariate extension of Equation (1) can remain unchanged by assuming that the three components are now m × 1 vectors, where m is the number of financial assets. Chang and McAleer [14] consider a vector random coefficient autoregressive process of order one as:
ϵ t = ϕ t ε t 1 + η t ,
where ε t and η t are m × 1 vectors, ϕ t is an m × m matrix of random coefficients, ϕ t i i d , ( 0 , A ) , A is positive definite, η t i i d , ( 0 , C ) , where C is an m × m matrix.
In the case where A is a diagonal matrix, with a i i > 0 for all i = 1 , , m , and b i j < 1 | for all j = 1 , , m , so that A has dimension m × m , and McAleer and Lieberman [9] showed that the multivariate extension of GARCH(1,1) from Equation (5) is given as the Diagonal BEKK model, namely:
Q t = C C + A ε t 1 ε t 1 A + B Q t 1 B ,
where A and B are both diagonal matrices. It is essential for the matrix multiplication of ε t 1 ε t 1 by A that A is diagonal and positive definite, given that the former is an m × m matrix. If this is not the case, Equation (6) could not be derived from the vector random coefficient autoregressive process in Equation (5).
It was shown in McAleer and Lieberman [9] that the QMLE of the parameters of the DBEKK model are consistent and asymptotically normal, so that standard statistical inference for testing hypotheses is valid. However, Chang and McAleer [14] demonstrate that this is not the case for the Full BEKK model. They consider element i of Equation (5), which can be written as:
ε i t = j = 1 m ϕ i j t ε i j t 1 + η i t , i = 1 , 2 , , m , m > 1 ,
which is not equivalent to Equation (2) unless ϕ i j t = 0 , j i .
Chang and McAleer [14] point out that Equation (7) is not a random coefficient autoregressive process because of the presence of another m 1 random coefficients. Furthermore, Equation (7) is not invertible because the random processes cannot be connected to the data, which requires m equations, as shown in Equation (5). This means that the stochastic process underlying univariate ARCH is not a special case of that underlying multivariate ARCH, unless ϕ i j t = 0 , j i .
As a result, Chang and McAleer [14] suggest that, the case of a Full BEKK model, namely where there are no restrictions on the off-diagonal elements in ϕ t , and hence no restrictions in the off-diagonal elements in A, is not possible if univariate ARCH is to be a special case of its multivariate counterpart, Full BEKK. This suggests that Full BEKK does not exist, except by assumption.
Given the above result, plus the fact that Full BEKK is frequently estimated in practice and is incorporated in many commercial econometric statistical packages, the focus in this paper is to explore whether there is any evidence of bias in the coefficients estimated in Full BEKK, as compared with DBEKK. We use DBEKK as a benchmark because the mathematical and statistical conditions of DBEKK have been established.
We conduct simulations generating simulated financial return series and use them as inputs to estimate both DBEKK and Full BEKK, from which we can compare the estimates of the conditional variances and covariances. The null hypothesis is that the two sets of estimates should not differ systematically. The method of generating the simulated financial return series is discussed below.

2.2.3. Simulated Return Series

We use the three financial return series for Google, IBM, and Microsoft, and draw on code from several packages in the R library to randomly sample the original time series in blocks of five lags to ensure that we retain the autocorrelation structures to maintain the presence of ARCH effects. The timeSeries, boot and meboot packages prove to be of interest.
Plots of the simulated series based on the three stocks are shown in Figure 3, and the descriptive statistics of the simulated financial return series are shown in Table 3.
The simulations have similar characteristics to the base series. IBM has the lowest excess kurtosis of the set of simulations, as would be expected, given that the IBM original return series had relatively low kurtosis in relation to the other two series. Augmented Dickey–Fuller tests confirmed that all the simulated series are stationary, and all displayed highly significant ARCH effects.
The simulated series have fat tails and are not Gaussian, as the QQplots for the first set of simulations of the three series shown in Figure 4 reveal.

2.3. Tests and Optimisation Prodedures

Empirical estimation of the DBEKK and FullBEKK models was based on the Estima Rats econometric software. In the empirical analysis which follows, we report the results of fitting the multivariate GARCH models, DBEKK and FullBEKK, to the simulated financial return series. This type of estimation procedure involves seeking the solution to an unconstrained minimization problem:
m i n θ f ( x , θ ) ,
where x are the data and θ is a vector of models to be chosen to minimise the objective function f ( x , θ ) . In the case of GARCH models, this will be a negative log-likelihood function. Typically, no closed-form expression for f ( x , θ ) is available or for its partial derivatives, and so the solution minimisation process is usually achieved by the use of numerical methods. Hurn et al. [16] point out that there are two broad approaches to the construction of a minimisition algorithm: methods that rely on function values, or algorithms that use the derivatives of the function.
If we use an algorithm based on gradients to minimise f ( x , θ ) , then we are assuming that all first and second derivatives exist. The gradient vector, G ( θ ) , and the Hessian matrix, H ( θ ) , of the function, f ( x , θ ) , can be defined as:
G ( θ ) = δ f ( x , θ ) δ θ , H ( θ ) = δ 2 f ( x , θ ) δ θ δ θ .
The minima of the objective function occur at parameter values where the gradient is zero and the associated Hessian matrix is positive definite. The estimator, θ ^ , of the parameter vector, θ , should satisfy the condition:
G ( θ ^ ) = 0 .
We can start with a guess, θ k ^ , which is assumed to be near the optimal value θ at which a minumum is attained. A Taylor series expansion of G ( θ ^ ) about θ k ^ is given as:
G ( θ ^ ) = G ( θ ^ k + ( θ ^ θ ^ k ) ) = G ( θ ^ k ) + H ( θ ^ k ) ( θ ^ θ ^ k ) + 0 ( θ ^ θ ^ k ) 2 .
If we replace G ( θ ^ ) in Equation (10) by the previous expression (9), and ignore all terms of order two and above, it follows that:
θ ^ θ ^ k H ( θ ^ k ) 1 G ( θ ^ k ) .
Using this result, the next guess for θ ^ is:
θ k + 1 ^ = θ ^ k H ( θ ^ k ) 1 G ( θ ^ k ) .
This is referred to as a ‘full Newton step’ which would be taken close to the location of the minimum. However, further away from the minimum, this step may not be guaranteed to reduce the value of the function, so the usual convention is to use a smaller step:
θ k + 1 ^ = θ ^ k α k H ( θ ^ k ) 1 G ( θ ^ k ) ,
where α k is chosen to control the step size and to ensure that the function is reduced at each iteration.
All gradient-based algorithms employ the general iterative scheme set out in Equation (12), and differ only in their approximation of the Hessian matrix at each iteration. T.M. Christensen and Lindsay [16] point out that a Newton–Raphson procedure computes the Hessian matrix directly, the Method of Scoring uses the Information matrix (negative of the value of the Hessian matrix), and the BHHH algorithm, (Berndt and Hausman [17]) approximates the Hessian by the outer product of the gradient vector. BHHH provides an approximation of the Hessian matrix that is guaranteed to be positive definite, and so is a popular choice in many econometric packages.
The estimation process used in this paper is BHHH, but there are several caveats. T.M. Christensen and Lindsay [16] point out that the treatment of constraints on parameters, choice of starting values, specification of termination criteria and analytical versus numerical gradients can materially alter the final output of a minimisation algorithm. A subsequent comment on this paper by McCullough [18] suggests that default options for a nonlinear solver are not likely to produce a correct answer, and that the answer produced by a nonlinear solver is not necessarily correct.
McCullough and Vinod [19] question the baseline accuracy of many commonly used econometric packages, and note that there is often a trade-off between computational speed and statistical accuracy. McCullough and Renfro [20] explore the interaction between benchmarks, software standards, and econometric theory, using the GARCH model as a case study, and caution against the uncritical use of standard econometric packages.
Despite these various issues, the paper adopts a consistent framework in the estimation methods adopted to compare DBEKK with Full BEKK. We rely upon the estimation procedures in Rats and the BHHH algorithm to fit the two models. These are then used to predict the daily condition variances and covariances generated by the two models. We then use quantile regression to analyse the two sets of estimates using the DBEKK estimates as the baseline benchmark.

2.4. Quantile Regression

Quantile Regression is modelled as an extension of classical OLS (Koenker and Bassett [21]). In Quantile Regression, the conditional mean as estimated by OLS is extended to similar estimation of an ensemble of models of various conditional quantile functions for a data distribution. Therefore, Quantile Regression can better quantify the conditional distribution of ( Y | X ) . The central special case is the median regression estimator that minimises a sum of absolute errors. Estimates of the remaining conditional quantile functions are obtained by minimizing an asymmetrically weighted sum of absolute errors, where the weights are functions of the quantile of interest. This makes Quantile Regression a robust technique, even in the presence of outliers. Taken together, the ensemble of estimated conditional quantile functions of ( Y | X ) offers a much more complete view of the effect of covariates on the location, scale and shape of the distribution of the response variable.
For parametric estimation in Quantile Regression, quantiles as proposed by Koenker and Bassett [21] can be defined through an optimisation problem. In order to solve an OLS regression problem, a sample mean is defined as the solution of the problem of minimising the sum of squared residuals, in the same way the median quantile (0.5%) in Quantile Regression is defined through minimising the sum of absolute residuals. The symmetrical piecewise linear absolute value function assures the same number of observations above and below the median of the distribution.
The other quantile values can be obtained by minimizing a sum of asymmetrically weighted absolute residuals, giving different weights to positive and negative residuals. Solving the following:
m i n ξ ε R ρ τ ( y i ξ ) ,
where ρ τ ( ) is the tilted absolute value function, gives the τ t h sample quantile with a solution. Taking the directional derivatives of the objective function with respect to ξ (from left to right) shows that this problem yields the sample quantile as its solution.
After defining the unconditional quantiles as an optimisation problem, it is easy to define the conditional quantiles similarly. Taking the least squares regression model as a base to proceed, for a random sample, y 1 , y 2 , , y n , solving:
m i n μ ε R i = 1 n ( y i μ ) 2
gives the sample mean, as an estimate of the unconditional population mean, E Y . Replacing the scalar, μ , by a parametric function μ ( x , β ) , and then solving:
m i n μ ε R p i = 1 n ( y i μ ( x i , β ) ) 2
gives an estimate of the conditional expectation function, E(Y|x).
Proceeding in the same way for Quantile Regression, in order to obtain an estimate of the conditional median function, the scalar, ξ , in the first equation is replaced by the parametric function, ξ ( x t , β ) , and τ is set to 1/2 . The estimates of the other conditional quantile functions are obtained by replacing absolute values by ρ τ ( ) , and solving:
m i n μ ε R p ρ τ ( y i ξ ( x i , β ) ) .
The resulting minimization problem, when ξ ( x , β ) is formulated as a linear function of parameters, can be solved efficiently by linear programming methods. We use quantile regression to compare the relative behaviour of the conditional variances across the quantiles, as predicted by the two models.

3. Empirical Results

We estimated both DBEKK and Full BEKK using the simulated financial return series. The estimates from DBEKK are used as the benchmark, given that it has established statistical regularity conditions. We decided to keep the comparison tests as simple as possible and first estimated a two-variable version of the DBEKK and Full BEKK models using the the three sets of simulated return series in pairs. This was then followed by a single three-variable set of estimates, in order to verify that the same pattern of results exists. The null hypothesis is that Diagonal and Full BEKK are equivalent when the off-diagonal coefficients in Full BEKK are zero, so the asymptotic tests are statistically valid. We proceeded by estimating the coefficients for the conditional variances and the conditional covariances for the two models, and then used non-parametric sign tests on the differences between the two sets of estimates.
The estimates of the constants, ARCH effects and conditional variances for the two models are shown in Table 4. DBEKK and Full BEKK fitted to the pairs of simulated series were highly significant, and all but three pairs of the fifty-four coefficients estimated in the models, and presented in Table 4, were significant at the 1% level. (The insignificant coefficients are marked with an asterisk ( *) in Table 4.) The coefficients of the conditional covariances are shown in Table 5. The majority of these estimates are insignificant, so we concentrated our analysis on the conditional variances.
We then undertook a set of non-parametric sign tests on the values of the estimated coefficients, reported in Table 4. We ran the tests in a number of different formats, both on the full set of coefficients reported in Table 4, and the full set minus the three pairs of insignificant estimates. The results of the sign tests are reported in Table 6 and Table 7, which suggest that there are no significant differences in the values of the coefficients for the constants, ARCH effects and the conditional variances estimated for the two variables. However, these tests treat the coefficients in isolation, and regard them as being independent, which is not the case when they are combined into a DBEKK or Full BEKK model.
DBEKK and Full BEKK are multivariate GARCH models that are used for forecasting conditional volatility. The crucial issue for purposes of risk management is how the forecasts of conditional volatility derived from the two models compare. These are vital components for assessing risk, and might be used to compute the Value at Risk (VaR) of a portfolio of financial assets, for example.
The simulated financial return samples for the nine variables contain ten years of daily data, or 2581 data points. We filter these through the DBEKK and Full BEKK models, and obtain corresponding estimates of the conditional variance projections, for each simulated security, from the two models. These forecasts of the conditional variances are then compared using non-parametric sign tests. The results for each simulated security are shown in Table 8.
The sign tests in Table 8 are based on the null hypothesis that the median difference in the conditional variances produced by the two models, DBEKK and Full BEKK, for the simulated securities, is zero. The null hypothesis is strongly rejected in all cases, and the differences are highly significant. We also ran sign tests, not reported, based on the null hypothesis that there was no difference in the conditional variances predicted by the two models. These results also strongly rejected the null hypothesis in all cases.
While it is valuable to know that the two models produce different predictions of the conditional variances, it is also of interest to know whether or not there are systematic differences in the predictions of the conditional variances. We explore this issue by means of quantile regression. The advantage of quantile regression is that we can explore the relationship between the two sets of predictions from DBEKK and Full BEKK at particular quantiles. We regress the predicted conditional variances from the Full BEKK model on the corresponding predictions from DBEKK for each of the simulated securities, in the pairs of securities modelled. We treat the predictions of conditional variances from the Full BEKK model as the dependent variable. The results of these quantile regressions are shown in Table 9.
Table 9 reveals a distinct pattern of an increase in the slope coefficients as we move across the quantiles from the lowest 0.05 quantile to the highest 0.95 quantile. The most extreme case is the prediction of the conditional variances for the relationship between IBMV2 and MSV2. In the 0.05 quantile, the conditional variance prediction by Full BEKK is 50 times lower than for DBEKK, and, in the 0.095 quantile, it is 18 times higher (though there were convergence issues encountered in the Full BEKK estimation in this case). Even so, the difference across these two extreme quantiles usually varies by between 10 and 20 percent. This is still very large if we intend to use the models to predict a portfolio VAR.
If we use the predictions of DBEKK as the benchmark, then application of the Full BEKK model to the same data set may underestimate risk in the lowest quantile and overestimate risk in the highest quantile. In the eighteen examples, seven of the total estimates suggest risk in the 0.05 quantile will be lower by 10 percent or more when estimated by Full BEKK, as opposed to DBEKK. Similarly, in nine of the total cases, the estimate of risk in the 0.095 quantile is 10 percent or more, when estimated by Full BEKK, as compared with DBEKK. Thus, there are considerable discrepancies in the predictions of conditional volatility based on these applications of the two models.
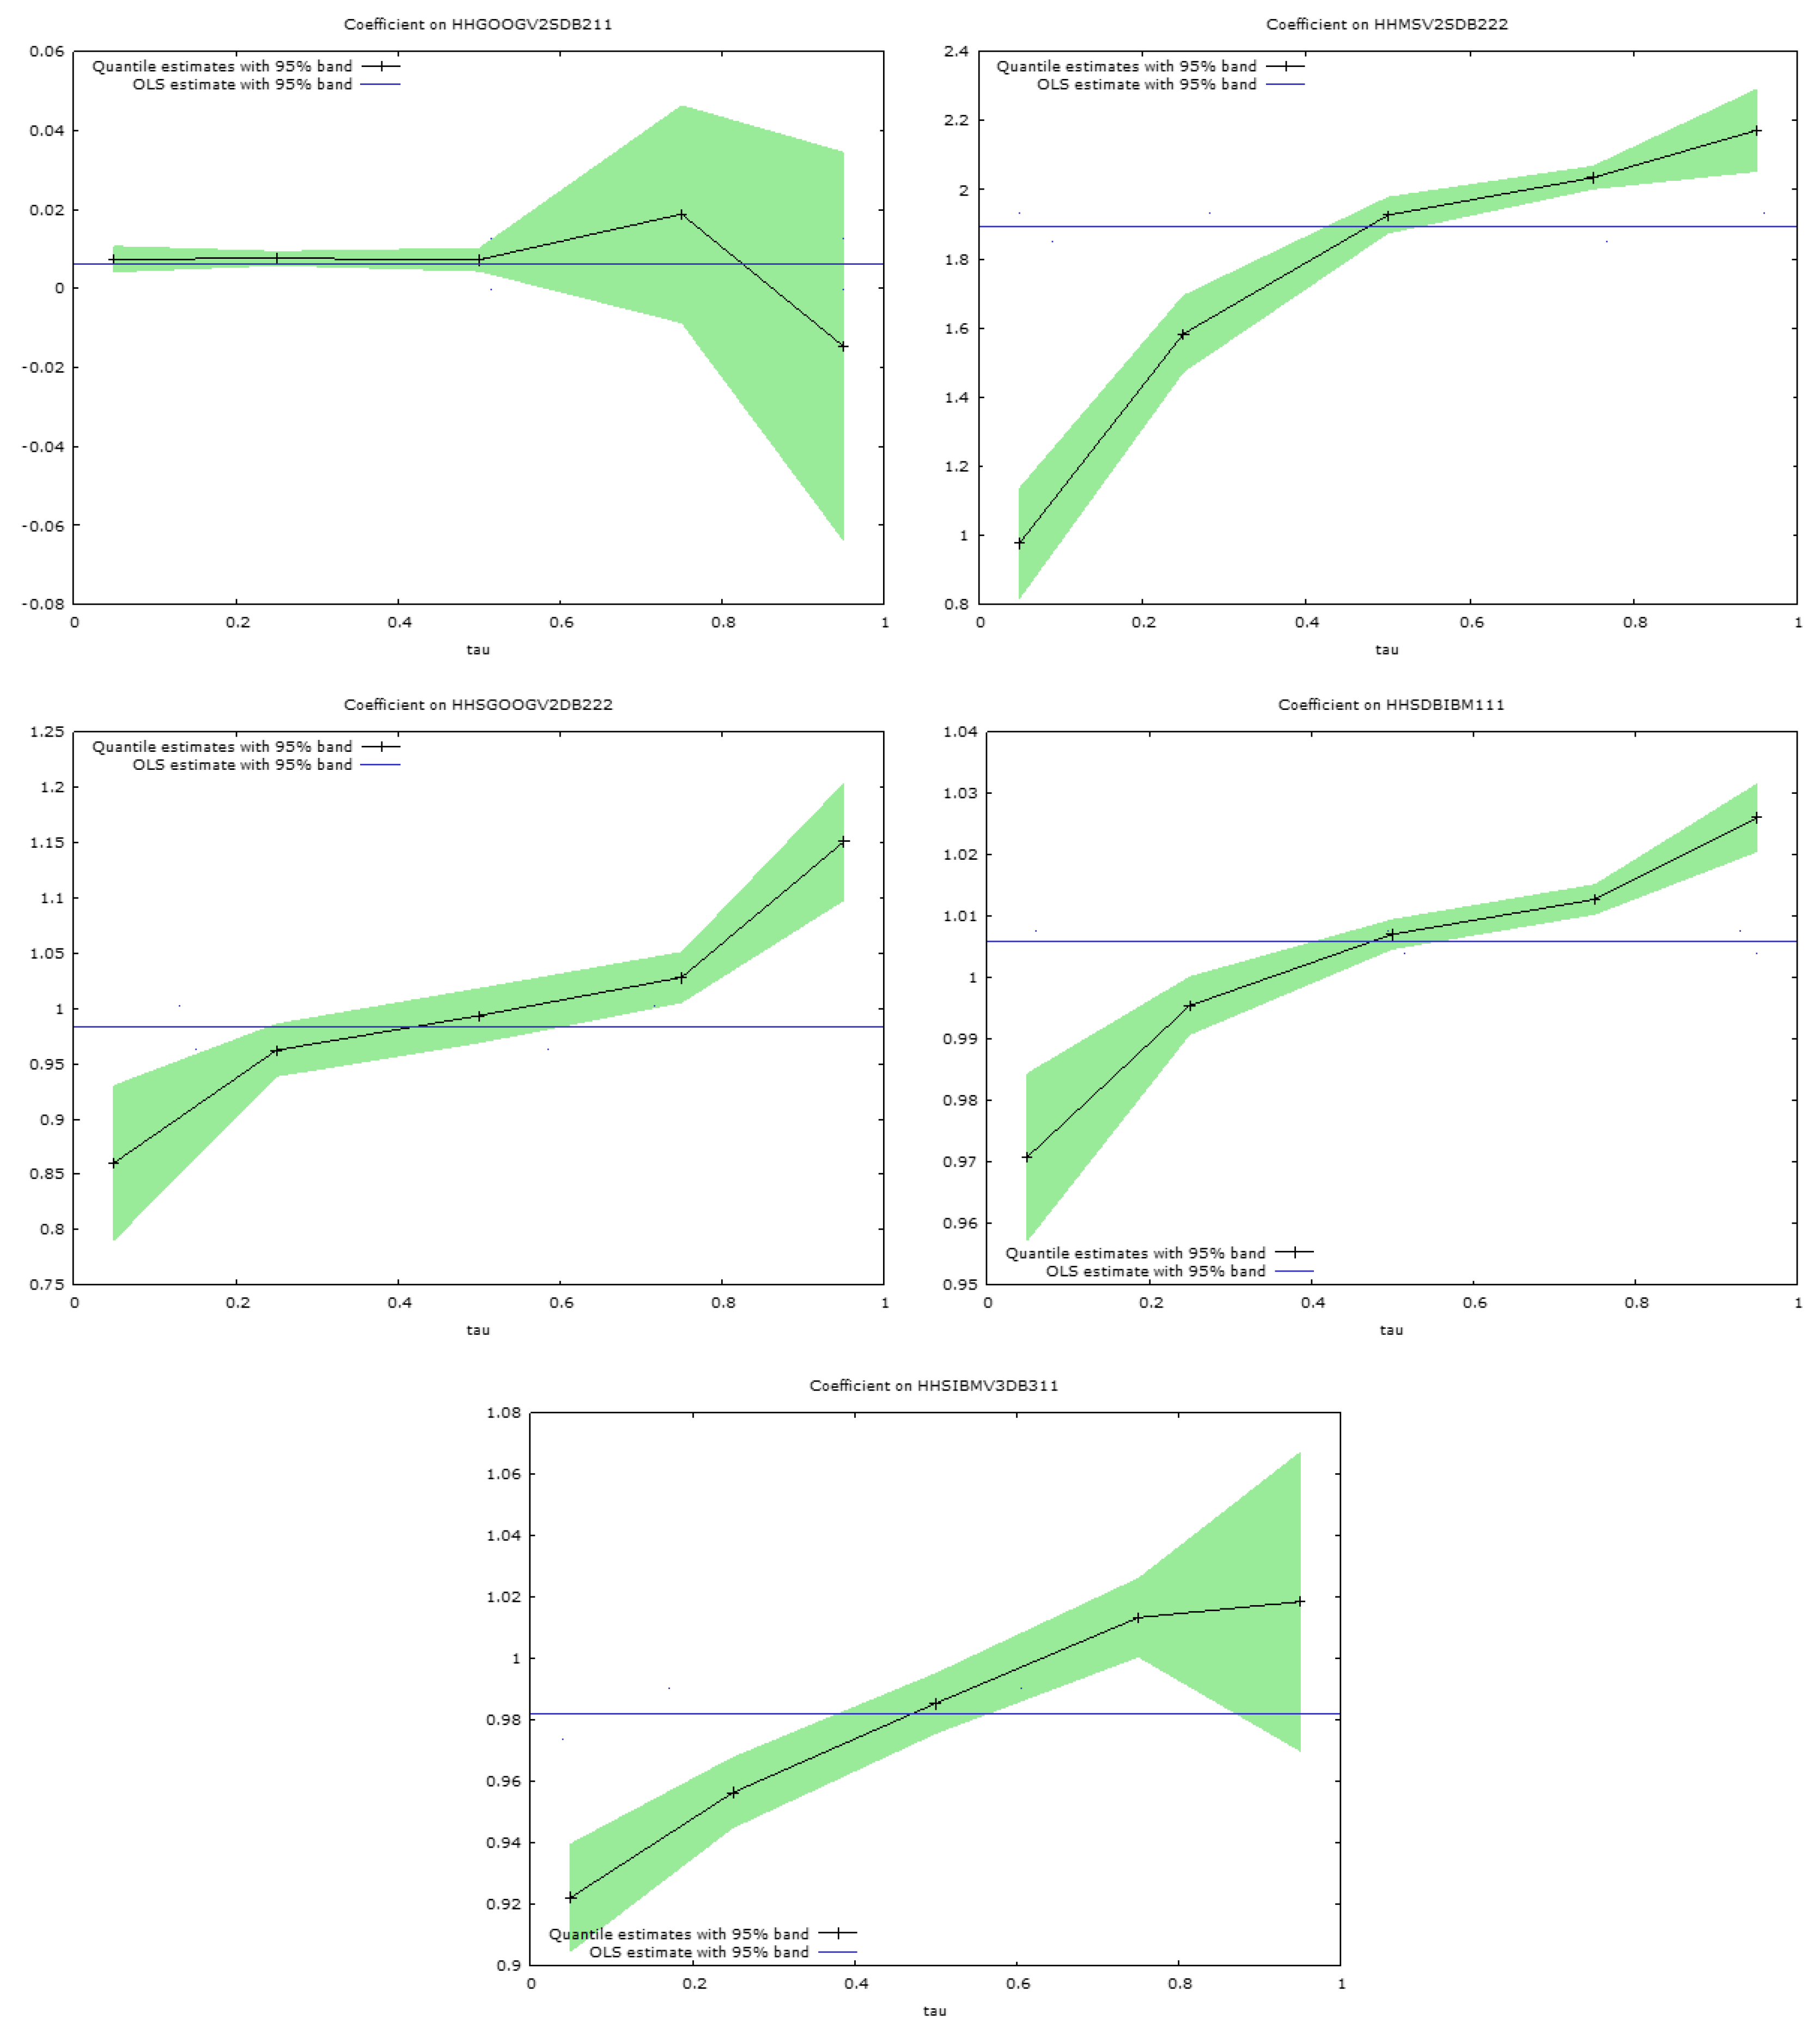
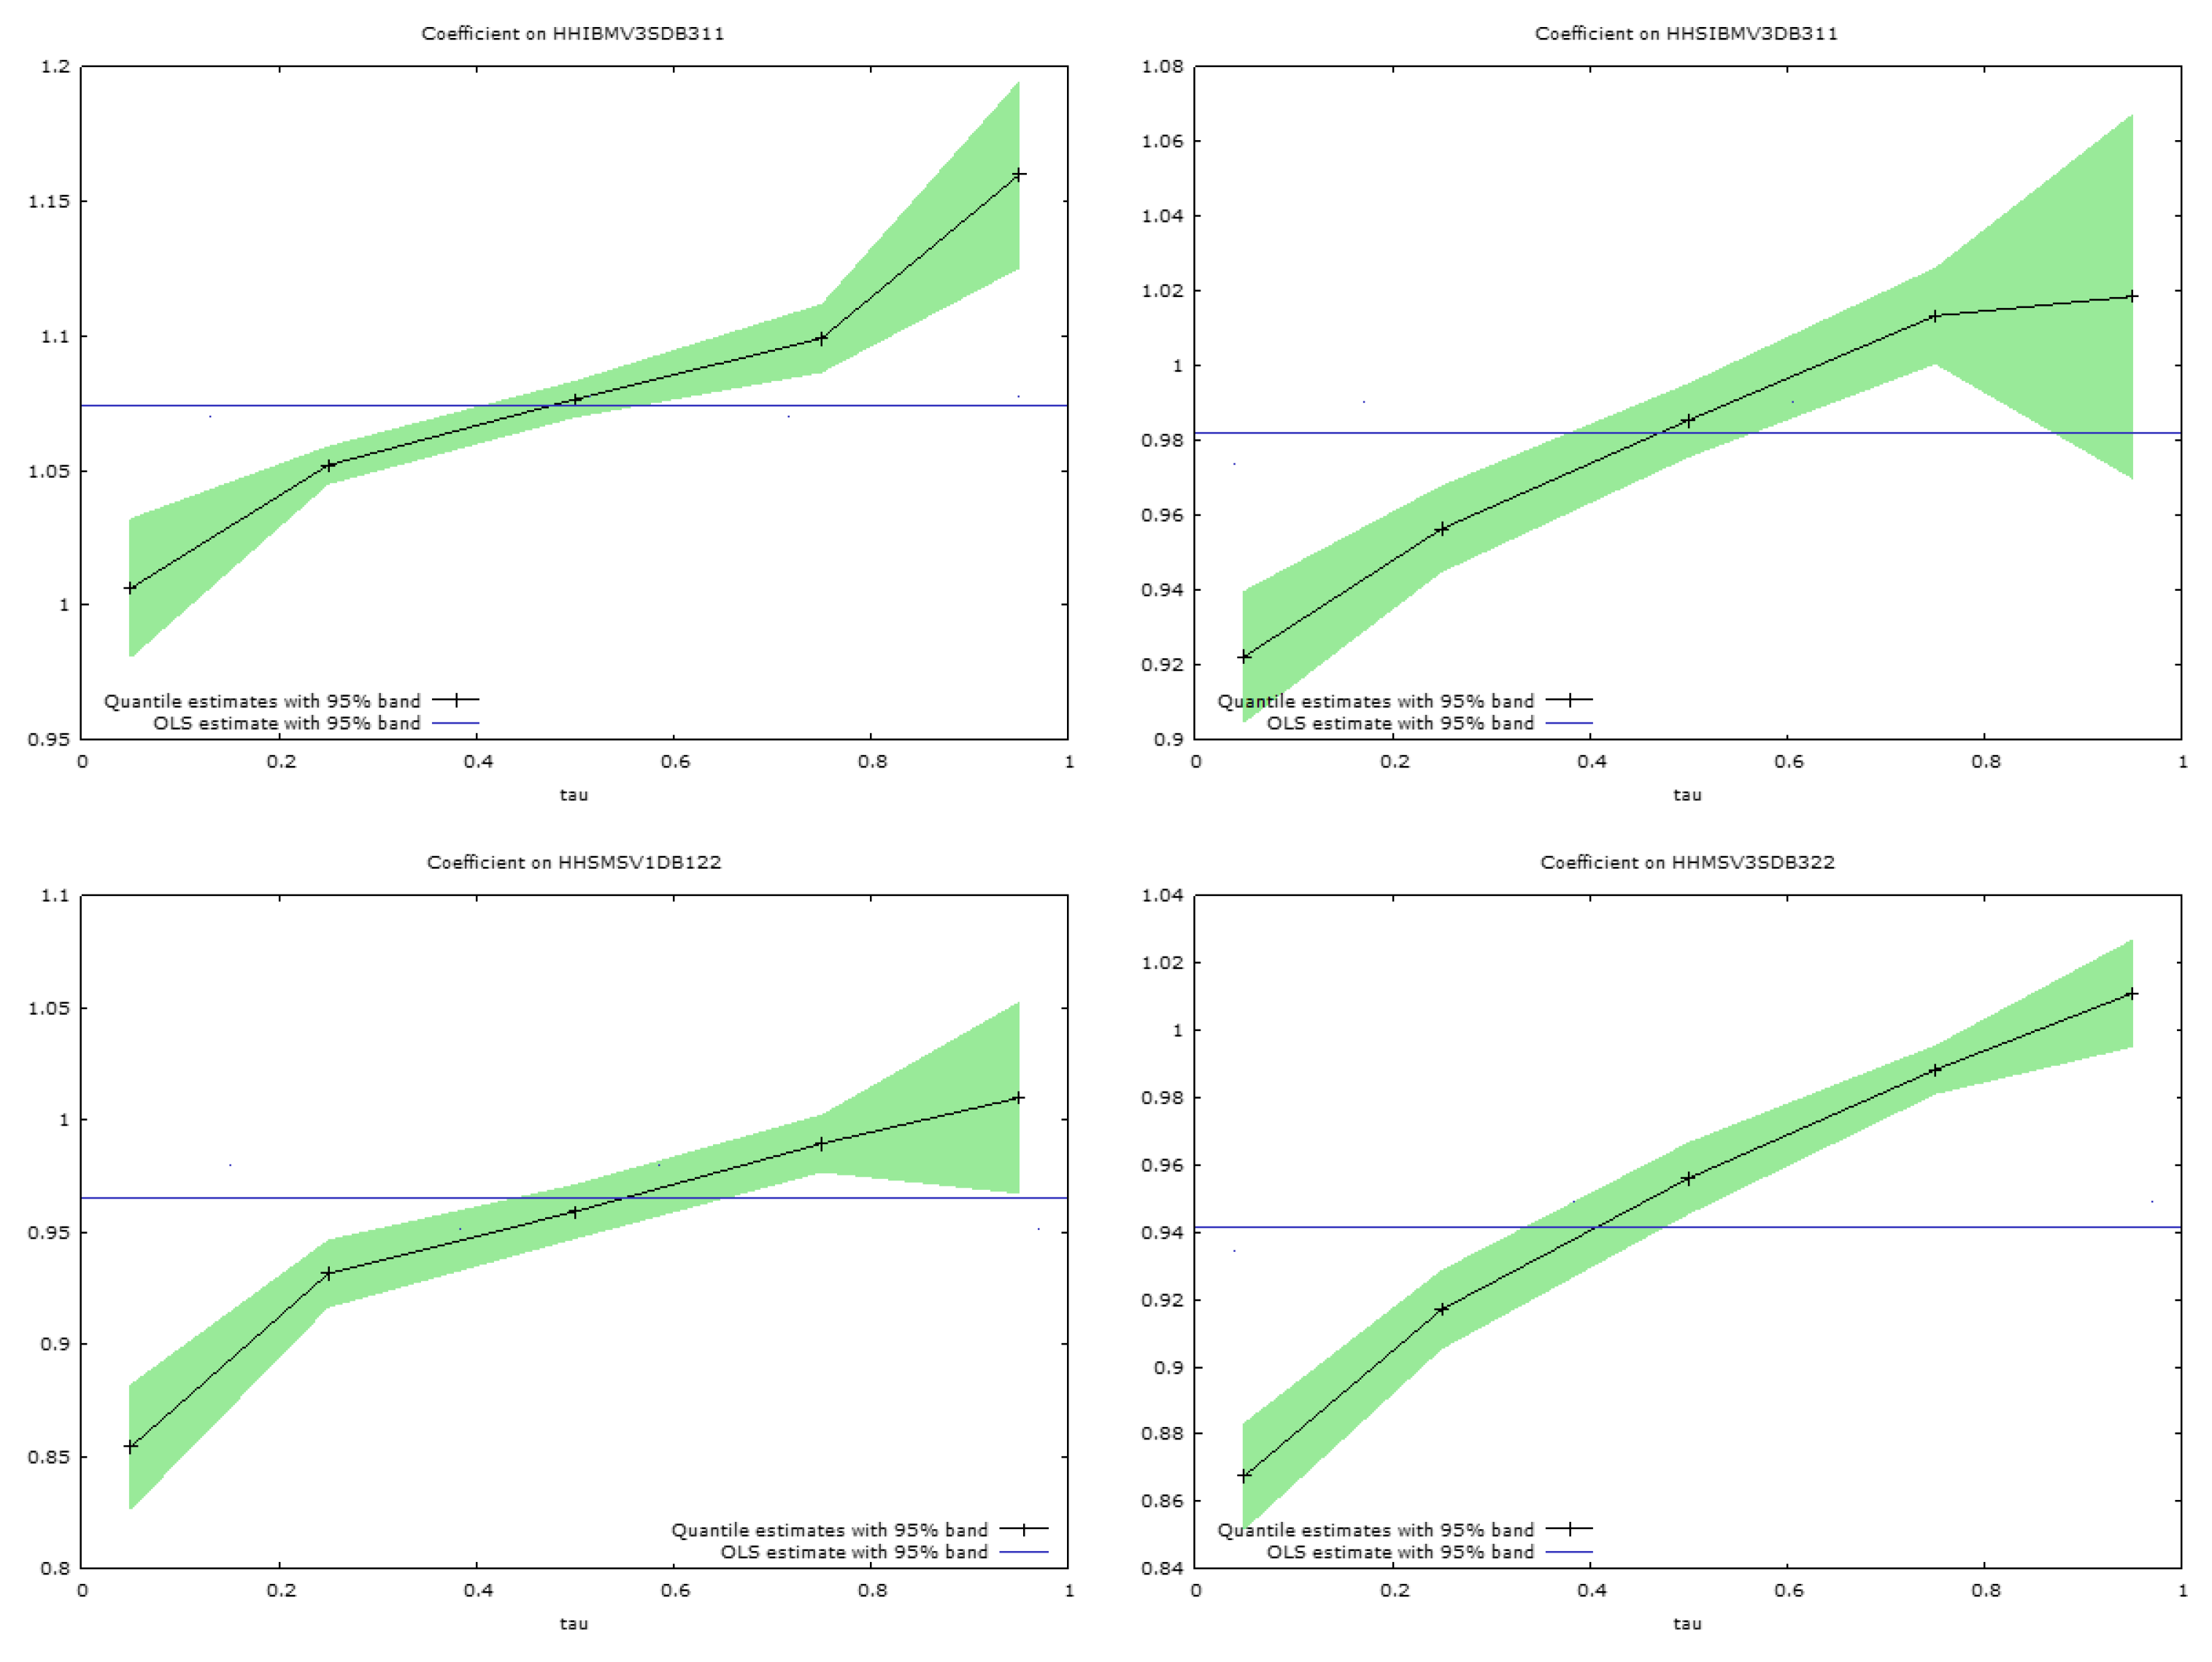
These discrepancies in the regression slope coefficients are apparent in Figure 5 and Figure 6, which present graphs of the estimated slope coefficients across the quantiles for the pairs of simulated securities considered. The quantile regression bounds estimated at the 0.95 level are shown around the quantile slope estimates in each figure. The horizontal lines, in the centre of the figures, show the ordinary least squares regression slopes for the regressions of conditional variances for each security, regressed on the conditional variances for the same security, when considered in the same pairwise estimates produced by DBEKK. The ordinary least squares slope coefficients are not very informative, and merely suggest whether the predicted conditional variances from Full BEKK are relatively above or below those from DBEKK. There is considerable variation in the figures, but most of them are slightly below one.
The quantile regression analyses are much more informative. The lines in Figure 5 and Figure 6 link the slope coefficients estimated at the 0.05, 0.25, 0.50, 0.75, and 0.95 quantiles, when the predictions of the conditional variances from Full BEKK are regressed on those from DBEKK (Figure 6). In all cases, except for one, shown in Figure 5 and Figure 6, the estimates at the lowest 0.05 quantile reveal a relationship between the two sets of estimates that is markedly different from that suggested by ordinary least squares, which captures the average relationship. The relationship is markedly different, at this quantile, frequently by ten to twenty percent.
Another startling feature is that all the slopes depicted in Figure 5 and Figure 6 are strongly positive, in that the estimated slope coefficients all increase, with one exception, from the lowest to the highest quantile. Thus, the conditional variances estimated from the Full BEKK model, are much higher, at the 0.95 quantile, often by 20 percent or more, than the conditional variance estimated by the DBEKK model.
These results have strong implications if we try use the two multivariate models to estimate portfolio risk. The analysis reported in the paper, on these simulated financial return series, suggests that the use of the Full BEKK model will underestimate conditional variances in the left-hand tail of the portfolio return distribution, relative to DBEKK, and overestimate it in the right-hand tail of the distribution.
These results are subject to certain caveats. We have estimated the models using the Estima Rats econometric package, and used the default settings when fitting the models. We have not changed any of the tolerances in the algorithms used to fit the models, or changed the settings for the initialization of the algorithms used to commence the models. We have also instructed the program to use the BHHH optimization procedure to fit the models. All the models have been fitted using a Gaussian distribution, and the estimates would be different if we used a t-distribution. (We also did some analysis using the t-distribution, which is not reported in the paper, that revealed a virtually identical pattern of relationships across the quantiles to those that that are reported in the paper). The intention was to use a consistent approach to the fitting of the models and then to explore the consistency of the results.
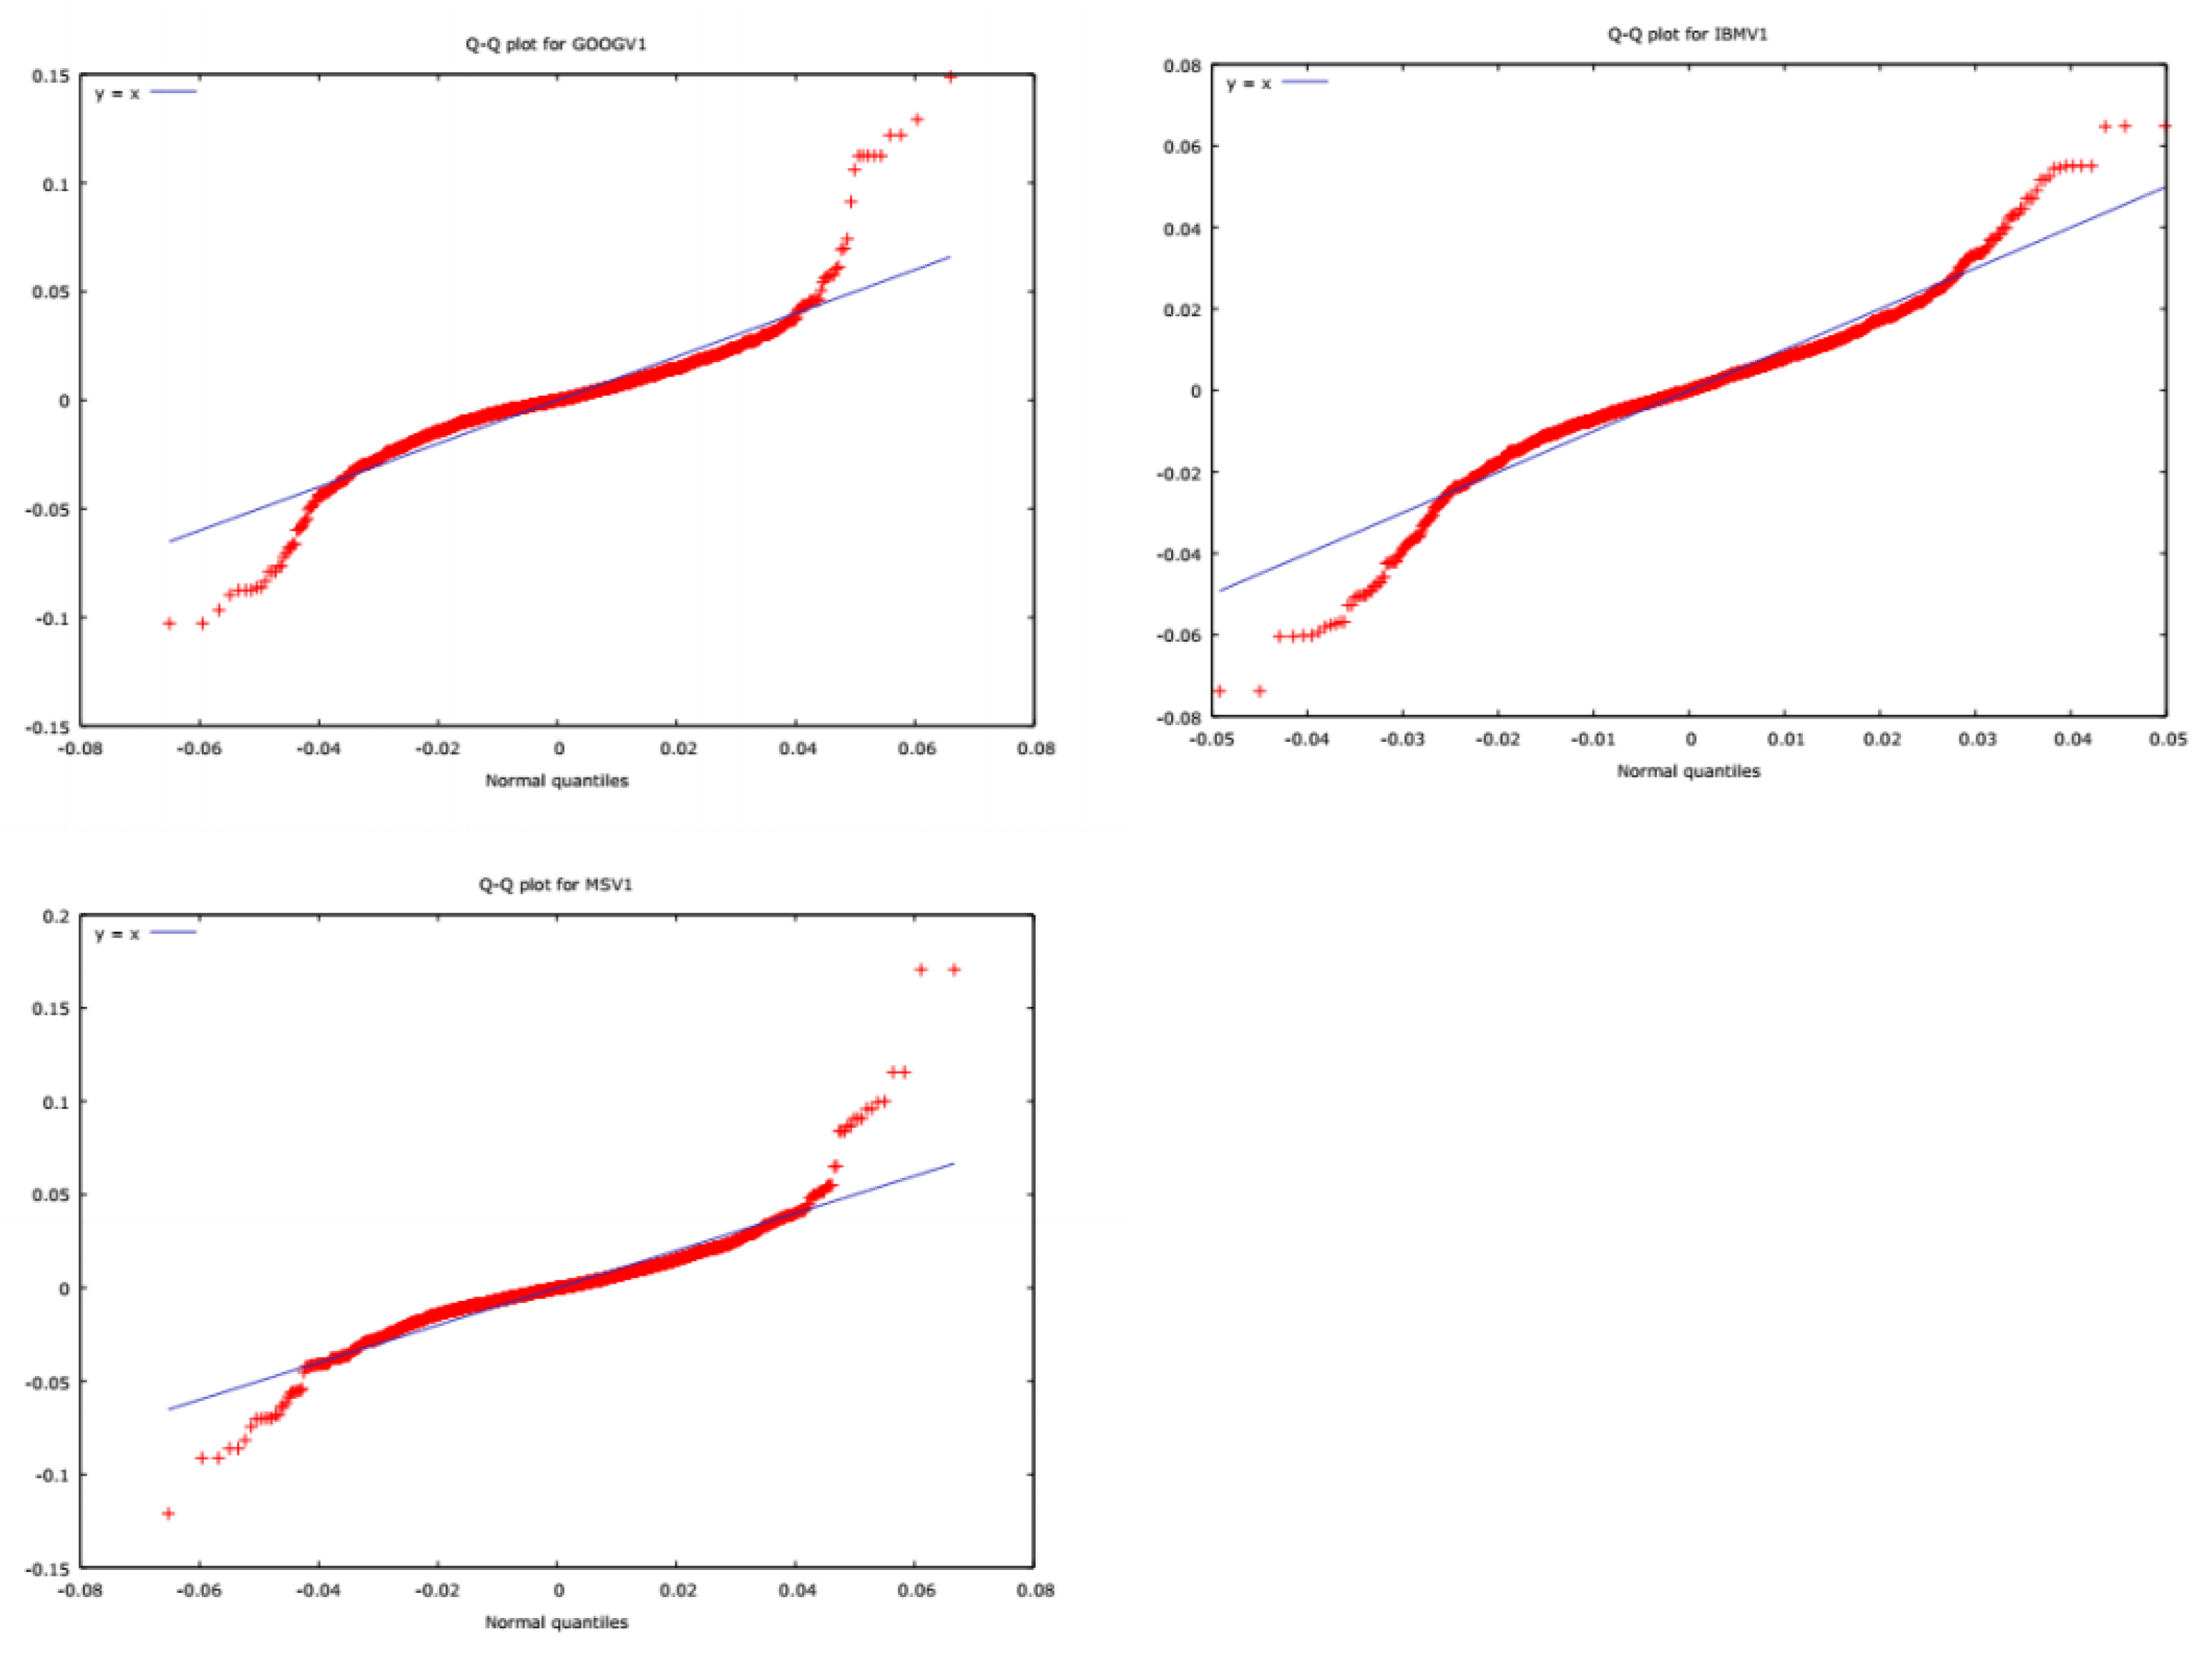
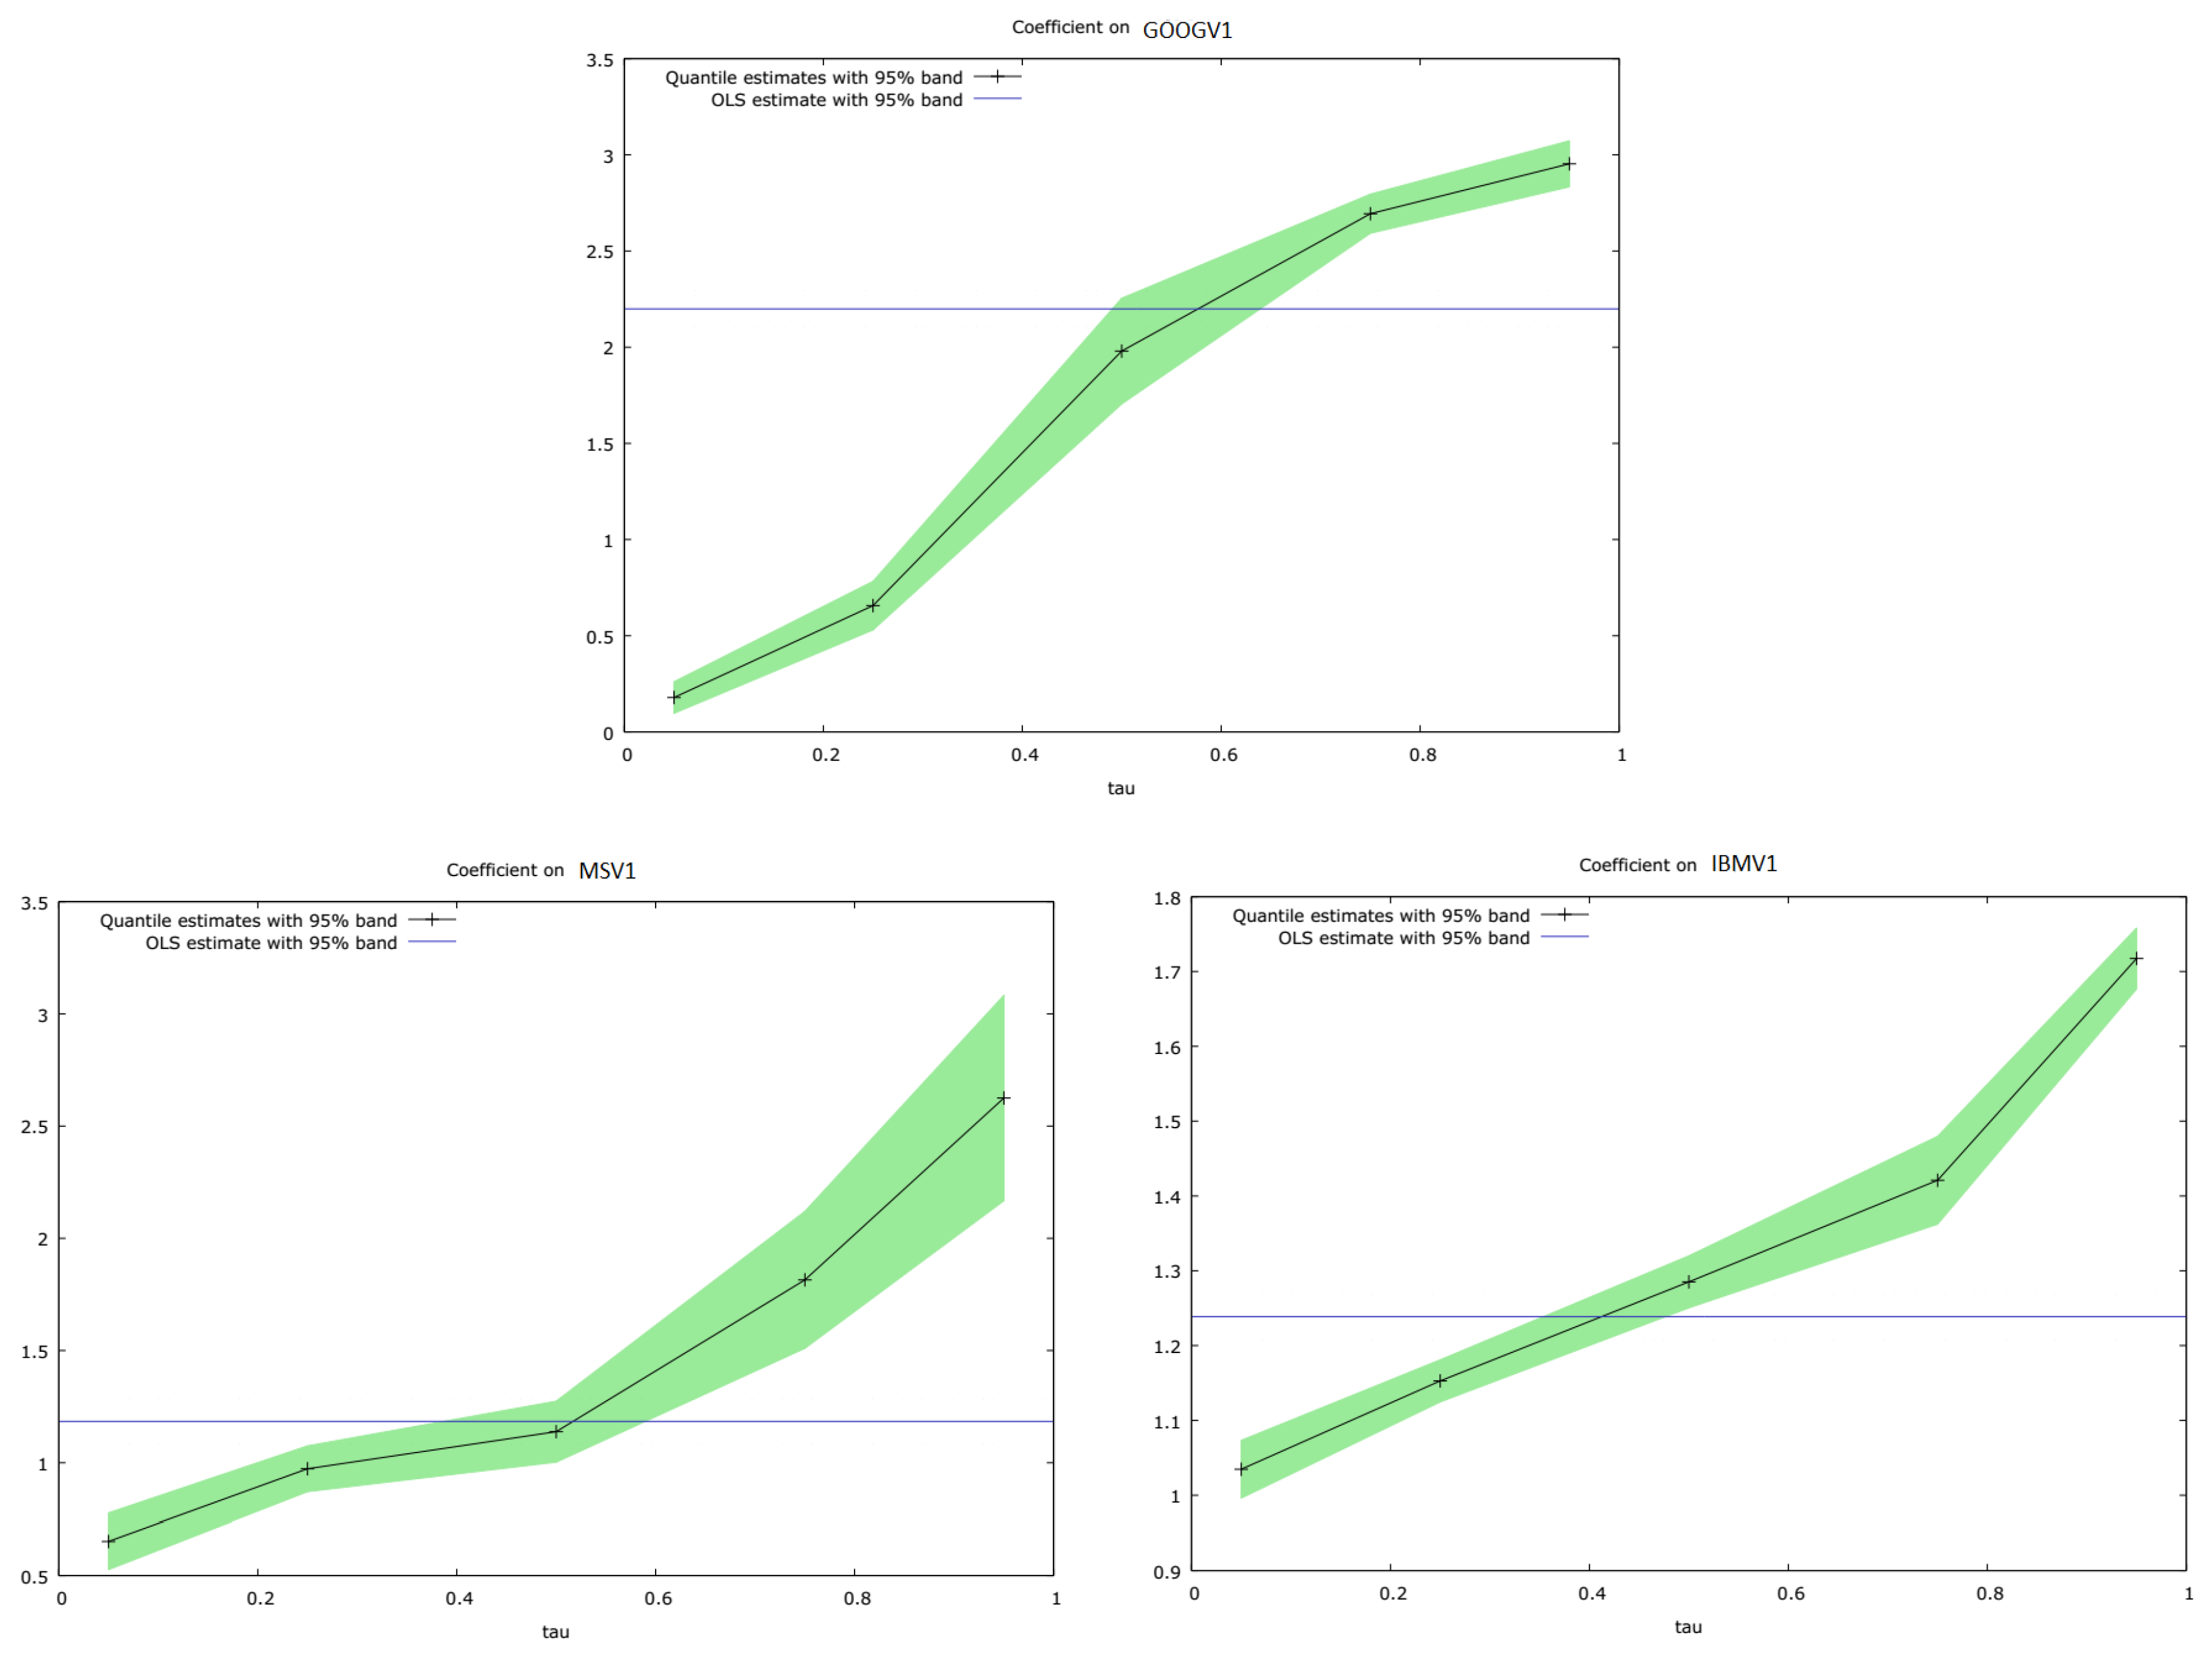
We also estimated DBEKK and Full BEKK using three variables jointly, in this case, GOOGV1, IBMV1, and MSV1, just to check that similar behaviour was displayed when we employed a trivariate estimation procedure. The results are shown in Table 10.
It is evident in Table 10 that many of the additional terms included in the Full BEKK model are not statistically significant, at least in this simulated data set. We also ran a quantile regression analysis of the conditional variances produced by Full BEKK, regressed on the conditional variances producd by DBEKK, using these three securities. The results are shown in Table 11. Plots of the quantile regression slope coefficients are shown in Figure 7.
It can be seen in Table 11 and in Figure 7, respectively, that exactly the same pattern of results emerges, when we estimate DBEKK and Full BEKK on three securities jointly, as previously the case with pairs of securities. The conditional variance estimates for Full BEKK, relative to DBEKK, are comparatively lower in the 0.05 quantile, increase across the quantiles, and are relatively higher in the 0.95 quantile. If the estimates were the same, the slope coefficient would be unity.
We used the DBEKK model as a benchmark, given that the statistical properties of this model have been established. The results, using this benchmark, suggest that there is an observable and relative bias in the predictions of the conditional variances from the Full BEKK model. This has serious practical implications about the use of Full BEKK for risk management and modelling purposes.

4. Conclusions

This paper explored the relative biases in the estimation of the Full BEKK model, as compared with the Diagonal BEKK model, which is used as an empirical benchmark. Chang and McAleer [14] showed that univariate GARCH is not a special case of multivariate GARCH, specifically the Full BEKK model, and demonstrate that Full BEKK, which, in practice, is estimated almost exclusively in the literature, has no underlying stochastic process, regularity conditions, or asymptotic properties. Diagonal BEKK (DBEKK) does not suffer from these limitations, and hence provides a suitable benchmark.
We used simulated financial returns series to contrast the estimates of the conditional variances from DBEKK and Full BEKK. The results of thr non-parametric tests on their values shows evidence of considerable bias in the Full BEKK estimates relative to those of DBEKK. The results of quantile regression analysis showed there was a systematic relationship between the two sets of estimates as we moved across the quantiles. Estimates of conditional variances from Full BEKK, relative to those from DBEKK, are relatively lower in the left tail and higher in the right tail. The phenomenon appears to be all-pervasive in estimates reported in the simulated financial return series. This result has serious practical implications for the use of Full BEKK as a risk management tool.
In the introduction, we cited studies that employ the BEKK model to explore volatility transmission, and financial market linkages, to name a few applications. It is important that investors and financial policy makers are fully aware of the limitations of the full BEKK model, before they seek to apply the results of any analysis incorporating its findings to real world issues.

Author Contributions

D.A. and M.M. conceived the paper, D.A. did the analysis, D.A. and M.M. wrote up the paper.

Funding

This research received no external funding.

Acknowledgments

For financial support, the first author acknowledges the Australian Research Council, and the second author wishes to thank the Australian Research Council, and the National Science Council, Taiwan. The authors are grateful to A.K. Singh for R coding suggestions.

Conflicts of Interest

The authors declare no conflict of interest.

References

  1. Engle, R. Autoregressive conditional heteroscedasticity with estimates of the variance of United Kingdom inflation. Econometrica 1982, 50, 987–1007. [Google Scholar] [CrossRef]
  2. Bollerslev, T. Generalised autoregressive conditional heteroscedasticity. J. Econom. 1986, 31, 307–327. [Google Scholar] [CrossRef]
  3. Glosten, L.R.; Jagannathan, R.; Runkle, D.E. On the relation between the expected value and volatility of nominal excess return on stocks. J. Financ. 1993, 48, 1779–1801. [Google Scholar] [CrossRef]
  4. McAleer, M.; Hafner, C. A one line derivation of EGARCH. Econometrics 2014, 2, 92–97. [Google Scholar] [CrossRef] [Green Version]
  5. Nelson, D. ARCH models as diffusion approximations. J. Econom. 1990, 45, 7–38. [Google Scholar] [CrossRef]
  6. Nelson, D. Conditional heteroskedasticity in asset returns: A new approach. Econometrica 1991, 59, 347–370. [Google Scholar] [CrossRef]
  7. Baba, Y.; Kraft, R.F.E.D.; Kroner, K.K. Multivariate Simultaneous Generalized ARCH; Department of Economics, University of California: San Diego, CA, USA, 1985; Unpublished work. [Google Scholar]
  8. Engle, R.; Kroner, K. Multivariate simultaneous generalized ARCH. Econom. Theory 1995, 11, 122–150. [Google Scholar] [CrossRef]
  9. McAleer, M.; Chan, F.; Hoti, S.; Lieberman, O. Generalized autoregressive conditional correlation. Econom. Theory 2008, 24, 1554–1583. [Google Scholar] [CrossRef]
  10. Gounopoulos, D.; Molyneux, P.; Staikouras, S.K.; Wilson, J.O.S.; Zhao, G. Exchange rate risk and the equity performance of financial intermediaries. Int. Rev. Financ. Anal. 2013, 29, 271–282. [Google Scholar] [CrossRef] [Green Version]
  11. Long, L.; Tsui, A.K.; Zhang, Z. Estimating time-varying currency betas with contagion: New evidence from developed and emerging financial markets. Jpn. World Econ. 2014, 30, 10–24. [Google Scholar] [CrossRef]
  12. Caporale, G.M.; Ali, F.M.; Spagnolo, N. Exchange rate uncertainty and international portfolio flows: A multivariate GARCH-in-mean approach. J. Int. Money Financ. 2015, 54, 70–92. [Google Scholar] [CrossRef]
  13. Cardona, L.; Gutierrez, M.; Agudelo, D.A. Volatility transmission between US and Latin American stock markets: Testing the decoupling hypothesis. Res. Int. Bus. Financ. 2017, 39, 115–127. [Google Scholar] [CrossRef] [Green Version]
  14. Chang, C.L.; McAleer, M. The Fiction of Full BEKK; Working Paper; TI 2017-015/III Tinbergen Institute Discussion Paper; SSRN: Rochester, NY, USA, 2017. [Google Scholar]
  15. Tsay, R. Conditional heteroscedastic time series models. J. Am. Statist. Assoc. 1987, 82, 590–604. [Google Scholar] [CrossRef]
  16. Christensen, T.M.; Hurn, A.H.; Lindsay, K. The Devil is in the Detail: Hints for Practical Optimisation. Econ. Anal. Policy 2008, 38, 345–368. [Google Scholar] [CrossRef] [Green Version]
  17. Berndt, E.; Bronwyn, H.R.H.; Hausman, J. Estimation and inference in nonlinear structural models. Ann. Soc. Meas. 1974, 3, 653–665. [Google Scholar]
  18. McCullough, B. The Devil is in the Detail: Hints for Practical Optimisation—A Comment. Econ. Anal. Policy 2009, 39, 155–157. [Google Scholar] [CrossRef]
  19. McCullough, B.; Vinod, H. The numerical reliability of econometric software. J. Econ. Lit. 1999, 37, 633–665. [Google Scholar] [CrossRef]
  20. McCullough, B.; Renfro, C. Some numerical aspects of non-linear estimation. J. Econ. Soc. Meas. 2000, 26, 63–77. [Google Scholar]
  21. Koenker, R.; Bassett, G. Regression Quantiles. Econometrica 1978, 46, 33–50. [Google Scholar] [CrossRef]
Figure 1. Plots of return series.
Energies 11 01627 g001
Figure 2. QQplots of return series.
Energies 11 01627 g002
Figure 3. Simulated time series of returns.
Energies 11 01627 g003
Figure 4. QQplots of Series 1 of the simulations.
Energies 11 01627 g004
Figure 5. Quantile regression slope coefficients of conditional variance from Full BEKK regressed on DBEKK estimates (first 10 pairs).
Energies 11 01627 g005
Figure 6. Quantile regression slope coefficient estimates of conditional variance from Full BEKK regressed on DBEKK estimates (remaining pairs).
Energies 11 01627 g006
Figure 7. Quantile regression slope coefficient estimates of conditional variance from Full BEKK regressed on DBEKK estimates for GOOGV1, MSV1, and IBMV1.
Energies 11 01627 g007
Table 1. Descriptive statistics for daily adjusted-return series.
StatisticIBMGoogleMicrosoft
MEAN0.0003552920.0005264220.000432804
MEDIAN0.0005055220.0002677080.000221015
SD0.01415560.01861570.0177392
SKEWNESS−0.1853810.6085220.184534
KURTOSIS5.3607511.90789.48851
Table 2. Base series unit root and ARCH tests.
StatisticIBMGoogleMicrosoft
ADF test with constant−28.8918−10.0804−29.7647
ADF test with constant and trend−28.8934−10.1019−29.7852
ARCH TEST alpha(0)0.0001450.0002570.000210
ARCH TEST alpha(1)0.2908480.3379970.373119
Note: All tests are significant at the 1% level.
Table 3. Descriptive statistics of the simulated series.
MedianMeanSt. DevSkewnessEx. Kurtosis
Google Sim 10.0001232420.0004347840.01850230.38702210.1534
Google Sim 20.0001051520.0009447410.02000211.6809815.8985
Google Sim 30.0001673540.0004937510.01857720.35408112.2140
IBM Sim 10.0003123010.0003329200.0139928−0.3086253.76076
IBM Sim 20.001035120.0009722900.01363690.1015444.52981
IBM Sim 30.0004223720.0004726660.0140378−0.03053466.05965
Microsoft Sim 10.0003392900.0007329680.01862490.79704410.8807
Microsoft Sim 20.0003360760.0001187180.0172592−0.1851549.83281
Microsoft Sim 37.86705e-0050.0002843650.01952870.31227511.3979
Table 4. Variable coefficient estimates for DBEKK and full BEKK.
DBEKKFull BEKK
C (1,1)C (2,2)A (1)A (2)B (1)B (2)C (1,1)C (2,2)A (1,1)A (1,2)A (2,1)A (2,2)B (1,1)B (2,2)
IBMVI, GOOGV10.008930.016810.37730.466980.670110.01026 *0.008940.016810.379760.02095 *0.00392 *0.463800.666280.01287 *
IBMV2, GOOGV20.007390.017470.32571−0.599690.770780.02727 *0.007460.015700.307260.13081−0.01782 *0.594060.77047−0.36849
IBMV3, GOOGV30.0083250.011850.470730.320440.659760.705510.01269 *0.00002 *0.46101−0.04771 *0.01276 *0.188600.670950.81205
GOOGV1, MSV10.0138840.012530.367310.475810.0565910.583790.016650.011160.430570.07513-0.104710.438400.10125 *0.646048
GOOGV2, MSV20.016510.011449−0.470290.53336−0.392790.533360.013660.000030.0413320.074260.09744 *0.765970.844130.32680
GOOGV3, MSV30.008350.0118460.470730.320440.659760.705510.00752−0.010700.447720.06484 *0.02899 *0.307160.705040.73385
IBMV1, MSV10.009060.009060.355820.551700.670420.492390.009090.012820.365320.06623−0.03269 *0.539450.660930.48406
IBMV2, MSV20.007600.011700.322900.574130.761890.483090.007380.011450.314170.07554−0.031470.529610.765310.50461
IBMV3, MSV30.008300.012630.4214470.522330.694870.5852040.007970.012530.42744−0.063570.01946 *0.537730.695030.56645
NB: All the coefficients in the above table are sigificant at the 1% level except those indicated by *.
Table 5. Conditional covariance coefficient estimates for DBEKK and Full BEKK.
DBEKKFull BEKK
C (2,1)C (2,1)A (1,2)A (2,1)B (1,2)B (2,1)
IBMVI, GOOGV1−0.00011 *−0.00052 *0.02095 *0.00392 *0.02271 *−0.04056 *
IBMV2, GOOGV20.001530.00003 *0.13081−0.01782 *0.04062 *0.05223 *
IBMV3, GOOGV30.00043 *0.02107 *−0.04771 *0.01276 *0.10412 *−0.28249 *
GOOGV1, MSV1−0.00024 *−0.001680.07513−0.10471−0.166660.13603
GOOGV2, MSV2−0.00019 *−0.01597 *0.07426 *0.097440.34576 *−0.33889
GOOGV3, MSV30.00043 *0.00337 *-0.05325 *0.00331 *0.09699 *−0.12799 *
IBMV1, MSV10.00019 *0.002260.06623−0.03270 *-0.207630.04362 *
IBMV2, MSV2−0.00005 *−0.00018 *0.07555−0.03148−0.08764 *0.09885
IBMV3, MSV30.000208 *−0.00223 *−0.063580.01947−0.02675 *−0.09230
NB: All the coefficients in the above table are sigificant at the 1% level except those indicated by *.
Table 6. Sign Tests of the differences in estimates produced by DBEKK and FULL BEKK: all coefficients.
Sign Test for difference between DBEKK and BEKK
Number of differences n = 53
Number of cases DBEKK > BEKK: W = 28 (52.83%)
Under the null hypothesis of no difference, W follows Bin (543, 0.5)
Probability (W <= 28) = 0.708434
Probability (W >= 28) = 0.391923
Sign Test for difference between DBEKK and BEKK Wilcoxon Signed-Rank Test
Number of differences n = 53
Null hypothesis: the median difference is zero
W+ = 739, W− = 745
(0 differences: 1, non-zero ties: 0)
Expected value = 742
Variance = 13,488.5
Z = −0.0215257
P (Z < −0.0215257) = 0.491413
Two- tailed p-value = 0.982826
Table 7. Sign Tests of the differences in estimates produced by DBEKK and FULL BEKK: significant coefficients.
Sign Test for difference between DBEKK and BEKK
Number of differences n = 48
Number of cases DBEKK > BEKK: W = 26 (54.17%)
Under the null hypothesis of no difference, W follows Bin (48, 0.5)
Probability (W <= 26) = 0.76456
Probability (W >= 26) = 0.332733
Sign Test for difference between DBEKK and BEKK Wilcoxon Signed-Rank Test
Number of differences n = 48
Null hypothesis: the median difference is zero
W+ = 618, W− = 606
(0 differences: 1, non-zero ties: 0)
Expected value = 612
Variance = 10,106
Z = 0.0547108
P (Z < 0.0547108) = 0.478184
Two- tailed p-value = 0.956369
Table 8. Sign Tests of differences in the predicted conditional variances of DBEKK and FULL BEKK.
SecurityNumber of DifferencesZ ScoreProbability
IBMV1/GOOGV12518(IBMV1CV)z = 8.66177P (Z > 8.66177) = 0
IBMV1/GOOGV12518(GOOGV1CV)z = 8.66177P (Z > 8.66177) = 0
IBMV2/GOOGV22518(IBMV2CV)z = −70.7228P (Z < −70.7228) = 0
IBMV2/GOOGV22518(GOOGV2CV)z = −17.8438P (Z < −17.8438) = 1.61378 × 10 71
IBMV3/GOOGV32518(IBMV3CV)z = −178.968P (Z < −178.968) = 0
IBMV3/GOOGV32518(GOOGV3CV)z = −178.682P (Z < −178.682) = 0
IBMV1/MSV12518(IBMV1CV)z = 10.0413P (Z > 10.0413) = 0
IBMV1/MSV12518(MSV1CV)z = 21.2183P (Z > 21.2183) = 0
IBMV2/MSV22518(IBMV2CV)z = 27.6135P (Z > 27.6135) = 0
IBMV2/MSV22518(MSV2CV)z = 9.78013P (Z > 9.78013) = 0
IBMV3/MSV32518(IBMV3CV)z = 25.524P (Z > 25.524) = 0
IBMV3/MSV32518(MCV3CV)z = 41.8977P (Z > 41.8977) = 0
GOOGV1/MSV12518(GOOGV1CV)z = 4.39668P (Z > 4.39668) = 5.49587 × 10 6
GOOGV1/MSV12518(MSV1CV)z = −21.4004P (Z < −21.4004) = 6.62768 × 10 102
GOOGV2/MSV22518(GOOGV1CV)z = −169.726P (Z < −169.726) = 0
GOOGV2/MSV22518(MSV2CV)z = −178.718P (Z < −178.718) = 0
GOOGV3/MSV32518(GOOGV3CV)z = 36.0083P (Z > 36.0083) = 0
GOOGV3/MSV32518(MSV3CV)z = −17.9135P (Z < −17.9135) = 4.62876 × 10 72
Table 9. Quantile regression of predicted conditional variances for Full BEKK.
SecurityQuantile Slope Coefficients
0.050.250.500.750.95
IBMV1/GOOGV1(IBMCV)0.9708530.9954441.007061.012741.02605
IBMV1/GOOGV1(GOOGCV)0.9524300.9748880.9876850.9984751.01715
IBMV2/GOOGV2(IBMV2CV)0.8620030.8947230.9133000.9305000.966278
IBMV2/GOOGV2(GOOGV2CV)0.8604210.9622260.9934311.028051.15073
IBMV3/GOOGV3(IBMV3CV) 1 0.3289280.3289280.4165810.4629950.532234
IBMV3/GOOGV3(GOOGV3CD)0.9222880.9564210.9854301.013351.01855
IBMV1/MSV1(IBMV1CV)0.9499421.010371.039861.064831.12862
IBMV1/MSV10.8542670.9314720.9591370.9894541.00981
IBMV2/MSV2(IBMV2CV)0.8619480.9518560.9874611.031751.13855
IBMV2/MSV2(MSV2CDV)−49.6363−5.29685−1.970489.2084018.2802
IBMV3/MSV3(IBMV3CV)1.006331.051961.076481.099111.15981
IBMV3/MSV3(MSV3CV)0.9401770.9981151.039391.067271.12067
GOOGV1/MSV1(GOOGV1CV)0.08319020.6609191.222511.363711.52337
GOOGV1/MSV1(MSV1CV)0.7534830.8375980.9009261.068521.20022
GOOGV2/MSV2(GOOGV2CV) 1 0.007445990.007626280.007294330.0188172−0.0147150
GOOGV2/MSV2(MSV2CV)0.9777581.583181.926462.035052.17220
GOOGV3/MSV3(GOOGV3CV) 2 0.9111080.9211000.9546181.030091.09428
GOOGV3/MSV3(MSV3CV)0.8674990.9170090.9559800.9882181.01098
Notes: All the slope coefficients across the quantiles estimated using robust errors are significant at the 1% level. 1 Problems with convergence encountered in the Full BEKK model. 2 Estimation of the Full BEKK model in this case failed to converge using BHHH, so we switched to BFGS.
Table 10. Variable coefficient estimates for DBEKK and Full BEKK, GOOGV1, IBMV1, and MSV1.
DBEKK
C (1,1)0.012260.02926
C (2,1)−0.00029 *−0.00119 *
C (2,2)0.013120.00083 *
C (3,1)−0.000001 *0.00364 *
C (3,2)0.00011 *0.00785 *
C (3,3)0.009020.00747 *
A (1)0.283460.47788
A (2)0.485300.48004
A (3)0.346390.36256
B (1)0.698990.28255 *
B (2)0.543120.80864
B (3)0.678930.78892
A (1,2)-0.26978
A (1,3)-0.02999 *
A (2,1)-−0.03014 *
A (2,3)-−0.01886 *
A (3,1)-0.11740 *
A (3,2)-0.17046 *
B (1,2)-−0.42607 *
B (1,3)-−0.09707 *
B (2,1)-0.00375 *
B (2,3)-0.01354 *
B (3,1)-−0.15853 *
B (3,2)-−0.16545 *
NB: All the coefficients in the above table are sigificant at the 1% level except those indicated by *.
Table 11. Quantile regression results, predicted conditional variance from Full BEKK as the dependent variable, GOOGV1, MSV1, and IBMV1 regressed on predicted conditional variance from DBEKK.
SecurityQuantile
0.050.250.50.750.95
GOOGV1 Conditional Variance0.1789980.6566541.979672.693742.95327
MSV1 Conditional Variance0.6517300.9731311.138491.814882.62494
IBMV1 Conditional Variance1.034711.152791.285221.421001.71742
NB: All the coefficients in the above table are sigificant at the 1% level.

