1. Introduction
The exploitation of Shallow Geothermal Energy (SGE) using Ground Source Heat Pumps (GSHP) linked to Borehole Heat Exchangers (BHE) has become popular in Europe for heating and cooling purposes [
1]. Widespread BHE application to exploit SGE could help European countries meet their commitments in terms of energy saving, renewable energy use, and carbon dioxide emissions reduction [
2]. However, the current state of technology uptake in the EU varies across Member States, and significant barriers limiting investments still exist [
3]. Increasing the use of SGE systems in Europe could be achieved by (1) moderating investment costs (drilling, grouting, tubing and pipes); (2) reducing system complexity and safety issues (drilling depth, site-working conditions); and (3) enhancing SGE recovery rates [
4]. In addition to the technical aspects, the interaction between BHEs and the environment must be considered during the design phase. Last but not least, European environmental protection regulations governing the thermal variations permitted between subsoil, groundwater, and BHE differ from country to country [
5].
The economic value of shallow geothermal projects could be more accurately assessed by improved evaluation of subsoil temperature distribution. Optimum underground thermal conditions for both heating and cooling purposes are usually located in the
neutral zone, where temperatures do not follow seasonality; that is, they are constant over time and not significantly influenced by the geothermal heat flow [
6].
It is also important that defining a geothermal system’s exploitable energy rates is directly based on end-user needs [
7]. These are site-specific and depend on climate conditions, building type, distribution system, working temperatures, and local energy saving regulations, variables that make it difficult to generalize the shallow geothermal potential of a geographical area, even when equivalent subsoil parameters and temperature distribution are known. For example, although a feasibility study performed in the Eastern Alps [
8] showed the energy lining of a mountain tunnel to be a profitable and relatively low cost geothermal solution, the specific local conditions—energy user locations, the existing distribution network, and local regulations—made the investment inappropriate.
In addition, BHE depth, dependent on ground temperature distribution, also affects drilling and installation costs, as do all other ground-work factors (worker safety, environmental protection, social acceptability—especially in an urban context—and available working area). Moreover, in the planning phases, other factors such as population density, land cover and availability, and the cost of alternative fuels must be considered when evaluating investment feasibility [
9].
Finally, the effective suitability of a given area for shallow geothermal installation depends on how all of the above aspects relate to each other in the local context.
The GEOTeCH project (
www.geotech-project.eu) aims to enhance the potential of an integrated package made up of drilling technique, borehole heat exchanger, and heat pump. The “hollow stem auger” drilling technique—a cheap, dry, fast drilling technology suitable for unconsolidated subsoil layers—was chosen for BHE installation [
10]. However, since this technology cannot be used to install BHEs in rocky underground, its market potential is confined to very shallow underground layers and alluvial plains where there are no rocky outcrops. So, while dry drilling could help drive the geothermal sector, its feasibility is strongly conditioned by the depths required. The technology is especially suitable for installing coaxial borehole heat exchangers, which can be directly positioned through the auger casing. Although the total length of these BHEs is generally moderate on account of transport and installation problems and related costs, they have a high heat transfer surface area per metre [
11,
12] and, if efficiently coupled to hybrid dual source heat pumps, can be part of a heating system in which the ground source energy component covers only part of the total thermal energy load requirement (usually the base load). This solution in turn reduces BHE field extension [
13,
14].
A feasibility study was carried out within the framework of GEOTeCH project to provide a European-wide geolocalized suitability index for an integrated energy package based on appropriate geothermal parameters and local constraints.
In the SGE sector, important results can be achieved by integrating deterministic and probabilistic modelling approaches, management tools, and multi-criteria analysis, which lead to improved environmental protection, wider social acceptance, lower investment costs, and a higher number of installations and working opportunities.
These factors can be included in Decision Support Systems (DSS): information systems that provide a framework for complex decision-making processes. The main function of a DSS is to design, generate, and present different alternatives and provide tools for their comparative analysis, ranking, and selection on the basis of decision-maker criteria, objectives, and constraints. A DSS provides a systematic approach to decision analysis whereby value judgements and technical information are integrated to allow an overall view of the situation under examination and the implications deriving from the management decisions taken [
15].
Many researchers have attempted to identify potential shallow geothermal areas, especially by correlating subsoil conditions with the energy needs of typical residential end-users in a specific climate.
Ondreka [
16], in early 2007, used GIS-supported mapping to evaluate the shallow geothermal potential in the regions of the Upper Rhine Valley and the Black Forest in Baden-Wurttemberg, SW Germany. The work focused on the definition of specific heat extraction values for areas with different geological features. Table values from VDI 4640 German Norm were used to quantify the specific heat extraction related to a particular geological layer.
Bertermann [
17,
18] made a detailed study of the very first shallow layers (down to 10 m depth, very shallow geothermal potential vSGP), and created a WebGIS dynamic tool within the framework of the Thermomap Project. The method did not, however, consider seasonal changes in subsoil temperature due to heat flux variations.
Galgaro [
19] evaluated the technical–economic feasibility of heating and cooling GSHPs in 4 regions of southern Italy. The method was based on heat transfer simulations in order to calibrate empirical correlations. The geothermal energy exchange potential of a vertical BHE installed for a specified residential building—selected as a reference unit—was estimated for each geological and geographical unit. The resultant maps were then applied in a GIS environment using the standard inverse distance weight (IDW) interpolation. The research did not, however, include vSGP.
Gemelli [
20] presented a computational procedure to derive a regional model able to combine physical and economic variables evidencing GSHP potential of a target area. The procedure was developed in a GIS environment and applied to the Marche Region (Central Italy). The economic indicators of the resource (local demand for domestic heating, cost of installation, financial benefits for the regional budget) were taken into account. The study was based on certain assumptions, such as a uniform drilling cost of 50 €/m and a maximum BHE depth of 150 m.
Casasso [
21] also developed a method—called G.POT—to estimate the quantity of heat that can be sustainably exchanged by a BHE during a heating or cooling season. Starting from a benchmark of constant vertical subsoil temperatures on a two-dimensional map, the G.POT method calculated geothermal potential to meet air-conditioning thermal loads for air conditioning in the area of Cuneo (IT).
Santilano [
22] computed the 3D distribution of ground thermal conductivity in four sites in Sicily (Italy) characterized by a geologically complex mountainous belt whose lithology presented significant spatial variability. The depth-dependant thermal conductivity values obtained were then included on a GIS platform and used to define the optimum BHE length and heat exchange potential based on simplified equations.
García-Gil [
23] studied the potential of BHEs and groundwater heat pumps (GWHPs) by quantifying the maximum thermal power per surface unit that can be exchanged with the ground without producing a temperature change or piezometric drop higher than a threshold value at a maximum distance of influence from the exploitation point. The method developed allowed vertical integration of the layers of the geological model for each area of interest and also included the advection term caused by the groundwater flow. The author’s baseline assumptions were as follows: homogeneous ground, semi-infinite medium with a uniform initial temperature, physical properties independent of temperature, and constant heat flow. The method was applied to the metropolitan area of Barcelona [
24].
As part of the GRETA EU-funded project, Casasso [
25] studied the economic viability of BHEs as a function of ground properties. Conducted in the Slovenian mountain town of Gerkno, the resultant maps indicating SGE potential provided a decision-support tool for future installations.
Tufekci [
26] used a GIS-based Multi-Criteria Decision Analysis (MCDA) to define geothermal energy potential in Western Anatolia.
In other studies, strategic planning tools, such as SWOT analysis, have been applied when planning shallow geothermal resources [
27]. In addition, the Analytical Hierarchy Process (AHP) has been applied to MCDA to explore deep geothermal resources in a basin in Turkey [
28] and assess energy source policies [
29].
The MCDA tools are used to evaluate and rank both technical indicators and other more qualitative policy considerations and constraints. In fact, the degree of subjectivity of choices made by individuals, decision-makers, managers, stakeholders, and interest groups depends on the relative importance of the criteria used to evaluate the alternatives. GIS-based MCDA provides an all-embracing view of the factors involved in this sort of policy decision-making [
30]. The AHP defines a methodology within which to apply a MCDA to assist decision-making [
31,
32], providing a decision analysis framework for issues involving natural resources management, improving the quality of decisions, and justifying the actions to be taken. The framework allows critical examination of the underlying assumptions as well as judgement consistency, and facilitates the combination of qualitative subjective considerations and quantitative factors in the decision-making setting. In energy source management issues, the AHP is mostly applied when teams of people work on complex problems involving human perceptions and judgements and where decisions will have long-term repercussions. The AHP has been widely applied in DSS systems concerned with managing natural resources and environmental problems [
33,
34].
In the GEOTeCH Project, the factors influencing the profitability of the integrated technologies described were assessed and weighted, starting from the available information on the area’s natural and anthropogenic features. However, as the standard analytical and probabilistic models used to perform the different calculations differed in size and approach, direct comparison was not possible. A new GIS-based AHP–MCDA tool would allow this problem to be overcome.
This paper presents an innovative application of a GIS-based MCDA using the AHP to assess the suitability of shallow geothermal systems. The application investigated was the integrated package of GSHP technologies developed within the framework of the GEOTeCH Project.
2. Materials and Methods
Successfully exploiting SGE with the combined use of the GSHP technologies described above depends on many different factors such as the geological, geothermal, climatic, and anthropogenic features of the area in question. It follows that any assessment of operational feasibility and economic return on investment requires a comparative study of a series of selected representative criteria.
Fourteen parameters were identified as having an impact on SGE implementation. Five criteria were chosen for comparison using the GIS-based AHP–MCDA in order to define the SGE suitability of the area in question.
Each parameter has an impact on at least one criterion.
Table 1 gives the significant parameters and the criteria impacted.
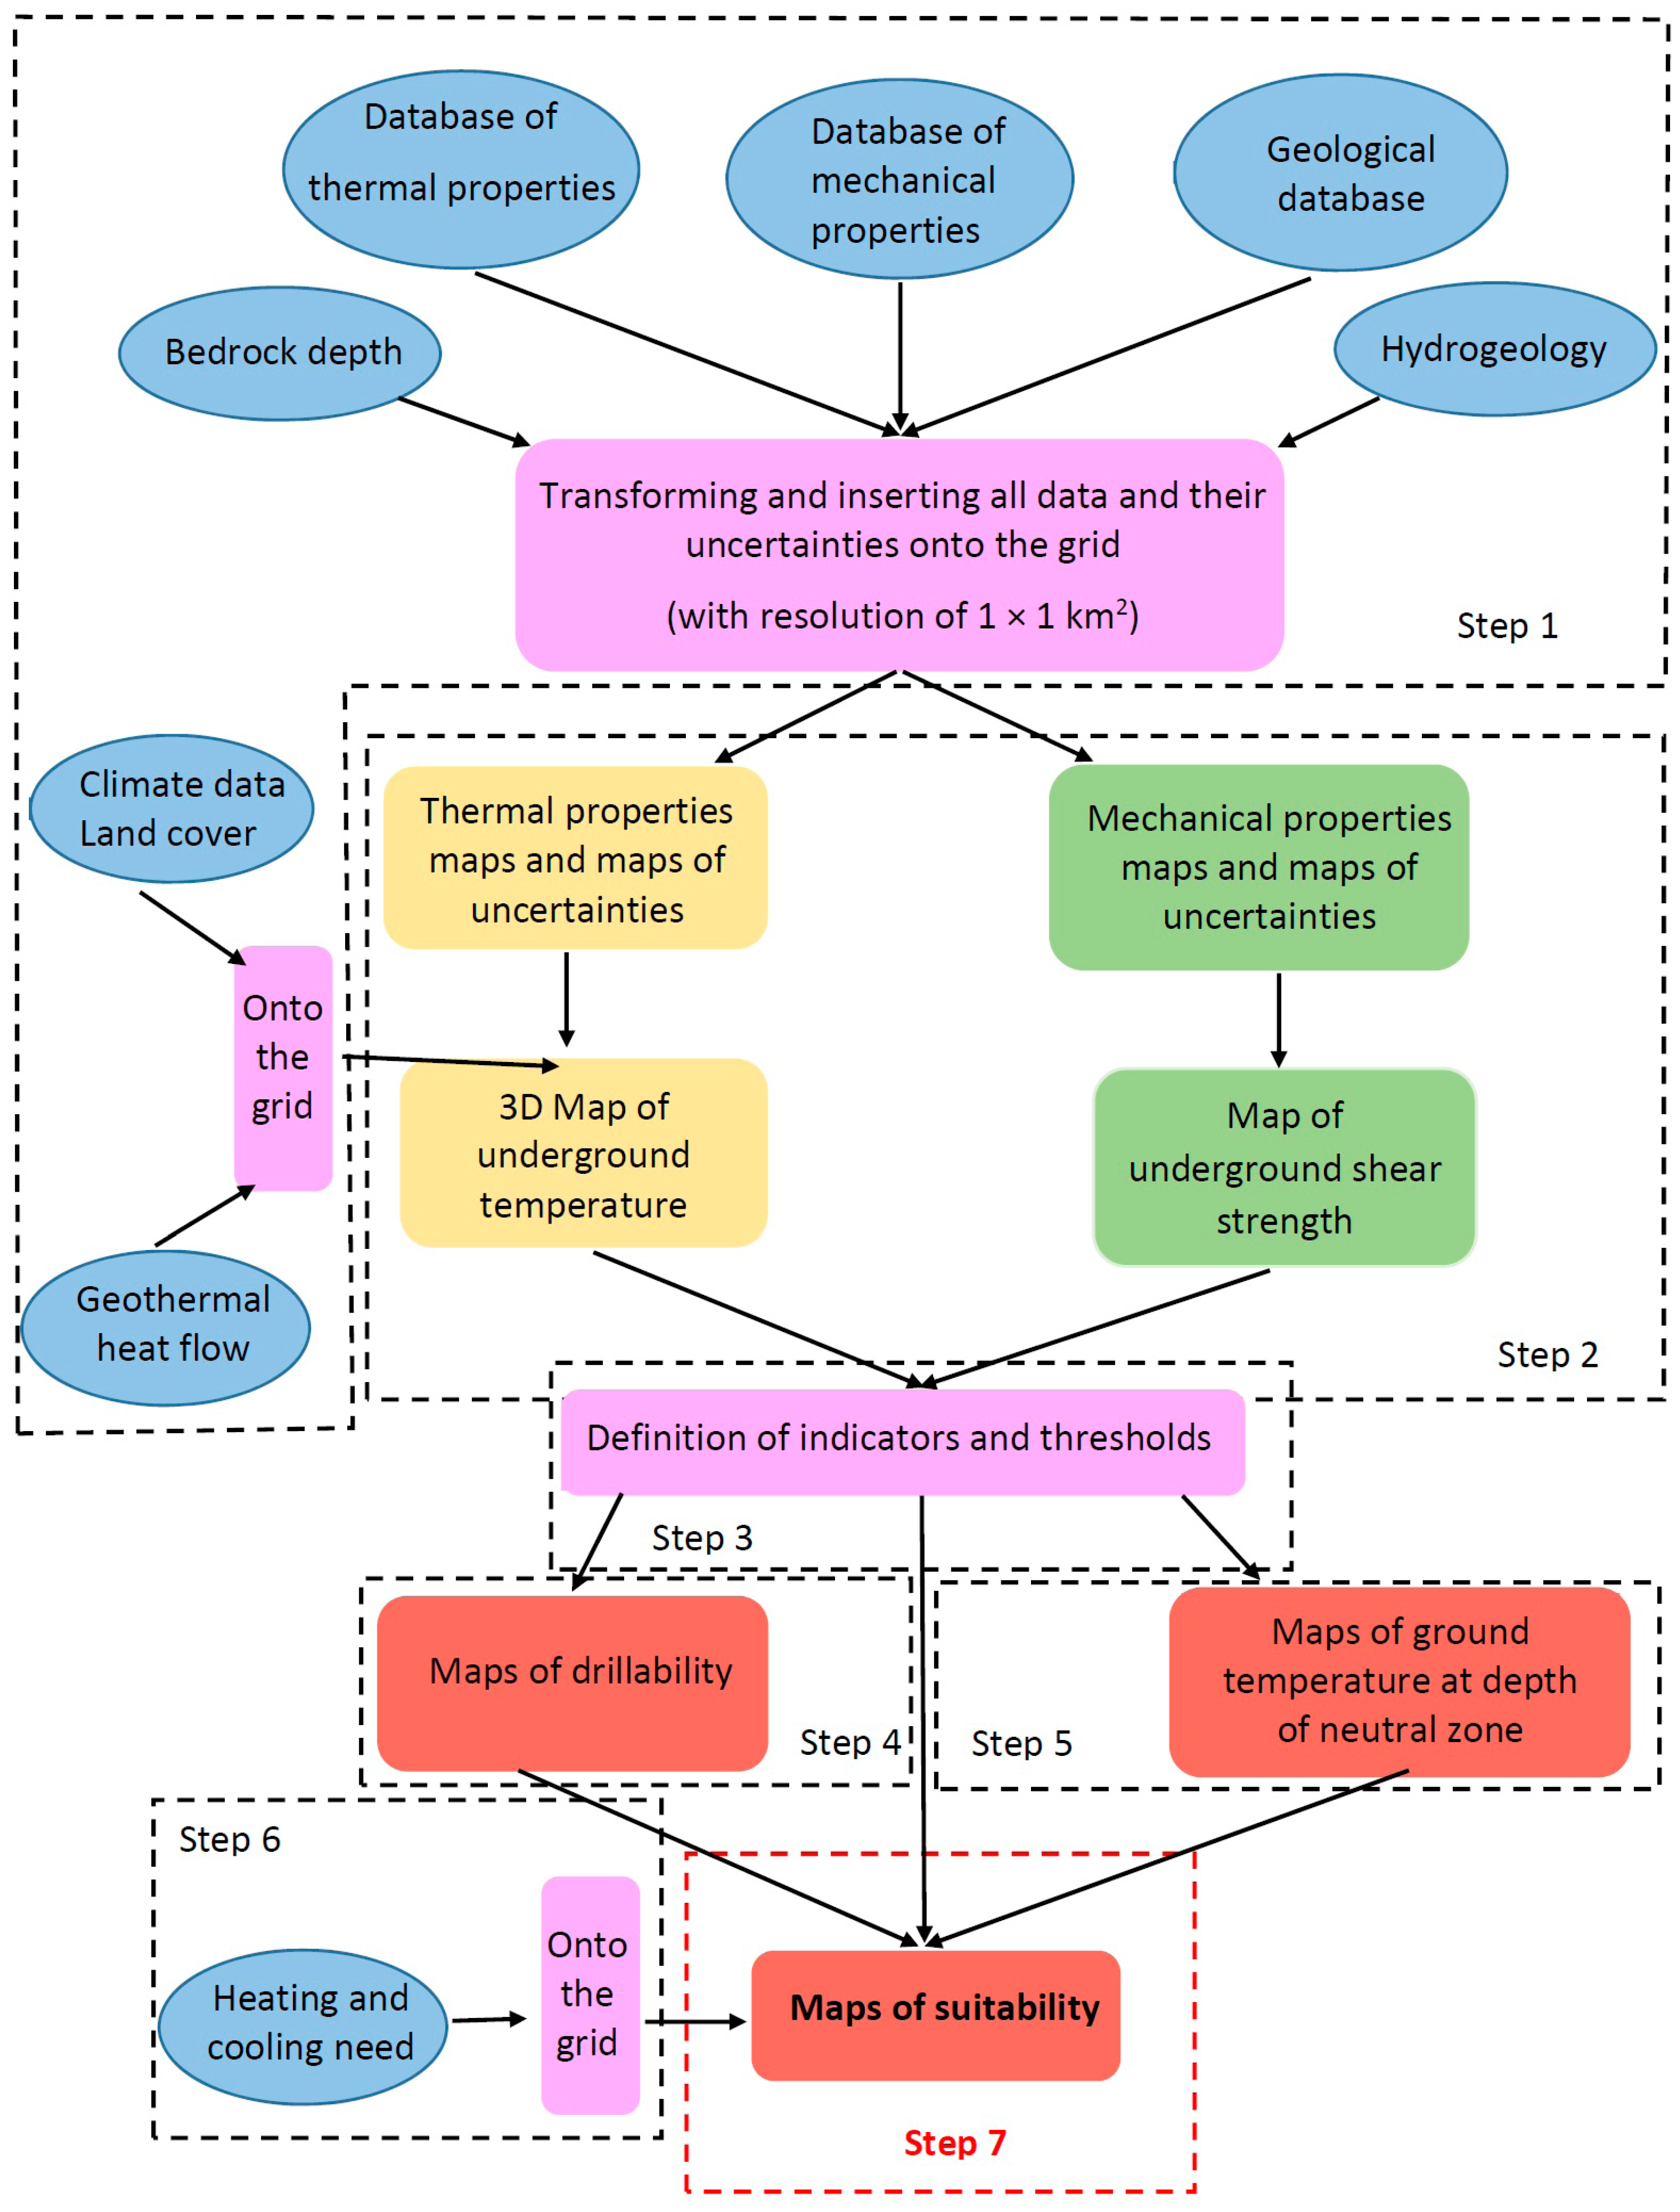
Starting from the fourteen geo-localized parameters, the five criteria were obtained through a combined probabilistic–deterministic process, whose steps are presented below:
Collection of all relevant data for the fourteen parameters at a European scale and their quality validation at different scales and locations;
Calculation of thermal and mechanical properties of ground layers and estimation of missing data and points using geostatistical techniques;
Definition of applicability and efficiency thresholds based on the technical specifications of GEOTeCH innovations;
Definition of a drillability index to identify the appropriate BHE installation areas, including the following data: characteristics of the selected drilling machine, depth of the bedrock, hydrogeology, geological units, and the mechanical properties of geological units;
Estimation of ground temperature evolution along depth and horizontally, including the analytical/probabilistic combination of ground thermal properties, climate, geothermal heat flow, and land cover (which will impact the subsurface urban heat island SUHI);
Assessment of energy demand (heating, cooling, or both) according to climate, geographical locations, and population density;
Definition of a suitability index, calculated using the GIS-based AHP–MCDA approach able to compare and process all relevant information in a single database and provide a global assessment score of SGE viability using a combination of the technologies investigated.
Data and results for Steps 1 to 6, specific to GEOTeCH technologies, were needed to be able to progress to Step 7; that is, to carry out comparisons using the GIS-based AHP–MCDA approach for each node of the grid. Details of the first six steps and the relative analytical and probabilistic calculations are presented in the
Supplementary Material.
All the points provided indications as to SGE feasibility in any part of Europe on the basis of the parameters and the thresholds set.
Figure 1 provides a schematic view of the workflow, showing how the fourteen parameters were inserted into the seven main steps of the process, and how they interrelate through to the final result, the suitability maps (Step 7).
The decision-making process involved in locating prospective areas for shallow geothermal energy exploitation entailed combining the results of all surveys and studies, a process that generated a set of feasible alternatives as well as multiple and often conflicting evaluation criteria. GIS was used to identify prospective areas by combining various digital data layers. The AHP was used to define the final Suitability Index database in Step 7.
2.1. The Analytic Hierarchic Process
In the AHP, unit scales are combined in a single priority scale [
35,
36]. The AHP helps the decision maker set priorities, providing a final indicator (the global score
GS), thereby reducing complex issues to a series of pairwise comparisons and synthesizing the results. The AHP considers a set of criteria
c, based on threshold values
t, selected either by subjective and objective considerations. Although both
c and
t influence the problem, the most impactful is chosen. A weight
w is calculated and assigned to each
c based on the operator’s pairwise comparisons of
c. The higher the
w, the more important the corresponding
c.
The pairwise comparison of the criteria
C is an
m ×
m matrix where each entry
I represents the importance of the
ci relative to the
cj. The matrix satisfies the following constraints (Equation (1)):
The relative importance of two
c is usually measured according to an indicator scale from 1 to 9, so that the larger the
I, the more important is the
ci criterion compared to the
cj criterion, while the relative importance of
cj compared to
ci is the reciprocal of the value on the indicator scale. The
w are then calculated by normalizing each matrix component by the sum of each column, and then calculating the mean for each row. This normalization process follows the weighting function developed by Saaty [
36]. Its equation is the following:
where
n is the number of criteria.
Next, relative scores s are attributed for each c, based on t. The higher the s, the more important is the t compared to the considered c. Finally, the AHP combines the w and the s, thus determining the GS, and a consequent ranking.
For each point of the grid, GS is a scalar product of the vector of the weights
W and the vector of the scores
S (Equation (3)).
In the presence of multiple parameters, the AHP enables operator evaluation consistency to be checked with a critical analysis of W, the results of C, and S, dependent on the choice of t, both intermediate steps before determining GS. This may be considered a robustness tool within the MCDA method that helps reduce bias in the ranking processes caused by unavoidable subjective operator choice.
The consistency of operator choices is evaluated by comparing the pairwise ratio of the calculated weights
wi with the indicators
Iij assigned by the operator through the Consistency Index (
CI). The
CI is calculated starting from the eigenvalues and eigenvectors of the matrix
C.
where
λmax is the main eigenvalue of the matrix. The
CI values represent the variance of the error incurred in estimating
Iij.
CI equal to 0 means that
λmax is equal to
n and full consistency is reached.
To check the value of the AHP conducted,
CI should be compared with the appropriate values of the Random Consistency Index
RI, reported in
Table 2 below [
36].
The results of the analysis are generally accepted if the Consistency Ratio
CR between
CI and
RI is inferior to 0.10 [
36].
The AHP steps can be summarized as follows:
Problem definition, selection of criteria c and their threshold values t;
Creation of the grid on which to attribute global score GS;
Development of comparison criterion matrix C and calculation of weights w;
Evaluation of the consistency of the vector of weights W;
Calculation of scores s for each decision point based on t;
Calculation of the global score GS at each node of the grid.
2.2. The Specific Use of AHP-MCDA on the GEOTeCH Project
The specific application of AHP to assess SGE consisted of defining the Suitability Index as GS, which is able to provide a qualitative evaluation of the market suitability and practical applicability of GSHP in a defined area.
As market suitability has a spatial behaviour, all pertinent parameters and criteria, as well as the corresponding AHP results, were geolocalized to produce a map of SGE suitable areas.
Threshold values t were inserted to define criteria c based on calculations deriving from the technical specifications of GEOTeCH technologies.
As previously introduced, the criteria c selected for the suitability index were:
- -
c1—Drilling potential;
- -
c2—Heating needs;
- -
c3—Cooling needs;
- -
c4—Insulation potential of ground from climate;
- -
c5—Deviation between ground and ambient temperature.
The suitability index, with all fourteen parameters and five criteria used to define it, was determined on the grid nodes on an EU scale. Calculated for a maximum geothermal project depth of 50 m, it provides an indication of the potential use of selected GSHP technologies (GEOTeCH integrated package) in Europe.
It is worth noting that the combined use of three technologies (hollow stem auger + coaxial BHE + dual source heat pump) overturns the standard rationale underpinning the design of GSHP systems whereby ground thermal conductivity plays a major role. In fact, using the three technologies system, the ground need not meet all the building’s energy requirements nor does optimum BHE length need to be found. The underlying concept of the integrated system is that any geothermal project exploiting ground energy should have as many short BHEs as can be installed on the available land, but—in the case that total building thermal load cannot be met—air source heating is used. Smart control systems ensure the most suitable natural source for the working temperatures required at any particular time. Hollow stem auger’s low drilling costs and the ease of installation of coaxial BHE should make the system advantageous compared with alternatives, especially the exclusive use of air source heat pumps. Return on investment is faster when the energy needs are higher, in particular when both heating and cooling are required over the year. As a result, the economic value of this sort of integrated geothermal solution depends only partly on the physical properties of the ground, such as thermal conductivity, and much more on drilling costs and the estimated ground temperature compared, for each time step, to ambient temperature.
As a result of this, three hierarchy levels of the AHP were identified:
- -
The first level includes the criteria defining the effective possibility of using GSHP technologies in a selected area. In this study, only drilling potential c1 falls into this category. Comprehensive information on geology, bedrock depth, and the presence of aquifers are gathered. Since dry drilling is a major feature of GEOTeCH innovation, drilling potential is all-important.
- -
The second level includes criteria defining the general economic value of using GEOTeCH technologies rather than cheaper renewable/electric/fossil fuel alternatives. In this study, a regional preliminary assessment of heating needs c2 and cooling needs c3 was included at the second level. Since heating requirements are an indispensable component of residential projects, they were considered higher on the hierarchical scale than cooling needs. This is particularly important in the case of specific GEOTeCH dual source heat pump technology, whose use in Mediterranean and hot climates is expected to be limited.
- -
The third level includes the parameters that could enhance shallow geothermal energy exploitation in a particular area. All the estimated ground thermal property values were condensed to produce an insulation potential of the ground layers from climate c4, defined by the depth of the neutral zone, and the related deviation between ground and ambient temperature c5, calculated combining the influences of geothermal gradient, average ambient temperature and the SUHI effect. The two criteria were considered almost equally influential on the shallow geothermal energy quota of a project, with a slight preference for c5, given the SUHI effect at shallow depths below cities and urban zones where GSHP technologies are expected to have a larger market than rural areas. In the case of short BHEs (GEOTeCH technology provides for a maximum depth of 50 m), estimating ground temperature at low depths is of major importance.
The indicator scale chosen to evaluate the relative importance of
ci and
cj includes only 4 levels (1 to 4), out of 9. This result was obtained by respecting the three hierarchy levels and after a critical analysis of the results of
W for all possible solutions. Assignments of higher levels (5 to 9) would have led to excessive imbalance among criteria, all of which have the same order of magnitude.
Table 3 presents details of the indicator scale selected for the comparison matrix.
In the comparison of the 5 criteria (c1, ..., c5), drilling potential (c1) was considered the most important, followed by heating needs (c2), and then cooling needs (c3). Insulation potential of ground from climate (c4) and deviation between ground and ambient temperature (c5) were judged almost equally important.
The criteria follow the logic behind the market potential of GEOTeCH technology: First, hollow stem auger technology should be the optimal drilling method for the assigned location (
c1); second, residential buildings in the assigned location should be provided with a consistent heating supply by the dual source heat pump under the specified conditions (
c2), followed by a consistent supply of cooling (
c3); third, the coaxial BHE should be able to exploit as much geothermal energy as possible at depths unperturbed by climate conditions and geothermal heat flow (
c4), the amount of which will depend on ground thermal behaviour, which in turn is dependent on the deviation between ground and ambient temperature (
c5). The thresholds were selected according to the technical specificities of the GEOTeCH innovations. The relation between criteria and their thresholds are presented in
Table 4 below.
The following scores
s were assigned to the alternatives of five criteria in a quasi-binary mode (
Table 5).
The reason for applying a linear relation between the value exceeding the assigned threshold and the relative score was so as not to excessively penalize those nodes with values close to the threshold of a particular criterion.
3. Results and Discussion
The following results derived from the application of the AHP–MCDA method (see
Section 2.1) to the GEOTeCH five criteria (see
Section 2.2). Therefore, the pairwise comparison matrix of the criteria
C was developed and is presented in
Table 6.
Normalizing each matrix component gave the vector of weights
W presented in
Table 7.
The classical application of the AHP would have indicated the need to adopt a 1 to 9 indicator scale. Had this been followed, c1 would have become completely predominant in all geographical conditions, while weak criteria would have appeared even less pertinent, with no real differentiation between c4 and c5. In addition, southern Europe would have been excessively penalized, the important ambient cooling potential not being sufficiently taken into account (c3).
The use of an indicator scale from 1 to 4, on the contrary, allowed reduction of the divergence in w between the first hierarchy level (represented by c1) and the second hierarchy level (represented by c2 and c3). In particular, the difference between c1 and c2 was less than 25%. Moreover, although c4 and c5 have very comparable w, their divergence was sufficiently significant to be apparent in the final GS. In this way, no predominant criteria were evidenced, nor did any criterion show an insignificant impact.
For each node on the grid, the scalar product of the vector of scores
S (
Table 5) and the vector of weights
W (
Table 7) provided the Suitability Index (the
GS). The assignment of Suitability Index values to the nodes of the European grid returned the suitable map of GEOTeCH technologies in Europe.
The degree of subjectivity was given by the following:
- -
The selection of thresholds for each parameter;
- -
The established hierarchy between parameters.
Thresholds were selected based on information from actual GSHP applications and the technical and scientific literature [
37,
38].
The hierarchy was defined by objective cause–effect evaluations based on specific integrated GEOTeCH technology (drilling, ground heat exchanger, and hybrid heat pump) described and discussed in the present paragraph.
The consistency of the subjective choices made by the GEOTeCH Consortium was verified on the matrix C, by using Equations (4) and (5). The results are presented in
Table 8.
As CR < 0.10, the choices were then judged consistent with respect to resulting weights.
- (1)
Drillability Index;
- (2)
Ground Temperature Evolution;
- (3)
Suitability Index.
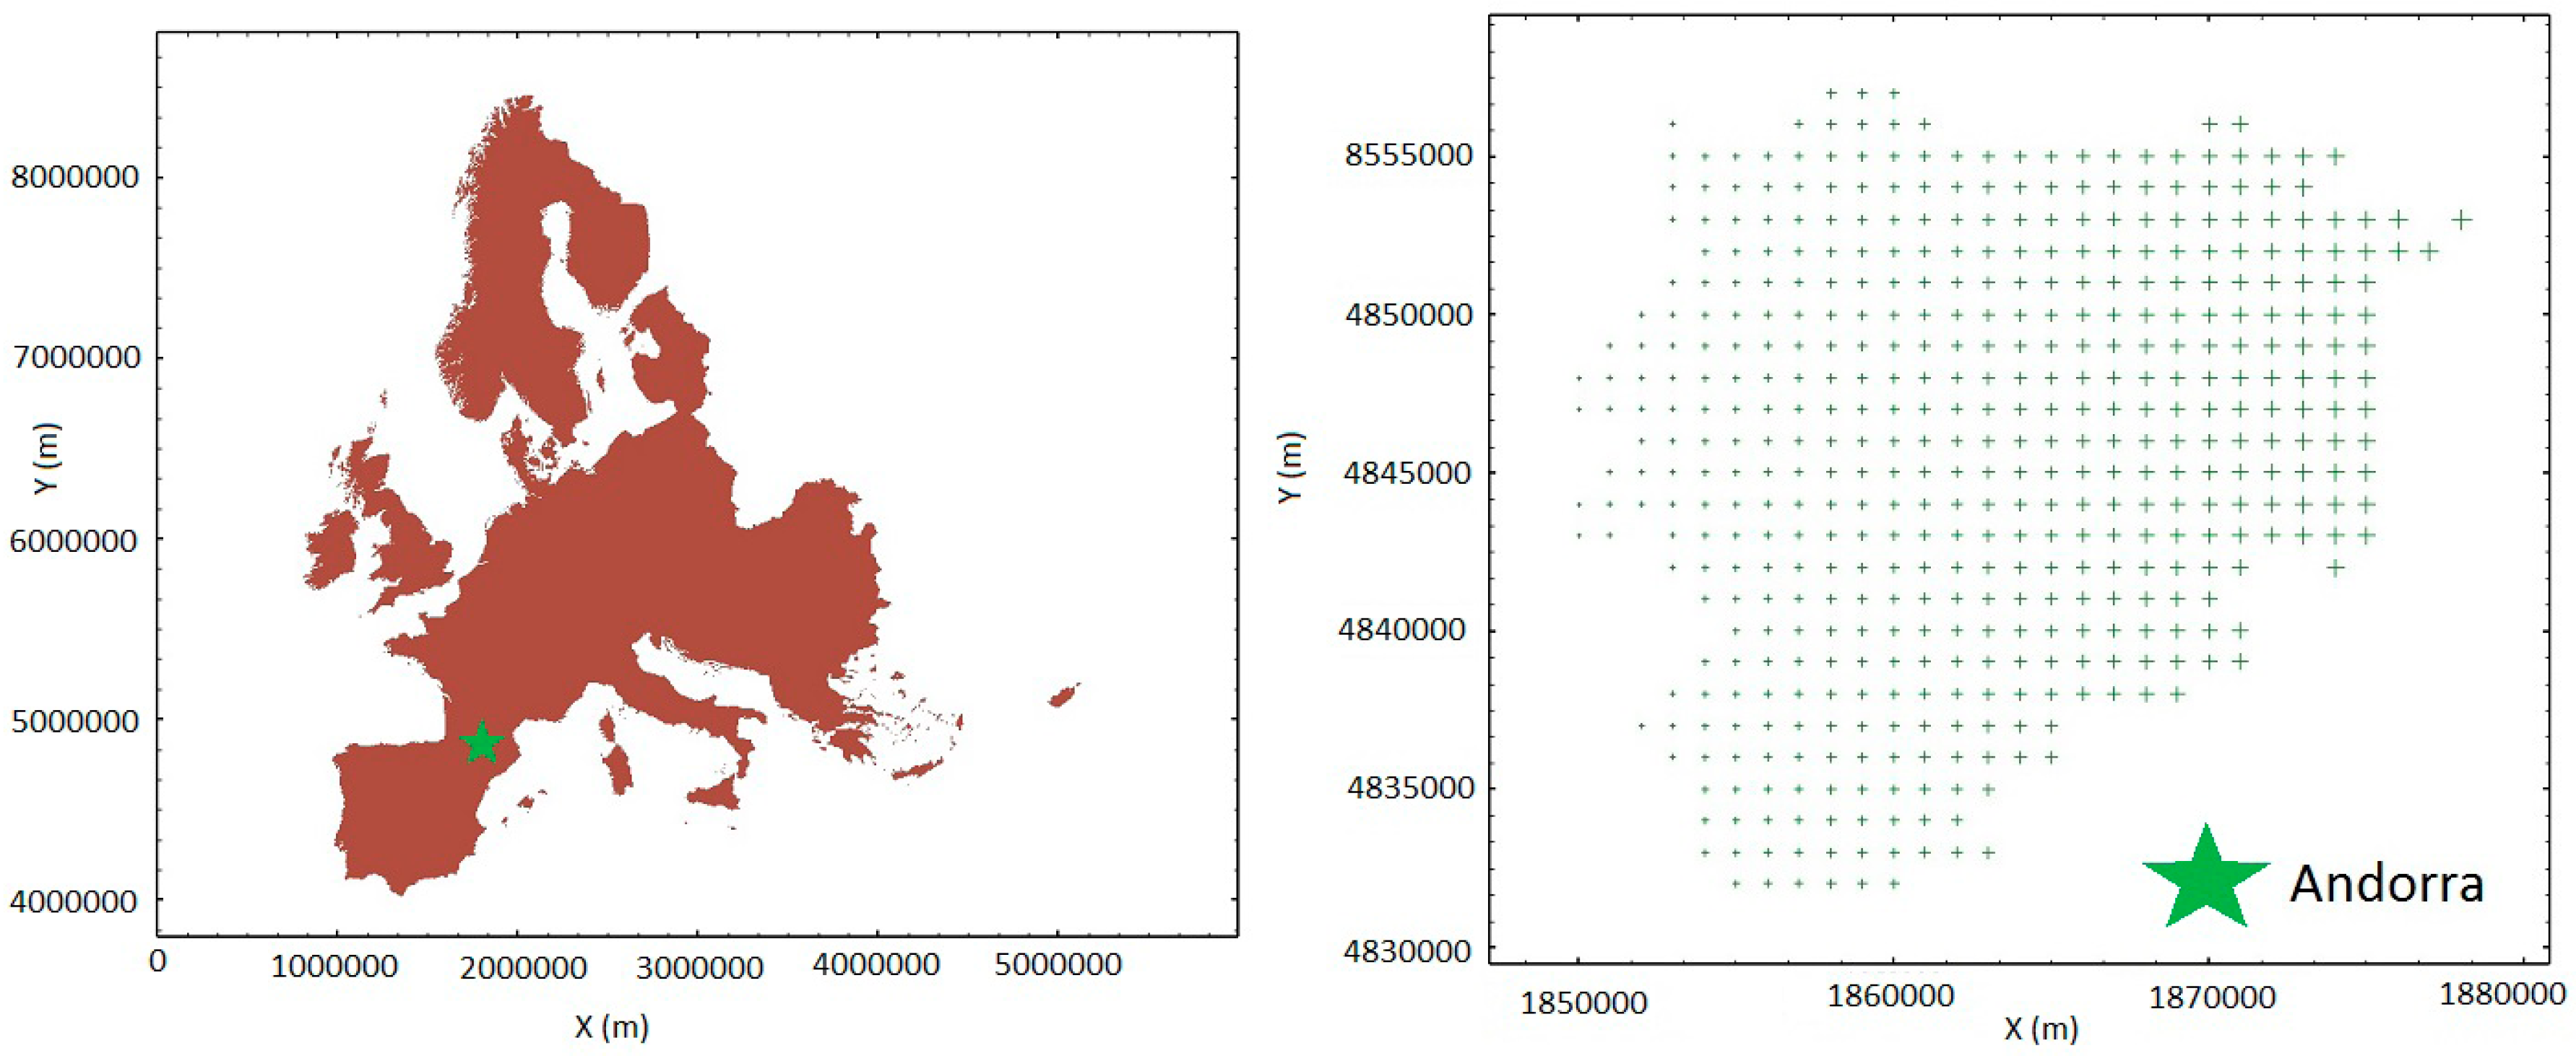
These extracts belong to four nodes chosen from geographical locations in Andorra. The Coordinate Reference System used in this work was ED50 UTM 28, since linear coordinates were needed to perform geostatistical estimations (
Figure 2). The calculation results were then converted back to WGS84 coordinates.
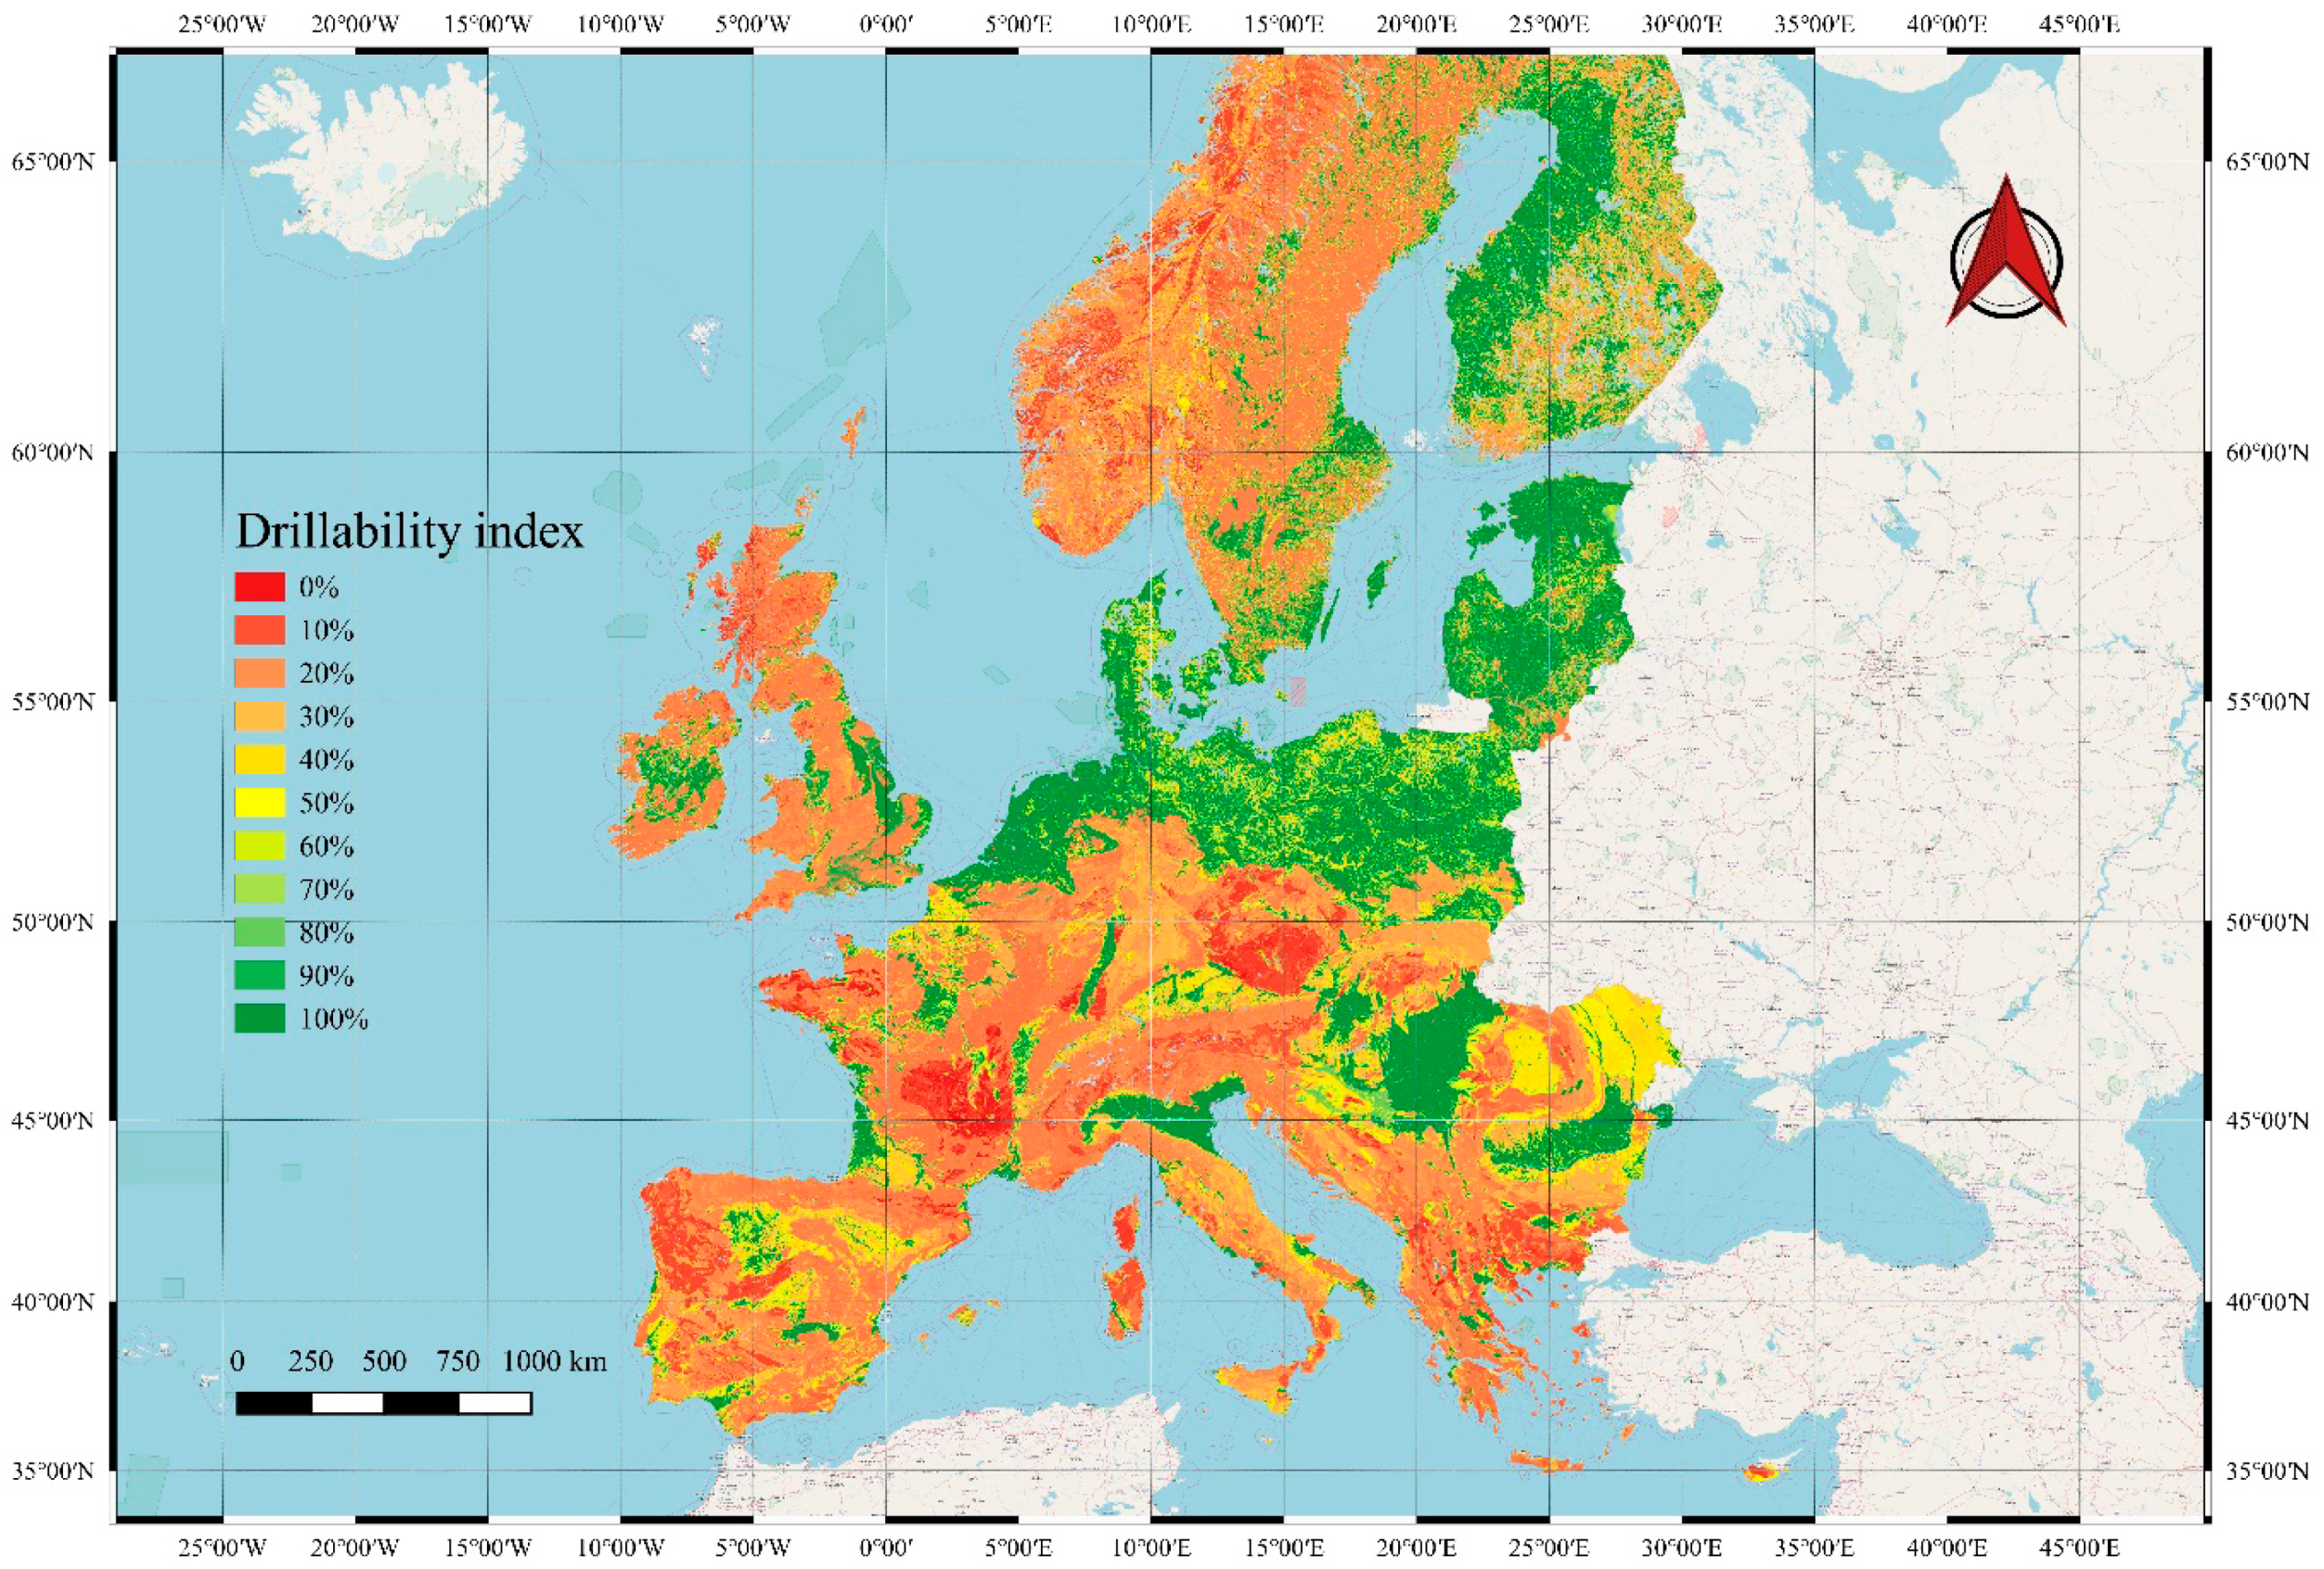
The first database merges information on geology, hydrogeology, and bedrock depth as well as the calculation and estimation of geomechanical properties to define the drillability index (
Table 9). The Drillability Index—the result of calculations—is graphically represented in
Figure 3 as a percentage probability of suitable conditions for the drilling technology in question in Europe.
The drillability index evidences the most suitable European areas for drilling to a depth of 50 m using hollow stem auger technology. The map in
Figure 3 shows the Netherlands and Northern Germany to be very promising. In fact, the first recent attempt to install geothermal probes using hollow stem auger was made in these countries. In addition, even regions with a very low drillability index have enclaves of good drillability—usually in coastal areas or alluvial plains coursed by a river that also coincide with urban settlements.
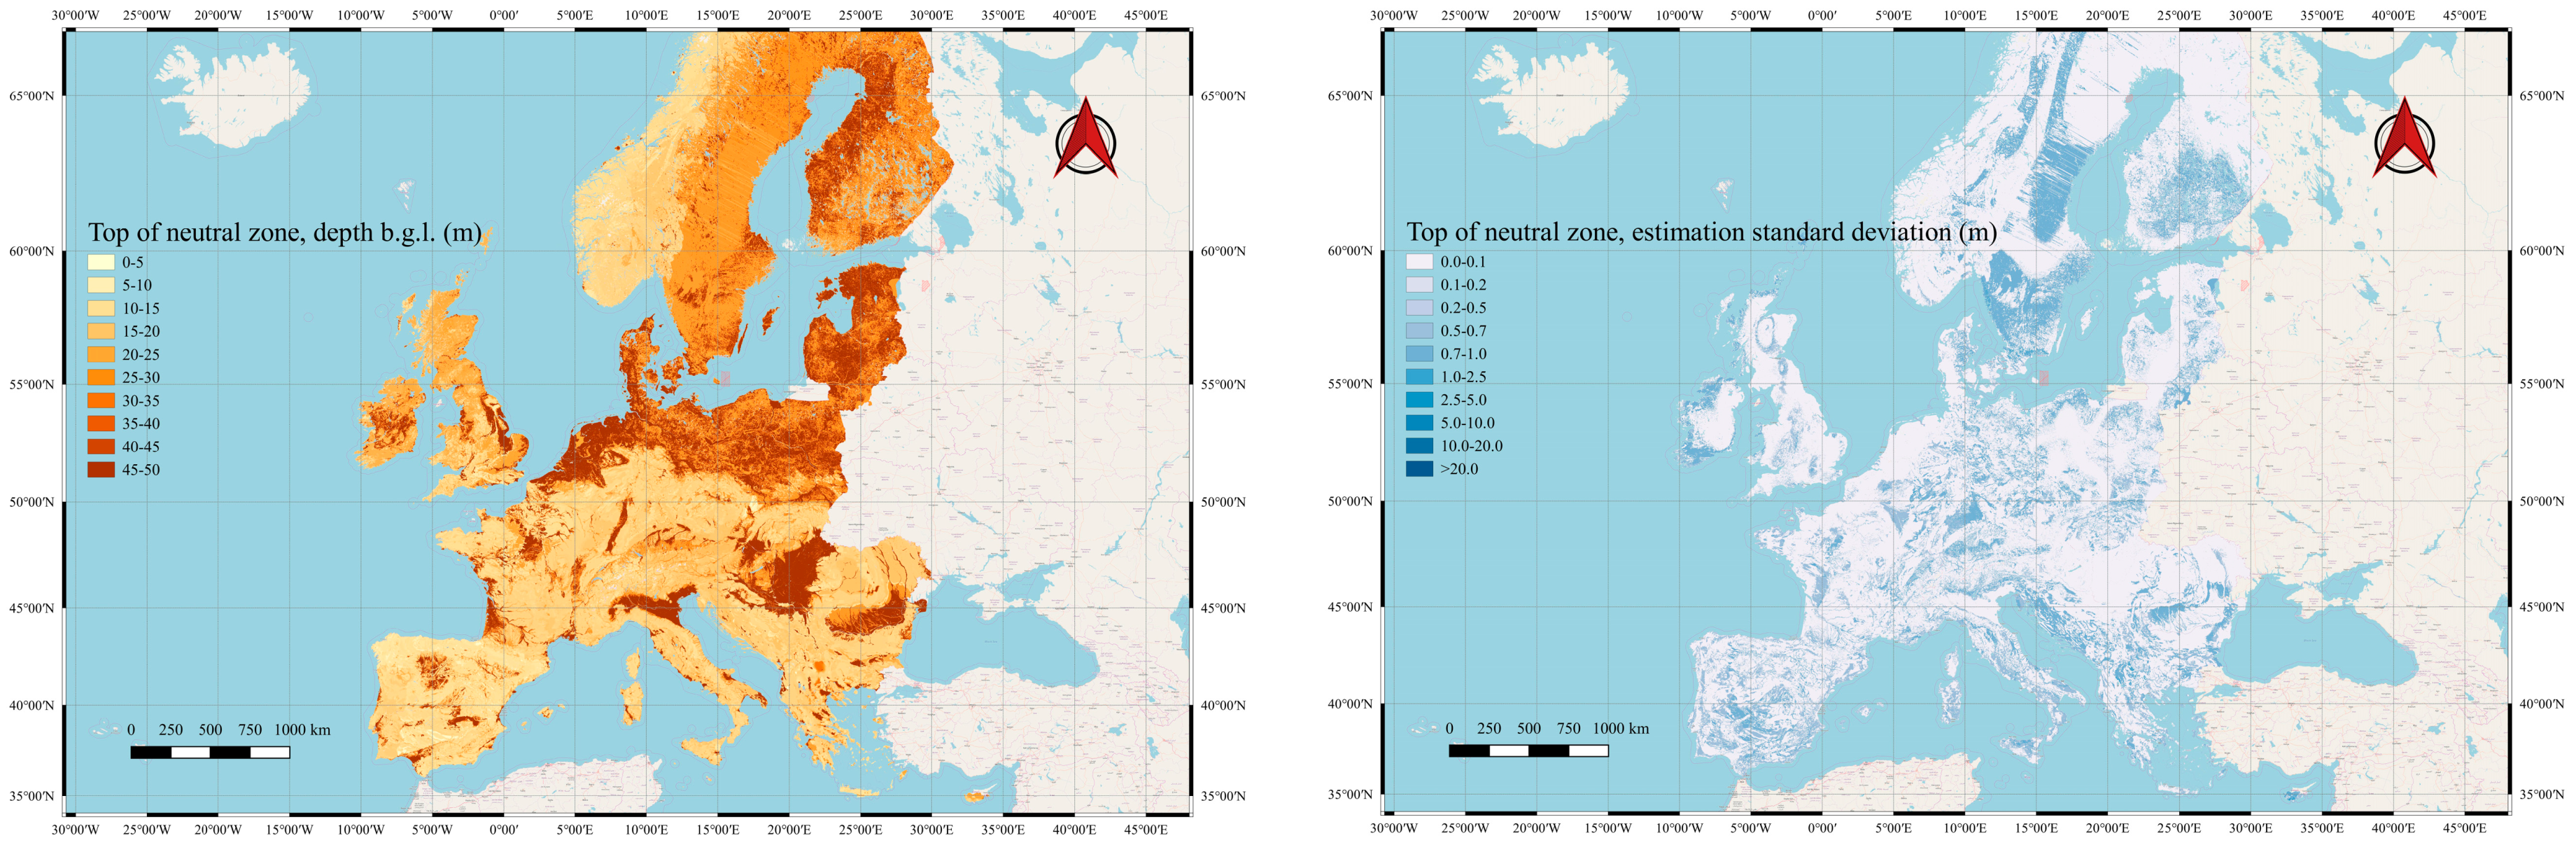
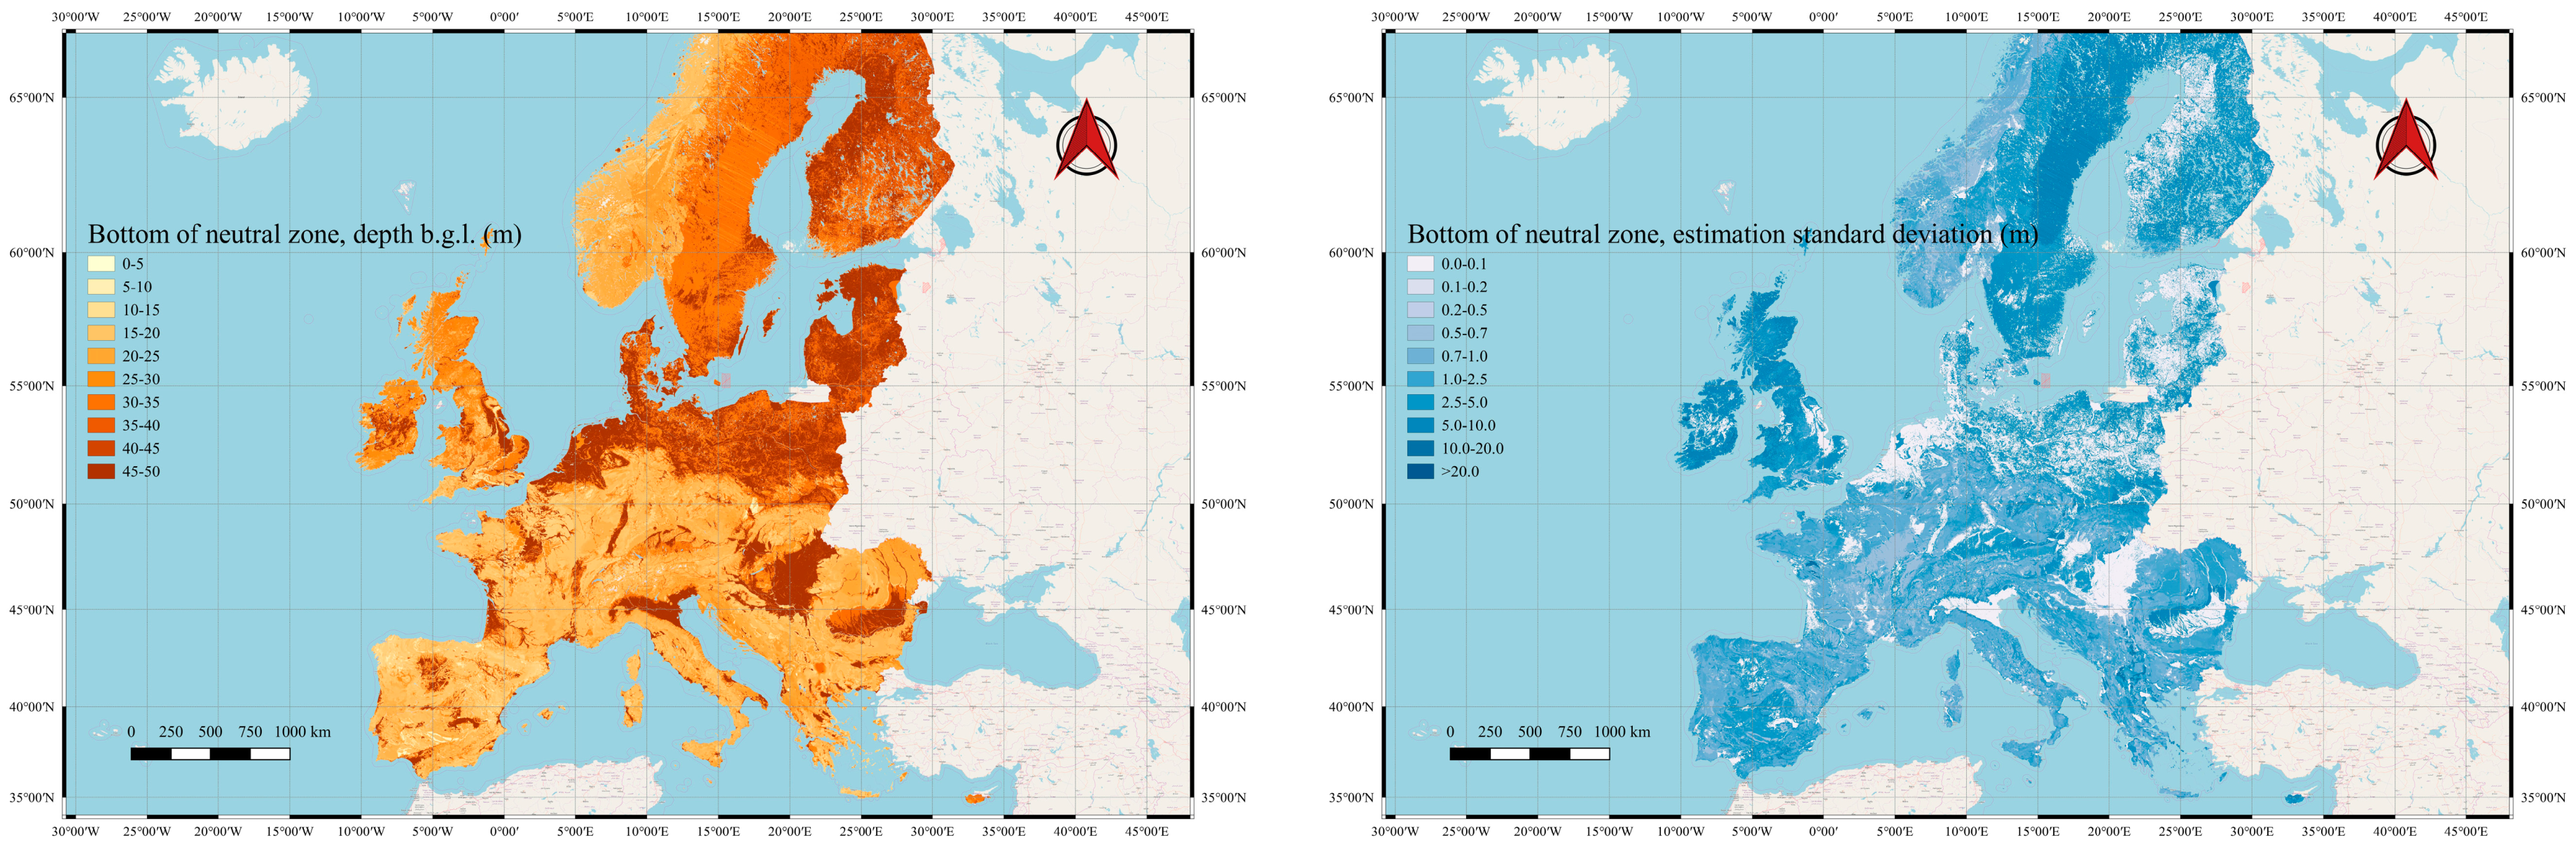
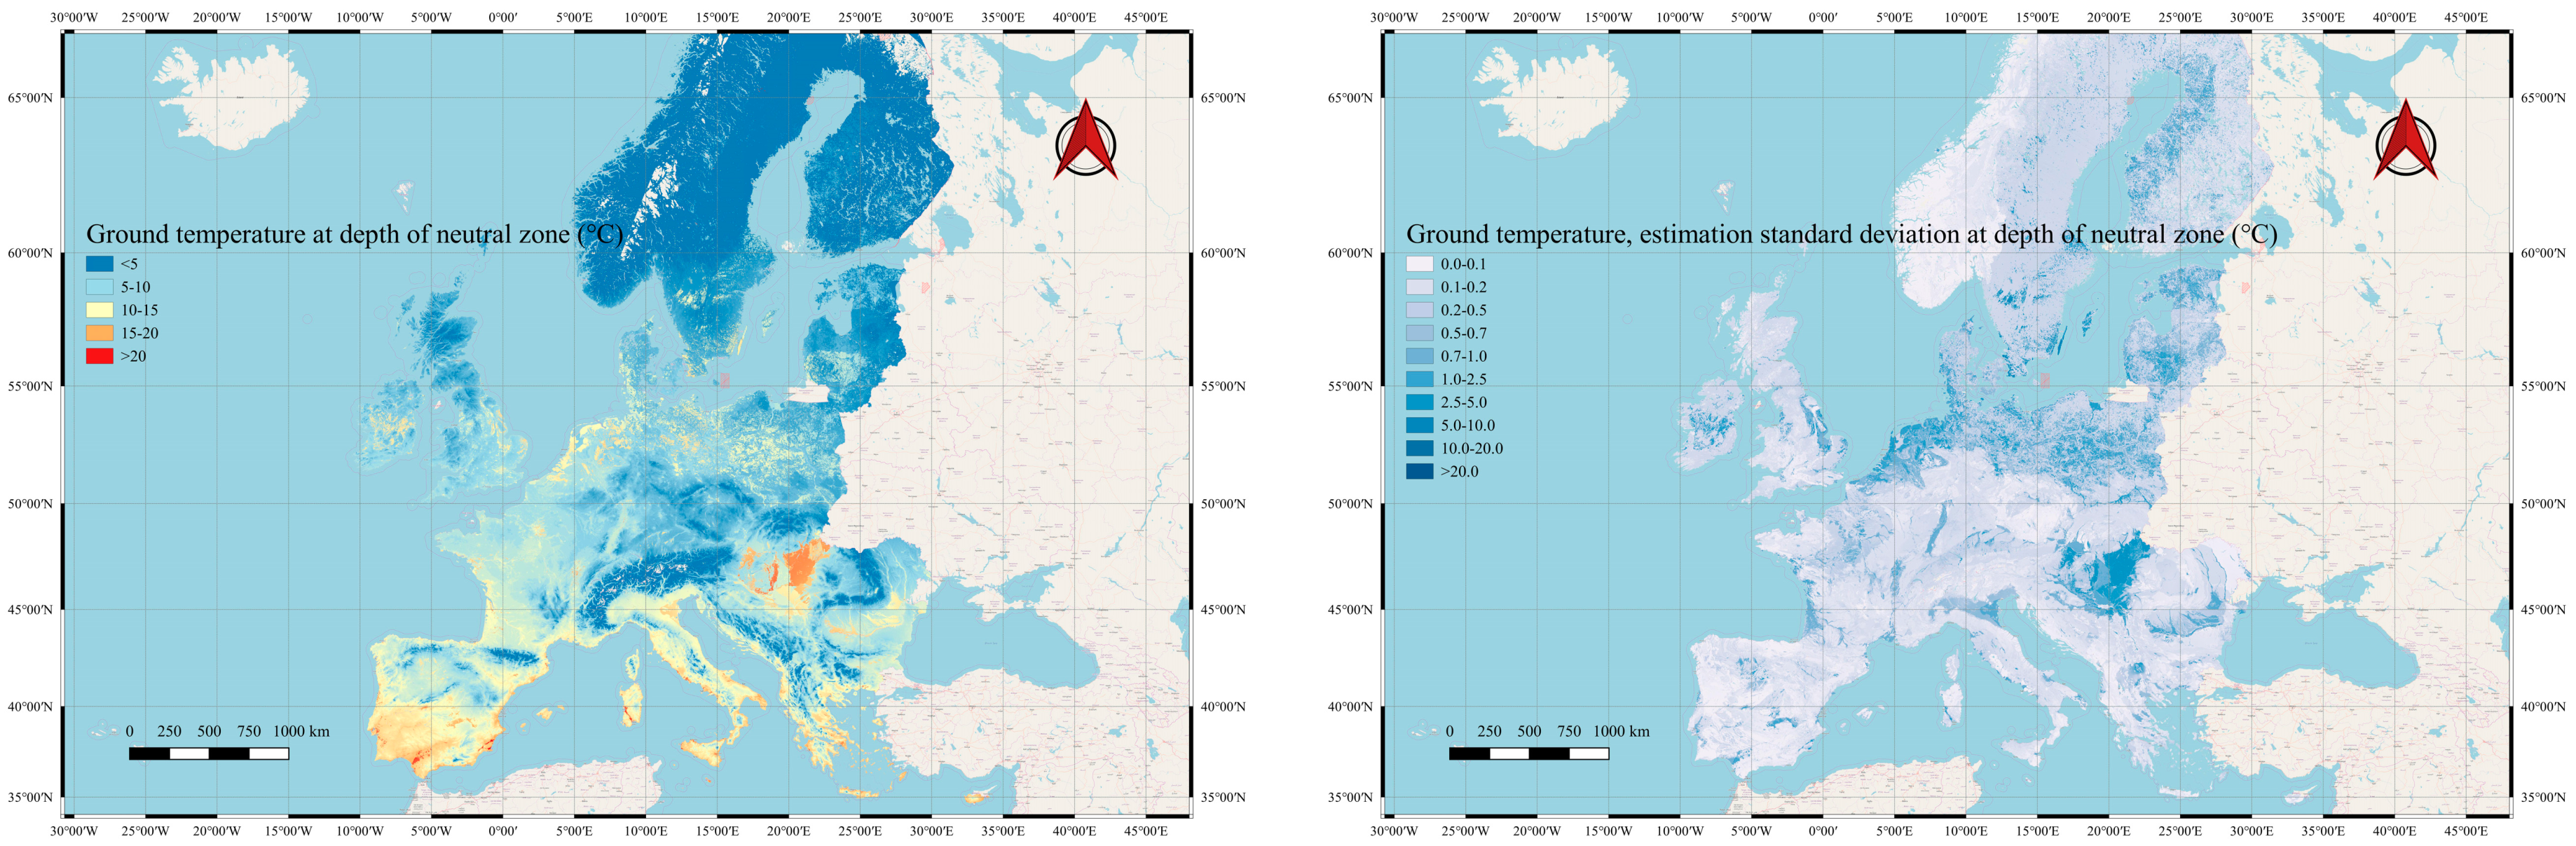
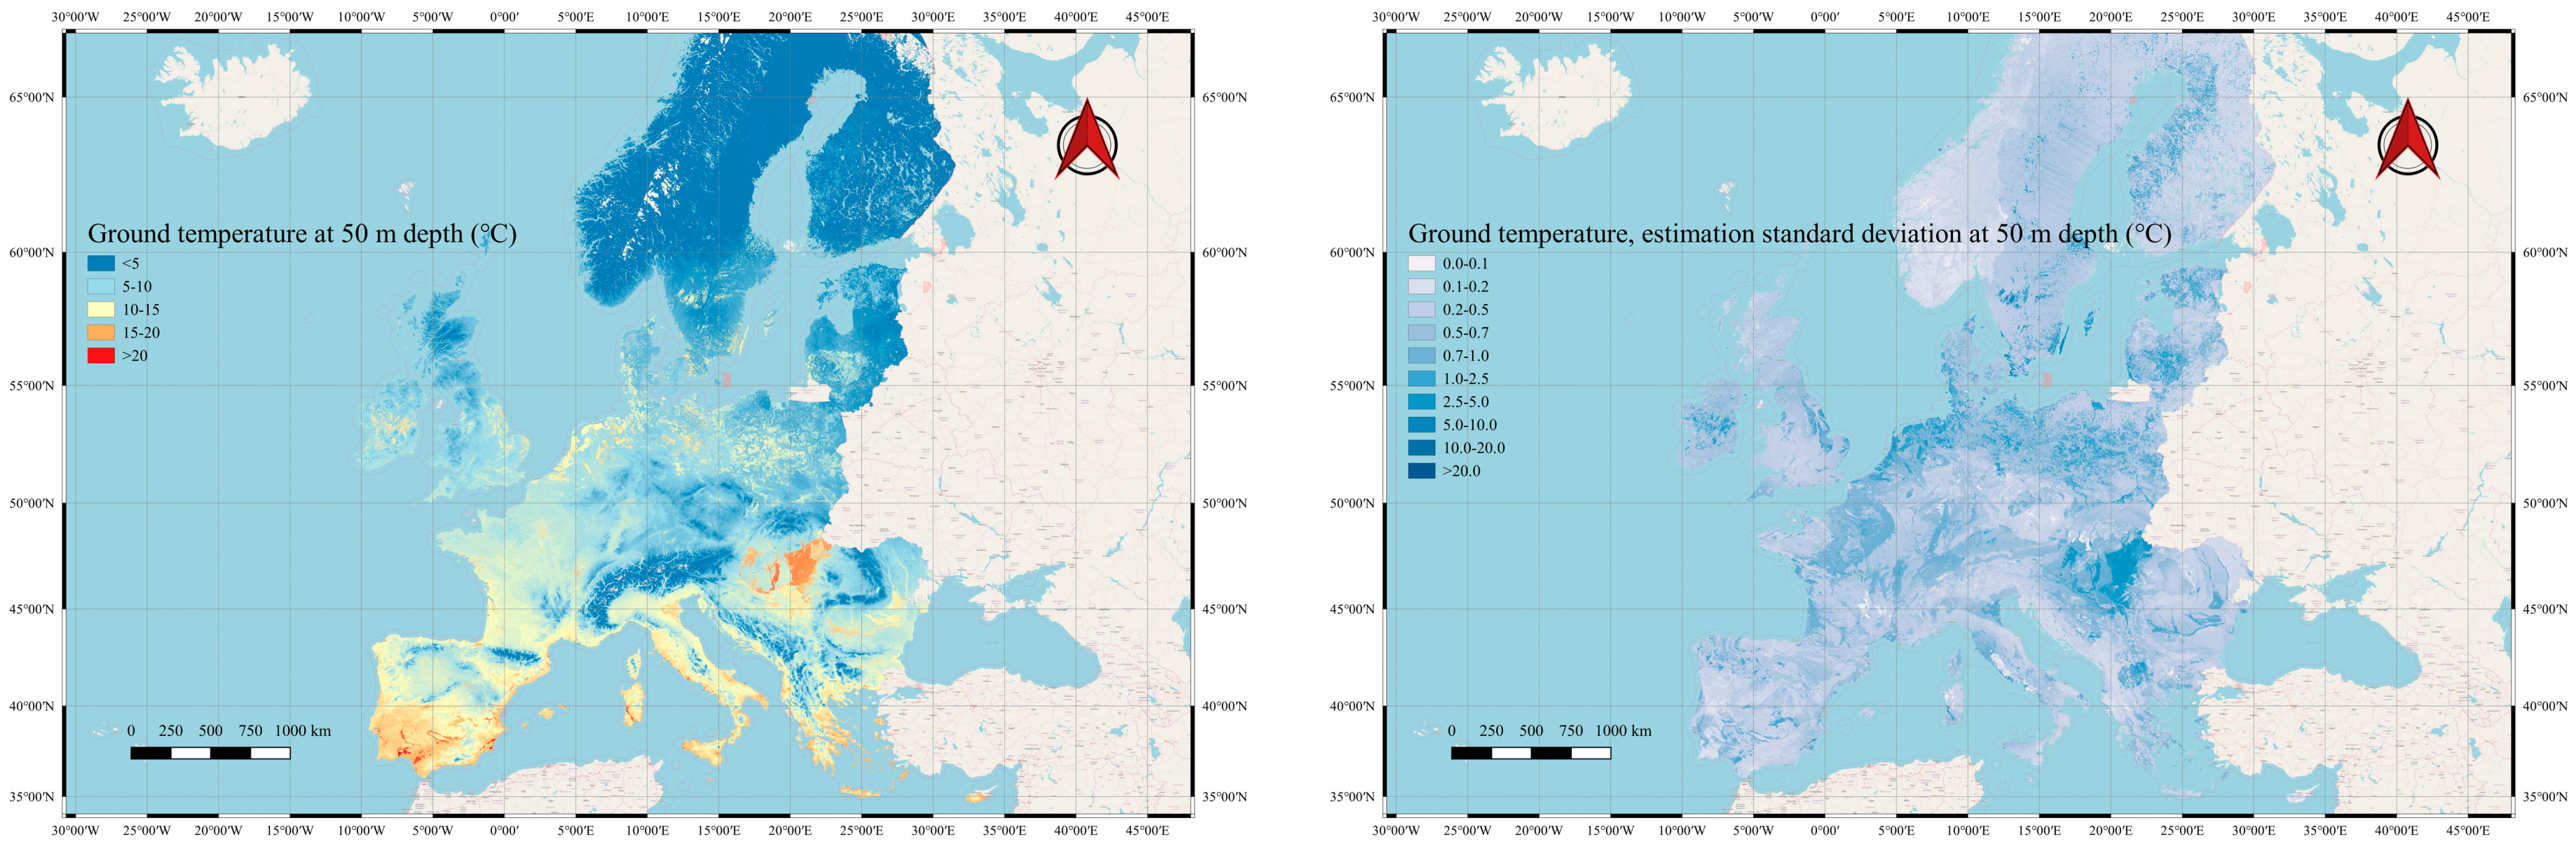
The second database merges information on geology, hydrogeology, bedrock depth, climate data, land cover, and population with calculated or estimated geothermal heat flow and thermal properties in order to define vertical ground temperature evolution at different periods of the year (
Table 10 and
Table 11). Since the scale of the work did not allow 4D graphic representation (space, xyz, and time
t), 2D images of the neutral zone depths (top and bottom, average, and standard deviation) and ground temperature at depths of the neutral zone and at 50 m (average and standard deviation) are given (
Figure 4,
Figure 5,
Figure 6 and
Figure 7).
As evidenced by the maps, ground temperature at shallow depths is mainly influenced by climate, with temperature decreasing from south to north and with altitude. Despite this, some “hot spots” are visible, due in some areas to geothermal anomalies but generally to the effect of the urban heat island in the underground. In fact, slight temperature differences compared with the surrounding areas are found down to the neutral zone below major European cities like Paris, Amsterdam, London, and Rome.
The depth of the neutral zone in different parts of Europe depends on the insulation potential of shallow layers, with minimum values found in dry unconsolidated soils. In areas with major aquifers, the neutral zone depth increases considerably on account of the heat transfer potential through convective phenomena. The maps show that the neutral zone ranges from 15–25 m below ground level to 35–40 m b.g.l. As evidenced by estimation standard deviation maps, the uncertainty in defining the bottom of the neutral zone can be high, up to 10 m.
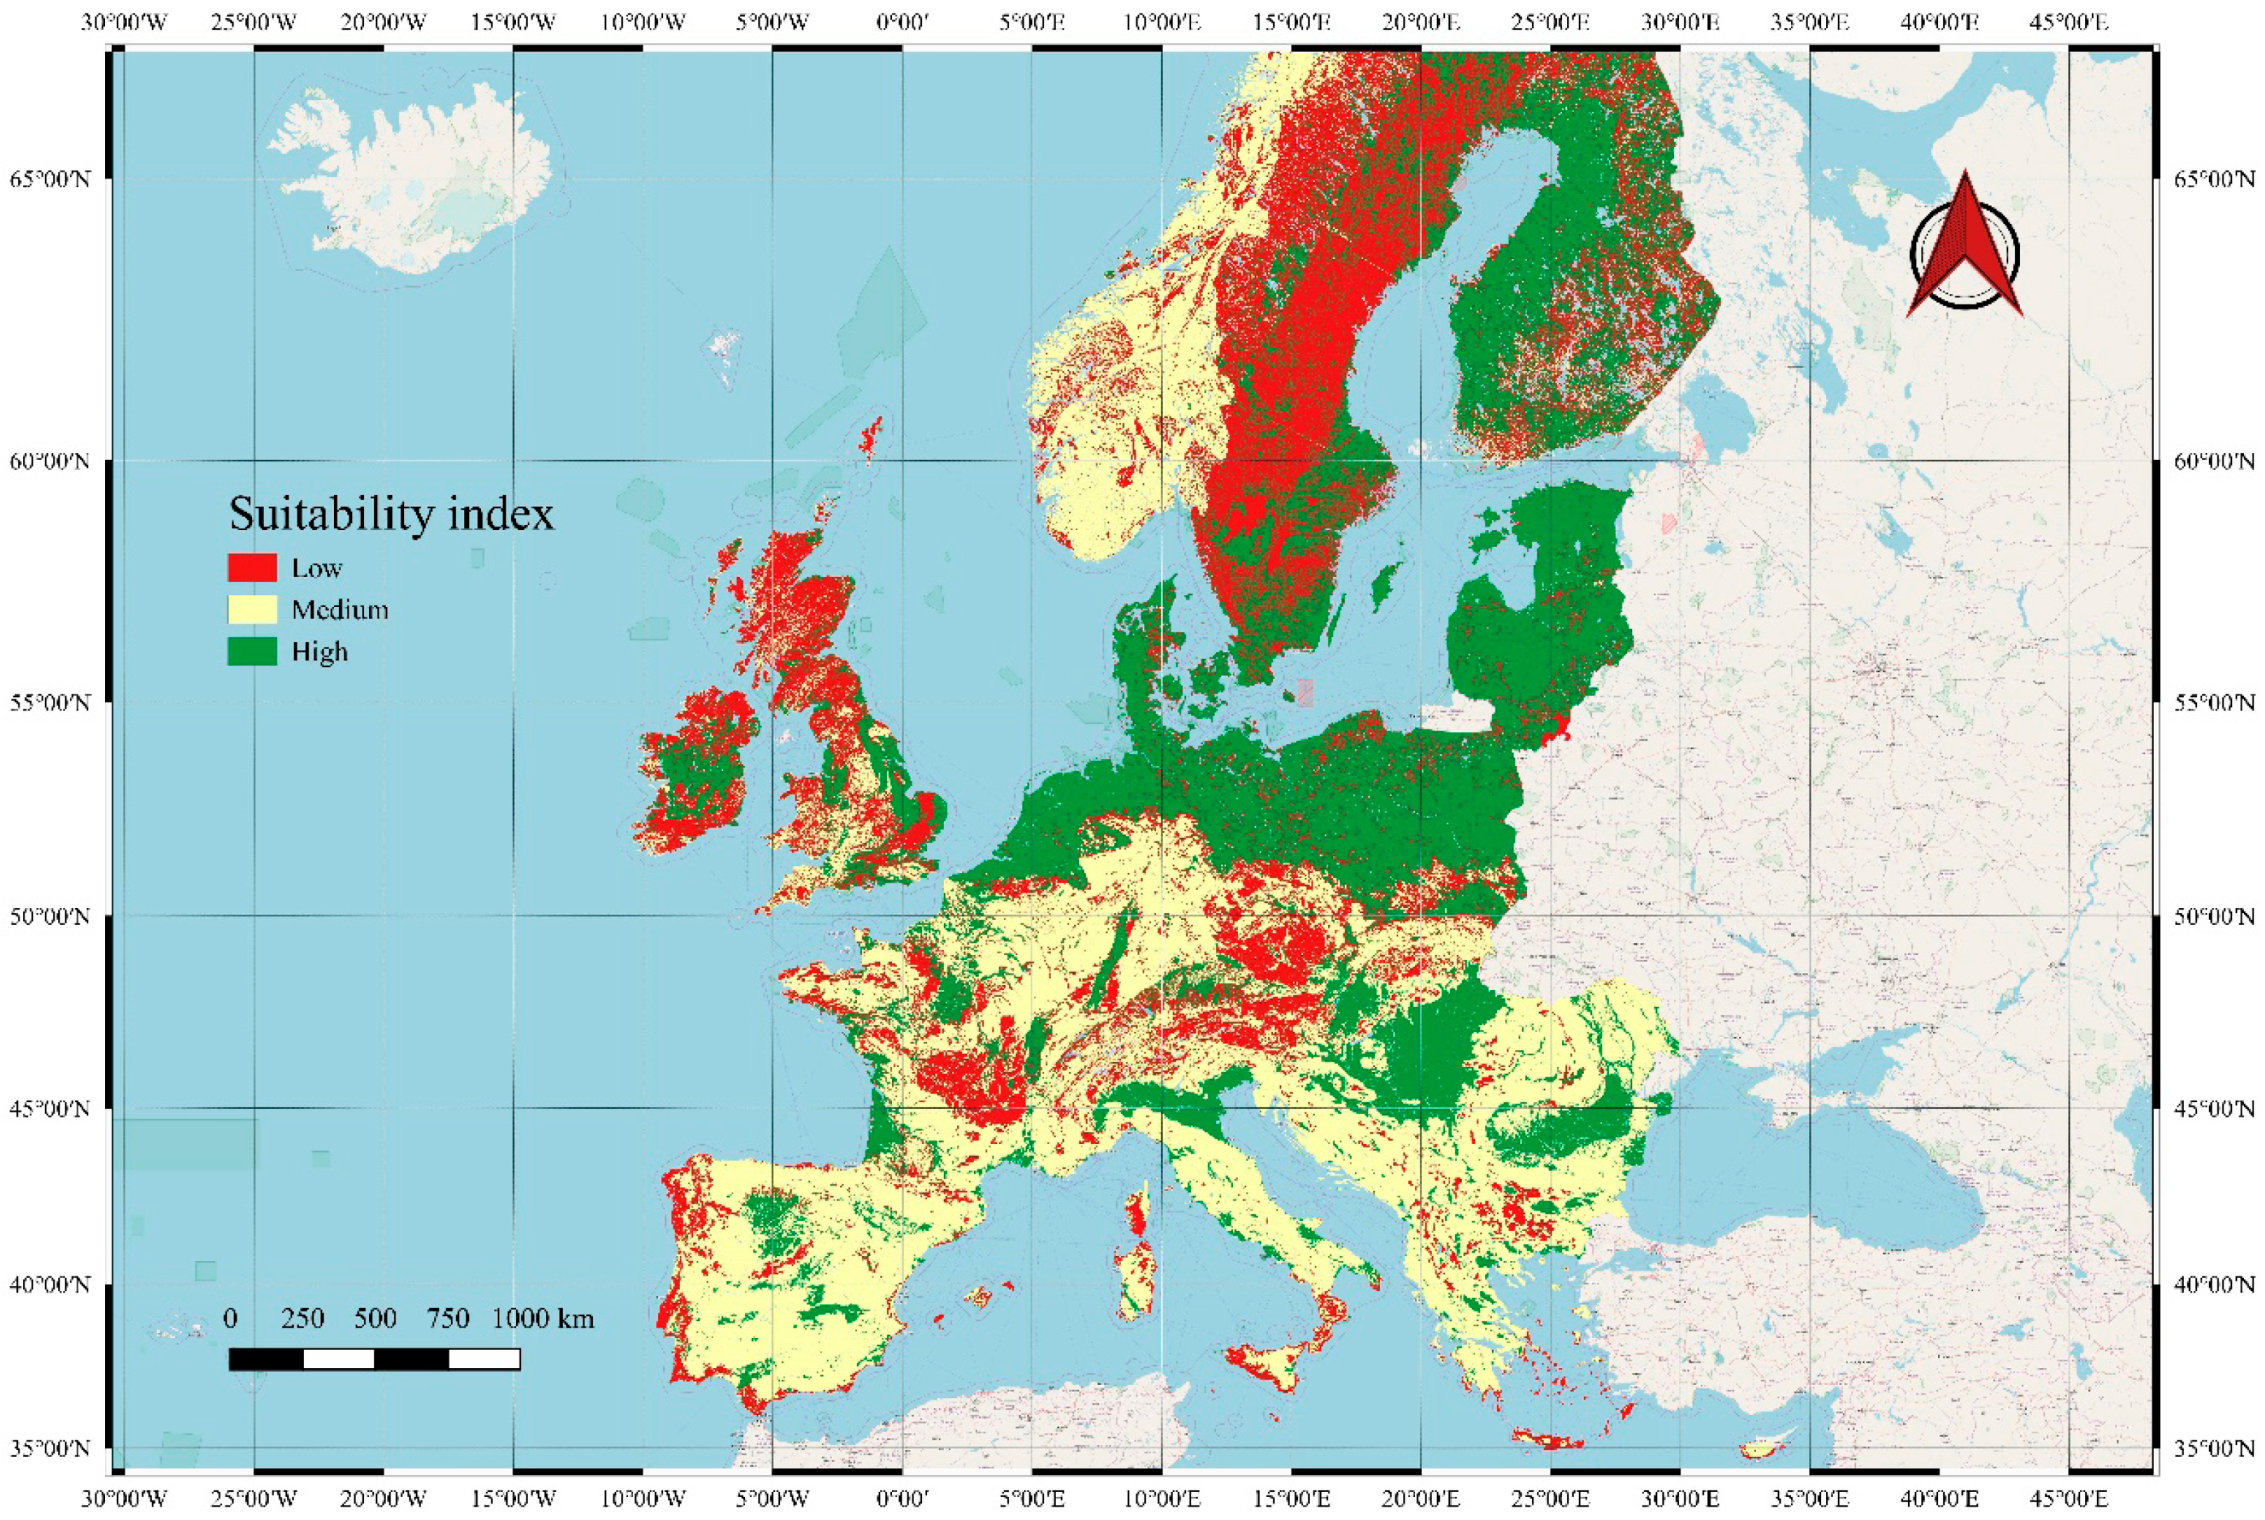
For all the grid nodes, the final result was given as a Suitability Index; that is, the GS result of the Analytic Hierarchic Process conducted on the five criteria.
The third database reports the vector of parameters whose values affected scores
s of criteria
c, and the vector of their scores
s used for the calculation of
GS. The values of vector of weights
w, represented in
Table 7, are constant for all the grid nodes, so
w were not included in the database. Graphic representation of the Suitability Index considered three levels of
GS: low (
GS < 40%), medium (40% <
GS < 60%), high (
GS > 60%) (
Table 12 and
Figure 8).
The Suitability Index shows the alluvial plains as the most promising zones for the GSHP technologies considered in this case study. Southern Europe is partially penalized on account of the limited use of heating systems. Urban agglomerations are favoured with respect to rural zones given the higher energy needs and the impact of SUHI on exploitable ground energy, even in the absence or partial absence of alluvial plains. A large area of central and northern Europe, covering Belgium, the Netherlands, Denmark, part of Germany and Poland could benefit enormously from GEOTeCH technologies. The United Kingdom, on the other hand, is penalized as regards the possible use of hollow stem auger drilling since bedrock depth is generally very shallow, at around 10–15 m. In these cases, an economically feasible solution might be to install very short BHEs that do not reach the neutral zone, even if this would mean lower heat pump efficiency. Southern and coastal European countries—such as Italy, Spain, and the Balkans—are penalized on account of the combination of rocky underground and relatively low heating needs. This could be offset by the cooling requirement, which might make the investment worthwhile in a market dominated by a combination of fuel boilers and air source heat pumps exclusively for cooling purposes. Very low or no heating requirements is generally considered an unsuitable baseline condition for the introduction of the innovative GEOTeCH technology.
The method presented in this paper has the potential to be extended to various GSHP technologies, provided appropriate hierarchy level modifications are made to the criteria in light of the design differences of the plant in question. By way of example, using the GIS-based AHP–MCDA method to define the suitability of standard 100 m deep BHE as the only energy source of a geothermal project requires the highlighting of criteria that consider ground thermophysical properties that most impact heat exchange and ground thermal depletion.
The method could also be included in the DSS, the system assisting customers, energy planners, and stakeholders to identify the best combination of drilling machine, borehole heat exchanger, and heat pump technology for the different locations, climate, site conditions, and energy data (building needs and fuel alternatives).
4. Conclusions
The paper presents a framework for the use of the Analytic Hierarchic Process (AHP) to define a scale of values in the geothermal sector. The AHP was applied to a GIS-based multicriteria decision-making analysis (MCDA) with the aim of quantifying the feasibility of installing selected GSHP technologies. The process allowed the integration of mathematical models to define the system and computing indicators to evaluate performance.
To the Authors’ knowledge, this is one of the few studies in the literature to explore the suitability of shallow geothermal energy using GIS-based AHP–MCDA. The method described by the Authors focuses specifically on the innovative GEOTeCH integrated package designed for shallow geothermal use, composed of hollow stem auger, coaxial borehole heat exchanger, and dual source heat pump. The aim is to encourage the installation of short BHEs in combination with dual source ground air heat pumps in order to increase the geothermal energy usage rates at the local, national, and European level.
The GIS-based AHP–MCDA system produced a Suitability Index map of use to assess the market feasibility of the GEOTeCH integrated package of GSHP technologies. The maps provide information on a 1 × 1 km2 grid covering the European countries. To offset the unavoidable subjective choices inherent in the process, a consistency analysis of the evaluation criteria matrix was performed, which provided encouraging results as to the quality of the choices made.
The results indicate the zones of Europe most suitable for the introduction of the combination of GSHP technologies proposed. These zones are a series of urban areas, alluvial plains, and Central-European climate areas.
The Suitability Index could serve as a basis for defining exploitable shallow geothermal energy using a combination of GSHP technologies at each node of the grid. This information could be compared node-by-node with the energy data of a specific location, providing indications of shallow geothermal energy’s theoretical potential to meet energy needs, thereby reducing CO2 emissions and improving environmental performance.
Current work focuses on the integration of the GIS-based AHP–MCDA with a DSS structure and its future application as a comparative tool to examine GSHP technologies in different contexts.


