Article

Pore Structure Characterization and the Controlling Factors of the Bakken Formation

1
State Key Laboratory of Petroleum Resources and Prospecting, China University of Petroleum, Beijing 102249, China
2
Geophysics and Oil Resource Institute, Yangtze University, Wuhan 430100, China
3
Exploration & Development Research Institute of Liaohe Oilfield Company, Petrochina, Panjin 124000, China
4
Institute of Geophysics and Geomatics, China University of Geosciences, Wuhan 430074, China
*
Authors to whom correspondence should be addressed.
Energies 2018, 11(11), 2879; https://doi.org/10.3390/en11112879
Submission received: 20 September 2018 / Revised: 15 October 2018 / Accepted: 23 October 2018 / Published: 24 October 2018

Abstract

:
The Bakken Formation is a typical tight oil reservoir and oil production formation in the world. Pore structure is one of the key factors that determine the accumulation and production of the hydrocarbon. In order to study the pore structures and main controlling factors of the Bakken Formation, 12 samples were selected from the Bakken Formation and conducted on a set of experiments including X-ray diffraction mineral analysis (XRD), total organic carbon (TOC), vitrinite reflectance (Ro), and low-temperature nitrogen adsorption experiments. Results showed that the average TOC and Ro of Upper and Lower Bakken shale is 10.72 wt% and 0.86%, respectively. The Bakken Formation develops micropores, mesopores, and macropores. However, the Upper and Lower Bakken shale are dominated by micropores, while the Middle Bakken tight reservoir is dominated by mesopores. The total pore volume and specific surface area of the Middle Bakken are significantly higher than those of the Upper and Lower Bakken, indicating that Middle Bakken is more conducive to the storage of oil and gas. Through analysis, the main controlling factors for the pore structure of the Upper and Lower Bakken shale are TOC and maturity, while those for Middle Bakken are clay and quartz contents.

1. Introduction

The unconventional reservoirs such as shale gas and tight oil have been paid more attention since the production of conventional oil and gas decreased [1,2,3]. It is difficult to obtain economic oil flows without horizontal well drilling and fracturing technology, as these unconventional reservoirs are impermeable or extremely low permeable [4,5]. In unconventional reservoirs, the development may be more important than the exploration. However, the exploration of unconventional resources cannot be neglected. A series of geochemical and petrophysical properties are required to characterize and evaluate [5,6]. Among these parameters, pore structures are important factors affecting the fluid transport both in the hydrocarbon accumulation and production in porous media and are also key parameters for reservoir grading and productivity evaluation [7,8,9,10]. Therefore, it is necessary to study the pore structure characteristics such as pore size distribution and pore types, and the controlling factors of the unconventional reservoirs.
According to pore sizes, the pores can be classified into three types: Micropore (<2 nm), mesopore (2–50 nm), and macropore (>50 nm) [11]. Compared with the conventional reservoirs, the unconventional shale oil and gas reservoirs always develop more micropores and mesopores, and show more complex pore systems with strong heterogeneity [4]. Thus, it is necessary to utilize proper methods to characterize the pore structure. A variety of advanced experimental methods can be used to analyze the pore structure of porous media. The pore types and sizes can be qualitatively observed by CT scan [12], scanning electron microscope (SEM) [13], field emission scanning electron microscope (FESEM) [14], and transmission electron microscope (TEM) [15]. Meanwhile, quantitative characterization methods include high pressure mercury injection (PMI) [16], constant rate mercury injection (RMI) [17], nuclear magnetic resonance (NMR) [18,19], low-temperature N2 and CO2 adsorption [20,21], small-angle and ultra-small-angle neutron scattering (SANS and USANS) [22], etc. Each method has its own advantages and disadvantages. For example, it is difficult for qualitative methods providing pore size distributions. NMR can capture almost of all sizes of pores but it requires other quantitative methods (PMI) to scale [18]. Low-temperature N2 adsorption (LTNA) is suitable for capturing the pores with a size of approximately 1 to 150 nm. Hence, it is suitable for obtaining nano-scale pore structure parameters. In recent years, a growing number of studies have applied low-pressure N2 adsorption to explore the pore structure characteristics of unconventional shale and tight sandstone, such as pore volume, specific area, and pore size distributions [23,24]. Kuila and Prasad [25] investigated the specific surface area and pore-size distributions in shales with a nitrogen gas-adsorption technique. Wang et al. [26] studied the pore structure of shale gas of Longmaxi Formation, Sichuan Basin, China using LTNA data. Su et al. [27] combined the LTNA and low-temperature CO2 adsorption method to characterize the pore structure of shale oil reservoirs in the Zhanhua Sag, Bohai Bay Basin, China.
The Bakken formation is a typical tight oil reservoir which underlies parts of Northern USA and Southern Canada. This formation is divided into three members: The Upper Bakken, the Middle Bakken, and the Lower Bakken. The previous geological studies include petroleum source rocks [28], systemic petroleum geology [29], lithofacies and paleoenvironments [30], diagenesis and fracture [31], and petrophysics properties [32,33]. Studies on the pore structure of the Bakken Formation have been reported. Liu and Ostadhassan [34] characterized the microstructures of Upper/Lower Bakken shales with the aid of SEM images and observed that micropores developed extensively in those shale samples. Li et al. [35] measured the permeability of Middle Bakken samples including Kinkenberg permeability and PMI-based permeability. Kinkenberg permeability is commonly higher than PMI-based permeability, indicating smaller pores cannot be detected by the PMI method. Saidian and Prasad [25] reported the pore size distribution of Middle Bakken and Three Forks formations provided by PMI and LTNA methods. Pore size distributions are affected by clay content. The greater the clay content, the higher the amplitude of the pore size distribution. Liu et al. [36] investigated the fractal and multifractal characteristics of pore-throats of Upper/Lower Bakken shale using the PMI method. Liu et al. [1] reported the pore structure and fractal characteristics of the Bakken formation in North Dakota, USA. It was observed that the pore structure of the Middle Bakken and the Upper/Lower Bakken are significantly different. However, the differences in the pore structure of the three Bakken members and their main controlling factors are not thoroughly investigated.
In this paper, 12 samples were derived from the Bakken Formation for experimental tests. The X-ray diffraction (XRD), total organic carbon (TOC) analysis, vitrinite reflectance (Ro) and low-temperature N2 adsorption experiments were conducted on these samples. Pore structure parameters, such as pore morphology, specific surface area, and pore size distribution, were then analyzed based on low-pressure N2 adsorption curves. The controlling factors of pore structures were determined by analyzing the correlations of the pore structures with the mineral composition, TOC, and thermal maturity.

2. Samples and Methods

2.1. Geological Background and Samples

The Williston Basin is located in the Northern United States and in Southern Canada with an area of 40,000 × 104 m2, see Figure 1 [37]. This basin occupies portions of North Dakota, South Dakota, Montana USA, and Alberta, Saskatchewan, and Manitoba Canada [38,39]. It was deposited on the Superior and Wyoming Craton, and Trans-Hudson orogenic belt from the Cambrian to Carboniferous (mainly Mississippian) system. Subsidence and basin filling were most intense during the Ordovician, Silurian, and Devonian Periods, when thick accumulations of limestone and dolomite, with lesser thicknesses of sandstones, siltstones, shales, and evaporites were laid down [31]. The Bakken Formation overlies the Upper Devonian Three Forks Formation and underlies the Lower Mississippian Lodgepole Formation. However, the Bakken Petroleum System (BPS) included the Bakken, lower Lodgepole and upper Three Forks formations [35].
As mentioned in the introduction to this paper, the Bakken Formation in the Williston Basin is divided into three different members: The Upper, Middle, and Lower Bakken, see Figure 2 [1]. The lithology of Upper and Lower Bakken members mainly consists of dark-gray to brownish-black to black, fissile, slightly calcareous, organic-rich shale, which was deposited in an offshore marine environment during periods of sea-level rise [31]. They serve as the main source rocks and seal rocks and have a thickness of about 8 m and 13 m, respectively. The total organic carbon (TOC) content of the Upper and Lower Bakken is between 12% and 36% with an average of 11.33% [29]. The Middle Bakken member consists of the products of the continental shelf and the shallow foreshore environment. The lithology of the middle member is highly variable and consists of a light-gray to medium-dark-gray, interbedded sequence of siltstones and sandstones with lesser amounts of shale, dolostones, and limestones rich in silt, sand, and oolites [31,39]. The oil and gas of the Bakken Formation are mainly produced from the middle member with a thickness of about 15 m. It is easy to identify the three members using well logs. For the black shale, the gamma ray (GR) log curve shows a large value, generally greater than 200 API, while the resistivity logs are generally higher than 100 Ω·m. For the Middle Bakken, the GR log values are very small and resistivity log readings are lower than those in Upper and Lower Bakken shale.
The study area is located in North Dakota, near the center of the Williston Basin. In this part of North Dakota, the Bakken Formation reaches its maximum thickness of approximately 46 m, which is conducive to our research. In this study, we respectively chose four samples from the Upper, Middle, and Lower Bakken members (a total of 12 samples) for pore structure and main controlling factors. A series of experiments including: (1) Low-pressure N2 adsorption; (2) X-ray diffraction (XRD); (3) total organic carbon (TOC) analysis; and (4) vitrinite reflectance (Ro) were conducted.

2.2. Experimental Methods

We used the Dmax-2500 X-ray diffraction analyzer for the X-ray diffraction (XRD) experiments following the Chinese national standard SY/T5163-2010 (SY/T5163-2010). The Cornerstone™ carbon-sulfur analyzer was used for the TOC analysis and the MPV-SP microphotometer was used for the vitrinite reflectance (Ro) measurement under the condition of 22 °C and 35% humidity.
We used the JWBK-200C surface area analyzer for the low-pressure N2 adsorption experiments following the Chinese national standard GB/T21652-2008. Prior to the adsorption measurement, approximately 3 g of 40 to 80 mesh samples were first dried under vacuum for 12 h at high temperature (110 °C) to remove bound water and residual volatile compounds. The nitrogen adsorption was performed with a surface area and pore structure analyzer at 77 K. The adsorbed volume was measured at different relative equilibrium adsorption pressure ( P 0 / P ) which ranges from 0.01 to 0.99, where P is the gas vapor pressure in the system and P0 is the saturation pressure of gas. Brunauer-Emmett-Teller (BET) method [40] by multipoint calculation was used to calculate the surface area (SA). For the pore volume determination, it was calculated as the total volume of nitrogen adsorbed at the relative pressure of 0.99. The pore size distribution (PSD) was determined based on Barrett-Joyner-Halenda (BJH) model [41].
These experiments were performed in the Wuxi Department of Petroleum Geology, Research Institute of Petroleum Exploration and Development, SINOPEC.

3. Results

3.1. Mineralogical Compositions and Geochemical Characteristics

Table 1 shows the mineral composition and geochemical characteristics of the studied samples. The minerals in the samples of the Upper and Lower Bakken are dominated by clay minerals and quartz, followed by feldspar and pyrite. A small amount of dolomite and calcite is contained. The clay content ranges from 24.07% to 50.59%, with an average value of 42.23%, and the quartz content varies between 38.04% and 63.59%, with an average of 45.28%. The mineral composition of the Middle Bakken samples is also dominated by clay minerals and quartz. However, the difference between Middle Bakken and Upper/Lower Bakken is that the dolomite and calcite contents of Middle Bakken are higher, and pyrite and feldspar content of Middle Bakken are relatively smaller. The clay content is in the range of 13.27% to 36.18% with an average of 25.76%, which is less than that of the Upper/Lower Bakken samples. The Upper and Lower Bakken are abundant in organic matter, and the TOC content is between 6.58% and 15.86 wt%, with a mean value of 10.72 wt%. According to previous studies, the kerogen type of this area is mainly type II [39,42]. The Ro ranges between 0.62% and 1.11%, with an average of 0.86%, indicating the Bakken shale belongs to the low mature and mature stages in thermal maturity.

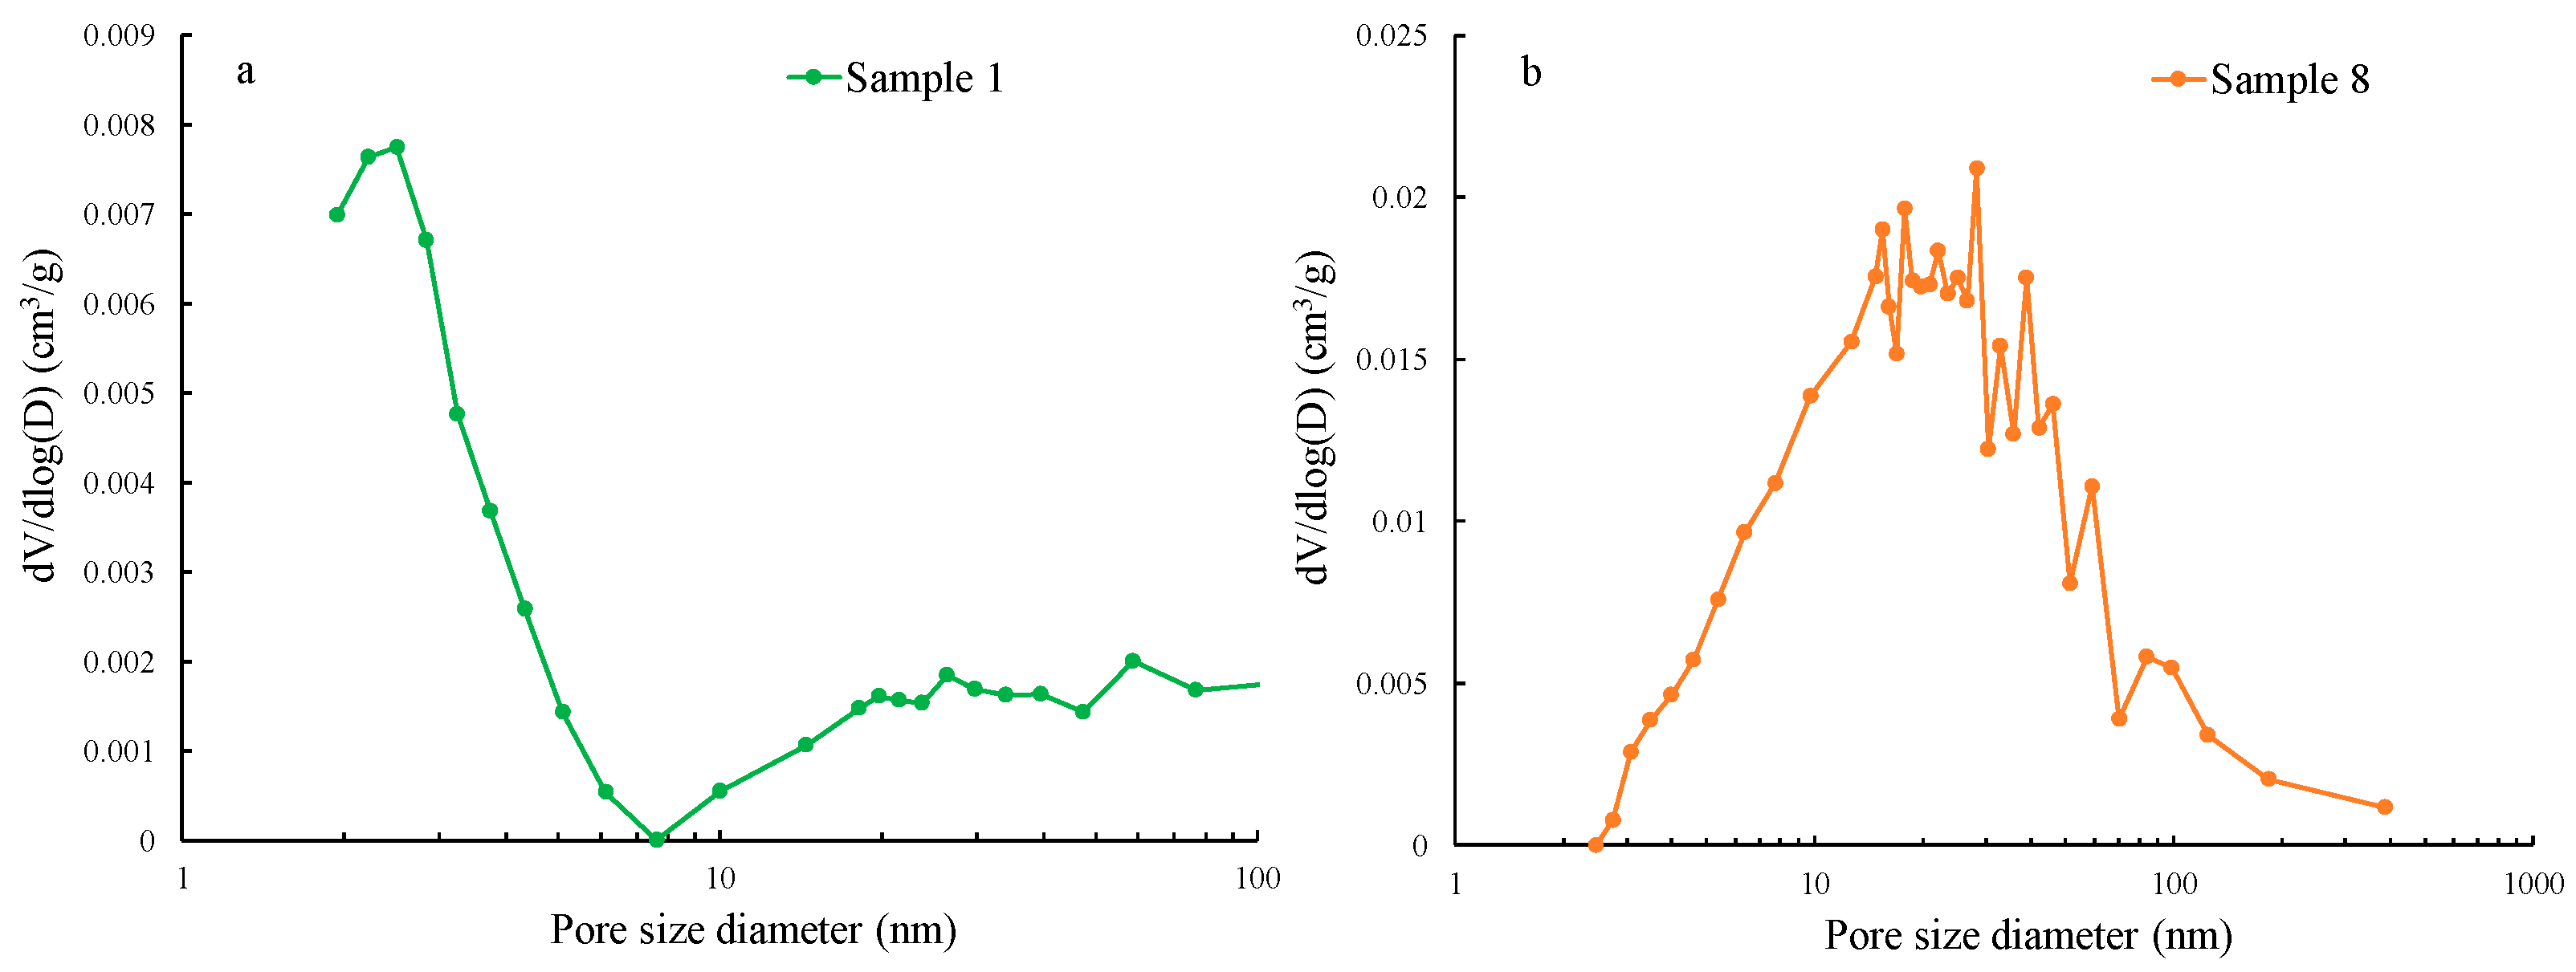
3.2. Pore Structure Characteristics

The adsorption/desorption models of studied samples can be divided into two stages, see Figure 3. The first stage is the single-multiple layer adsorption stage. In this stage, the adsorption curve coincides with the desorption curve, and the adsorption quantity increases gradually with the increase of relative pressure, which suggests the presence of micropores (<2 nm) in the samples. The second stage is the capillary condensation stage, i.e., separation of adsorption and desorption curves, namely, the hysteresis loop exists. The initial point of the hysteresis loop indicates that the minimum capillary begins to show capillary condensation, and the end point of the hysteresis loop suggests that the maximum capillary is filled with nitrogen. Additionally, the adsorption/desorption curves of the samples have no obvious “platform segment” at high relative pressure, indicating that the Bakken samples contain the macropores (>50 nm) beyond the measurement range of low-pressure N2 adsorption [43].
The adsorption/desorption isotherms of porous media often separate under certain conditions, producing the hysteresis loop. The morphology of the hysteresis loop is closely related to the pore structure of the samples [44]. The adsorption/desorption curves and pore types of Bakken samples can be divided into three models, according to whether the hysteresis loop exists or not and the morphology of the hysteresis loop, see Figure 4. The first type has no hysteresis loop. This kind of adsorption/desorption curves results because the relative pressure of the same pore is identical during capillary condensation and evaporation and the adsorption curve coincides with the desorption curve. It generally corresponds to cylindrical pores, parallel plate-like pores, or wedge pores. The second type has a hysteresis loop without an inflection point, which belongs to types H1 or H3 based on the classification of IUPAC (International Union of Pure and Applied Chemistry) [11]. The types H1 or H3 adsorption/desorption isotherms correspond to cylindrical pores with openings at both ends or plate-shaped pores with openings on all sides, namely the open, permeable pores [45]. The hysteresis loop of the third type has an inflection point and belongs to type H2 based on the classification of IUPAC [11]. There is a sharp drop of the inflection point in the desorption curve in type H2, corresponding to ink bottle-like pores.
The adsorption/desorption curves of sample 3 and sample 10 belong to the first type, indicating the development of impermeable pores dominated in the two samples. The adsorption/desorption curves of sample 1, 4, 5, 6, 7, 8, 9, 11, and 12 belong to the second type, developing the open, permeable pores that are conducive to the flow of oil and gas, see Table 2. The curve of sample 2 belongs to the third type. It indicates that the sample contains more ink bottle-like pores but cannot deny the existence of the impermeable pores closed at one end and the open, permeable pores. That may be because the effect of these two kinds of pores on the adsorption/desorption curve is obscured by the ink bottle-like pores. The existence of ink bottle-like pores is beneficial to the adsorption of shale oil and gas. However, the closeness of the pores is not conducive to the desorption and diffusion of shale oil and gas. The condensed liquid in the bottle would evaporate and flow out quickly as the relative pressure drops to a certain extent. Therefore, it is necessary to prevent shale gas from bursting out when the relative pressure drops to a critical pressure.
Table 3 depicts the pore structure parameters including pore volume, specific surface area, and mean pore diameter obtained from N2 adsorption isotherms. We computed the total pore volume based on the Barrett–Joyner–Halenda (BJH) model [41]. The total pore volume of the Upper/Lower Bakken shale samples is relatively small with an average of 3.92 cm3/kg, while that of the Middle Bakken ranges from 13.52 cm3/kg to 24.95 cm3/kg, with an average of 18.52 cm3/kg. The average pore diameter of the Upper/Lower Bakken shale samples varies between 3.5 and 9.84 nm, with an average of 6.03 nm. However, the average pore diameter of the Middle Bakken sample is between 9.05 and 25.72 nm, with an average of 18.04 nm, which is significantly greater than that of the Upper and Lower Bakken samples. The specific surface area of the Middle Bakken samples varies between 1.28 and 8.67 m2/g, with an average of 3.73 m2/g, higher than that of the Upper and Lower Bakken samples, which is between 1.156 and 3.107 m2/g with a mean value of 2.12 m2/g. All these features indicate the samples taken from the Upper and Lower Bakken formations have greater micropores percentage contents than the Middle Bakken samples.
The pore size distributions are obtained from the N2 adsorption isotherms using the BJH model. Figure 5 shows the pore size distribution of sample 1 and sample 8, representing the characteristics of the Upper/Lower Bakken and Middle Bakken, respectively. For the sample 1 of the Upper/Lower Bakken shale, the pore size distribution is characterized by double peaks, consisting of a (left) half peak and a (right) whole peak. The left peak occurs between 2 and 3 nm and the right wave crest is smaller, located between 20 and 60 nm, which suggests the pores of shale samples are dominated by micropores and mesopores, and with only a small amount of macropores. Nevertheless, the pore size distribution of the Middle Bakken samples is featured by a single peak distributed between 5 nm and 10 nm, indicating that the pores of tight sandstone samples mainly develop as mesopores.

4. Discussion

4.1. Correlation of the Pore Structure Parameters

We analyze the correlations of the average pore diameter, the specific surface area, and the total pore volume. In order to describe the correlation, the degree of correlation defined in this study is depicted in Table 4. Figure 6a shows the relationship between the average pore diameter and the total pore volume. The average pore diameter of the Middle Bakken sample is strongly correlated with the total pore volume with the coefficient of determination (R2) of 0.99. The total pore volume decreases as the average pore diameter increases. In contrast, the average pore diameter of the Upper and Lower Bakken samples was positively correlated with the total pore volume, but the correlation was low, and the coefficient of determination was only 0.22. Figure 6b shows that the average pore diameter has a high and negative correlation with the specific surface area. The correlation coefficient between the two parameters for Upper and Lower Bakken samples is 0.81, and for the Middle Bakken sample is 0.86. As the average pore diameter increases, the specific surface area of the sample gradually becomes smaller, which indicates that the greater the small pore content in the Bakken sample is, the larger the specific surface area. From Figure 6c, a strong positive correlation between the total pore volume and the specific surface area in the Middle Bakken samples, with a correlation coefficient of 0.92 can also be observed. However, no correlation between the two parameters of the Upper and Lower Bakken samples was found. These observations suggest that there is a significant difference in the pore structure between the Upper/Lower Bakken and the Middle Bakken, and the control factors are also obviously different.

4.2. Control of Mineral Composition on Pore Structure

Figure 7 shows the relationships between the quartz content and the pore structure of samples of the Bakken formation. It can be seen that the specific surface area is moderately correlated with the quartz content. For the samples of the Upper and Lower Bakken, the specific surface area decreases with the increase of quartz content, see Figure 7a. However, the specific surface area increases as the quartz content increases for the Middle Bakken samples, as shown in Figure 7d. The quartz content has a weak control over the total pore volume in the Upper and Lower Bakken samples but has an obvious control over that of the Middle Bakken samples, see Figure 7b,e. In the Upper and Lower Bakken samples, the greater the quartz content, the larger the average pore diameter, while there is an opposite trend in the Middle Bakken samples, see Figure 7c,f. These results demonstrate that the quartz has an obvious control over the pore structure of the Middle Bakken tight rock, but its effect on the Upper and Lower Bakken shale is different.
Figure 8 displays the relationships between clay content and pore structures of the Bakken samples. Upon increasing the clay content, the average pore diameter reduces while the specific surface area increases. The tiny intergranular pores between clay minerals increase as the clay content becomes high, which leads to the reduction of the average pore diameter. According to the above discussion, the smaller pores have a larger specific surface area. Thus, more intergranular pores result in a larger total specific surface area. In the Upper and Lower Bakken samples, the lack of any correlation between the clay content and the total pore volume is due to a coefficient of determination of 0.15. However, a positive correlation exists between the clay content and total pore volume in the Middle Bakken samples. That is to say, the total pore volume raises with the increasing of the clay content, as shown in Figure 8e.

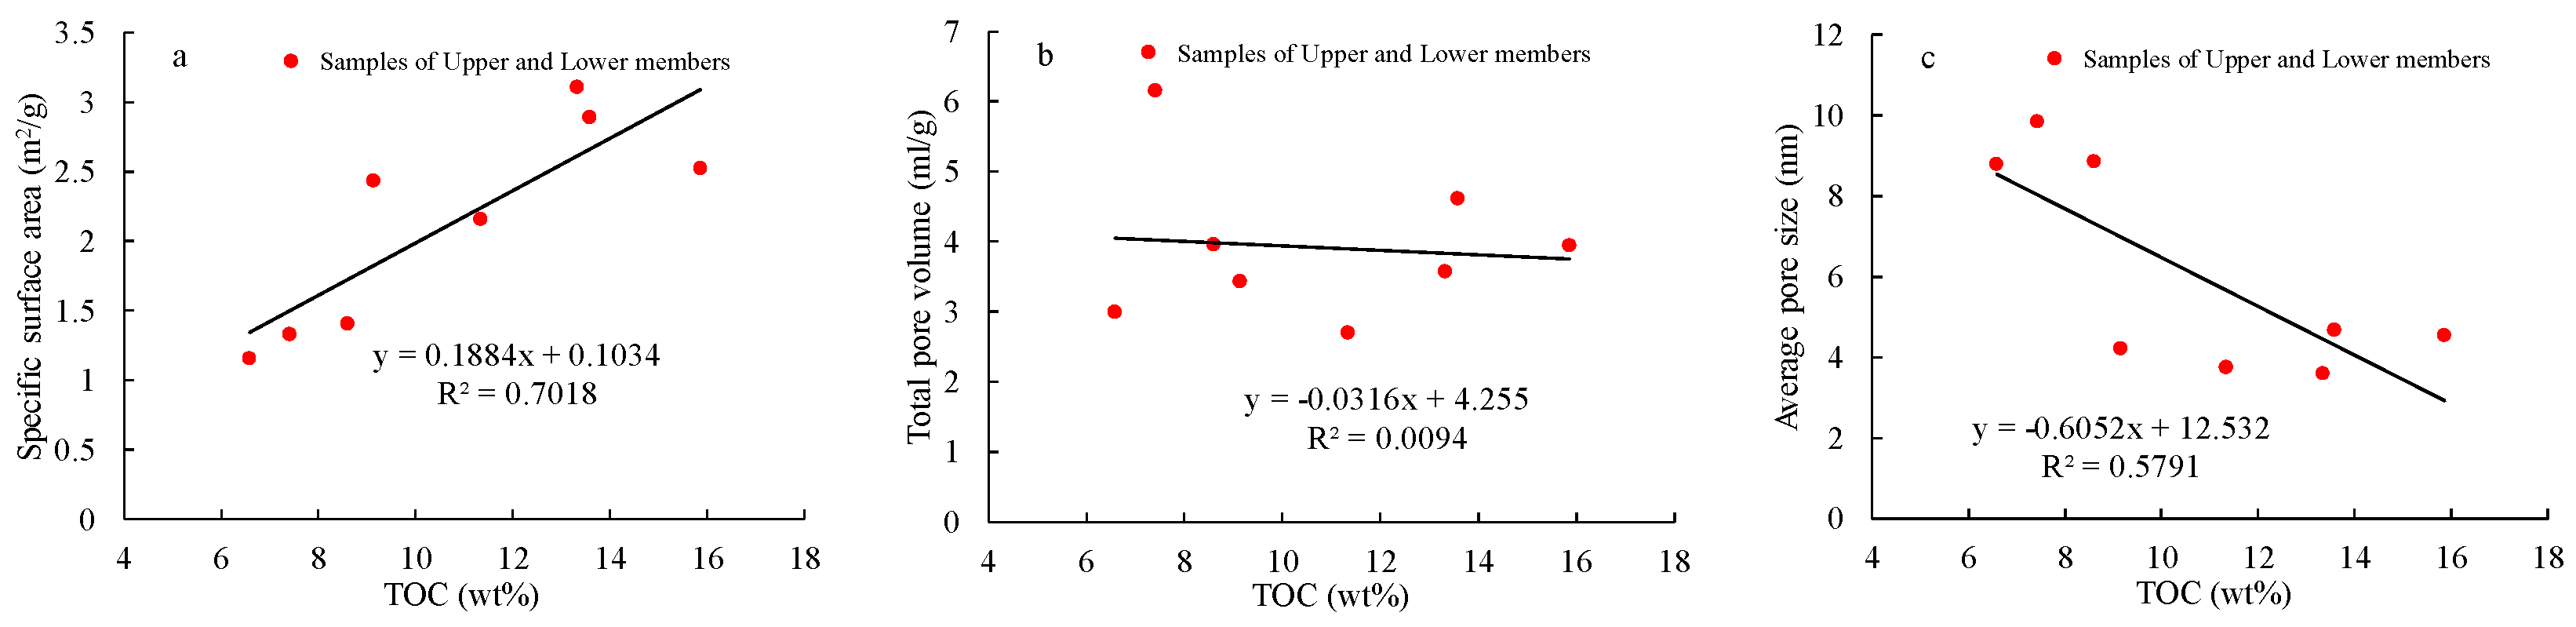
4.3. Relationship between TOC Content and Pore Structure

The TOC content of shale can not only demonstrate the hydrocarbon potential of source rock but is also an important parameter to control the shale pore structure. Generally, the average pore diameter of the organic pore is far less than that of the inorganic pore [46]. Figure 9 displays the relationships between the TOC and the pore structure parameters in the Upper and Lower Bakken shale samples. It can be seen that the TOC is linearly correlated with the specific surface area and the average pore diameter. The coefficients of determination are 0.7 and 0.58, respectively. The specific surface area gradually increases and the average pore diameter gradually reduces as the TOC content increases. This indicates that the TOC is one of the main factors controlling the average pore diameter and the specific surface area of shale.

4.4. Relationship between Thermal Maturity and Pore Structure

The thermal maturity has a complicated effect on the shale pore structure. The degree of thermal evolution not only controls the change of the pore structure but also controls the transformation between the clay minerals, causing the pore structure changes of the clay pores. For example, the montmorillonite can transform into illite with maturity. Thus, the pore structure changes as different clay minerals have different pore shapes [47,48]. The thermal evolution of organic matter in the Upper and Lower Bakken shale is relatively low and belongs to early catagenesis, according to the vitrinite reflectance Ro ranges in Table 1. The relationships between the Ro and the pore structure in the Upper and Lower Bakken shale are shown in Figure 10. It can be seen that the Ro has a poor correlation with the total pore volume of shale. In addition, the specific surface area gradually increases and the average pore diameter gradually decreases with the increase of Ro. It suggests that a large number of micropores are developed in organic matter during the thermal evolution. Micropores usually have a larger specific surface area compared with macropores. Consequently, the degree of thermal evolution is one of the main factors controlling the pore structure of the Upper and Lower Bakken shale.
As for the effect of depositional environment on the pore structure, Zhai et al. [49] reported that in the reduced marine sedimentary environment, larger pores and micro-fracture can be observed in shale. Source rocks in a salinized strong reduction terrestrial sedimentary environment developed laminated layers, while in weak reduction terrestrial sedimentary environment, the rock structure is dominated by blocks and the amount of micro-fracture is less. Bakken Formation was deposited in the reduced marine sedimentary environment. According to Table 3, large pores of Bakken Formation account for an average of 25.7%, which is conducive to oil and gas storage. In different sedimentary environments, the lithology and organic matter contents are different, which results in differences in the pore structure. However, the sedimentary environments vary slightly in a specific study area; hence, the effect of depositional environment on the pore structure should be weak.

5. Conclusions

(1) The Upper and Lower Bakken shale are characterized by rich organic matter and low maturity. TOC content ranges from 6.58% to 15.86%, with an average value of 10.72%. The Ro varies between 0.62% and 1.11%, with an average value of 0.86%.
(2) The pores of the Upper and Lower Bakken shale are dominated by micropores. The specific surface area is distributed from 1.156 to 3.107 m2/g, with an average of 2.12 m2/g. The total pore volume is distributed from 2.69 to 6.15 cm3/kg, with a mean of 3.92 cm3/kg. The average pore diameter is distributed from 3.76 to 9.84 nm, with a mean of 6.03 nm.
(3) The pores of the Middle Bakken formation are dominated by mesopores. The specific surface area ranges from 1.276 to 8.67 m2/g, and the average value is 3.73 m2/g, which is significantly higher than that of the Upper and Lower Bakken shale. The total pore volume is distributed from 13.52 to 24.95 cm3/kg, with an average value of 18.52 cm3/kg, which is also higher than that of the Upper and Lower Bakken shale. The average pore diameter distribution varies between 9.05 nm and 25.72 nm with a mean of 18.04 nm.
(4) The main controlling factors of the pore structure of the Upper and Lower Bakken shale are total organic carbon content and thermal maturity. With the increase of total organic carbon content, the specific surface area of Bakken shale gradually increases, and the average pore radius gradually decreases. With the increase of thermal maturity, the specific surface area of Bakken shale gradually increases, and the average pore radius gradually decreases.
(5) The main controlling factor of the pore structure of the Middle Bakken sample is the content of clay and quartz. With the increase of clay and quartz content, the specific surface area in the Middle Bakken gradually increases, and the average pore radius gradually decreases.

Author Contributions

Conceptualization, Y.L. and B.S.; Methodology, Y.L. and B.S.; Investigation, Z.Y. and P.Z.; Writing-Original Draft Preparation, Y.L.; Writing-Review & Editing, Z.Y. and P.Z.

Funding

This research is was funded by China National Science and Technology Major Project (Grant No. 2016ZX05010-001), the National Basic Research Program of China (Grant No. 2015CB250901) and the National Natural Science Foundation of China (Grant No. 41574121).

Acknowledgments

The authors wish to thank North Dakota Geological Survey, Core Library, for giving us access to the Bakken core samples. The authors thank the Chunxiao Li at the University of North Dakota for helping drill the samples.

Conflicts of Interest

The authors declare no conflict of interest.

References

  1. Liu, K.; Ostadhassan, M.; Zhou, J.; Gentzis, T.; Rezaee, R. Nanoscale pore structure characterization of the Bakken shale in the USA. Fuel 2017, 209, 567–578. [Google Scholar] [CrossRef]
  2. Wood, D.A.; Hazra, B. Characterization of organic-rich shales for petroleum exploration & exploitation: A review—Part 1: Bulk properties, multi-scale geometry and gas adsorption. J. Earth Sci. 2017, 28, 739–757. [Google Scholar] [CrossRef]
  3. Mendhe, V.A.; Mishra, S.; Khangar, R.G.; Kamble, A.D.; Kumar, D.; Varma, A.K.; Singh, H.; Kumar, S.; Bannerjee, M. Organo-petrographic and pore facets of Permian shale beds of Jharia Basin with implications to shale gas reservoir. J. Earth Sci. 2017, 28, 897–916. [Google Scholar] [CrossRef]
  4. Jia, C.Z.; Zou, C.N.; Li, J.Z.; Li, D.H.; Zheng, M. Assessment criteria, main types, basic features and resource prospects of the tight oil in China. Acta Pet. Sin. 2012, 33, 343–350. [Google Scholar]
  5. Zhao, P.; Ma, H.; Rasouli, V.; Liu, W.; Cai, J.; Huang, Z. An improved model for estimating the TOC in shale formations. Mar. Pet. Geol. 2017, 83, 174–183. [Google Scholar] [CrossRef]
  6. Dullien, F.A. Porous Media: Fluid Transport and Pore Structure; Academic Press: New York, NY, USA, 2012. [Google Scholar]
  7. Cai, J.; Wei, W.; Hu, X.; Liu, R.; Wang, J. Fractal characterization of dynamic fracture network extension in porous media. Fractals 2017, 25, 1750023. [Google Scholar] [CrossRef]
  8. Verweij, J.M. Hydrocarbon Migration Systems Analysis; Elsevier: Amsterdam, The Netherlands, 1993. [Google Scholar]
  9. Kong, L.; Ostadhassan, M.; Li, C.; Tamimi, N. Pore characterization of 3D-printed gypsum rocks: A comprehensive approach. J. Mater. Sci. 2018, 53, 5063–5078. [Google Scholar] [CrossRef]
  10. Cai, J.; Yu, B.; Zou, M.; Mei, M. Fractal analysis of invasion depth of extraneous fluids in porous media. Chem. Eng. Sci. 2010, 65, 5178–5186. [Google Scholar] [CrossRef]
  11. International Union of Pure and Applied Chemistry. Physical chemistry division commission on colloid and surface chemistry, subcommittee on characterization of porous solids: recommendations for the characterization of porous solids (technical report). Pure Appl. Chem. 1994, 66, 1739–1758. [Google Scholar] [CrossRef]
  12. Bai, B.; Zhu, R.; Wu, S.; Yang, W.; Gelb, J.; Gu, A.; Zhang, X.; Su, L. Multi-scale method of Nano (Micro)-CT study on microscopic pore structure of tight sandstone of Yanchang Formation, Ordos Basin. Pet. Explor. Dev. 2013, 40, 354–358. [Google Scholar] [CrossRef]
  13. Tüysüz, H.; Lehmann, C.W.; Bongard, H.; Tesche, B.; Schmidt, R.; Schüth, F. Direct imaging of surface topology and pore system of ordered mesoporous silica (MCM-41, SBA-15, and KIT-6) and nanocast metal oxides by high resolution scanning electron microscopy. J. Am. Chem. Soc. 2008, 130, 11510–11517. [Google Scholar] [CrossRef] [PubMed]
  14. Chalmers, G.R.; Bustin, R.M.; Power, I.M. Characterization of gas shale pore systems by porosimetry, pycnometry, surface area, and field emission scanning electron microscopy/transmission electron microscopy image analyses: Examples from the Barnett, Woodford, Haynesville, Marcellus, and Doig units. AAPG Bull. 2012, 96, 1099–1119. [Google Scholar] [CrossRef]
  15. Wang, Z.L. Transmission electron microscopy of shape-controlled nanocrystals and their assemblies. J. Phys. Chem. B 2000, 104, 1153–1175. [Google Scholar] [CrossRef]
  16. Wang, X.; Hou, J.; Liu, Y.; Zhao, P.; Ma, K.; Wang, D.; Ren, X.; Yan, L. Overall PSD and fractal characteristics of tight oil reservoirs: A case study of Lucaogou Formation in Junggar Basin, China. Fractals 2019, 27, 1940005. [Google Scholar] [CrossRef]
  17. Wang, X.; Hou, J.; Song, S.; Wang, D.; Gong, L.; Ma, K.; Liu, Y.; Li, Y.; Yan, L. Combining pressure-controlled porosimetry and rate-controlled porosimetry to investigate the fractal characteristics of full-range pores in tight oil reservoirs. J. Pet. Sci. Eng. 2018, 171, 353–361. [Google Scholar] [CrossRef]
  18. Wang, L.; Zhao, N.; Sima, L.; Meng, F.; Guo, Y. Pore structure characterization of the tight reservoir: systematic integration of mercury injection and nuclear magnetic resonance. Energy Fuels 2018, 32, 7471–7484. [Google Scholar] [CrossRef]
  19. Zhao, P.; Sun, Z.; Luo, X.; Wang, Z.; Mao, Z.; Wu, Y.; Xia, P. Study on the response mechanisms of nuclear magnetic resonance (NMR) log in tight oil reservoirs. Chin. J. Geophys. 2016, 29, 1927–1937. [Google Scholar]
  20. Kruk, M.; Jaroniec, M.; Sayari, A. Application of large pore MCM-41 molecular sieves to improve pore size analysis using nitrogen adsorption measurements. Langmuir 1997, 13, 6267–6273. [Google Scholar] [CrossRef]
  21. Yang, F.; Ning, Z.; Liu, H. Fractal characteristics of shales from a shale gas reservoir in the Sichuan Basin, China. Fuel 2014, 115, 378–384. [Google Scholar] [CrossRef]
  22. Yang, R.; He, S.; Hu, Q.; Sun, M.; Hu, D.; Yi, J. Applying SANS technique to characterize nano-scale pore structure of Longmaxi shale, Sichuan Basin (China). Fuel 2017, 197, 91–99. [Google Scholar] [CrossRef]
  23. Ferrero, G.A.; Preuss, K.; Fuertes, A.B.; Sevilla, M.; Titirici, M.M. The influence of pore size distribution on the oxygen reduction reaction performance in nitrogen doped carbon microspheres. J. Mater. Chem. A 2016, 4, 2581–2589. [Google Scholar] [CrossRef] [Green Version]
  24. Sandoval-Díaz, L.E.; Aragon-Quiroz, J.A.; Ruíz-Cardona, Y.S.; Domínguez-Monterroza, A.R.; Trujillo, C.A. Fractal analysis at mesopore scale of modified USY zeolites by nitrogen adsorption: A classical thermodynamic approach. Microporous Mesoporous Mater. 2017, 237, 260–267. [Google Scholar] [CrossRef]
  25. Saidian, M.; Prasad, M. Effect of mineralogy on nuclear magnetic resonance surface relaxivity: A case study of Middle Bakken and Three Forks formations. Fuel 2015, 161, 197–206. [Google Scholar] [CrossRef]
  26. Wang, L.; Fu, Y.; Li, J.; Sima, L.; Wu, Q.; Jin, W.; Wang, T. Mineral and pore structure characteristics of gas shale in Longmaxi formation: A case study of Jiaoshiba gas field in the southern Sichuan Basin, China. Arab. J. Geosci. 2016, 9, 733. [Google Scholar] [CrossRef]
  27. Su, S.; Jiang, Z.; Shan, X.; Zhang, C.; Zou, Q.; Li, Z.; Zhu, R. The effects of shale pore structure and mineral components on shale oil accumulation in the Zhanhua Sag, Jiyang Depression, Bohai Bay Basin, China. J. Pet. Sci. Eng. 2018, 165, 365–374. [Google Scholar] [CrossRef]
  28. Webster, R.L. Petroleum source rocks and stratigraphy of the Bakken Formation in North Dakota. AAPG Bull. 1984, 68, 953. [Google Scholar]
  29. Meissner, F.F. Petroleum geology of the Bakken Formation Williston Basin, North Dakota and Montana. In 1991 Guidebook to Geology and Horizontal Drilling of the Bakken Formation: Billings; Hanson, W.B., Ed.; Montana Geological Society: Billings, MT, USA, 1991. [Google Scholar]
  30. Smith, M.G.; Bustin, R.M. Lithofacies and paleoenvironments of the Upper Devonian and Lower Mississippian Bakken Formation, Williston Basin. Bull. Can. Pet. Geol. 1996, 44, 495–507. [Google Scholar]
  31. Pitman, J.K.; Price, L.C.; LeFever, J.A. Diagenesis and Fracture Development in the Bakken Formation, Williston Basin: Implications for Reservoir Quality in the Middle Member (No. 1653); U.S. Department of the Interior, U.S. Geological Survey: Denver, CO, USA, 2001.
  32. Havens, J.B.; Batzle, M.L. Minimum horizontal stress in the Bakken Formation. In Proceedings of the 45th U.S. Rock Mechanics/Geomechanics Symposium, San Francisco, CA, USA, 26–29 June 2011. [Google Scholar]
  33. Sayers, C.M.; Dasgupta, S. Elastic anisotropy of the Middle Bakken Formation. Geophysics 2014, 80, D23–D29. [Google Scholar] [CrossRef]
  34. Liu, K.; Ostadhassan, M. Quantification of the microstructures of Bakken shale reservoirs using multi-fractal and lacunarity analysis. J. Nat. Gas Sci. Eng. 2017, 39, 62–71. [Google Scholar] [CrossRef]
  35. Li, H.; Hart, B.; Dawson, M.; Radjef, E. Characterizing the Middle Bakken: Laboratory measurement and rock typing of the Middle Bakken Formation. In Proceedings of the Unconventional Resources Technology Conference, San Antonio, TX, USA, 20–22 July 2015. [Google Scholar]
  36. Liu, K.; Ostadhassan, M.; Kong, L. Fractal and multifractal characteristics of pore throats in the Bakken Shale. Transp. Porous Med. 2018, 1–20. [Google Scholar] [CrossRef]
  37. Sonnonberg, S.A.; Jin, H.; Sarg, J.F. Bakken mudrocks of the Williston Basin, world class source rocks. In Proceedings of the AAPG Annual Convention and Exhibition, Houston, TX, USA, 11–13 April 2011. [Google Scholar]
  38. Zhao, P.; Ostadhassan, M.; Shen, B.; Liu, W.; Abarghani, A.; Liu, K.; Luo, M.; Cai, J. Estimating thermal maturity of organic-rich shale from well logs: Case studies of two shale plays. Fuel 2019, 235, 1195–1206. [Google Scholar] [CrossRef]
  39. Li, C.; Ostadhassan, M.; Gentzis, T.; Kong, L.; Carvajal-Ortiz, H.; Bubach, B. Nanomechanical characterization of organic matter in the Bakken formation by microscopy-based method. Mar. Pet. Geol. 2018, 96, 128–138. [Google Scholar] [CrossRef]
  40. Brunauer, S.; Emmett, P.H.; Teller, E.J. Adsorption of gases in multimolecular layers. J. Am. Chem. Soc. 1938, 60, 309–319. [Google Scholar] [CrossRef]
  41. Barrett, E.P.; Joyner, L.G.; Halenda, P.P. The determination of pore volume and area distributions in porous substances. I. Computations from nitrogen isotherms. J. Am. Chem. Soc. 1951, 73, 373–380. [Google Scholar] [CrossRef]
  42. Abarghani, A.; Ostadhassan, M.; Gentzis, T.; Carvajal-Ortiz, H.; Bubach, B. Organofacies study of the Bakken source rock in North Dakota, USA, based on organic petrology and geochemistry. Int. J. Coal Geol. 2018, 188, 79–93. [Google Scholar] [CrossRef]
  43. Groen, J.C.; Peffer, L.A.; Pérez-Ramírez, J. Pore size determination in modified micro-and mesoporous materials. Pitfalls and limitations in gas adsorption data analysis. Microporous Mesoporous Mater. 2003, 60, 1–17. [Google Scholar] [CrossRef]
  44. Sing, K.S. Reporting physisorption data for gas/solid systems with special reference to the determination of surface area and porosity (Recommendations 1984). Pure Appl. Chem. 1985, 57, 603–619. [Google Scholar] [CrossRef] [Green Version]
  45. Jiang, F.; Chen, D.; Wang, Z.; Xu, Z.; Chen, J.; Liu, L.; Huyan, Y.; Liu, Y. Pore characteristic analysis of a lacustrine shale: A case study in the Ordos Basin, NW China. Mar. Pet. Geol. 2016, 73, 554–571. [Google Scholar] [CrossRef]
  46. Guo, X.; Li, Y.; Liu, R.; Wang, Q. Characteristics and controlling factors of micropore structures of the Longmaxi Shale in the Jiaoshiba area, Sichuan Basin. Nat. Gas Ind. B 2014, 1, 165–171. [Google Scholar] [CrossRef]
  47. Wei, X.; Liu, R.; Zhang, T.; Liang, X. Micro-pores structure characteristics and development control factors of shale gas reservoir: A case of Longmaxi formation in XX area of southern Sichuan and northern Guizhou. Nat. Gas Geosci. 2013, 24, 1048–1059. [Google Scholar]
  48. Liu, Y.; Zhang, B.; Dong, Y.; Qu, Z.; Hou, J. The determination of variogram in the presence of horizontal wells—An application to a conglomerate reservoir modeling, East China. J. Pet. Sci. Eng. 2018. [Google Scholar] [CrossRef]
  49. Zhai, Z.; Wang, X.; Li, Z.; Li, J.; Liu, Q. The influence of shale sedimentary environments on oil and gas potential: Examples from China and North America. Geol. J. China Univ. 2016, 22, 690–697. [Google Scholar]
Figure 1. Location of the Williston Basin and study area.
Energies 11 02879 g001
Figure 2. Basin schematic diagram and the typical log curves (modified after Liu et al. [1]).
Energies 11 02879 g002
Figure 3. The nitrogen adsorption-desorption curves of the Bakken samples. (a) Upper Bakken; (b) Middle Bakken; (c) Lower Bakken.
Energies 11 02879 g003aEnergies 11 02879 g003b
Figure 4. Three types of adsorption-desorption curves of Bakken samples. (a) Type A; (b) Type B; (c) Type C.
Energies 11 02879 g004
Figure 5. The pore size distributions of the samples 1 and 8. (a) Sample 1 of the Upper/Lower Bakken; (b) Sample 8 of the Middle Bakken.
Energies 11 02879 g005
Figure 6. The interrelation of pore structure parameters of the Bakken samples. (a) Total pore volume vs. average pore diameter; (b) Specific surface area vs. average pore diameter; (c) Specific surface area vs. total pore volume.
Energies 11 02879 g006
Figure 7. The relationship between pore structure parameters and quartz content. (a) Specific surface area vs. quartz content for Upper/Lower Bakken samples; (b) Total pore volume vs. quartz content for Upper/Lower Bakken samples; (c) Average pore size vs. quartz content for Upper/Lower Bakken samples; (d) Specific surface area vs. quartz content for Middle Bakken samples; (e) Total pore volume vs. quartz content for Middle Bakken samples; (f) Average pore size vs. quartz content for Middle Bakken samples.
Energies 11 02879 g007
Figure 8. The relationship between pore structure parameters and clay content. (a) Specific surface area vs. clay content for Upper/Lower Bakken samples; (b) Total pore volume vs. clay content for Upper/Lower Bakken samples; (c) Average pore size vs. clay content for Upper/Lower Bakken samples; (d) Specific surface area vs. clay content for Middle Bakken samples; (e) Total pore volume vs. clay content for Middle Bakken samples; (f) Average pore size vs. clay content for Middle Bakken samples.
Energies 11 02879 g008
Figure 9. The relationship between total organic carbon content and pore structure parameters in the Upper/Lower Bakken samples. (a) Specific surface area vs. TOC; (b) Total pore volume vs. TOC; (c) Average pore size vs. TOC.
Energies 11 02879 g009
Figure 10. The relationship between pore structure parameters and vitrinite reflectance (Ro) in the Upper/Lower Bakken samples. (a) Specific surface area vs. Ro; (b) Total pore volume vs. Ro; (c) Average pore size vs. Ro.
Energies 11 02879 g010
Table 1. The mineral composition and geochemical characteristics of the Bakken samples.
SampleMembersRo (%)TOC (wt%)Mineral Composition (wt%)
ClayQuartzPyritePotassium FeldsparAlbiteDolomiteCalcite
#1Upper Bakken0.9413.5744.8739.574.506.113.351.60-
#2Upper Bakken0.627.4142.2945.084.335.391.571.34-
#3Upper Bakken0.889.1436.2448.904.326.653.340.230.32
#4Upper Bakken0.9313.3324.0763.595.733.582.200.680.15
#5Middle Bakken--27.4531.433.617.575.8915.568.49
#6Middle Bakken--36.1834.495.774.254.255.249.82
#7Middle Bakken--26.1643.282.651.312.6116.447.55
#8Middle Bakken--13.2733.143.312.6619.5420.727.36
#9Lower Bakken0.826.5849.2338.365.062.053.851.120.33
#10Lower Bakken0.8511.3453.9238.042.292.162.630.310.65
#11Lower Bakken1.1115.8636.6350.274.583.204.050.740.45
#12Lower Bakken0.738.5950.5938.444.574.601.650.15-
Table 2. Ideal pore model division of Bakken formation samples.
TypeSamplesPore MorphologyHysteresis LoopPore Model
I3, 10Pores closed at one endNoCylindrical pores closed at one end, wedge-shaped pores
II1, 4, 5, 6, 7, 8, 9, 11, 12Open poresYesCylindrical pores, parallel-plate pores
III2Ink bottle-like poresYesInk bottle-like pores
Table 3. Pore structure parameters of the Bakken samples.
SampleMicropore Volume (cm3/kg)Mesopore Volume (cm3/kg)Macropore Volume (cm3/kg)Total Pore Volume (cm3/kg)BET Specific Surface Area (m2/g)Average Pore Diameter (nm)
#10.483.061.074.612.8864.67
#20.574.521.066.151.3289.842
#30.422.170.843.432.4354.221
#40.432.530.613.573.1073.598
#50.566.386.5813.521.27625.716
#63.418.343.2124.958.679.053
#70.667.67.1115.371.44923.166
#81.5715.143.5320.243.5514.256
#90.371.790.832.991.1568.804
#100.381.760.552.692.1593.765
#110.522.670.753.942.5224.549
#120.382.241.333.951.4068.864
Table 4. The defined degree of correlation.
Ranges for the Coefficient of Determination (R2)Degree of Correlation
0.9–1Strong
0.7–0.9High
0.4–0.7Medium
0.2–0.4Low
0.0–0.2Not exist

