Article

Evaluation of Displacement Effects of Different Injection Media in Tight Oil Sandstone by Online Nuclear Magnetic Resonance

1
School of Engineering Science, University of Chinese Academy of Sciences, Beijing 100049, China
2
Institute of Porous Flow and Fluid Mechanics, Chinese Academy of Sciences, Langfang 065007, China
3
PetroChina Research Institute of Petroleum Exploration & Development, Beijing 100083, China
4
PetroChina Bohai Drilling Engineering Company Limited, Tianjin 300280, China
*
Author to whom correspondence should be addressed.
Energies 2018, 11(10), 2836; https://doi.org/10.3390/en11102836
Submission received: 13 September 2018 / Revised: 29 September 2018 / Accepted: 19 October 2018 / Published: 20 October 2018

Abstract

:
In order to evaluate the displacement effect of four kinds of injection media in tight oil sandstone, water, active water, CO2, N2 flooding experiments were carried out in laboratory. Online Nuclear Magnetic Resonance (NMR) spectrometers combine the advantages of NMR technology and core displacement experiments. In the displacement experiment, NMR data of different injection volumes were obtained and magnetic resonance imaging (MRI) was carried out. The results showed that micro and sub-micropores provided 62–97% of the produced crude oil. The enhanced oil recovery ratio of active water flooding was higher than that of conventional water flooding up to 10%. The recovery ratio of gas flooding in micro and sub-micropores was 60–70% higher than that of water flooding. The recovery ratio of CO2 flooding was 10% higher than that of N2 flooding. The remaining oil was mainly distributed in pores larger than 0.1 μm. Under the same permeability level, the remaining oil saturation of cores after gas flooding was 10–25% lower than water flooding. From MRI images, the displacement effects from good to bad were as follows: CO2 flooding, N2 flooding, active water flooding, and conventional water flooding.

1. Introduction

In the face of the continuous growth of world oil and gas demand and the decline of conventional resources production, tight oil resources with great potential have gradually become burning issues in global petroleum exploration and development [1,2,3,4]. China has abundant and plentiful tight oil resources [5], most of which are continental deposits, unlike the United States, where they are marine deposits [6]. Therefore, the development difficulty of tight oil reservoirs in China is different from that in the United States. Comparing with conventional oil and gas reservoirs, tight oil reservoir is mainly the reservoir with extremely poor physical properties in large area [7,8]. The source beds are closely related to the reservoirs, and there is no obvious boundary of the trap [9]. Development experience shows that the combination of long horizontal wells and multi-stage fracturing is an effective method for economic exploitation of tight oil reservoirs [10,11,12]. At present, China has carried out tight oil reservoirs development in Ordos, Songliao, Santanghu, and Junggar Basin [6]. The difficulty to develop tight oil reservoirs is mainly in two aspects. First, the tight oil reservoir has small pore throat radius [13], high clay mineral content, low permeability and obvious non-Darcy seepage [14,15], which makes it difficult to supplement formation energy by conventional water injection [16]. Second, the production of water flooding development decreases rapidly and the recovery ratio is low, thus it is necessary to inject medium into formation to supplement formation energy for a long time [17].
At present, the common injection media include water, active water, CO2 and N2. Each injection medium has its own merits and demerits [18]. For the selection of injection medium in tight oil reservoirs, the enhancing oil recovery effect, energy supplement effect and comprehensive cost should be considered comprehensively [19]. Because the water was easy to get, the costs of conventional water flooding were low [20]. Water was also commonly used injection medium tight oil reservoir exploitation [21]. However, the problem is that the tight oil reservoir is too tight, resulting in high injection pressure, serious casing damage, and short life of oil and water wells [22]. The active water flooding is to add surfactant into the water as the injection medium. Surfactant has the ability to reduce the oil-water interfacial tension apparently and effectively, change the internal wettability of porous media, and increase the dispersion of crude oil in water, thereby effectively improving oil recovery [23,24,25]. Active water flooding had a good performance in the development of tight reservoirs in Ordos Basin and had great potential in the future [26,27]. When injecting CO2 into reservoirs, CO2 can reduce viscosity of crude oil, improve the oil-water mobility ratio, promote oil-water miscibility, extract light hydrocarbons, and reduce interfacial tension [28,29]. With the development of CO2 production and recycling technology, the cost of CO2 flooding is decreasing [30,31]. For low permeability and tight reservoirs, it has been proved that CO2 can effectively enhanced oil recovery [32,33]. N2 flooding can expand the volume of crude oil, thereby reducing the viscosity of crude oil and supplement formation energy [34]. And the cost of producing N2 was lower than that of CO2 [35]. Some ultra-low permeability oil fields had chosen N2 flooding as injection medium to enhanced oil recovery after water flooding, and achieved good effects [36].
Since the first pulse NMR logging instrument was applied to commercial service in the early 1990s, one-dimensional NMR technology based on CPMG pulse sequence has entered a high-speed development period [37,38,39]. It has been successfully used in porosity measurement, permeability calculation, saturation calculation, pore structure evaluation and fluid identification [40]. In 2002, Hürlimann et al. [41] created a two-dimensional NMR core analysis technique, which was typically represented by D-T2, and successfully applied to medium-high porosity and permeability cores. However, due to the closer diffusion coefficient of inside fluid, lower porosity and less fluid existing in the tight core, the effect of two-dimensional nuclear magnetic resonance on the tight core is not satisfactory [42]. Therefore, for the quantitative analysis of tight core, NMR one-dimensional T2 spectrum is more accurate.
In traditional displacement experiments, when core was removed at the end of displacement, the temperature and confining pressure will change, which will give rise to changes of the pore and fluid distribution in the core. Meanwhile, the oil and water around the core will be dissipated after the core is removed, resulting in inaccurate measurement of the NMR [43]. Online NMR technology has effectively solved the above problems. Online NMR technology combines NMR and displacement equipment [44]. The material of core gripper and inner rubber sleeve is nonmagnetic [45]. And the confining pressure and temperature remain stable through circulating fluorinated oil. In the core displacement experiment, online NMR spectrometer can measure the T2 spectrum and carry out MRI under high temperature and pressure [46]. The experimental process can perform without taking the core out, and the confining pressure and temperature can be controlled [45]. Therefore, the measured data are closer to the actual situation during the oilfield development.
In this work, four kinds of common injection media, such as simulated formation water, active water, CO2, N2, were selected to carry out laboratory oil displacement experiments on tight oil cores. Online NMR spectrometer was applied to measure the NMR data and carry out MRI of different displacement volumes at constant temperature and confining pressure. The T2 spectra were obtained by inversion software calculation. The pore structure in the core was analyzed, and the oil recovery ratio and residual oil saturation under different injection media and displacement volumes were compared. The displacement effects of different injection media were compared visually by MRI images. Studying the displacement effects of different injection media on tight oil cores under the same experimental conditions are helpful for each oilfield to optimize the injection medium in combination with its own conditions.

2. Fundamental Theory

2.1. NMR Measurement of Fluid Content in Porous Media

NMR is a physical process in which the spin energy level of an atomic nucleus with non-zero magnetic moments undergoes Zeeman splitting under an external magnetic field and resonantly absorbs a certain frequency of radio frequency radiation. Commonly used in petroleum exploration and development is the detection of hydrogen nucleus in fluids [47]. Oil and water in porous media are rich in hydrogen nucleus. Hydrogen nucleus has nuclear magnetic moment, and the nuclear magnetic moment will generate energy level splitting in an external magnetic field. When external radio frequency magnetic field generate a specific frequency, the nuclear magnetic moment will occur absorption transition, and producing NMR signal. The intensity of NMR signal becomes stronger with the increase of the number of hydrogen nucleus in the sample. The relaxation time is the time when the magnetic vector deviates from the equilibrium state and returns to the equilibrium state after NMR occurs under the excitation of radio frequency field. The longitudinal relaxation time T1 and the transverse relaxation time T2 are two independent relaxation processes. In the petroleum industry, NMR spectrometer usually measures T2 relaxation time [48].
As shown in Equation (1), the relaxation time distribution reflects the specific surface area of the rock, which corresponding to the pore size [13,49,50]. The surface relaxation strength ρ2 is a parameter for characterizing fluid properties in porous media, which is related to the internal surface properties and mineral composition. When ρ2 is constant, the larger the porosity of porous media is, the longer the T2 relaxation time is; the smaller the porosity is, and the shorter the T2 relaxation time is. This important conclusion is the basis of the following research:
1 T 2 ρ 2 S V
where T2 is the transverse relaxation time of fluid in pores (ms), ρ2 is surface relaxation strength of porous media (μm/ms), and S/V is the pore specific surface in porous media (1/μm).
The data collected by NMR spectrometer is the decay curve of the total NMR signal intensity with time during relaxation process. The distribution spectrum of relaxation time T2 can be obtained by multi exponential fitting of echo strings with NMR inversion software. The T2 spectra of a tight oil sandstone core under different N2 displacement volumes are shown in Figure 1. The NMR spectrum of oil phase was shifted to the right side, indicating that the molecular force between the oil molecules and the pore wall was relatively weak. The reason is that the core was hydrophilic and the oil phase was non-wetting phase. The saturated oil was more likely to exist in macropores and as oil droplets in the center of the pore, thus the signal was shifted to the right side [51].

2.2. MRI of Cores

MRI technology uses the hydrogen nucleus in porous media for imaging. As a consequence the MRI image reflects how much fluid there is in the porous media, which is contrary to the X-ray picture reflecting the rock skeleton. Based on this characteristic, the displacement effects of different injection media can be detected because only crude oil has signal in displacement experiment. Furthermore, the dynamic changes of remaining oil under different displacement volumes can be obtained visually [52]. Because of the low porosity of tight cores and the low fluid content, the image resolution is relatively low. For tight cores, MRI images can only be used for qualitative observation.
The basic process of MRI for core is as follows: firstly, a certain layer of core was selected by radio frequency pulse. Secondly, the instrument carried on the phase coding and frequency coding to the target layer under the gradient magnetic field. Thirdly, receiver collected echo signal, and then the gray level image of the target layer was obtained by Fourier transform [44]. Finally, MRI processing software was applied to add pseudo color to get easily recognizable images.

3. Experimental

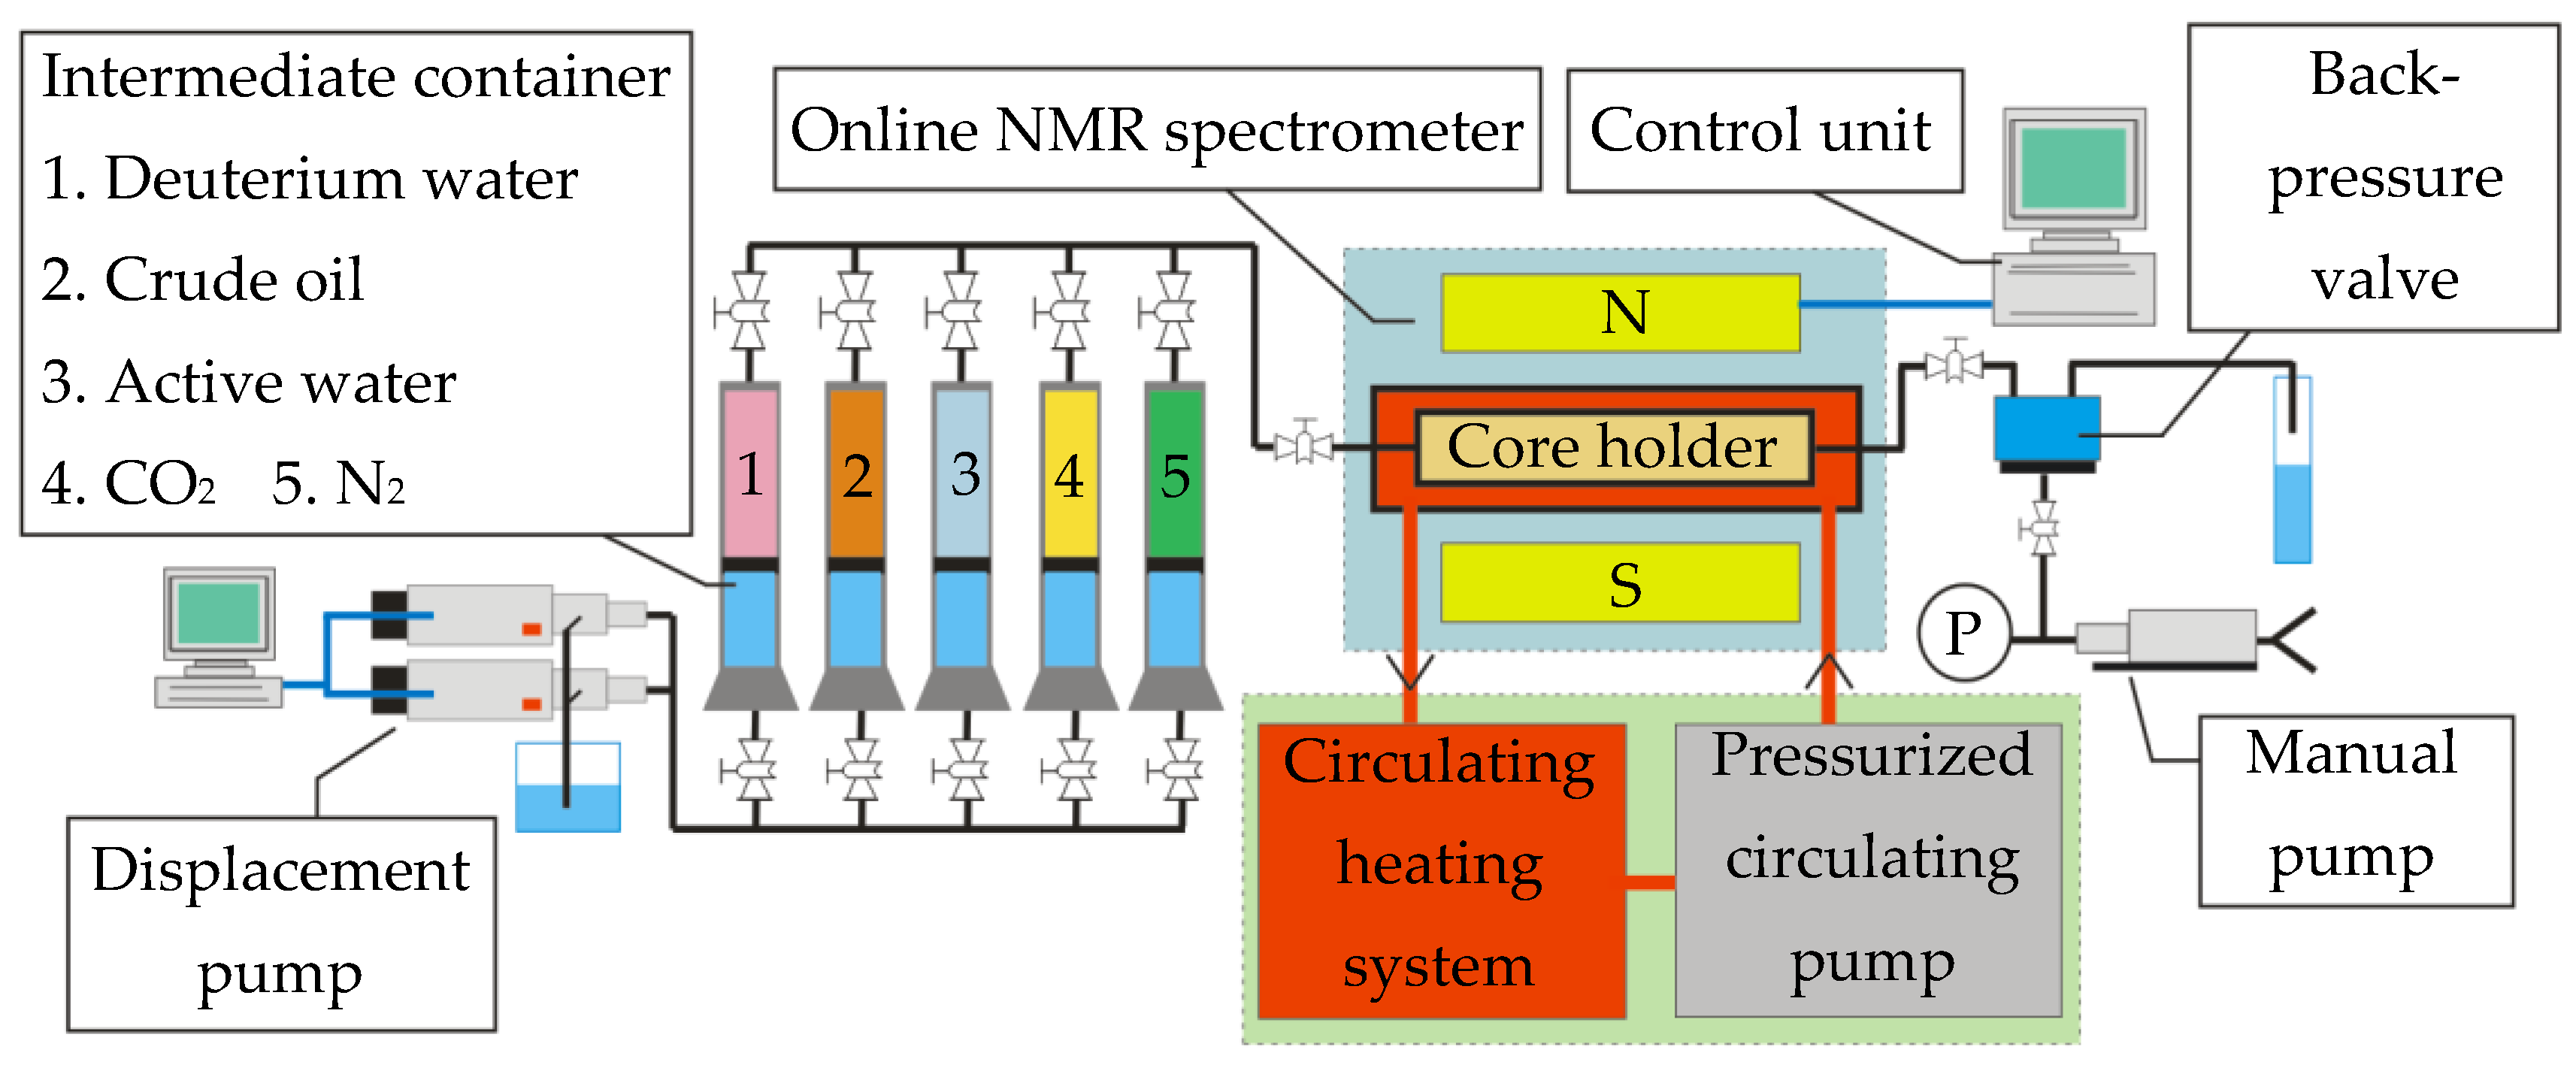
3.1. Experimental Equipment

Figure 2 is the flow chart of the experimental equipment. The test fluids were pressurized by two Q5000 displacement pumps (Quizix, Tulsa, America). Deuterium water, crude oil, active water, CO2 and N2 were contained in five intermediate containers respectively. MacroMR12 online NMR equipment (Niumag Analytical Company, Suzhou, China) was applied to log the NMR data as well as MRI images of the cores. The magnetic field strength of the NMR spectrometer was 12 MHz. A pressurized circulation pump (Niumag Analytical Company, Suzhou, China) was used for circulating fluorinated FC-40 fluid and provided confining pressure for core holder. The circulating heating system was used to heat the core by heating fluorination fluid outside the core holder. The back-pressure valve was only used in gas flooding to ensure that the outlet pressure in the core was stable, so that the pressure difference at both ends of the core holder can be controlled. A manual pump (Huaan Scientific Research Devices Company, Nantong, China) was used to set the back-pressure valve pressure.

3.2. Geological Survey and Experimental Samples

The selected cores were taken from tight oil reservoirs in the Ordos Basin. According to particle size, the reservoir was dominated by fine sand, with high content of siltstone and mudstone and dense lithology. Reservoir physical properties were poor, with a low permeability of less than 0.5 × 10⁻³ μm2 and the overall face rate was low. The radius of pore throat was small and the coordination number were 1–4, and the connectivity was poor. The natural fractures were developed and the brittleness index of rock was about 45%. The initial oil saturation of the reservoir was between 50% and 70% and the crude oil had good properties. The reservoir had no edge-bottom water and natural energy was insufficient, so it was categorized as low pressure reservoir. The average porosity of experimental cores is 14.6% and permeability measured with gas ranges from 0.22 × 10⁻³ μm2 to 1.59 × 10⁻³ μm2. 16 pieces of core were chosen and divided into four groups. Table 1 shows the typical characteristics of the experimental cores.
The experimental crude oil was taken from the reservoirs where the cores were located. At 67 °C (formation temperature), the viscosity of formation crude oil was 2.08 mPa·s. The density of crude oil was 0.77 g/cm3, which belongs to light crude oil. The salt concentration of simulated formation water was 80 g/L. Deuterium water, which salt concentration was 80 g/L, was used to create the original water saturation in cores without generating NMR signals. The active water was prepared by adding TRS10 (a kind of petroleum sulfonate) into deuterated water at a rate of 2 g/L. The interfacial tension of different systems was measured by a TX-500C interface tensiometer (CNG, Stafford, America) and are listed in Table 2. TRS10 could effectively reduce the oil-water interfacial tension, and was still effective at formation temperature [53]. In order to ensure the same injection pressure (10 Mpa), the CO2 flooding experiment was CO2 immiscible flooding. Both CO2 and N2 in the experiment was high purity. Intermediate containers were applied to contain the fluids used in the experiment.

3.3. Experimental Procedure

The procedures of the experiment are described below. Thirty two cores with four kinds of permeability were chosen, labelled, oil washed, and dried. Then the basic parameters were measured: length, diameter, dry weight, air permeability, and porosity. To prevent all kinds of signal interference, the NMR T2 base signal of core holder should be recorded before every core performing displacement experiments. The cores were vacuumed for 48 h, then inhaled simulated formation water and pressurized to 10 MPa for 24 h. Online NMR spectrometer was applied to record NMR T2 data as well as MRI images of coronal plane under saturated water. Under pressure conditions, the existence of cracks will cause gas channeling, resulting in data skew. As shown in Figure 3, cracks inside the core can be detected by NMR spectra and MRI images.
The NMR T2 data as well as MRI images of cores were examined, and 16 cores without cracks were selected. Then put the cores in the oven and set 120 °C to dry for 48 h to ensure that all the water in the cores evaporates. Afterwards, the cores were vacuumed for 48 h, then inhaled deuterium water and pressurized to 10 MPa for 24 h. Injection flow rate was set as 0.005 mL/min, crude oil was filled in every piece of core, and the displacement volume was 10 pore volume (PV). Subsequently, online NMR spectrometer was employed in recording NMR T2 data. The experimental temperature was set to 67 °C, and the follow-up displacement experiment were carried out at 67 °C. For the sake of preventing the introduction of nuclear magnetic signals, water flooding experiment was conducted with deuterium water. Water flooding, active water flooding, CO2 flooding and N2 flooding experiments were carried out respectively for each group of cores. The displacement pressure was gradually increased to 10.0 MPa. The displacement volume of each core was 10 PV. The pressure of back-pressure value was set as 7.0 MPa when gas flooding experiment was carried out. In the process of displacement experiment, when the displacement was 0.2, 0.5, 1.0, 2.0, 5.0, 10.0 PV, NMR T2 data of the cores were logged by the online NMR spectrometer, which was done with no need for removing the core. As a result of the low core porosity, the internal fluid content was extremely small, the time of MRI was very long. Therefore, it was impossible to accurately record the data before 1 PV. The thickness of the imaging section was set as 15 mm, when the displacement volume was 1, 2, 5, 10 PV, the online NMR spectrometer was applied to obtain MRI images of the cores. Subsequently, the pore volumes, fluid saturation, oil recovery ratio and residual oil distribution were calculated by using NMR data and MRI images. The NMR base signal needs to be subtracted when calculated. Finally, micro displacement mechanism with different injection media were studied.

4. Results and Discussion

4.1. Pore of Tight Oil Sandstone Core

The core NMR T2 spectrum can be converted into the core pore distribution [13,54]. For tight oil sandstone, the pores were divided into nanopores, micro-nanopores, sub-micropores, and micropores according to pore radius [44,55], which were 0.05, 0.1, and 1 μm. The distribution of pore radius was analyzed by NMR data which was acquired from the 16 cores saturated with simulated formation water. Then the volume proportions of the different pores was calculated, as shown in Figure 4. The pore structure and permeability of rocks are closely related. The lower the core permeability was, the more the proportion of nanopores was. When the core permeability was 0.2 × 10⁻³ μm2, the proportion of nanopores plus micro-nanopores was more than 50%. Along with the core permeability increasing, the proportion of sub-micro and micropores was increasing gradually. When the core permeability was over 1.5 × 10⁻³ μm2, the proportion of sub-micropores plus micropores was around 80%.

4.2. Oil Saturation of Tight Oil Sandstone Core

Online NMR spectrometer was applied to log NMR T2 data of each core which was filled with crude oil. The formula for calculating initial oil saturation Soi is shown as [44]:
S oi = T 2 , min T 2 , max A i , o T 2 , min T 2 , max A i , b T 2 , min T 2 , max A i , w T 2 , min T 2 , max A i , b × 100 %
where Soi is the initial oil saturation of the core (%); T2,min and T2,max are the minimum and maximum T2 relaxation time, respectively (ms); and Ai,o, Ai,w and Ai,b are the corresponding signal strength value of NMR T2 relaxation time curves of saturated oil, saturated water and online NMR spectrometer base semaphore, respectively (A/m).
The oil saturation in different pores after the core was filled with crude oil is shown in Table 3. The majority of the crude oil consisted in sub-micro and micropores. Although the volume of nano and micro-nanopores accounts for half of pore volume of the 0.2 × 10⁻³ μm2 core, it was saturated with little crude oil. The main reason for this phenomenon is that these pore radius were less than 100 nm, under normal displacement pressure gradient, it was difficult for crude oil droplet to enter them. As the permeability decreases, the connectivity of the pores is worse. And the wettability of tight oil reservoir belongs to mixed wettability. The tight oil reservoir has complex mineral composition and its distribution is random, therefore the wettability of the rock surface is uneven. The oil wet part is dispersed distribution, the water wet part is a reticular distribution, and the whole is hydrophilic wettability [56]. The reverse imbibition process existed during the displacing process. The reverse imbibition is a process that a medium displaces another medium in a pore through the same throat under the action of the capillary force. The wettability in small pores is generally water wetting, and large pores are generally oil wetting. Because there was not enough capillary force, the oil droplet cannot enter the pores through reverse imbibition process. Therefore, as the core porosity and permeability decrease, it becomes more and more difficult for crude oil to saturate the core. Overall, the average oil saturation of the experimental core was 58.2%, which was close to the reservoir oil saturation (65%) of the tight oil reservoir.

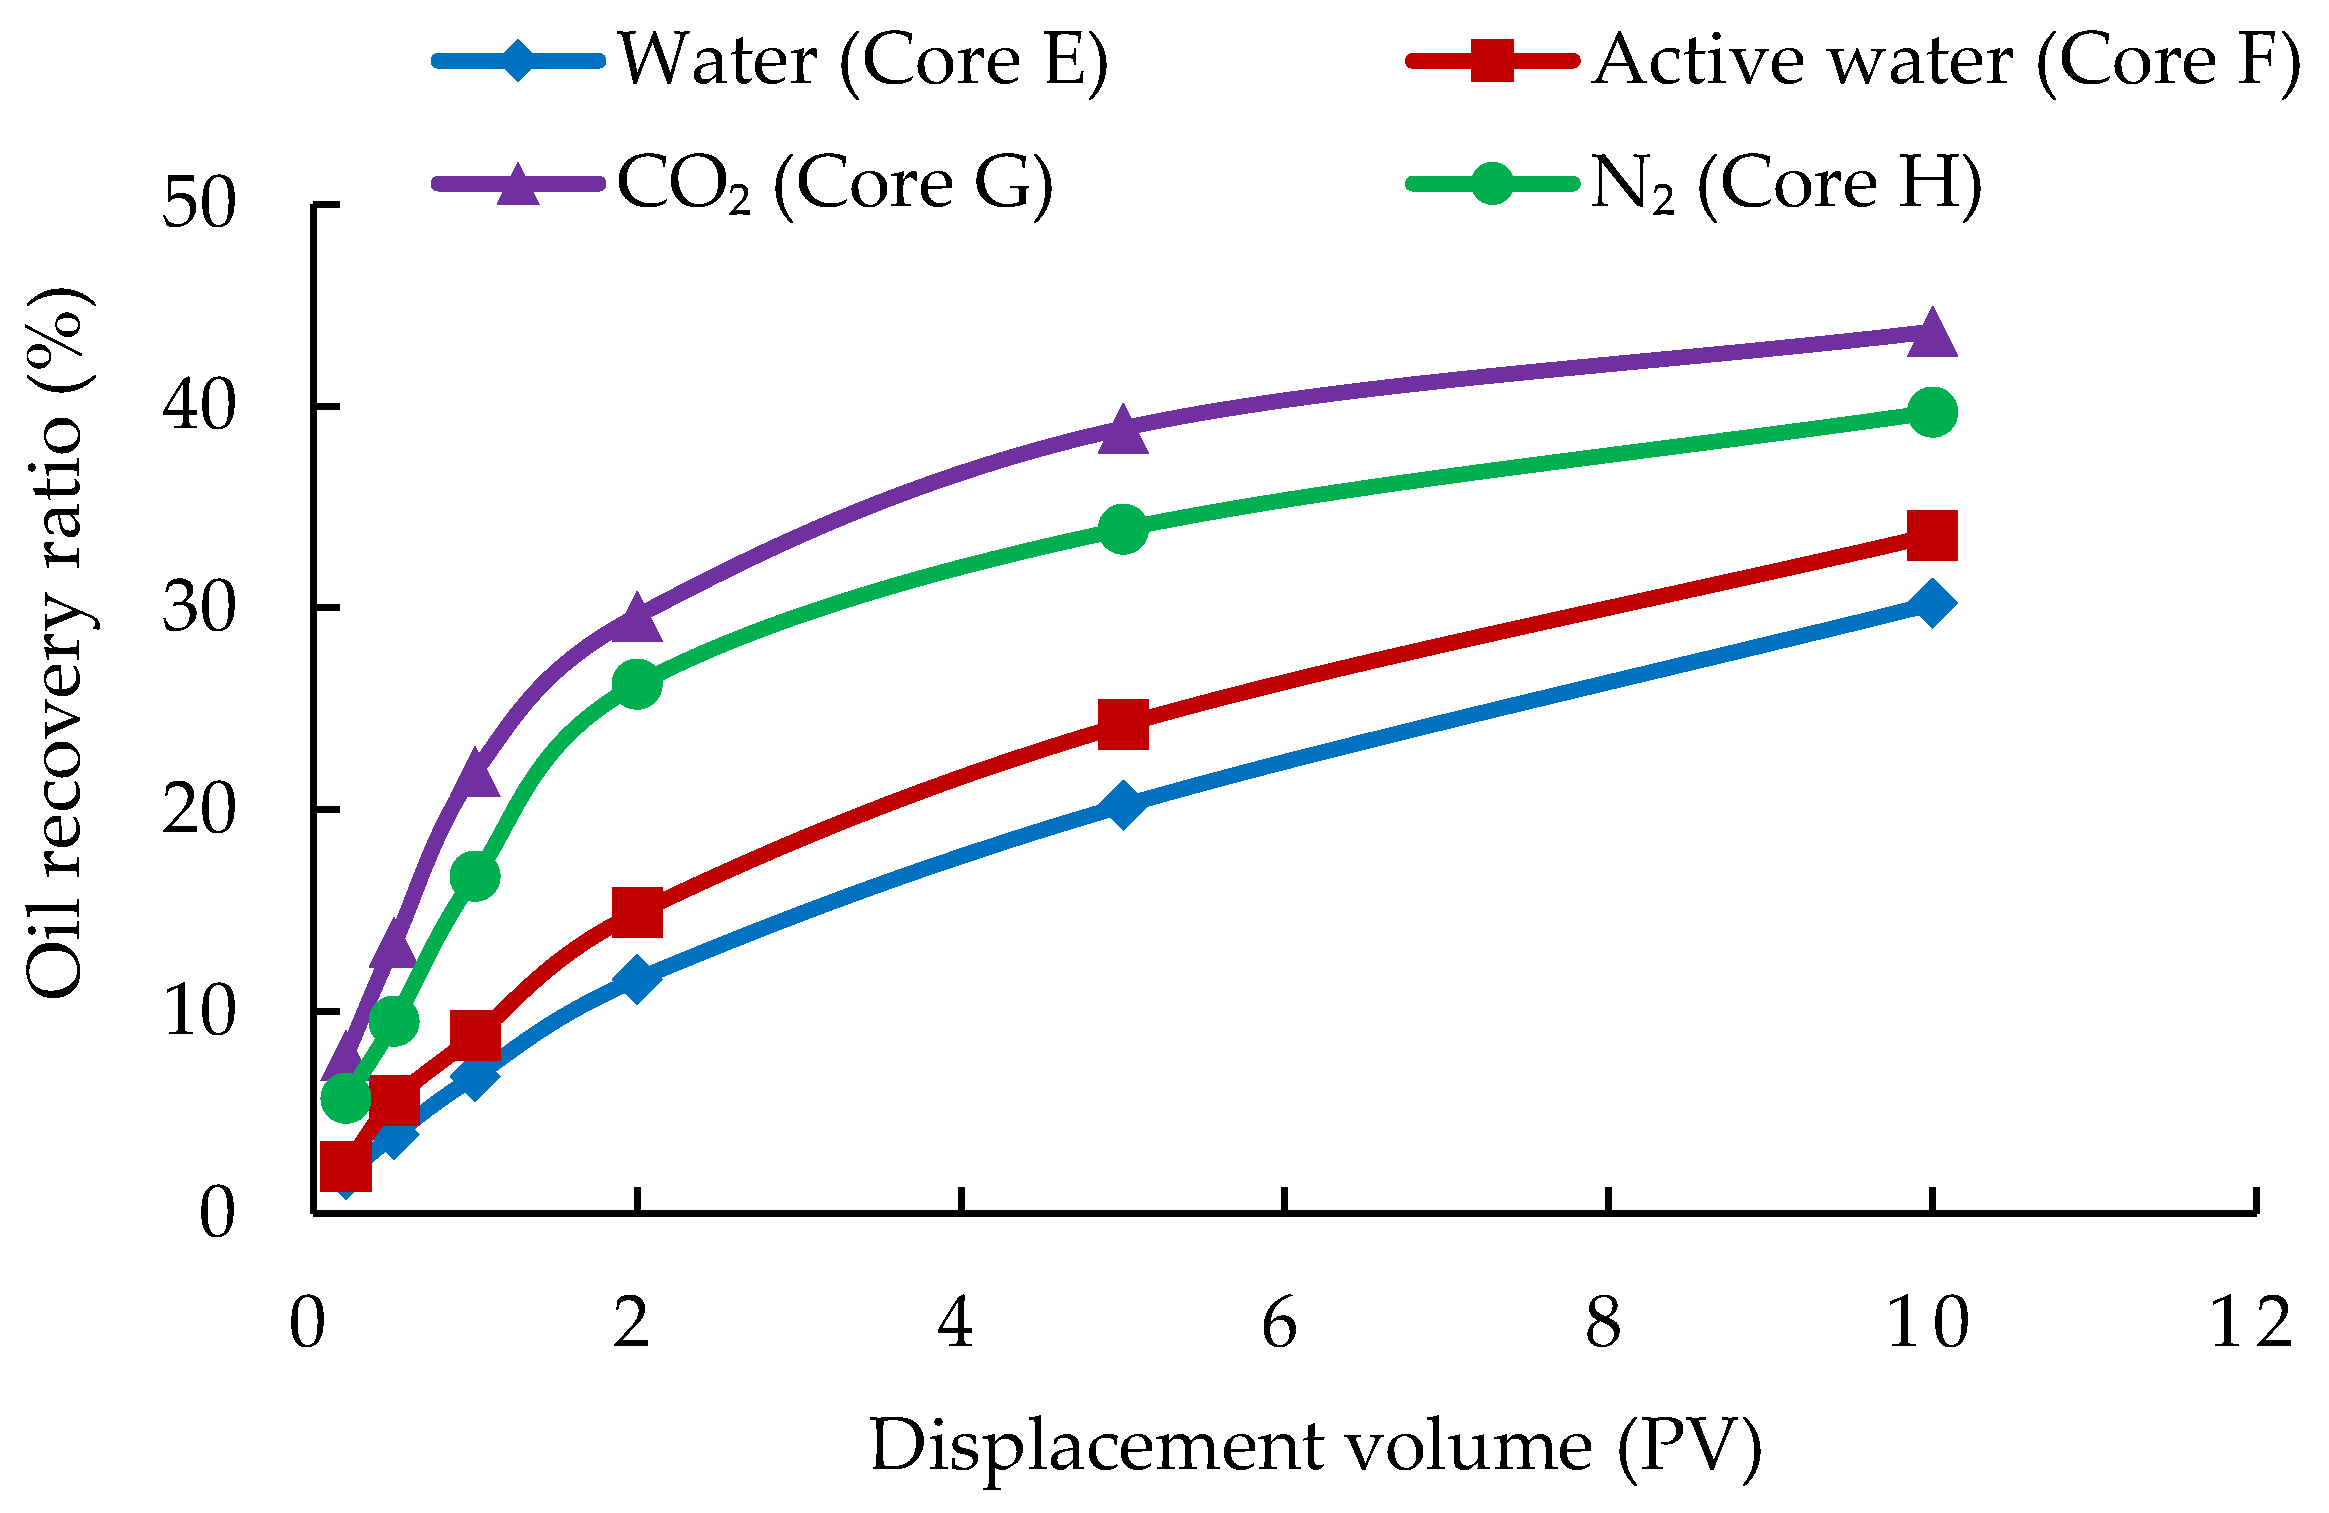
4.3. Oil Recovery Ratio with Different Injection Media

Oil recovery ratio refers to the proportion of the crude oil production to initial oil reserves. In the displacement process, NMR data can be measured in real time by online NMR spectrometer, and then the oil recovery ratio can be calculated according to Equation (3) [44]:
E R = T 2 , min T 2 , max A i , o T 2 , min T 2 , max A i , a T 2 , min T 2 , max A i , o T 2 , min T 2 , max A i , b × 100 %
where ER is the oil displacement effect of the core (%) and Ai,a is the corresponding signal strength value of NMR T2 relaxation time curves after displacement (A/m).
Taking four tight sandstone cores (E, F, G and H) with permeability of 0.5 × 10⁻³ μm2 as examples, the core recovery ratio varied with displacement volume under different injection media are shown in Figure 5 and Figure 6. The oil recovery ratio of two kinds of water flooding basically increased linearly with the increase of displacement volume. There was an inflection point around 2 PV. Before 2 PV, the recovery ratio increased rapidly with the increase of displacement volume. After 2 PV, it increased slowly. This shows that when the displacement volume reached about 2 PV, the injected liquid basically spread to the pores that it can entered in the whole core. The effect of active water flooding was better than conventional water flooding. The displacement effect of active water in nano and micro-nanopores was 42% more than that of water flooding. On the whole, the enhanced oil recovery ratio of active water flooding was higher than that of conventional water flooding up to 10%.
The effect of the two kinds of gas flooding was obviously better than that of the two kinds of water flooding. Compared with water flooding, the recovery ratio of gas flooding was obviously increased at the initial 1 PV, and the inflection point appeared significantly earlier. After the injection of 1 PV, the increase of oil recovery ratio slowed down. The recovery ratio of CO2 flooding was 10% higher than that of N2 flooding. The recovery ratio of gas flooding in micro and sub-micropores was 60–70% higher than that of water flooding. However, it was 1.5 times lower in nano and micro-nanopores. It can be seen that 0.1 μm was the development limit of gas flooding. The main reason is that the fluidity of gas was strong, and the tight porous media have strong internal heterogeneity. Although the cores without cracks have been selected in the early stage of the experiment, it was difficult for gas to undergo a piston-like displacement like water flooding. Instead, gas choses to go through the preferential seepage channel, and then it is difficult for it to spread to nano- and micro-nanopores with very small radius. Therefore, the effect of fingering was more serious for gas flooding. Moreover, the lower the core permeability was, the higher the proportion of imbibition oil recovery was. The cores as a whole were hydrophilic, so that the injected water can effectively displaced the crude oil in the pores of radius less than 0.1 μm by capillary force. When the gas broke through, the gas flow resistance decreased and the gas flow rate increased obviously. The crude oil in the nano and micro-nanopores was difficult to be recovered. Achieved the same displacement volume, the gas flooding time was 1 times less than that of water flooding. Under the injection pressure of 10 MPa, CO2 does not reach the minimum miscible pressure. Therefore, it is not necessary to consider the problem of sediment blocked the channel [57]. On the larger pores, the advantages of gas flooding are obvious. Gas flooding can displace crude oil in pores “cleaner” than water flooding. Considering the economic benefits, the injection volume and injection production pressure difference should be controlled in gas flooding. This allows the gas to spread as much as possible to the micro-nanopores and extends the contact time between the gas and the crude oil.
The oil recovery ratio of tight cores with 4 kinds of permeability and their different pores under different injection media are shown in Figure 7. On the whole, micro and sub-micropores provided 62–97% of the produced crude oil. The recovery ratio of gas flooding was significantly higher than that of water flooding. Compared two kinds of water flooding, the recovery ratio of active water flooding was about 10% higher than that of conventional water flooding.
Compared with the oil recovery ratio in different pores, the recovery ratio of active water flooding in nano and micro-nanopores were 30–50% higher than that of conventional water flooding. Moreover, the lower the core permeability was, the better the displacement efficiency of active water in nano and micro-nanopores was. The reason for this phenomenon is that surfactant can decrease the interfacial tension and deform the oil droplets in the pores, and then reduce the resistance of oil droplets through the channel. Moreover, in tight porous media, the surface of small pores was mostly oil wet. Surfactant changed the wettability of the inner surface of pores, effectively reduced the flow resistance, and increased the dispersion of crude oil in water, thus more crude oil can be recovered.
Under the pressure difference of injection and production of 3 MPa, the flow rate of CO2 was faster than that of N2, and the gas channeling was formed earlier. Therefore, CO2 has lower recovery efficiency for nano and micro-nanopores. High flow rate was not conducive to the recovery of nano and micro-nanopores of crude oil. CO2 flooding mainly depended on extraction in small pores, which led to precipitation of heavy components and increased flow resistance, and then decreased oil recovery in nano and micro-nanopores. Compared two kinds of gas flooding, the effect of CO2 flooding was better than that of N2 flooding. The reason is that the N2 is almost insoluble in crude oil. With the increase of pressure, the solubility of CO2 in crude oil was increased, thus the viscosity of crude oil and the interfacial tension of oil and gas were reduced.

4.4. Study on Residual Oil Distribution

The residual oil saturation refers to the percentage of residual crude oil in pore volume. After flooding, NMR data of cores were measured. The residual oil saturation can be calculated according to Equation (4) [44]:
S or = T 2 , min T 2 , max A i , a T 2 , min T 2 , max A i , b T 2 , min T 2 , max A i , w T 2 , min T 2 , max A i , b × 100 %
where Sor is the residual oil saturation of the core (%).
The residual oil saturation of tight cores under different injection media are shown in Table 4. The residual oil of cores were related to their pore structure, permeability, initial oil saturation and recovery ratio. On the whole, the remaining oil was mainly distributed in pores larger than 0.1 μm. Under the same permeability level, gas flooding and water flooding were carried out respectively, and the remaining oil saturation of cores after gas flooding was 10–25% lower. Especially on micropores, the cores residual oil after gas flooding were less than that of water flooding by 40–50%. On the contrary, the cores residual oil of after water flooding were lower than that of after gas flooding on nano and micro-nanopores. This indicates that gas flooding had taken away the crude oil from the macropores, and had not effectively displaced the oil in the pores with radius below 0.1 μm. Two kinds of water flooding can effectively displaced nano and micro-nanopores because of its slow spread speed.
Compared the two kinds of water flooding, the residual oil saturation after active water flooding was slightly lower than conventional water flooding. Especially in micro-nanopores, the residual oil after active water flooding was 45% lower than that after conventional water flooding. Compared the two kinds of gas flooding, the residual oil after CO2 flooding was 9% less than that of N2 flooding. After two kinds of gas flooding, the remaining oil distribution was close, and the residual oil in the pores below 0.1 μm was not as effective as water flooding. The whole crude oil in the core mainly existed in micro and sub-micropores, thus gas drive was more conducive to the development of tight reservoir. The experiment also showed that the CO2 flooding effect was the best under the same displacement pressure and displacement volume.
Taking core M, N, O, and P with 1.5 × 10⁻³ μm2 permeability as examples, MRI images of cores under different injection media and displacement volumes are shown in Figure 8. There is no nuclear magnetic signal in the injected medium, and the MRI image essentially shows the residual oil in the coronal section of the core. The brighter the image was, the stronger the semaphore was, and the more oil there was in the corresponding area of the core. The injection medium was injected from the left side of the core shown in the image and the crude oil was recovered from the right side. The cores were cylindrical, and the MRI image was the superimposed semaphores of the selected section. Therefore, the semaphore in the middle of the image was large, and in the upper and lower sides was small. MRI images can only be used to qualitatively analyze the residual oil in cores with different injection media and displacement volumes. As can be seen intuitively from Figure 8, the displacement effects from good to bad were as follows: CO2 flooding, N2 flooding, active water flooding, and conventional water flooding. The effects of the two kinds of gas drive were obviously better than that of water flooding. Especially when the displacement volume was 1 PV, the semaphore of MRI image of CO2 flooding was obviously lower than that of other injection media, which indicates that CO2 flooding effect was remarkable.

5. Conclusions

In this paper, the main task was to evaluate the displacement effect of different injection media in tight oil sandstone. Water, active water, CO2 and N2 flooding experiments were carried out on cores with four kinds of permeability. Online NMR spectrometer was applied to log NMR data as well as MRI images of cores with different displacement volumes. The pore structure and oil saturation of tight oil cores were compared. The oil recovery ratio and residual oil saturation under different injection media and displacement volumes were analyzed.
Some conclusions can be summarized as follows. The lower the core permeability, the more the proportion of nanopores. In the wake of the increased permeability, the proportion of sub-micro and micropores was increasing gradually. Sub-micro and micropores contained more than 80% of the crude oil.
Micro and sub-micropores provided 62–97% of the produced crude oil. The enhanced oil recovery ratio of active water flooding was higher than that of conventional water flooding up to 10%. The displacement effect of active water in nano and micro-nanopores was 42% more than that of water flooding. The recovery ratio of gas flooding in micro and sub-micropores was 60–70% higher than that of water flooding. However, it was 1.5 times lower in nano and micro-nanopores. The recovery ratio of CO2 flooding was 10% higher than that of N2 flooding.
The remaining oil was mainly distributed in pores larger than 0.1 μm. Under the same permeability level, the remaining oil saturation of cores after gas flooding was 10–25% lower than water flooding. From MRI images, the displacement effects from good to bad were as follows: CO2 flooding, N2 flooding, active water flooding, and conventional water flooding.

Author Contributions

Conceptualization, T.C. and Z.Y.; Data curation, T.C., Y.L., W.L., J.X. and J.N.; Investigation, T.C., Z.Y., Y.L. and Y.D.; Validation, T.C., W.L., J.X., Y.D. and J.N.; Writing—original draft, T.C.; Writing—review & editing, T.C.

Funding

This research was funded by [Major National Science and Technology Special Project; Major Scientific and Technological Tackling Key Issues of CNPC] grant number [2017ZX05013–001; 2018B–4907] And the APC was funded by [Major National Science and Technology Special Project].

Acknowledgments

We would like to express appreciation for the following financial support: Major National Science and Technology Special Project: Physical Simulation Method and Percolation Mechanism of Ultra-low Permeability Reservoir (2017ZX05013–001); Major Scientific and Technological Tackling Key Issues of CNPC (2018B–4907): Study on Physical Simulation Method and Mining Mechanism of Tight Oil Reservoirs.

Conflicts of Interest

The authors declare no conflict of interest.

References

  1. Zou, C.; Yang, Z.; Hou, L.; Zhu, R.; Cui, J.; Wu, S.; Lin, S.; Guo, Q.; Wang, S.; Li, D. Geological characteristics and “sweet area” evaluation for tight oil. Pet. Sci. 2015, 12, 606–617. [Google Scholar] [CrossRef]
  2. Wang, L.; Tian, Y.; Yu, X.; Wang, C.; Yao, B.; Wang, S.; Winterfeld, P.; Wang, X.; Yang, Z.; Wang, Y. Advances in improved/enhanced oil recovery technologies for tight and shale reservoirs. Fuel 2017, 210, 425–445. [Google Scholar] [CrossRef]
  3. Velasco, R.; Panja, P.; Pathak, M. Analysis of North-American Tight Oil Production. AIChE J. 2018, 64, 1479–1484. [Google Scholar] [CrossRef]
  4. Zhang, J.; Bi, H.; Xiu, H.; Zhao, J.; Yu, T.; Zhao, D.; Geng, Y. New progress and reference significance of overseas tight oil exploration and development. Acta Petrol. Sin. 2015, 36, 127–137. [Google Scholar] [CrossRef]
  5. Jia, C.; Zou, C.; Li, J.; Li, D.; Zheng, M. Assessment criteria, Mian types, basic features and resource prospects of the tight oil in China. Acta Petrol. Sin. 2012, 33, 343–350. [Google Scholar] [CrossRef]
  6. Hu, S.; Zhu, R.; Wu, S.; Bai, B.; Yang, Z.; Cui, J. Exploration and development of continental tight oil in China. Pet. Explor. Dev. 2018, 45, 790–802. [Google Scholar] [CrossRef]
  7. Wang, M.; Zhang, S.; Zhang, F.; Liu, Y.; Guan, H.; Li, J.; Shao, L.; Yang, S.; She, Y. Quantitative research on tight oil microscopic state of Chang 7 Member of Triassic Yanchang Formation in Ordos Basin, NW China. Pet. Explor. Dev. 2015, 42, 790–802. [Google Scholar] [CrossRef]
  8. Zou, C.; Tao, S.; Yang, Z.; Hou, L.; Yuan, X.; Zhu, R.; Jia, J.; Wu, S.; Gong, Y.; Gao, X.; et al. Development of Petroleum Geology in China: Discussion on Continuous Petroleum Accumulation. J. Earth Sci. 2013, 24, 796–803. [Google Scholar] [CrossRef]
  9. Yang, H.; Liang, X.; Niu, X.; Feng, S.; You, Y. Geological conditions for continental tight oil formation and the main controlling factors for the enrichment: A case of Chang 7 Member, Triassic Yanchang Formation, Ordos Basin, NW China. Pet. Explor. Dev. 2017, 44, 12–20. [Google Scholar] [CrossRef]
  10. Tabatabaei, M.; Mack, D.; Daniels, R. Evaluating the performance of hydraulically fractured horizontal wells in the Bakken shale play. In Proceedings of the SPE Rocky Mountain Petroleum Technology Conference, Denver, CO, USA, 14–16 April 2009. [Google Scholar] [CrossRef]
  11. Guo, C.; Xu, J.; Wei, M.; Jiang, R. Experimental study and numerical simulation of hydraulic fracturing tight sandstone reservoirs. Fuel 2015, 159, 334–344. [Google Scholar] [CrossRef]
  12. Chitrala, Y.; Moreno, C.; Sondergeld, C.; Rai, C. An experimental investigation into hydraulic fracture propagation under different applied stresses in tight sands using acoustic emissions. J. Pet. Sci. Eng. 2013, 108, 151–161. [Google Scholar] [CrossRef]
  13. Wang, L.; Zhao, N.; Sima, L.; Meng, F.; Guo, Y. Pore Structure Characterization of the Tight Reservoir: Systematic Integration of Mercury Injection and Nuclear Magnetic Resonance. Energy Fuels 2018, 32, 7471–7484. [Google Scholar] [CrossRef]
  14. Diwu, P.; Liu, T.; You, Z.; Jiang, B.; Zhou, J. Effect of low velocity non-Darcy flow on pressure response in shale and tight oil reservoirs. Fuel 2018, 216, 398–406. [Google Scholar] [CrossRef]
  15. Jian, C. A fractal approach to low velocity non-Darcy flow in a low permeability porous medium. Chin. Phys. B 2014, 23. [Google Scholar] [CrossRef]
  16. Du, J.; Liu, H.; Ma, D.; Fu, J.; Wang, Y.; Zhou, T. Discussion on effective development techniques for continental tight oil in China. Pet. Explor. Dev. 2014, 41, 198–205. [Google Scholar] [CrossRef]
  17. Ghaderi, M.; Clarkson, C.; Ghanizadeh, A.; Barry, K.; Fiorentino, R. Improved Oil Recovery in Tight Oil Formations: Results of Water Injection Operations and Gas Injection Sensitivities in the Bakken Formation of Southeast Saskatchewan. In Proceedings of the SPE Unconventional Resources Conference, Calgary, AB, Canada, 15–16 February 2017. [Google Scholar] [CrossRef]
  18. Zhang, K.; Seetahal, S.; Hu, Y.; Zhao, C.; Hu, Y.; Wu, K.; Chen, Z.; Alexznder, D. A Way to Improve Water Alternating Gas Performance in Tight Oil Reservoirs. In Proceedings of the SPE Trinidad and Tobago Section Energy Resources Conference, Trinidad and Tobago, Spain, 13–15 June 2016. [Google Scholar] [CrossRef]
  19. Joslin, K.; Ghedan, S.; Abraham, A.; Pathak, V. EOR in Tight Reservoirs, Technical and Economical Feasibility. In Proceedings of the SPE Unconventional Resources Conference, Calgary, AB, Canada, 15–16 February 2017. [Google Scholar] [CrossRef]
  20. Gong, Y.; Gu, Y. Experimental Study of Water and CO2 Flooding in the Tight Main Pay Zone and Vuggy Residual Oil Zone of a Carbonate Reservoir. Energy Fuels 2015, 29, 6213–6223. [Google Scholar] [CrossRef]
  21. Li, Z.; Qu, X.; Liu, W.; Lei, Q.; Sun, H.; He, Y. Development modes of Triassic Yanchang Formation Chang 7 Member tight oil in Ordos Basin, NW China. Pet. Explor. Dev. 2015, 42, 241–246. [Google Scholar] [CrossRef]
  22. Xie, J.; Zhu, Z.; Hu, R.; Liu, J. A calculation method of optimal water injection pressures in natural fractured reservoirs. J. Pet. Sci. Eng. 2015, 133, 705–712. [Google Scholar] [CrossRef]
  23. Liang, T.; Li, Q.; Liang, X.; Yao, E.; Wang, Y.; Li, Y.; Chen, M.; Zhou, F.; Lu, J. Evaluation of liquid nanofluid as fracturing fluid additive on enhanced oil recovery from low-permeability reservoirs. J. Pet. Sci. Eng. 2018, 168, 390–399. [Google Scholar] [CrossRef]
  24. Karnal, M.; Adebayo, A.; Fogang, L.; Barri, A. Improving Gas Sequestration by Surfactant-Alternating-Gas Injection: A Comparative Evaluation of the Surfactant Type and Concentration. J. Surfactants Deterg. 2018, 21, 667–675. [Google Scholar] [CrossRef]
  25. Liu, M.; Cao, X.; Zhu, Y.; Tong, Y.; Zhang, L.; Zhang, L.; Zhao, S. Effect of Oleic Acid on the Dynamic Interfacial Tensions of Surfactant Solutions. Energy Fuels 2018, 32, 5868–5876. [Google Scholar] [CrossRef]
  26. Chen, G.; Song, Y.; Tang, D.; Zhao, J. Evaluation and Application of a New Surfactant Oil-Displacing Agent in Low Permeability Oilfield. Oilfield Chem. 2014, 31, 410–418. [Google Scholar] [CrossRef]
  27. Olatunji, K.; Zhang, J.; Wang, D. Effect of the rock dimension on surfactant imbibition rate in the Middle Member of Bakken: Creating a model for frac design. J. Pet. Sci. Eng. 2018, 169, 416–420. [Google Scholar] [CrossRef]
  28. Li, B.; Zheng, C.; Xu, J.; Lv, Q.; Shi, D.; Li, Z. Experimental study on dynamic filtration behavior of liquid CO2 in tight sandstone. Fuel 2018, 226, 10–17. [Google Scholar] [CrossRef]
  29. Xiao, P.; Yang, Z.; Wang, X.; Xiao, H.; Wang, X. Experimental investigation on CO2 injection in the Daqing extra/ultra-low permeability reservoir. J. Pet. Sci. Eng. 2017, 149, 765–771. [Google Scholar] [CrossRef]
  30. Tian, X.; Cheng, L.; Cao, R.; Zhang, M.; Guo, Q.; Wang, Y.; Zhang, J.; Cui, Y. Potential evaluation of CO2 storage and enhanced oil recovery of tight oil reservoir in the Ordos Basin, China. J. Environ. Biol. 2015, 36, 789–797. [Google Scholar] [PubMed]
  31. Pranesh, V. Subsurface CO2 storage estimation in Bakken tight oil and Eagle Ford shale gas condensate reservoirs by retention mechanism. Fuel 2018, 215, 580–591. [Google Scholar] [CrossRef]
  32. Ren, B.; Zhang, L.; Huang, H.; Ren, S.; Ren, S.; Chen, G.; Zhang, H. Performance evaluation and mechanisms study of near-miscible CO2 flooding in a tight oil reservoir of Jilin Oilfield China. J. Nat. Gas Sci. Eng. 2015, 27, 1796–1805. [Google Scholar] [CrossRef]
  33. Yu, W.; Lashgari, H.; Wu, K.; Sepehrnoori, K. CO2 injection for enhanced oil recovery in Bakken tight oil reservoirs. Fuel 2015, 159, 354–363. [Google Scholar] [CrossRef]
  34. Shi, J.; Durucan, S.; Fujioka, M. A reservoir simulation study of CO2 injection and N-2 flooding at the Ishikari coalfield CO2 storage pilot project, Japan. Int. J. Greenhouse Gas Control 2008, 2, 47–57. [Google Scholar] [CrossRef]
  35. Liu, P.; Zhang, X.; Wu, Y.; Li, X. Enhanced oil recovery by air-foam flooding system in tight oil reservoirs: Study on the profile-controlling mechanisms. J. Pet. Sci. Eng. 2017, 150, 208–216. [Google Scholar] [CrossRef]
  36. Zhao, Y.; Hong, L.; Jiang, S.; Yue, X.; Wei, H. Characteristics of nitrogen displacement in ultra-low permeability Reservoir after water flooding. Oilfield Chem. 2013, 30, 376–379. [Google Scholar] [CrossRef]
  37. Appel, M.; Stallmach, F.; Thomann, H. Irreducible fluid saturation determined by pulsed field gradient NMR. J. Pet. Sci. Eng. 1998, 19, 45–54. [Google Scholar] [CrossRef]
  38. Wang, W.; Guo, H.; Ye, Z. The evaluation of development potential in low permeability oilfield by the aid of NMR movable fluid detecting technology. Acta Petrol. Sin. 2011, 22, 40–44. [Google Scholar] [CrossRef]
  39. Liu, Z.; Zhou, C.; Zhang, L.; Dai, D.; Li, C.; Zhang, L.; Liu, G.; Shi, Y. An Innovative Method to Evaluate Formation Pore Structure Using NMR Logging Data. In Proceedings of the SPWLA 48th Annual Logging Symposium, Austen, TX, USA, 3–6 June 2007. [Google Scholar]
  40. Liu, W.; Xiao, Z.; Yang, S.; Wang, Y. Comparative studies on methods of evaluation of reservoir pore structure by using NMR (nuclear magnetic resonance) well logging data. Oil Geophys. Prospect. 2009, 44, 773–778. [Google Scholar] [CrossRef]
  41. Hürlimann, M.; Venkataramanan, L. Quantitative measurement of two-dimensional distribution functions of diffusion and relaxation in grossly inhomogeneous fields. J. Magn. Reson. 2002, 157, 31–42. [Google Scholar] [CrossRef] [PubMed]
  42. Wu, F.; Fan, Y.; Li, J.; Deng, S.; Xing, D.; Wu, Z.; Yang, P. A Development Overview of D-T2 Two-dimensional NMR Technology. Cejing Jishu 2015, 39, 261–271. [Google Scholar] [CrossRef]
  43. Yang, P.; Guo, H.; Yang, D. Determination of Residual Oil Distribution during Waterflooding in Tight Oil Formations with NMR Relaxometry Measurements. Energy Fuels 2013, 27, 5750–5756. [Google Scholar] [CrossRef]
  44. Chen, T.; Yang, Z.; Ding, Y.; Luo, Y.; Qi, D.; Lin, W.; Zhao, X. Waterflooding Huff-n-puff in Tight Oil Cores Using Online Nuclear Magnetic Resonance. Energies 2018, 11, 1524. [Google Scholar] [CrossRef]
  45. Di, Q.; Zhang, J.; Hua, S.; Chen, H.; Gu, C. Visualization experiments on polymer-weak gel profile control and displacement by NMR technique. Pet. Explor. Dev. 2017, 44, 294–298. [Google Scholar] [CrossRef]
  46. Xue, D.; Zhou, H.; Liu, Y.; Deng, L.; Zhang, L. Study of Drainage and Percolation of Nitrogen–Water Flooding in Tight Coal by NMR Imaging. Rock Mech. Rock Eng. 2018. [Google Scholar] [CrossRef]
  47. Kleinberg, R.L.; Boyd, A. Tapered Cutoffs for Magnetic Resonance Bound Water Volume. In Proceedings of the SPE Annual Technical Conference and Exhibition, San Antonio, TX, USA, 5–8 October 1997. [Google Scholar]
  48. Lyu, C.; Wang, Q.; Ning, Z.; Chen, M.; Li, M.; Chen, Z.; Xia, Y. Investigation on the Application of NMR to Spontaneous Imbibition Recovery of Tight Sandstones: An Experimental Study. Energies 2018, 11, 2359. [Google Scholar] [CrossRef]
  49. Li, S.; Tang, J.; Ding, Y.; Liu, S.; Liu, G.; Cai, B. Recovery of Low Permeability Reservoirs Considering Well Shut-Ins and Surfactant Additivities. Energies 2017, 10, 1279. [Google Scholar] [CrossRef]
  50. Ren, X.; Li, A.; Wang, G.; He, B.; Fu, S. Study of imbibition behavior of hydrophilic tight sandstone reservoirs based on nuclear magnetic resonance. Energy Fuels 2018, 32, 7762–7772. [Google Scholar] [CrossRef]
  51. Xiao, P.; Leng, X.; Xiao, H.; Sun, L.; Zhang, H.; Mei, S.; Zhang, H. Investigation effect of wettability and heterogeneity in water flooding and on microscopic residual oil distribution in tight sandstone cores with NMR technique. Open Phys. 2017, 15, 544–550. [Google Scholar] [CrossRef] [Green Version]
  52. Zhao, Y.; Song, Y. Experimental investigation on spontaneous counter-current imbibition in water-wet natural reservoir sandstone core using MRI. Magn. Reson. Chem. 2017, 55, 546–552. [Google Scholar] [CrossRef] [PubMed]
  53. Zhao, F. Oilfield Chemistry, 2nd ed.; China University of Petroleum Press: Dongying, China, 2010; pp. 95–129. ISBN 978-7-5636-3214-5. [Google Scholar]
  54. Wang, X.; Yang, Z. Experimental study on pore structure of low permeability core with NMR spectra. J. Southwest Pet. Univ. (Sci. Tech. Ed.) 2010, 32, 69–72. [Google Scholar] [CrossRef]
  55. Meng, M.; Qiu, Z. Experiment study of mechanical properties and microstructures of bituminous coals influenced by supercritical carbon dioxide. Fuel 2018, 219, 223–238. [Google Scholar] [CrossRef]
  56. Yang, Z.; Huang, H.; Luo, Y.; Lei, Q.; Li, H. New measurement method of mixed wettability in tight oil reservoir and its application. Acta Petrol. Sin. 2017, 38, 318–323. [Google Scholar] [CrossRef]
  57. Zhou, T.; Liu, X.; Yang, Z.; Li, X.; Wang, S. Experimental analysis on reservoir blockage mechanism for CO2 flooding. Pet. Explor. Dev. 2015, 42, 548–553. [Google Scholar] [CrossRef]
Figure 1. Nuclear magnetic resonance (NMR) T2 relaxation time curves of a tight oil sandstone core.
Energies 11 02836 g001
Figure 2. Flow chart of the experimental equipment.
Energies 11 02836 g002
Figure 3. NMR T2 relaxation time curves and MRI images of cores without cracks and with internal cracks. (a) NMR T2 relaxation time curve of a core without cracks, (b) MRI image of a core without cracks, (c) NMR T2 relaxation time curve of a core with cracks, (d) MRI image of a core with cracks
Energies 11 02836 g003
Figure 4. Volume proportions of different pores of tight oil sandstone cores.
Energies 11 02836 g004
Figure 5. Oil recovery ratio of four cores under different injection media.
Energies 11 02836 g005
Figure 6. Oil recovery ratio of four cores and their different pores under different injection media.
Energies 11 02836 g006
Figure 7. Oil recovery ratio of tight cores under different injection media.
Energies 11 02836 g007
Figure 8. MRI images of the cores under different injection media.
Energies 11 02836 g008
Table 1. Characteristics of the experimental cores.
No.Length (cm)Diameter (cm)Permeability (×10−3 μm2)Porosity (%)Injection Medium
A5.252.490.2299.27Water
B5.162.480.19610.25Active water
C5.192.500.2379.63CO2
D5.222.490.2069.88N2
E5.372.490.53713.52Water
F5.472.500.59312.57Active water
G5.382.500.51613.68CO2
H5.402.440.52114.71N2
I5.202.480.93315.99Water
G5.412.500.92815.36Active water
K5.152.490.94916.24CO2
L5.492.501.05715.38N2
M5.572.481.59216.92Water
N5.322.501.52116.83Active water
O5.452.491.53617.53CO2
P5.392.491.51916.32N2
Table 2. Interfacial tension of different systems.
SystemInterfacial Tension (mN/m)
25 °C67 °C
Deuterium water + salt + crude oil23.3915.71
TRS10 + deuterium water + salt + crude oil0.1260.076
Table 3. Oil saturations of the cores saturated with the crude oil.
No.Permeability (×10−3 μm2)Soi in Different Pores Share of Total (%)Total Soi (%)
NanoMicro-NanoSub-MicroMicro
A0.2298.25.522.516.252.4
B0.1968.85.422.817.254.2
C0.23710.23.324.114.752.3
D0.2069.76.523.811.751.7
E0.5377.65.226.616.255.6
F0.5936.16.624.717.554.9
G0.5163.33.930.318.455.9
H0.5213.47.734.98.554.5
I0.9333.26.727.419.857.1
J0.9284.76.432.815.959.8
K0.9493.25.731.616.857.3
L1.0572.54.742.212.161.5
M1.5920.32.133.130.666.1
N1.5210.51.134.731.167.4
O1.5360.92.433.927.664.8
P1.5191.22.532.229.265.1
Table 4. Residual oil saturation of tight cores under different injection media.
No.Permeability (×10−3 μm2)Injection MediumSor in Different Pores Share of Total (%)Total Sor (%)
NanoMicro-NanoSub-MicroMicro
A0.229Water5.63.616.012.637.8
B0.196Active water5.42.215.713.837.1
C0.237CO29.42.513.17.532.5
D0.206N29.04.913.45.933.2
E0.537Water5.23.518.611.939.2
F0.593Active water3.63.217.112.936.8
G0.516CO22.72.917.59.132.2
H0.521N22.66.521.33.333.7
I0.933Water1.94.619.214.139.8
J0.928Active water3.12.522.311.639.5
K0.949CO22.93.917.36.830.9
L1.057N22.13.324.95.936.2
M1.592Water0.21.421.221.043.8
N1.521Active water0.40.220.920.441.9
O1.536CO20.91.519.110.932.4
P1.519N21.21.518.314.935.9

