Article

Determination of Long Horizontal Borehole Height in Roofs and Its Application to Gas Drainage

1
Shandong University of Science and Technology, Mine Disaster Prevention and Control-Ministry of State Key Laboratory Breeding Base, Qingdao 266590, China
2
Shandong University of Science and Technology, College of Mining and Safety Engineering, Qingdao 266590, China
3
College of Mechanical and Electronic Engineering, China University of Petroleum, Qingdao 266580, China
*
Author to whom correspondence should be addressed.
Energies 2018, 11(10), 2647; https://doi.org/10.3390/en11102647
Submission received: 24 August 2018 / Revised: 27 September 2018 / Accepted: 1 October 2018 / Published: 3 October 2018

Abstract

:
Accurately determining the height of the gas-guiding fracture zone in the overlying strata of the goaf is the key to find the height of the long horizontal borehole in the roof. In order to determine the height, in this study we chose the 6306 working face of Tangkou Coal Mine in China as a research example and used both the theoretical model and discrete element method (DEM) numerical simulation to find the height of the gas-guiding fracture zone and applied the height to drill a long horizontal borehole in the roof of the 6303 working face. Furthermore, the borehole was utilized to deep into the roof for coalbed methane drainage and the results were compared with conventional gas drainage measures from other aspects. The height of the gas-guiding fracture zone was found to be 48.57 m in theoretical model based on the bulk coefficient and the void ratio and to be 51.19 m in the DEM numerical simulation according to the temporal and spatial variation characteristics of porosity. Taking both the results of theoretical analysis and numerical simulation into consideration, we determined that gas-guiding fracture zone is 49.88 m high and applied it to drill a long horizontal borehole deep into the roof in the 6303 working face field. Compared with conventional gas drainage measures, we found that the long horizontal borehole has the high stability, high efficiency and strong adaptability for methane drainage.

1. Introduction

Coalbed methane (CBM) refers to methane released from the coalbed during and after its mining. With the increase of coal mining depth and coal production in China, CBM-induced accidents occur more frequently and seriously, posing a huge threat to coal mine safety production. According to statistics from relevant Chinese authorities, about 10% of coal mine accidents from 2005 to 2015 were induced by CBM [1], as shown in Figure 1. Compared with other kinds of accidents, CBM-induced disasters inflicted great loss on Chinese coal mines, and the difficulty for effectively preventing and controlling them becomes ever greater [2].
CBM drainage is the most basic measure to prevent and control gas accidents. Researchers have deeply studied the measure from their different research angles. Karacan mainly reviewed Australian coal mine gas drainage measures from his geological point of view [3]. Palmer examined and analyzed the CBM resources of coal mining in the United States from the perspective of coalbed permeability [4].
Su et al. analyzed the gas drainage measures applied to the coal mines of Queensland and solved energy and economic problems [5]. Wang et al. employed their directional borehole gas drainage measures to Daning Coal Mine and Baijigou Coal Mine in China considering the drilling drainage efficiency [6]. However, due to the complexity of CBM generation conditions as the high pressure, strong adsorption, low permeability, etc., gas drainage from the original coal seam is very difficult [7]. Therefore, many scholars provide a good theoretical basis for how to improve gas emission by establishing mathematical models for nonlinear flow and control coal mine gas drainage by establishing nonlinear seepage mathematical models, using nuclear magnetic physics experiments, diffusion coefficients to control gas diffusion, etc. [8,9,10]. The theoretical basis for how to increase the amount of gas extraction is provided.
Currently, the most effective measure for gas extraction is the use of mining-induced fracture zone to drain and control the gas from the working face and mined-out area. The principle is that because the working face is affected by mining, adsorbed methane is released from the coal walls of the face and the mined-out area and gradually migrates to the fracture zone to form a methane enrichment zone. Different researchers have performed researches and analyses to verify the rationality of the fracture zone as the methane enrichment zone. Wang et al. combined numerical simulations with similar simulation experiments to analyze the formation of fracture zone based on the characteristics of spatiotemporal distribution of pores and fractures [11]. Chu et al. used the theory of porous media fluid mechanics to study methane migration and found that the gas eventually flows into the fracture zone and accumulates in pores and cracks in the zone [12]. Szlązak et al. proposed and used a CBM drainage gallery drilled into the coalbed situated above or below the worked seam prior to its longwall excavation [13].
Both the high level roof boreholes and high level roof roadways are two most commonly used methods for coalbed gas drainage and gas limit control by the mining-induced fracture zone [14]. Among them, the former has the advantages of strong pertinence, small construction and simple operation [15]. However, with the advance of the coal mining face and the caving-in of the roof, the high level roof boreholes could be cut, blocked or leaked, and have shortcomings of a short extraction time and low utilization rate. Sun et al. found that the latter has the advantages of large drainage capacity and high concentration [16], however, the roadway construction and working face coal mining operations cannot be carried out at the same time, making it difficult to increase the coal mining capacity and decrease the coal mining cycle.
A new method for improving gas drainage is represented by using a long horizontal borehole in the roof, and the model diagram is shown in Figure 2. This method not only has a series of advantages including the large drainage volume, short construction period, and low mining cost [1,17], but also overcomes the shortcomings of commonly used gas drainage measures. Both the roadway excavation and drilling work amounts are greatly decreased, and to a certain extent, the need to re-drill boreholes is eased with the working face advancing. In the case of weak structural coalbeds and strata, necessary branch boreholes can also be drilled for further gas drainage and have been widely used in US and Australian coal mines [18,19]. However, the key to drill a long horizontal borehole in the roof is the first fixing of the height of the fracture zone, or gas-guiding crack zone induced by mining.
At present, the height of the gas-guiding fracture zone are mostly determined by researchers based on their empirical formula obtained from their statistical analyses of worked coal mines, and their obtained results also have greater differences from mined practices on the fields. At the same time, few studies on the height of the gas-guiding fracture zone subject to mining are reported [11].
In this work we chose the 6306 working face of Tangkou Coal Mine in China as the example for CBM drainage by using a long horizontal borehole drilled according to the fixed height of the gas-guiding fracture zone. The mathematical model of the height of the fallen belt determined by the coefficient of expansion and the void ratio is obtained by theoretical derivation. The height of the mining-induced fracture zone is determined by the empirical formula. The spatiotemporal distribution characteristics of pores and cracks are obtained through the numerical simulation. The above in combination with the quantitative description of the gas-guiding fracture zone are used to study the caving-in features of overlying strata and find the height of the fracture zone. The efficiency of CBM drainage obtained by using the long horizontal borehole in the roof was compared with that obtained by the commonly used gas drainage measures in many aspects. The results showed that the former was superior to the latter. Thus, this method is of significance for the coal mine to use an accurate long horizontal borehole drilled into the roof to improve the methane drainage efficiency, reduce gas accidents, and ensure safety production.

2. Geological and Mining Conditions of Tangkou Coal Mine

Tangkou Coal Mine is located 10 km west of Jining City (Shandong Province, China), as shown in Figure 3. The elevation of the 6306 working face is −943.1–−905.1 m, the length of the design strike of its coal seam is 817 m with an average length of 120 m. The thickness of its coal seam is 8.1–10.4 m with the average thickness of 9.44 m, the dip angle is in the range of 0–7° with the average dip angle of 2°, which is regarded as the flat seam whose full seam height can be mined at one time.
The geological conditions related to the 6306 working face of the coal seam are shown in Figure 4. Its immediate roof is brownish gray and grayish black mudstone with a thickness of 2.46–7.56 m and an average thickness of 4.87 m. The basic roof is grayish white medium sandstone with a thickness of 3.58–6.54 m and an average thickness of 4.73 m. No collapse column development was observed in the overall plane. According to relevant information, coalbed 3 coal dust is explosive.
According to relevant information [20], the Tangkou Coal Mine belongs to the gas mine type, and the volume of gas emission from the 6306 working face is 3.05 m3/t. According to Article 145 of the 2011 edition of the Coal Mine Safety Regulations promulgated by the State Administration of Coal Mine Safety and the provisions of Article 4.1.1 of the Mine Gas Drainage Specifications (AQ1027-2006), if the absolute gas gushing quantity of a coal mining face is greater than 5 m3/min or the absolute gas gushing quantity of a heading face is greater than 3 m3/min, the ventilation method used is difficult to lower the quantities, gas drainage measures should be adopted.
Since the absolute gas gushing quantity from the 6306 working face is calculated to be 7.03 m3/min, the traditional gas drainage measures cannot ensure the safe mining of the coal seam, therefore, the 6306 working face must take gas drainage measures to control gas emission within limits by using the long horizontal borehole through roof.

3. Analysis of Gas-Guiding Fracture Zone Height

3.1. Theoretical Analysis of Gas-Guiding Fracture Zone Height

Affected by coal seam excavation, the direct roof and the basic roof of the coal seam are compressed and collapsed to form a collapse zone [21]. On the vertical top of the direct roof, pores and cracks in the strata randomly expand and coalesce with one another to form a dynamically changing fracture zone. Gas adsorbed on the coal seam gradually desorbs and flows through penetrative crannies to the working face and the goaf [22]. Because the mining-induced fissure zone provides access and space for the pressure relief gas flow and reservoir in the coal seam or adjacent coal seams, the caving-in zone and the mining-induced fissure zone are collectively referred to as the gas-guiding fracture zone [11]. Due to the presence of the zone, gas migrates to the breaking development zone and flows to the detachment development zone located in the mining-induced fracture zone.
Because the accumulated concentration of gas continuously heightens in the gas-guiding fracture zone, it is necessary using the long horizontal borehole in the roof for gas drainage and control to determine the height of the gas-guiding fracture zone consisting of both the caving zone and mining-induced fracture zone. For this, we consider the overlying strata properties combining with the coalbed parameters as the dip angle, thickness, etc., to establish a mathematical analysis model.
(1) Caving-in zone height
Palchik uses the bulk coefficient to derive the following mathematical model to control the overlying strata [22]:
H I = h d ( K p 1 ) cos α  
where HI is the height of the caving zone and depends on h, the height of mining, and Kp, the bulk coefficient (1.3 taken here). d is the actual sinking quantity of the immediate roof, and α is the coal seam inclination angle (0 taken here). The bulk coefficient Kp is defined as the volumetric increment of the fallen rock and is the ratio between the volume of fallen rock related to time t and the volume in its initial state.
Equation (1) can be rewritten as:
H Ι = ( 1 λ ) h ( K p 1 ) cos α  
where 0 < λ < 1 is the surface subsidence coefficient of the caving-in zone. When λ = 0, the rock layer ruptures and the surface does not sink, and when λ = 1, the top plate gradually sinks and contacts the bottom plate.
Xia et al. utilized the Menger sponge model to find the void volume fractal dimension D of the fallen rock mass in the gas-guiding fracture zone [23]:
D = ln ( N i / N i + 1 ) ln ( r i / r i + 1 )  
where ri and ri+1 are the i-th and i + 1-th measures of the feature size in the collapse rock mass; Ni and Ni+1 correspond to the numbers of collapse rocks in the goaf at the ri and ri+1 feature sizes, respectively.
Furthermore, the relationship of the porosity P to the fractal dimension D of the loose rock in the gas-guiding fracture zone is described as
P = V M / ρ V = 1 ρ r max 3 D ρ ( r max 3 D r min 3 D )  
where r m a x = b L h 3 is the propulsive distance of the working face periodic weighting, where b is the working face width, m; L is the working face advancing length, m; rmin is the radium of most smallest, abundant, and severely broken rock mass in the overburden.
Finally, the equation to calculate residual broken expansion coefficient is obtained:
K p = K p 1 + P + ε  
where P is the total fractal void fraction of the fallen rock mass; ε is the corrected parameter and is affected by the lithology of the collapse rock.
Putting Equation (5) into Equation (2), we obtain Equation (6), which means that when the working face advances to the infinity, the collapse rock mass fills the entire goaf, the height of the entire gas-guiding fracture zone becomes:
H I = ( 1 λ ) h [ ( K p ε ) ( 1 + P ) 1 ] c o s α  
Since the rock mass with the particle size of 0.125–0.5 m in the collapse rock mass of the 6306 working face of Tangkou Coal Mine accounts for the largest proportion and the hardness of the rock layer is small, we take ε = 0 in Equation (6), thus Equation (6) is simplified to:
H I = ( 1 λ ) h [ K p ( 1 + P ) 1 ] c o s α  
(2) Height of mining-induced fracture zone
According to the movement and failure features of overlying strata affected by mining, the empirical formula used to calculate the height of the mining-induced fracture zone is shown as follows:
H II = 100 h a h + b ± c  
where 2.7 < a <7 and 16 < b < 63 are two coefficients that depend on the lithology of the formation, c is the mean square deviation. According to the statistics of coal mine empirical formula [24], three constants, a, b and c, are determined as a = 4.7, b = 19, and c = 2.2, putting them into Equation (8), we have:
H II = 100 h 4.7 h + 19 ± 2.2  
Based on the actual conditions of the 6306 working face of Tangkou Coal Mine, the height of the caving-in zone is calculated to be 31.47 m, the height of the mining-induced fracture zone is 17.1 m, and the height of the gas-guiding fracture zone is finally determined to be 48.57 m.

3.2. Numerical Analysis of Gas-Guiding Fracture Zone Height

3.2.1. Particle Discrete Element Software PFC2D Principle

A two-dimensional particle flow code (PFC2D 5.0) was developed By Cundall and Strack [25] to apply the distinct element method (DEM) to solve coalrock mechanical problems. Based on Newton’s second law of motion, the DEM, is software used to simulate the structure and motion law of distinct particulate matter and to determine the overall evolution law of the particle model.
Since PFC2D has no limitation on the displacement size, it can combine particles to form an arbitrary shape, and impart its physical-mechanical behavior, and simulate rock fractures and separations [26]. In the simulation process, microscopic information such as fissure is tracked to reveal the potential mechanism of rock formation collapse. The PFC2D adopts the method of time-step iteration, the second law of Newton and the force-displacement relationship are repeatedly used between particles and between particle contacts, and the wall setting is consecutively renewed in real time to form a loop calculation. Figure 5 shows such a specific loop calculation relationship. The Newton’s second law is used to determine the force between the particle contacts, and the force-displacement relationship updates the contact force due to the relative motion of the particles.
PFC2D is used to simulate the mechanical behavior of simulated materials by establishing the constitutive model considering interparticle contact, including stiffness model, bond model, and slip model [27]. The model does not have a bond between particles by default. There are two types of particle bonding models allowable to be established: the contact-bond model and the parallel-bonded model, respectively. Figure 6 schematically shows the latter one. Because the parallel-bonded model can be applied to more realistically simulate coal rock materials under shear fracture or tension fracture, this study chose the parallel-bonded model.

3.2.2. Macroscopic and Fine Parameter Selection and Inversion

Wang et al. used DEM to simulate rock mass through compressive resistance and tensile tests, and obtained the relationship between the macroscopic and microscopic parameters of the rock mass [28].
Based on their found relationship, the microparameters can be obtained by inversion calculation according to the initial macro-parameters set initially. Table 1 shows the microscopic geological parameters of Tangkou Coal Mine 6303 Face and its overly and underlying strata calculated according to the relationship.

3.2.3. Working Face Numerical Model and Measure Arrangement

According to the geological log profile shown in Figure 4, a two-dimensional DEM numerical model of the 6306 working face of Tangkou Coal Mine was established, as shown in Figure 7. For the two-dimensional DEM numerical simulation, first, we assume that the length is 165 m and the height is 115 m with a total of 21 layers; secondly, since the average dip of the coal seam is 2°, we assume that the coal seam is near–horizontal, and its dip angle is no longer set for simulation. In order to better utilize the performance of the computer used in the simulation, the mesoscopic parameters such as Krat, Emod, Kn, Ks, Pb-Kn, and Pb-Ks in each coal bed are assigned. The designed model has a porosity of 0.08, the maximum and minimum particle sizes of 0.5 m and 0.3 m, respectively, and the particle size ratio of 1.66. We believe that the overall proportion is reasonable. In the model, the particles are only allowed to move vertically, and the bottom boundary is considered as a constraint for movement.
In the simulation, the unique “Measure” command of the code PFC2D is used to monitor the development of overburden fractures, model deformation, and model porosity change. Meanwhile, the command is also used to divide the range of the gas-guiding fracture zone, with the measure particle size of 2.5 m and the range of 23 rows × 33 columns, so with a total of 759 measurement circles.
This DEM simulation simplifies the real working face and mainly neglects the effects of joint fissures, working face support and significant anisotropy in sedimentary rock masses. The macroscopic parameters and mesoscopic parameters of the DEM model are set up in the same way as the actual situation for the purpose to simply study the development law of the overlying strata fractures in the goaf and the distribution of porosity.

3.2.4. Analysis of Fissure and Porosity Changes

The advancement of the working face causes the fracture and collapse of the overlying strata, generating a large amount of cracks in the front of the working face. These cracks extend and propagate outwards and together with a large amount of original pores, coal-series strata bedding and joints form the so-called gas-guiding fracture zone. According to their formation mechanisms, these fractures can be divided into two types: one is the original voids and fissures unaffected by the mining and formed under original geological conditions and the other is the secondary fissures induced by mining.
The porosity is an important parameter used to study the porous properties of coal rocks. Its spatial distribution changes with the face heading and the overburden strata moving. Characteristic of randomness and heterogeneity, the generation, development, propagation and coalescence of cracks provides a basis for the formation of methane migration channels. Using the PFC2D can track the dynamic change in porosity and extract its data over time as well as analyze the evolution process of fracture initiation, expansion, coalescence, and finally, penetration through rock formation. Figure 8 shows the dynamic evolution of cracks with the advance of the working face.
From Figure 8a,b, it is clear that when coal mining advances to 22 m, the immediate roof loses its supporting effect and undergoes fracture and collapse. At this time, cracks germinate and develop in the basic roof, and the porosity at the mining position becomes larger and the range expands. However, because the basic roof still has a supporting effect, the porosity at the other positions has not changed, and no cracks are formed temporarily inside the overlying strata.
In Figure 8c,d, when coal mining heads to 33 m, the basic roof loses its support and the slump height is 9.6 m. The porosity at the mining location gradually increases to 0.48, while it at the goaf gradually reduces to 0.14 due to the accumulation of gangue. At this time, obviously, cracks develop along the vertical direction until reaching the basic roof.
From Figure 9a,b, it is clear that when coal mining advances to 62 m, the overlying formation forms a coordinated movement of the overall structure, further gradually forming a stable gob structure, and fractures continue to develop. Meanwhile, the porosity at the position of 14.9 m above the mining position gradually increases to 0.21, while the porosity at the remaining positions keeps unchanged. At the mining position, cracks gradually germinate and develop, and at other positions no evident change is visible.
When coal mining advances to 81 m, due to the existence of key stratum 1, the overburden stratum under key stratum 1 has suffered a large area collapse with a cyclical caving-in, as shown in Figure 9c,d. When the fracture extends to key stratum 1, and the height of the separation layer has no a clear change, the porosity at the mining location gradually increases to 0.35, and the porosity at the goaf gradually decreases to 0.13.
From Figure 10a,b, it is clear that when coal mining advances to 91 m, the bearing load caused by the overlying strata exceeds the bearing capacity of key stratum 1, causing key stratum 1 to lose control with a large area of periodical collapse and the overlying strata to move accordingly. Meanwhile the porosity is stratified, the porosity at the lower part changes obviously, the porosity at the upper part changes little over mining. Therefore, the fracture gradually develops vertically upward to key stratum 2.
As shown in Figure 10c,d, when coal mining advances to 103 m, key stratum 2 turns to the boundary, the stratum below key stratum 2 moves accordingly at a large scale. The overlying strata experience a periodical collapse and the coal seam at the excavation location and the collapsed strata are gradually compacted, causing the porosity to gradually decrease to 0.15, and the porosity stratification area under key stratum 2 gradually increase. At this time, the fracture fully penetrates followed by the formation of a methane migration channel.
In general, the changes in porosity at the early stage of mining occur in the lower part of key stratum 1. The closer to the working face, the more obvious the change of porosity is. With the extraction continuously advancing, the range of porosity changes as the width of the advancement increases, and the height of change also increases. The dynamically varying features of porosity are consistent with the migration characters of overlying strata. Therefore, the study of the strata abscission-compacting-closing phenomenon of rock formation can be analyzed by the dynamic variation law of porosity.

3.2.5. Gas-Guiding Fracture Zone Division

Figure 11 shows the porosity data set collected at 122 m prior to the working face and the division of the fracture zone area according to the porosity distribution characteristics.
The gas-guiding fracture zone shown in Figure 11 can be divided into four zones. Zone I is dominated by vertical fractures with high fissure development and obvious porosity change, so it is the main methane reservoir area and methane migration channel and also the best zone to drill and lay on the long horizontal borehole in the roof for CBM drainage, with the slump height of 51.19 m. The porosity of Zone II is distributed evenly and stably. With the continuous advancement of the working face, the overlying strata of the coal seam is partially filled with the goaf, the uncollapsed area also gradually subsides, the height of the free space gradually decreases, and the original separation phenomenon gradually compacts and closes. Until the geological conditions of the collapse are not satisfied, the rock layer itself forms a stable structure and has very small fissures cutting through the strata. Thus, it is unlikely to accumulate a great amount of methane. The change of porosity in Zone III is similar to that in Zone II. Combined with the analysis of collapse features, it is certain that the stratification of rock formation and the changes of porosity are caused by continuous subsidence. The overall zonal structure is relatively intact with a low fissure development and a small number of fissures in this zone form a methane migration channel. Therefore, methane reservoir is less at the position below key stratum 2. The remaining zone is Zone IV, the “undisturbed zone”, and the porosity in this zone is invariable, thus in it exist only original fissures.
According to the numerical simulation of the 6306 working face in Tangkou Coal Mine, and taking the caving law of overlying strata and the spatio-temporal distribution of porosity into consideration, the height of the gas-conducting fracture zone is 51.19 m.

4. Field Application

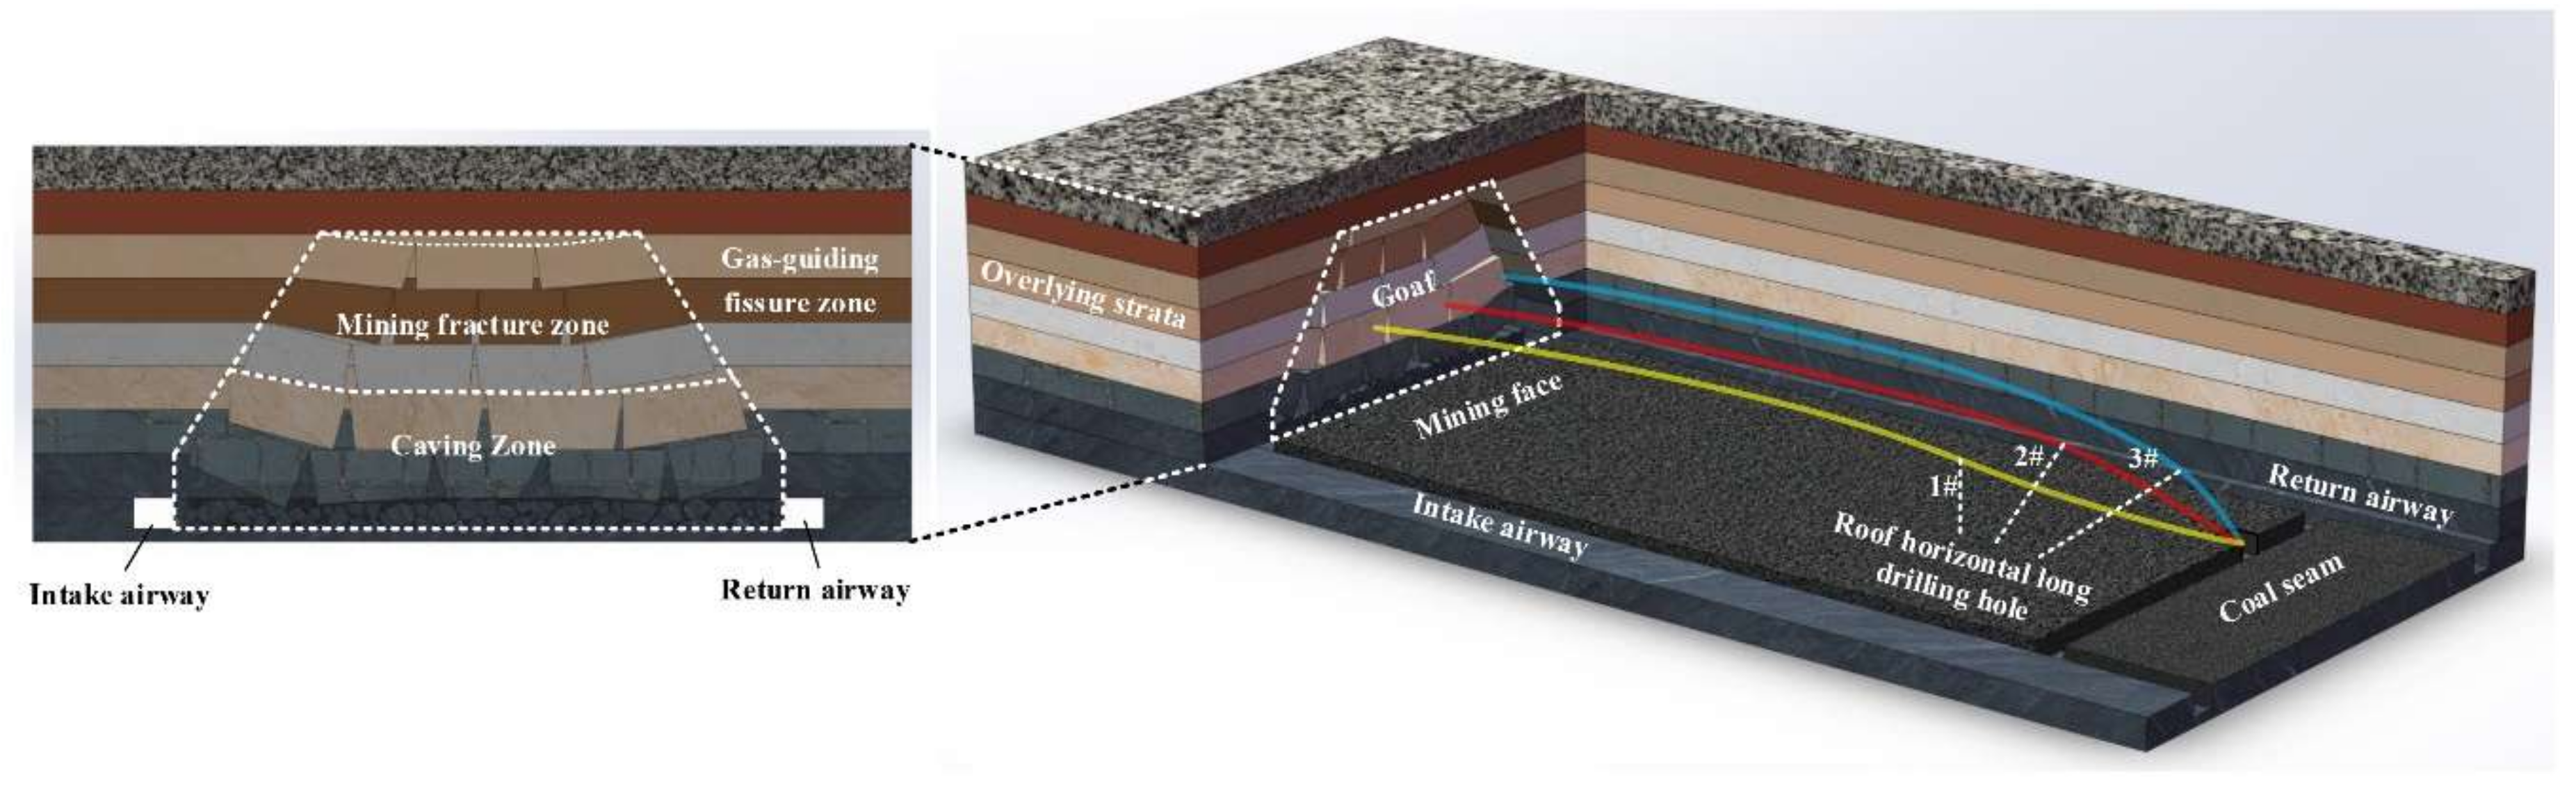
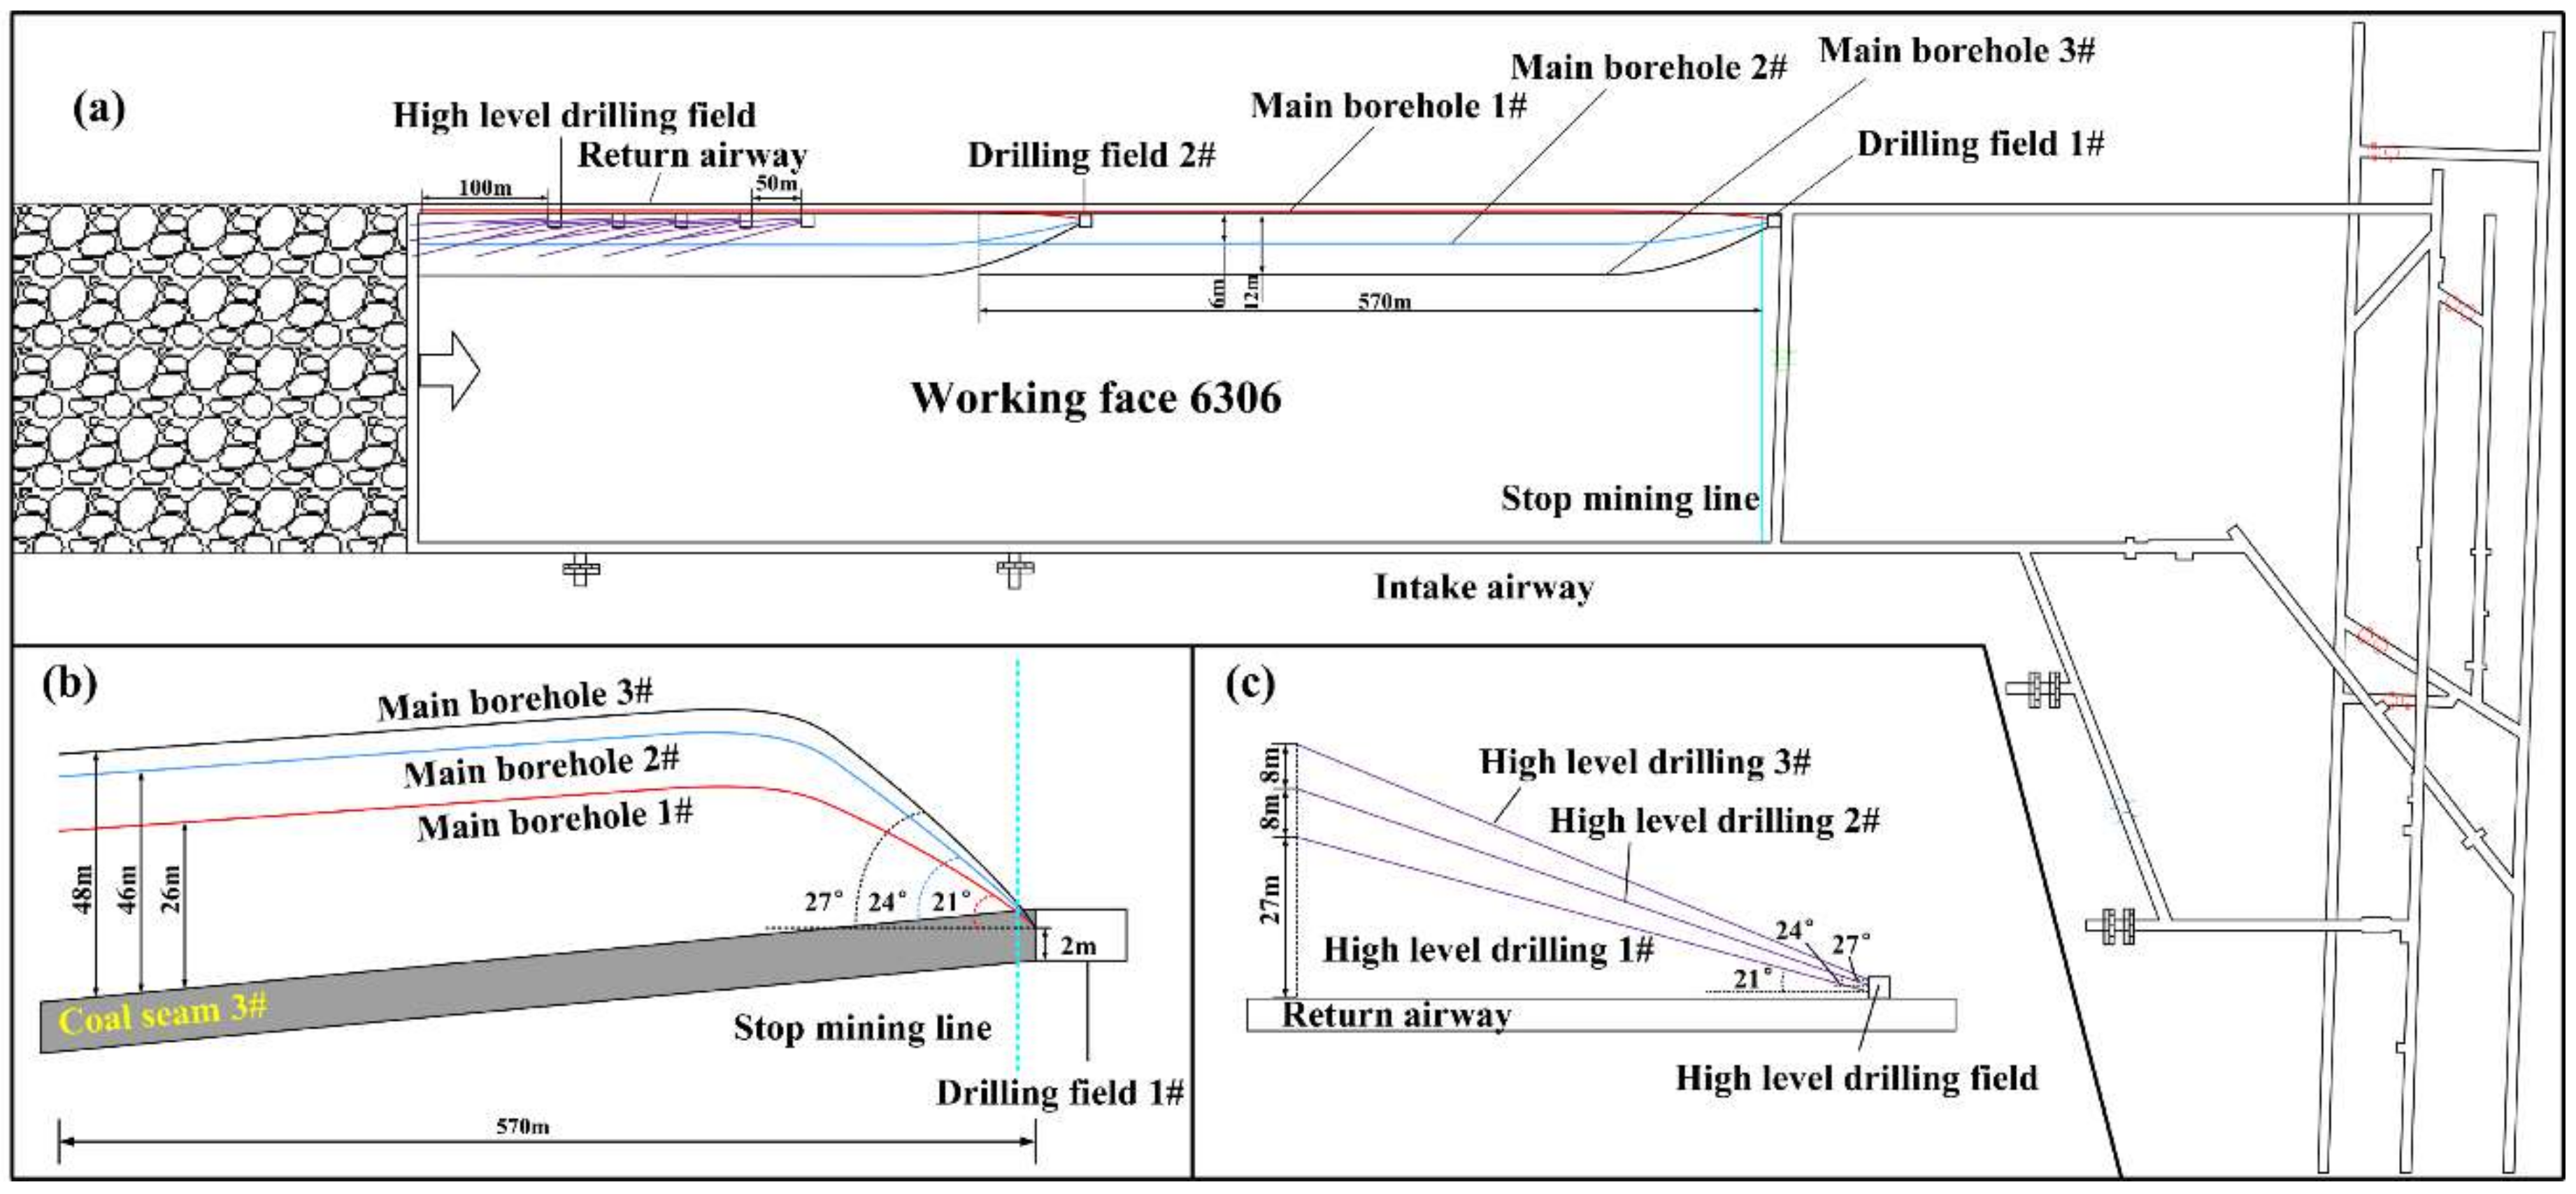
4.1. Design of Methane Drainage Measures

Figure 12 shows the layout of methane drainage by the long horizontal borehole for No. 6303 working face of Tangkou Come Mine. Finding the height of the gas-guiding fracture zone is the key to design the long horizontal borehole in the roof of the 6306 working face. Since the coal seam and its overlying strata are not weak structures, branch holes are not used for gas drainage. In order to prove the safety, high efficiency, and low cost of the long horizontal borehole in the roof, some positions are chosen to compare with those of high level boreholes in the roof, as shown in Figure 12 (a). Since the key to the two gas drainage measures is to determine the height of the gas-guiding fracture zone, through theoretical analyses, the heights of both the caving-in zone and the mining-induced fracture zone are found to be 16.3 m and 33.27 m, respectively. Hence, the height of the gas-guiding fracture zone is calculated to be 48.57 m, while the height obtained by numerical simulation is 51.19 m. Therefore, the actual height of the gas-guiding fracture zone is chosen to be their average, 49.88 m.
An ZYWL-6000D hydraulic directional drilling machine was used to drill the long horizontal borehole in the roof in the 1# drilling field close to the stoppage line, and other three directional boreholes at 21°, 24° and 27° elevation angles, respectively. According to the height of the obtained gas-guiding fracture zone, the drilled holes were level when the drilling height reached 26 m, 46 m and 48 m, respectively, the total length of three boreholes was 570 m, as shown in Figure 12b.
A total of five sets of drilling rigs were set up in the high level boreholes in the roof, and each group had 3 drilling holes. The 1# drilling field was 606 m away from the stop line (Figure 12a). And as shown in Figure 12c, three boreholes with spacing of 8 m in the vertical direction were drilled at 21°, 24° and 27° elevation angles, respectively. Among them, the 3# borehole was 50.15 m from the bottom plate. Table 2 shows the comparison of drilling parameters of the two types of gas drainage measures: the long horizontal borehole and the high level borehole measures. The diameter of these boreholes was 96 mm. All the three boreholes were connected to high negative pressure (45 kPa) drainage pipes for gas drainage. According to the above conditions, since the long horizontal borehole has less construction and longer service period than the high level boreholes, the low cost of the former measure is self-evident.

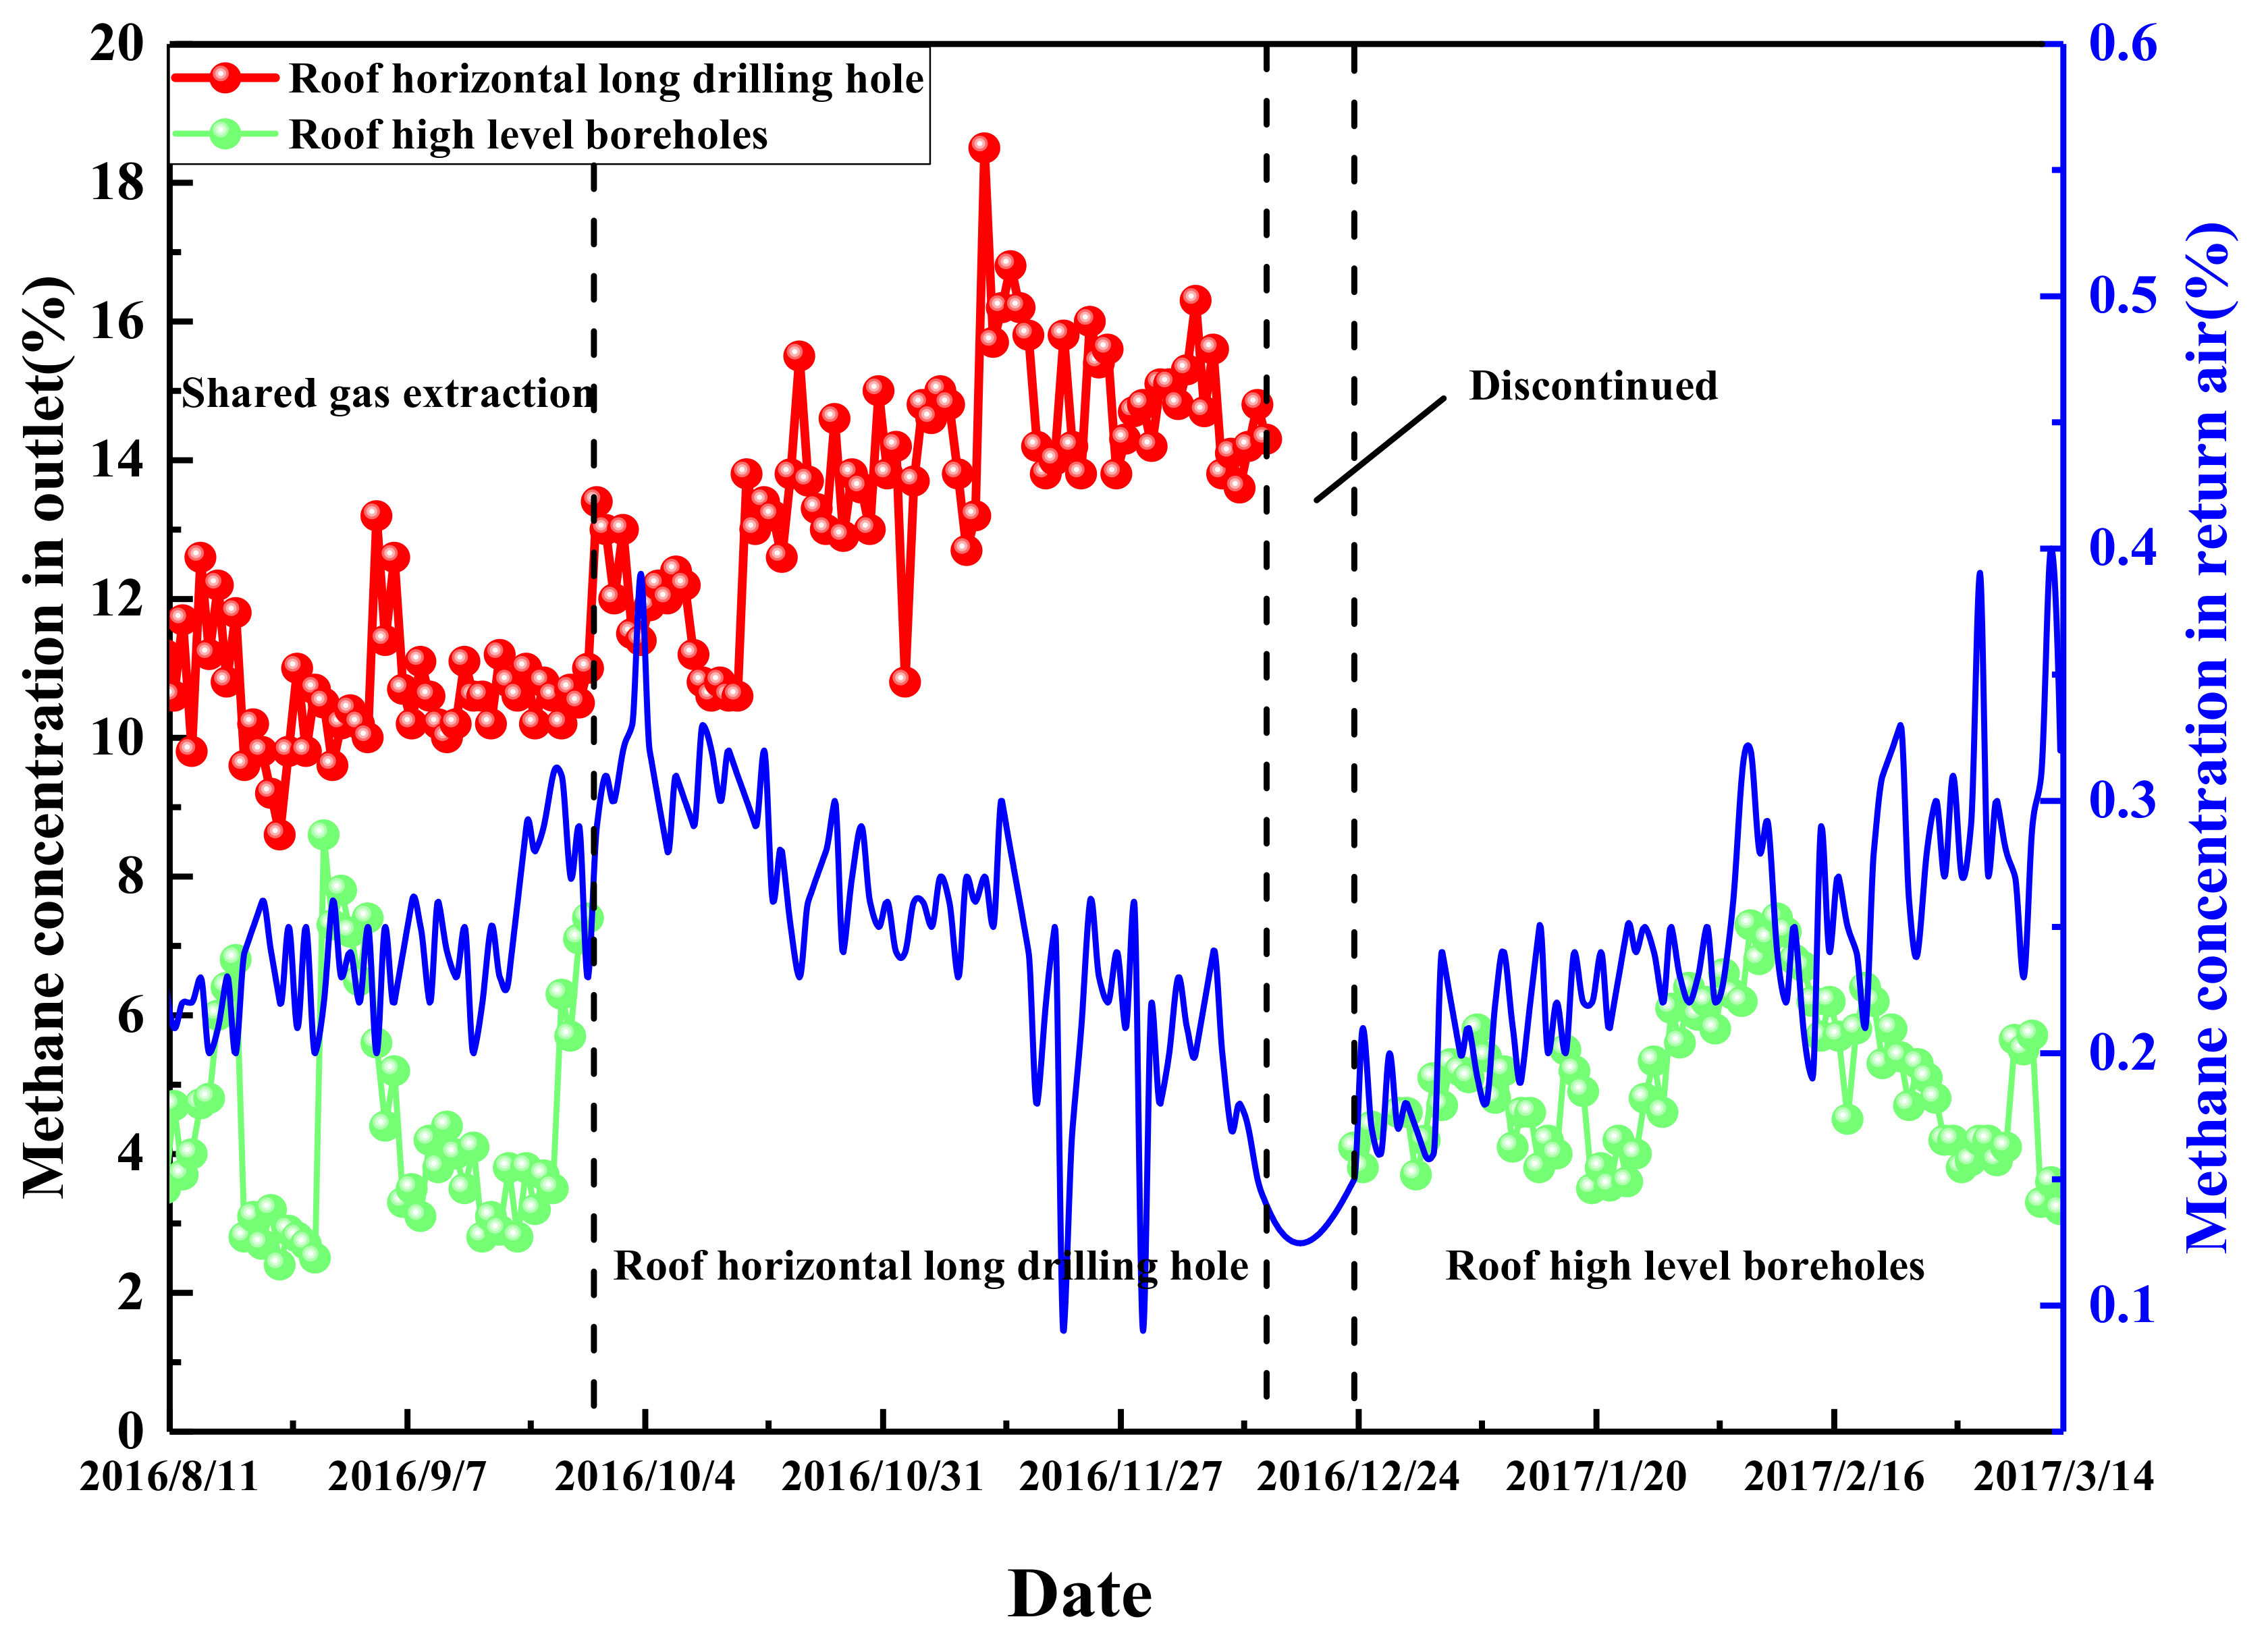
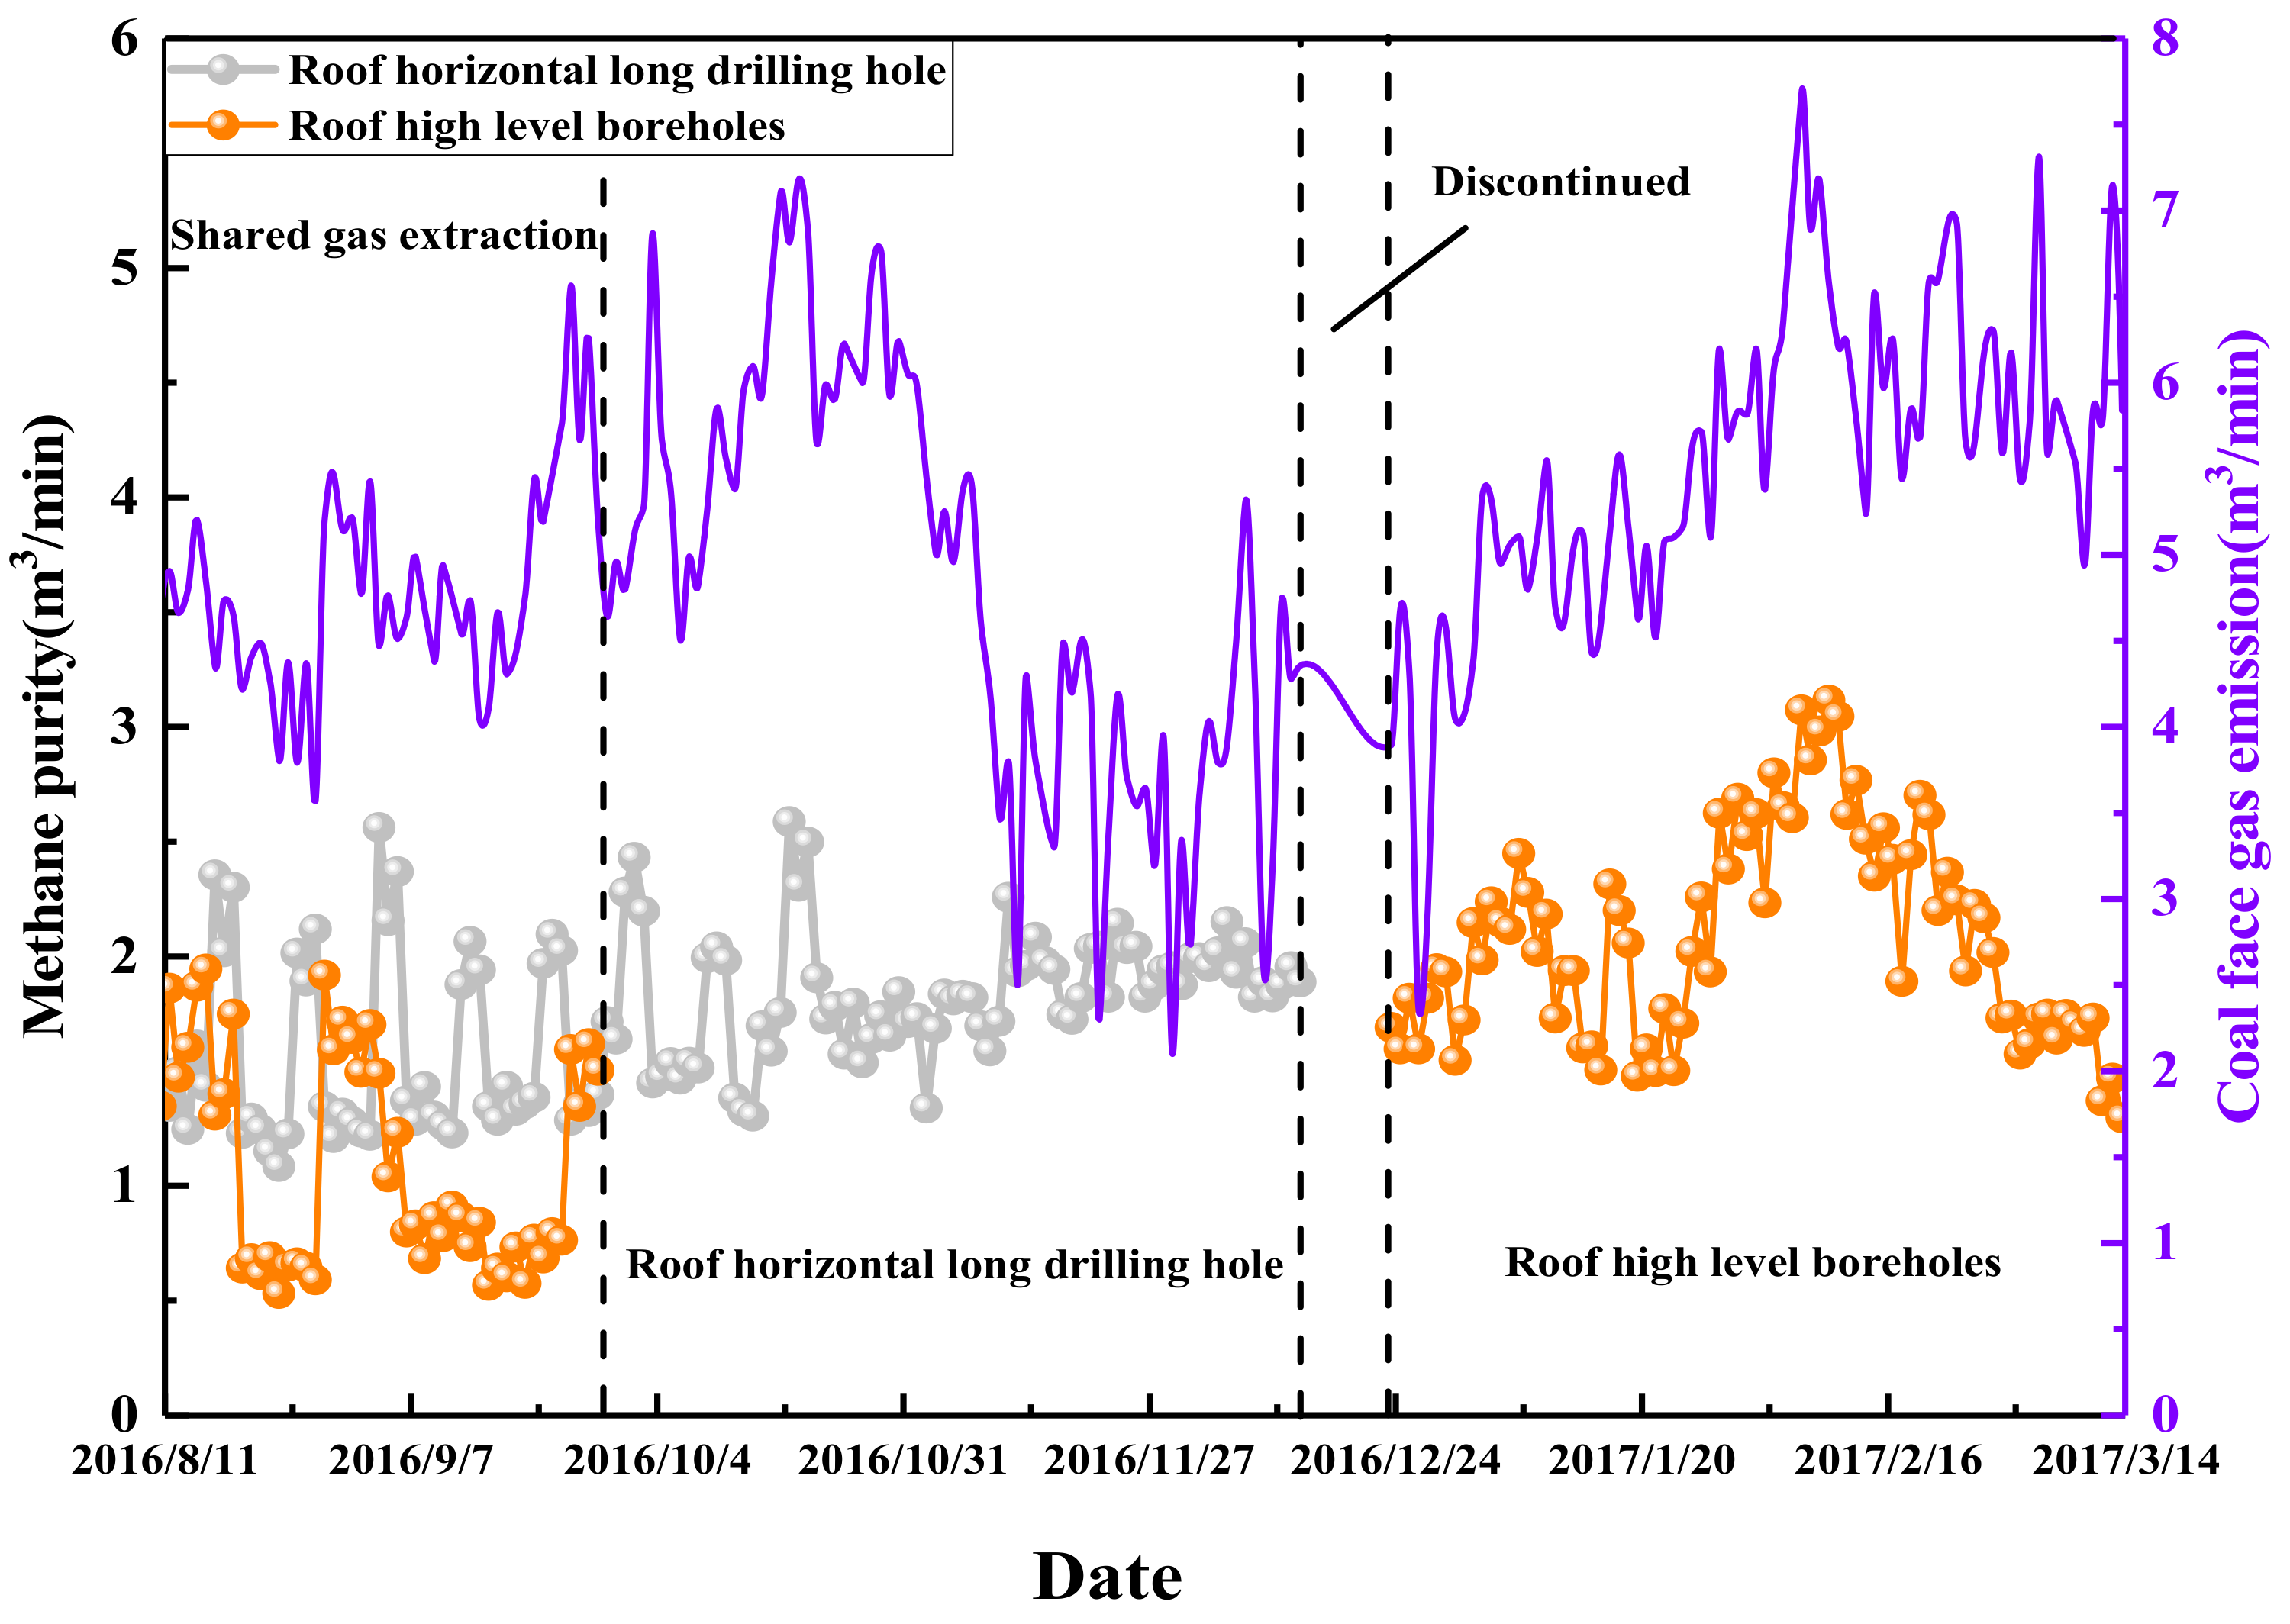
4.2. Comparative Analysis for Two Measure Gas Drainage Effects

Gas drainage from the working face undergoes three stages: the mixing of two measures in the early stage, the long horizontal borehole measure in the middle, and the high level borehole measure in the late. In the following, through analyzing the change of methane concentration in the discharge outlet and in the return airflow (Figure 13), the change of methane purity and coal face gas emission (Figure 14), as well as the change of methane concentration in return airflow corner, with the time, we tried to determine the advantages of the roof long horizontal borehole measure.
As shown in Figure 13, in the early stage, because the initial layouts of the two extraction measures make gas drainage instable, the methane concentration in the return airflow reaches a maximum of 0.32%. In the middle stage, the long horizontal borehole in the roof is pumped alone. The methane concentration at the discharge port gradually increases with the average concentration of about 12% and methane concentration in the return air flow is negatively correlated with the concentration of gas drainage.
In the late stage, with the roof high level boreholes continue to advance with the working face, some boreholes failure, resulting in an instable gas extraction. Thus, the average methane concentration at the discharge port is about 6%, while the methane concentration in the return flow is positively correlated with the concentration of gas drainage. Therefore, the roof long horizontal borehole for methane drainage is not only highly stable but also highly efficient in methane drainage, which is about two-fold of that of the roof high level boreholes. Thus, the former measure can more effectively reduce the methane concentration in the return air flow.
From Figure 14 it is clear that in the early stage, the amount of methane emissions out of the working face is relatively high, with an average of about 4.78 m3/min. Because the different efficiencies of two gas drainage measures cause their pure methane drainage volumes to be different, the pure methane drainage volume using the long horizontal borehole in the roof is about 1.56 m3/min, which is about 32% of the total methane emission quantity. The average amount of gas drainage from the roof of the working face using the high level boreholes is about 1.09 m3/min, which is about 22.8% of the total methane emission quantity. In the middle stage, the amount of gas emission from the working face of up to 3.76 m3/min is unstable, at this time, the pure methane drainage volume using the long horizontal borehole in the roof is negatively correlated with the amount of gas emission out of the face, and the methane drainage effect is obvious. In the late stage, the amount of gas emission from the working face is pyramid-shaped with its peak of up to 7.6 m3/min, the overall change trend is similar to that of the volume of pure methane drainage by using the roof high level boreholes. Its gas drainage effect is not obvious. In summary, the long horizontal borehole is highly efficient, and its effect of the pure methane drainage volume is obviously better than that of the roof high level boreholes.
The wind speed at the return airflow corner is low, thus the gas accumulation is prone to increasing and an important parameter for analyzing the efficiency of gas drainage. Figure 15 shows the variation of methane concentration at the return airflow corner in the whole stage. From the figure, clearly, in the early stage, the effect of gas drainage at the corner is not obvious as methane concentration barely changes. In the middle stage, due to its strong adaptability, the long horizontal borehole as a whole always maintains a stable gas drainage at the corner, significantly reducing methane concentration. In the late stage, because the roof high level borehole has to continuously update their drilling sites with the advance of the working face, gas drainage and recovery become very instable and unobvious. Therefore, the methane concentration at the corner increases significantly.
In summary, both theoretical analysis and numerical simulation are combined to find the height of the gas-guiding fracture zone. Based on the obtained height, the long horizontal borehole in the roof is accurately constructed and used for methane drainage, and compared with the roof high level borehole in the field. The results proved that the long horizontal borehole in the roof has high stability, high efficiency and strong adaptability over the high level borehole. Thus, this measure can provide a theoretical basis for gas drainage in coal mines.

5. Conclusions

In this study we chose the 6306 working face of Tangkou Coal Mine as the engineering background. We: (1) determined the height of its caving-in zone based on a mathematical model using the bulk coefficient and void ratio, (2) the caving-in characters of the overlying strata of the coal seam and the development height of the fracture zone and obtained the spatiotemporal distribution characteristics of the porosity through DEM the numerical simulation, (3) quantitatively described the gas-guiding fracture zone and its related zones and determined the height of its gas-guiding fracture zone. Overall, the long horizontal borehole could be accurately constructed according to the obtained height and used for CBM drainage experiments in the 6303 working face field. Comparison between methane drainage by using the long horizontal borehole and the high level borehole proved that the long horizontal borehole has the high stability, high efficiency and strong adaptability for methane drainage with its drainage effect of about twice that of common gas drainage measures.

Author Contributions

G.W. and C.F. conducted the main work and wrote the paper; H.X. participated in the mathematical model derivation; R.W. designed the numerical simulation experiment and operation; X.L. finished the field experiment and the related data analysis. They all provided insightful suggest and revised the paper.

Funding

This research was funded by the National Natural Science Foundation of China (Project No. 51674158, 51474106), the Taishan Scholar Talent Team Support Plan for Advantaged & Unique Discipline Areas, the Source Innovation Program (Applied Research Special-Youth Special) of Qingdao (Project No. 17-1-1-38-jch), the Major Program of Shandong Province Natural Science Foundation (ZR2018ZA0602), and the Shandong University of Science and Technology Research Fund (Project No. 2015JQJH105).

Acknowledgments

This research received many helps from the staff of Tangkou Coal Mine. In the process of writing articles, our friends give us a lot of advice. We are appreciated for that.

Conflicts of Interest

The authors declare no conflict of interest. The founding sponsors had no role in the design of the study; in the collection, analyses, or interpretation of data; in the writing of the manuscript, and in the decision to publish the results.

References

  1. Wu, Z.; Sun, R.; Han, S. Experiments on In-Seam Long-Borehole Directional Drilling Technology. China Coalbed Methane 2005, 2, 38–40. [Google Scholar]
  2. Karacan, C.Ö.; Ruiz, F.A.; Cotè, M.; Phipps, S. Coal mine methane: A review of capture and utilization practices with benefits to mining safety and to greenhouse gas reduction. Int. J. Coal Geol. 2011, 86, 121–156. [Google Scholar] [CrossRef]
  3. Karacan, C.Ö. Evaluation of the relative importance of coalbed reservoir parameters for prediction of methane inflow rates during mining of longwall development entries. Comput. Geosci. 2008, 34, 1093–1114. [Google Scholar] [CrossRef]
  4. Palmer, I. Coalbed methane completions: A world view. Int. J. Coal Geol. 2010, 82, 184–195. [Google Scholar] [CrossRef]
  5. Su, S.; Beath, A.; Guo, H.; Mallett, C. An assessment of mine methane mitigation and utilisation technologies. Prog. Energy Combust. Sci. 2005, 31, 123–170. [Google Scholar] [CrossRef]
  6. Wang, F.; Ren, T.; Tu, S.; Hungerford, F.; Aziz, N. Implementation of underground longhole directional drilling technology for greenhouse gas mitigation in Chinese coal mines. Int. J. Greenh. Gas Control 2012, 11, 290–303. [Google Scholar] [CrossRef]
  7. Zhou, F.; Xia, T.; Wang, X.; Zhang, Y.; Sun, Y.; Liu, J. Recent developments in coal mine methane extraction and utilization in China: A review. J. Nat. Gas Sci. Eng. 2016, 31, 437–458. [Google Scholar] [CrossRef]
  8. Cheng, W.; Liu, Z.; Yang, H.; Wang, W. Non-linear seepage characteristics and influential factors of water injection in gassy seams. Exp. Therm. Fluid Sci. 2018, 91, 41–53. [Google Scholar] [CrossRef]
  9. Ni, G.; Cheng, W.; Lin, B.; Zhai, C. Experimental study on removing water blocking effect (WBE) from two aspects of the pore negative pressure and surfactants. J. Nat. Gas Sci. Eng. 2016, 31, 596–602. [Google Scholar] [CrossRef]
  10. Wang, Y.; Liu, S. Estimation of Pressure-Dependent Diffusive Permeability of Coal Using Methane Diffusion Coefficient: Laboratory Measurements and Modeling. Energy Fuels 2016, 30, 8968–8976. [Google Scholar] [CrossRef]
  11. Wang, G.; Wu, M.; Wang, R.; Xu, H.; Song, X. Height of the mining-induced fractured zone above a coal face. Eng. Geol. 2017, 216, 140–152. [Google Scholar] [CrossRef]
  12. Chu, T.; Yu, M.; Yang, S.; Xu, Q.; Meng, D.; Jia, H. Coupling between gas drainage and spontaneous combustion about close distance coal seams in U+II type workface. J. China Coal Soc. 2010, 35, 2–7. [Google Scholar]
  13. Szlazak, N.; Obracaj, D.; Swolkień, J. Methane drainage from roof strata using an overlying drainage gallery. Int. J. Coal Geol. 2014, 136, 99–115. [Google Scholar] [CrossRef]
  14. Huiming, Y.; Hu, L. Experimental research on coalbed gas drainage effect and economy of long directional borehole in roof. IOP Conf. Ser. Earth Environ. Sci. 2017, 64, 012012. [Google Scholar] [Green Version]
  15. Cheng, Z.; Bai, L.; Hai, W. Gas drainage with high level borehole in roof applied to gas control. Coal Eng. 2005, 9, 4–6. [Google Scholar]
  16. Sun, R.; Gang, W.; Zhang, W.; Liu, L. Experimental research on using approximate horizontal long—Hole instead of closed high extracted roadway to drain gas. Coal Geol. Explor. 2005, 33, 2–5. [Google Scholar]
  17. Lin, Z.; Peng, Y.; Zhou, Z.; Yun-long, Z. Application of directional drilling technology a long seam to Ningxia Mining Area. Coal Sci. Technol. 2008, 11, 47–51. [Google Scholar]
  18. Hungerford, F. An Assessment of the Status of Long-Hole in- Seam Drilling in Australia; Underground Coal Mining Exploration Techniques: Brisbane, Australia, 1991. [Google Scholar]
  19. Kroepsch, A.C. Horizontal drilling, changing patterns of extraction, and piecemeal participation: Urban hydrocarbon governance in Colorado. Energy Policy 2018. [Google Scholar] [CrossRef]
  20. Li, Y. Upper corner gas control based on high level directional long borehole. Coal Sci. Technol. 2018, 46, 215–213. [Google Scholar]
  21. An, F.; Wang, Z.; Yang, H.; Yang, S.; Pan, F.; Chen, T.; Xie, C. Application of directional boreholes for gas drainage of adjacent seams. Int. J. Rock Mech. Min. Sci. 2016, 90, 35–42. [Google Scholar] [CrossRef]
  22. Palchik, V. Bulking factors and extents of caved zones in weathered overburden of shallow abandoned underground workings. Int. J. Rock Mech. Min. Sci. 2015, 79, 227–240. [Google Scholar] [CrossRef]
  23. Xia, X.; Huang, Q. Study on the dynamic height of caved zone based on porosity. J. Min. Saf. Eng. 2014, 31, 102–107. [Google Scholar] [CrossRef]
  24. China Coal Research Institute Beijing Institute of Exploitation. Surface Movement and Overburden Failure of Coal Mines and Their Application; China Coal Industry Publishing House: Beijing, China, 1981. [Google Scholar]
  25. Cundall, P.A.; Strack, O.D.L. A discrete numerical model for granular assemblies. Geotechnique 1979, 29, 47–65. [Google Scholar] [CrossRef]
  26. Itasca Consulting Group Inc. PFC2D: Particle Flow Code in 2 Dimensions, version 5.0; Itasca Consulting Group Inc.: Minneapolis, MN, USA, 2017. [Google Scholar]
  27. Zou, Z.; Tang, H.; Xiong, C.; Su, A.; Criss, R.E. Kinetic characteristics of debris flows as exemplified by field investigations and discrete element simulation of the catastrophic Jiweishan rockslide, China. Geomorphology 2017, 295, 1–15. [Google Scholar] [CrossRef]
  28. Wang, T.; Zhou, W.; Chen, J.; Xiao, X.; Li, Y.; Zhao, X. Simulation of hydraulic fracturing using particle flow method and application in a coal mine. Int. J. Coal Geol. 2014, 121, 1–13. [Google Scholar] [CrossRef]
Figure 1. CBM-induced accidents from 2005 to 2015.
Energies 11 02647 g001
Figure 2. Schematic of a long horizontal borehole and related branch holes drilled for CBM drainage in worked seam.
Energies 11 02647 g002
Figure 3. Location of Tangkou Coal Mine, Shandong Province, China.
Energies 11 02647 g003
Figure 4. Typical geological log profile of No. 6306 Face and its overlying and underlying strata.
Energies 11 02647 g004
Figure 5. Schematic of using PFC2D for a loop calculation about Newton’s second law and force-displacement relationship.
Energies 11 02647 g005
Figure 6. Schematic of parallel-bonded model. kn and ks are the normal and shear stiffnesses of particles, respectively; Rmax and Rmin are the large and small particle radii in two intercontacting particles, respectively; Fn and Fs are the normal and shear contacting forces between particles, respectively; k ¯ n and k ¯ s are the normal and shear stiffnesses of parallel bonding particles, respectively.
Energies 11 02647 g006
Figure 7. Schematic of the numerical simulation model for No.6303 face. The circle is used to monitor the dynamic change of porosity data.
Energies 11 02647 g007
Figure 8. Dynamic evolution of cracks and porosity simulated with PFC2D, showing changes in cracks in overburden strata during heading to 12 m, 22 m (a), 33 m, and 42 m (c) prior to the face; and changes in porosity at 12 m, 22 m (b) and 33 m, and 42 m (d). The changes in porosity level are denoted by the change in color scale through the corresponding numerical value.
Energies 11 02647 g008
Figure 9. Dynamic evolution of cracks and porosity simulated with PFC2D, showing change in cracks in overburden strata during heading to 62 m (a) and 81 m (c) prior to the face, and changes in porosity at 62 m (b) and 81 m (d). The changes in porosity level are denoted by the change in color scale through the corresponding numerical value.
Energies 11 02647 g009
Figure 10. Dynamic evolution of cracks and porosity simulated with PFC2D, showing changes in cracks in overburden strata as heading to 91 m (a) and 103 m (c) prior to the face; and changes in porosity to 91 m (b) and 103 m (d). The changes in porosity level are denoted by the change in color scale through the corresponding numerical value.
Energies 11 02647 g010
Figure 11. The gas-guiding fracture zone at 122 m prior to the working face can be divided by PFC2D simulated porosity distribution data into four zones: fracture development zone (I), stability zone (II), stratification zone (III), and undisturbed zone (IV). The fissure development zone of 51.19 in height includes the caving-in zone and the mining- induced fracture zone.
Energies 11 02647 g011
Figure 12. Layout of methane drainage system for No. 6306 working face. (a) Projection for drilling the long horizontal borehole in roof and the roof high level boreholes; (b) Lateral view of the long horizontal borehole through roof; (c) Lateral view of the roof high level boreholes.
Energies 11 02647 g012
Figure 13. Relationships of methane concentrations in both discharge outlet and return airflow to time. Short-term shutdown occurs due to equipment maintenance problems. Red broken line: variation in methane concentration in the return air flow after the roof long horizontal borehole used. Green fold line: variation in methane concentration in the return air flow after the roof high level borehole used. Blue broken line: change in methane concentration at the discharge outlet.
Energies 11 02647 g013
Figure 14. The variation of working face methane emission and drainage scalar over time.
Energies 11 02647 g014
Figure 15. Changes in the concentration of CH4 in the return airflow corner over time.
Energies 11 02647 g015
Table 1. Macroscopic and microscopic physic and mechanical parameters of No.6303 Face and its overly and underlying strata.
StratumLithologyMacroscopic ParametersMesoscopic Parameters
Poisson’s RatioElastic ModulusTensile Strength (MPa)Cohesion (MPa)Internal Friction Angle (°)KratEmod (GPa)Kn (GPa)Ks (GPa)Pb-kn (GPa)Pb-ks (GPa)
J21Fine-grained sandstone0.157.094.6611.0539.41.24.597.45.64.7
J20Siltstone0.2318.11.366.32361.7612.725.414.315.89
J19Mudstone0.248.914.6611.05361.766.313.37.38.34.3
J18Siltstone0.248.913.065.77361.766.313.37.38.34.3
J17Fine-grained sandstone0.1417.252.584.3538.81.3910.821.618.813.511.8
J16Medium-grained sandstone0.1815.361.366.3235.31.3910.120.214.512.69.1
J15Mudstone0.157.11.67.639.41.24.597.465.64.6
J14Fine-grained sandstone0.177.381.366.3238.81.324.89.67.264.5
J13Siltstone0.157.093.065.7735.41.24.597.45.64.6
J12Medium-grained sandstone0.1417.251.366.3238.81.1410.821.618.813.511.8
J11Fine-grained sandstone0.157.092.584.3539.41.24.597.45.64.6
J10Mudstone0.1815.361.427.634.31.3910.120.214.512.69
J9Siltstone0.157.252.584.3536.41.24.69.27.65.74.7
J8Fine-grained sandstone0.1815.361.67.635.31.3910.120.214.512.69
J7Siltstone0.157.251.337.635.41.24.69.27.65.74.7
J6Fine-grained sandstone0.276.863.065.7742.62.135.110.24.76.32.9
J5Medium-grained sandstone0.157.251.336.3235.41.24.69.27.65.74.7
J4Mudstone0.276.862.584.3542.62.135.110.24.76.32.9
J3Coal seam 30.1416.261.332.42381.1410.1821.618.813.511.8
J2Siltstone0.276.863.066.3242.62.135.110.24.76.32.9
J1Fine-grained sandstone0.1815.364.6611.58351.3910.120.214.512.69.1
Note: Krat is the normal-to-shear stiffness ratio; Emod the effective modulus; Pb-kn and Pb-ks are the normal and shear stiffnesses, respectively.
Table 2. Comparison in drilling parameters for gas drainage between long horizontal borehole and high level boreholes.
QuantityAverage Length (m)Diameter (mm)Distance of the Hole from the Drill Floor (m)Spacing of Drilling Field in the Direction of Working Face (m)Normal Suction Pressure (kPa)
Roof high level boreholes5909625045
Roof long horizontal borehole2570962.555045

