Article

A New PV Array Fault Diagnosis Method Using Fuzzy C-Mean Clustering and Fuzzy Membership Algorithm

1
School of Control and Computer Engineering, North China Electric Power University, Beijing 102206, China
2
School of Renewable Energy, North China Electric Power University, Beijing 102206, China
3
State Key Laboratory of Alternate Electrical Power System with Renewable Energy Sources, North China Electric Power University, Changping District, Beijing 102206, China
*
Author to whom correspondence should be addressed.
Energies 2018, 11(1), 238; https://doi.org/10.3390/en11010238
Submission received: 1 November 2017 / Revised: 15 January 2018 / Accepted: 16 January 2018 / Published: 19 January 2018
(This article belongs to the Special Issue PV System Design and Performance)

Abstract

:
Photovoltaic (PV) power station faults in the natural environment mainly occur in the PV array, and the accurate fault diagnosis is of particular significance for the safe and efficient PV power plant operation. The PV array’s electrical behavior characteristics under fault conditions is analyzed in this paper, and a novel PV array fault diagnosis method is proposed based on fuzzy C-mean (FCM) and fuzzy membership algorithms. Firstly, clustering analysis of PV array fault samples is conducted using the FCM algorithm, indicating that there is a fixed relationship between the distribution characteristics of cluster centers and the different fault, then the fault samples are classified effectively. The membership degrees of all fault data and cluster centers are then determined by the fuzzy membership algorithm for the final fault diagnosis. Simulation analysis indicated that the diagnostic accuracy of the proposed method was 96%. Field experiments further verified the correctness and effectiveness of the proposed method. In this paper, various types of fault distribution features are effectively identified by the FCM algorithm, whether the PV array operation parameters belong to the fault category is determined by fuzzy membership algorithm, and the advantage of the proposed method is it can classify the fault data from normal operating data without foreknowledge.

1. Introduction

The photovoltaic (PV) power plant works under a tough natural environment, and PV array faults are complicated and various, seriously affecting safe-stable operation and economic benefits of the power station in a very complex and dynamic manner. The DC monitor resolution available to PV power plants has reached the PV array level. The resolution of certain smart PV power stations has even reached the module level. There is critical significance in identifying and early warning for DC faults using the PV module/output data array of the PV power station in regards to intelligent predictive maintenance of the PV power plant and improving the overall operation level of the station [1].
The classification and diagnosis of PV array faults has become a popular research subject in recent years. Model-based algorithms and intelligence-based algorithms have drawn increasing attentions recently. Model-based and multivariable statistical monitoring methods are the common methods for fault identification, for example, Stellbogen [2] compared actual and expected values through detection equipment for fault analysis; however, they did not establish any method for setting thresholds between them. The model using PCA and other multivariate statistical monitoring methods for fault diagnosis is difficult to establish [3]. Model-based fault diagnosis algorithms depend on the analysis and calculation for the equivalent circuit models of PV array, and the modeling results will affect the results of diagnosis results, but the difficulty of modelling of PV array restricts such methods. The problem of multivariable statistical monitoring methods is that the selection and division of fault samples rely on human prior knowledge. In addition, quite a few researchers presented applicable intelligent recognition algorithms for PV array fault analysis and diagnosis. Karatepe et al. [4], Noguchi et al. [5], Chowdhury et al. [6], Miyatake et al. [7] and Wang et al. [8] used a particle swarm intelligent algorithm and Fibonacci search technique for PV array fault diagnosis. Zhong [9] and Cheng et al. [10] conducted PV array fault detection by analyzing the function relationship of the parameters in the PV array system according to data fusion, but this method mainly focuses on heat pot phenomena and neglects other relevant factors. Chao et al. [11] identified PV array fault locations by processing the acquired power data and environmental parameters via an intelligent learning technique. Xu et al. [12] proposed a PV array fault location method based on a Gaussian process that is effective in its own regard, but not suitable for fault detection in large-scale PV generation systems. Zhao et al. [13] used a decision tree algorithm for PV array fault diagnosis, but this method is too dependent on the measured fault sample data to be fully practical. Li et al. [14] proposed a neural network-based fault diagnosis technique that is similarly disadvantaged by the difficulty in obtaining fault samples and training the fault model. Wang et al. [15] established a back propagation (BP) neural network method, they analyzed and classified some faults of PV array based on L-M algorithm. Some researchers expanded upon the using the support vector machine (SVM) [16,17]. The SVM algorithm can realize the fault diagnosis using small amounts of sample data set, but the accuracy of SVM algorithm still relies on classified of fault samples. Compared with model algorithms, the intelligent-based algorithms can identify the faults types of PV array without additional equipment and complicated calculation model, but the accuracy of algorithms need better setting of the algorithms parameters and good classified sample data, which making intelligent-based algorithms is of poor certainty and stability. The researchers have did lots work in the classification of fault samples, despite these valuable contributions to the literature, there is yet no technique for the scientific division of fault thresholds. Previous researchers have also had success in combining neural network, SVM, cluster analysis, and other model recognition techniques with fuzzy mathematics, rough set, data analysis, and other mathematical methods in identifying fault thresholds and diagnosing various types of fault [16,17,18,19]. Krishnapuram and Keller [20] combined the fuzzy clustering algorithm with the three-ratio method for reliable, accurate transformer fault diagnosis. The FCM algorithm converges rapidly with relatively few training samples. Du W et al. [21] successfully applied the FCM theory for analog circuit fault diagnosis. The FCM algorithm is easily computed and quickly operated as-applied to fault diagnosis; it does not require a large labeled sample. However, FCM algorithm sample typicality is not reflected in the constraint of membership matrix U j = 1 c μ i k = 1 and the algorithm does not work well when there is large discrepancy among multiple specimen classes. In the fuzzy case index, the cluster centers of various fault states are obtained based on the FCM algorithm, however, how to make rules according to the clustering results, is a major concern. Li et al. [22] used similarity computation based on the membership function to secure fuzzy numbers and fuzzy linguistics for calculating global similarity weights; this process allows for quick and efficient case retrieval on different types of demand. In short: the membership function algorithm can effectively distinguish different categories quantitatively. Although fuzzy theory and its related technologies have been widely used in fault diagnosis, there has been little research on their application in PV arrays. During PV array fault diagnosis, there is complex randomness and uncertainty between the causes and external characteristics of different types of fault as well as significant differences among various samples. Therefore, the combination of FCM algorithm and fuzzy membership algorithm provides research ideas for division and identification of the PV fault samples. The combination of FCM and fuzzy membership algorithm has the following advantages: the FCM algorithm requires little computation and can be quickly operated to classify fault samples. The membership algorithm can be used to distinguish the influence degree of fault classifications based on a wide variety of data; it classifies individual sample points to realize fault diagnosis. This paper presents a novel approach to PV array fault diagnosis based on FCM and fuzzy membership algorithms. The randomness and uncertainty of PV array fault characteristics are solved by the introduction of fuzzy theory, simulation and experimental analyses demonstrate that the proposed method scientifically classifies fault sample data for efficient, accurate PV array fault diagnosis.
This paper is organized as follows: Section 2 discusses the fault characteristics of PV arrays. Section 3 provides an introduction to basic theories, principles, and application methods relevant to the FCM algorithm and fuzzy membership algorithm for fault diagnosis. Section 4 reports simulation tests and Section 5 reports experimental tests conducted to validate the proposed diagnosis method. Section 6 provides concluding remarks.

2. Characteristics Analysis of Typical Faults in PV Arrays

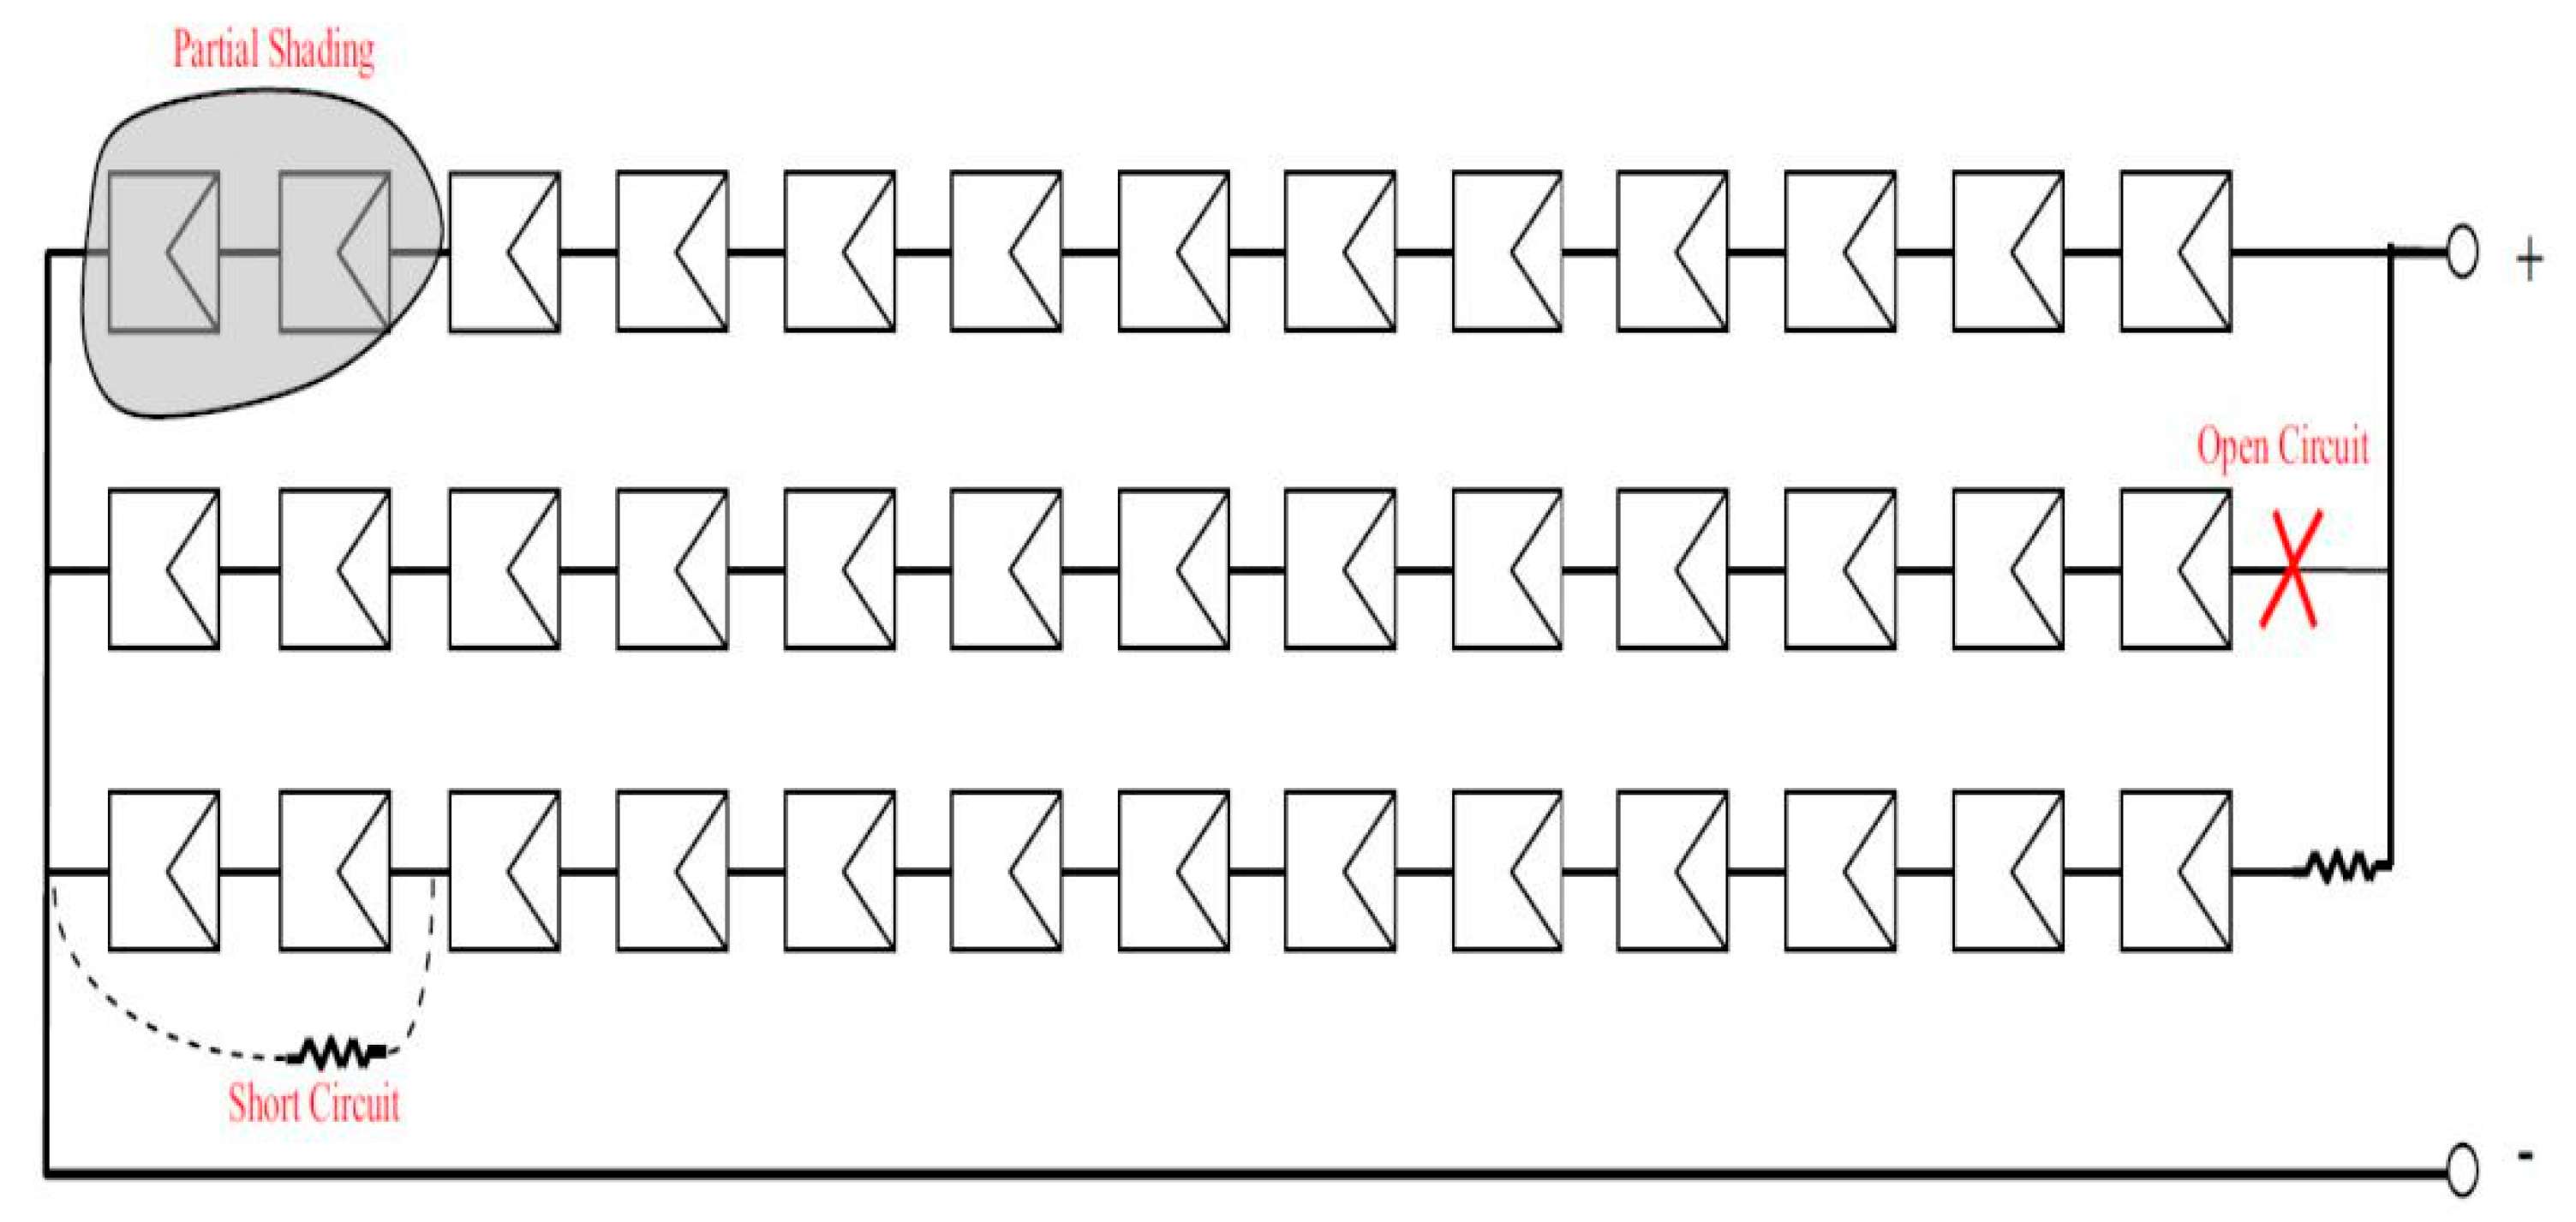
2.1. Generation Mechanism of Typical Faults in PV Arrays

The actual operation of the PV power station is affected by multiple external factors such as solar radiation intensity, temperature, humidity, dust, hail, and snow constituting a harsh (and highly fault-prone) environment [23]. The PV array is an integral part of the PV system; its cost can account for about 40% of the power system as a whole. In this paper, four common faults or abnormal condition of the laboratory PV plant is studied respectively, which is configured as three parallel PV strings of 13 PV modules in series (regard this as the research object), as shown in Figure 1. Three common faults of the PV array include the hot spot phenomenon (partial blockage), open circuits, or short circuiting of the PV module caused by junction box error. Long-term shadow shadings and module mismatch also accelerate the rate of degradation and introduce corresponding aging faults.
For simplicity, six failure modes of the PV array are referred to in this paper: a one module short circuit, two module short circuit, local shadow shading in one string group, local shadow shading in two string groups, and one module open circuit. These modes are marked F1, F2, F3, F4, F5, and F6, respectively. As shown in Table 1, based on typical fault mode of PV array set, the physics-based mathematical model of the PV cell is established according to “Accurate model simulation research on PV cells, modules and arrays” for different fault type [24]. The modeling results are shown in Figure 2, where I-V and P-V curves describe the distribution characteristics of the PV array’s electrical parameters under different fault conditions. The fault features are summarized in Table 1.

2.2. Fault Characteristic Parameter Selection

Changes in the PV array are similar under different fault modes and the same test conditions (light intensity and temperature), as shown in the I-V and P-V curves in Figure 2. This suggests that it is not feasible to diagnose fault in the PV array only by analyzing the I-V and P-V curves. Additional fault parameters must be selected to describe the working conditions of the PV power system.
Changes in the electrical parameters under different fault conditions were determined as shown in Figure 3 using the actual external environment input excitation simulation model.
As shown in Figure 3, under different fault conditions, the output characteristics of one or more PV arrays change dramatically. To this effect, the output characteristics of the PV array may serve as fault characteristic parameters under different fault states and environments: Uoc, Isc, Um, Im and Pm, expressed as the form of the fault eigenvectors (Uoc, Isc, Um, Im, Pm) (the description of the parameters is given in Table 2).

3. Basic Theories Supporting the Algorithm

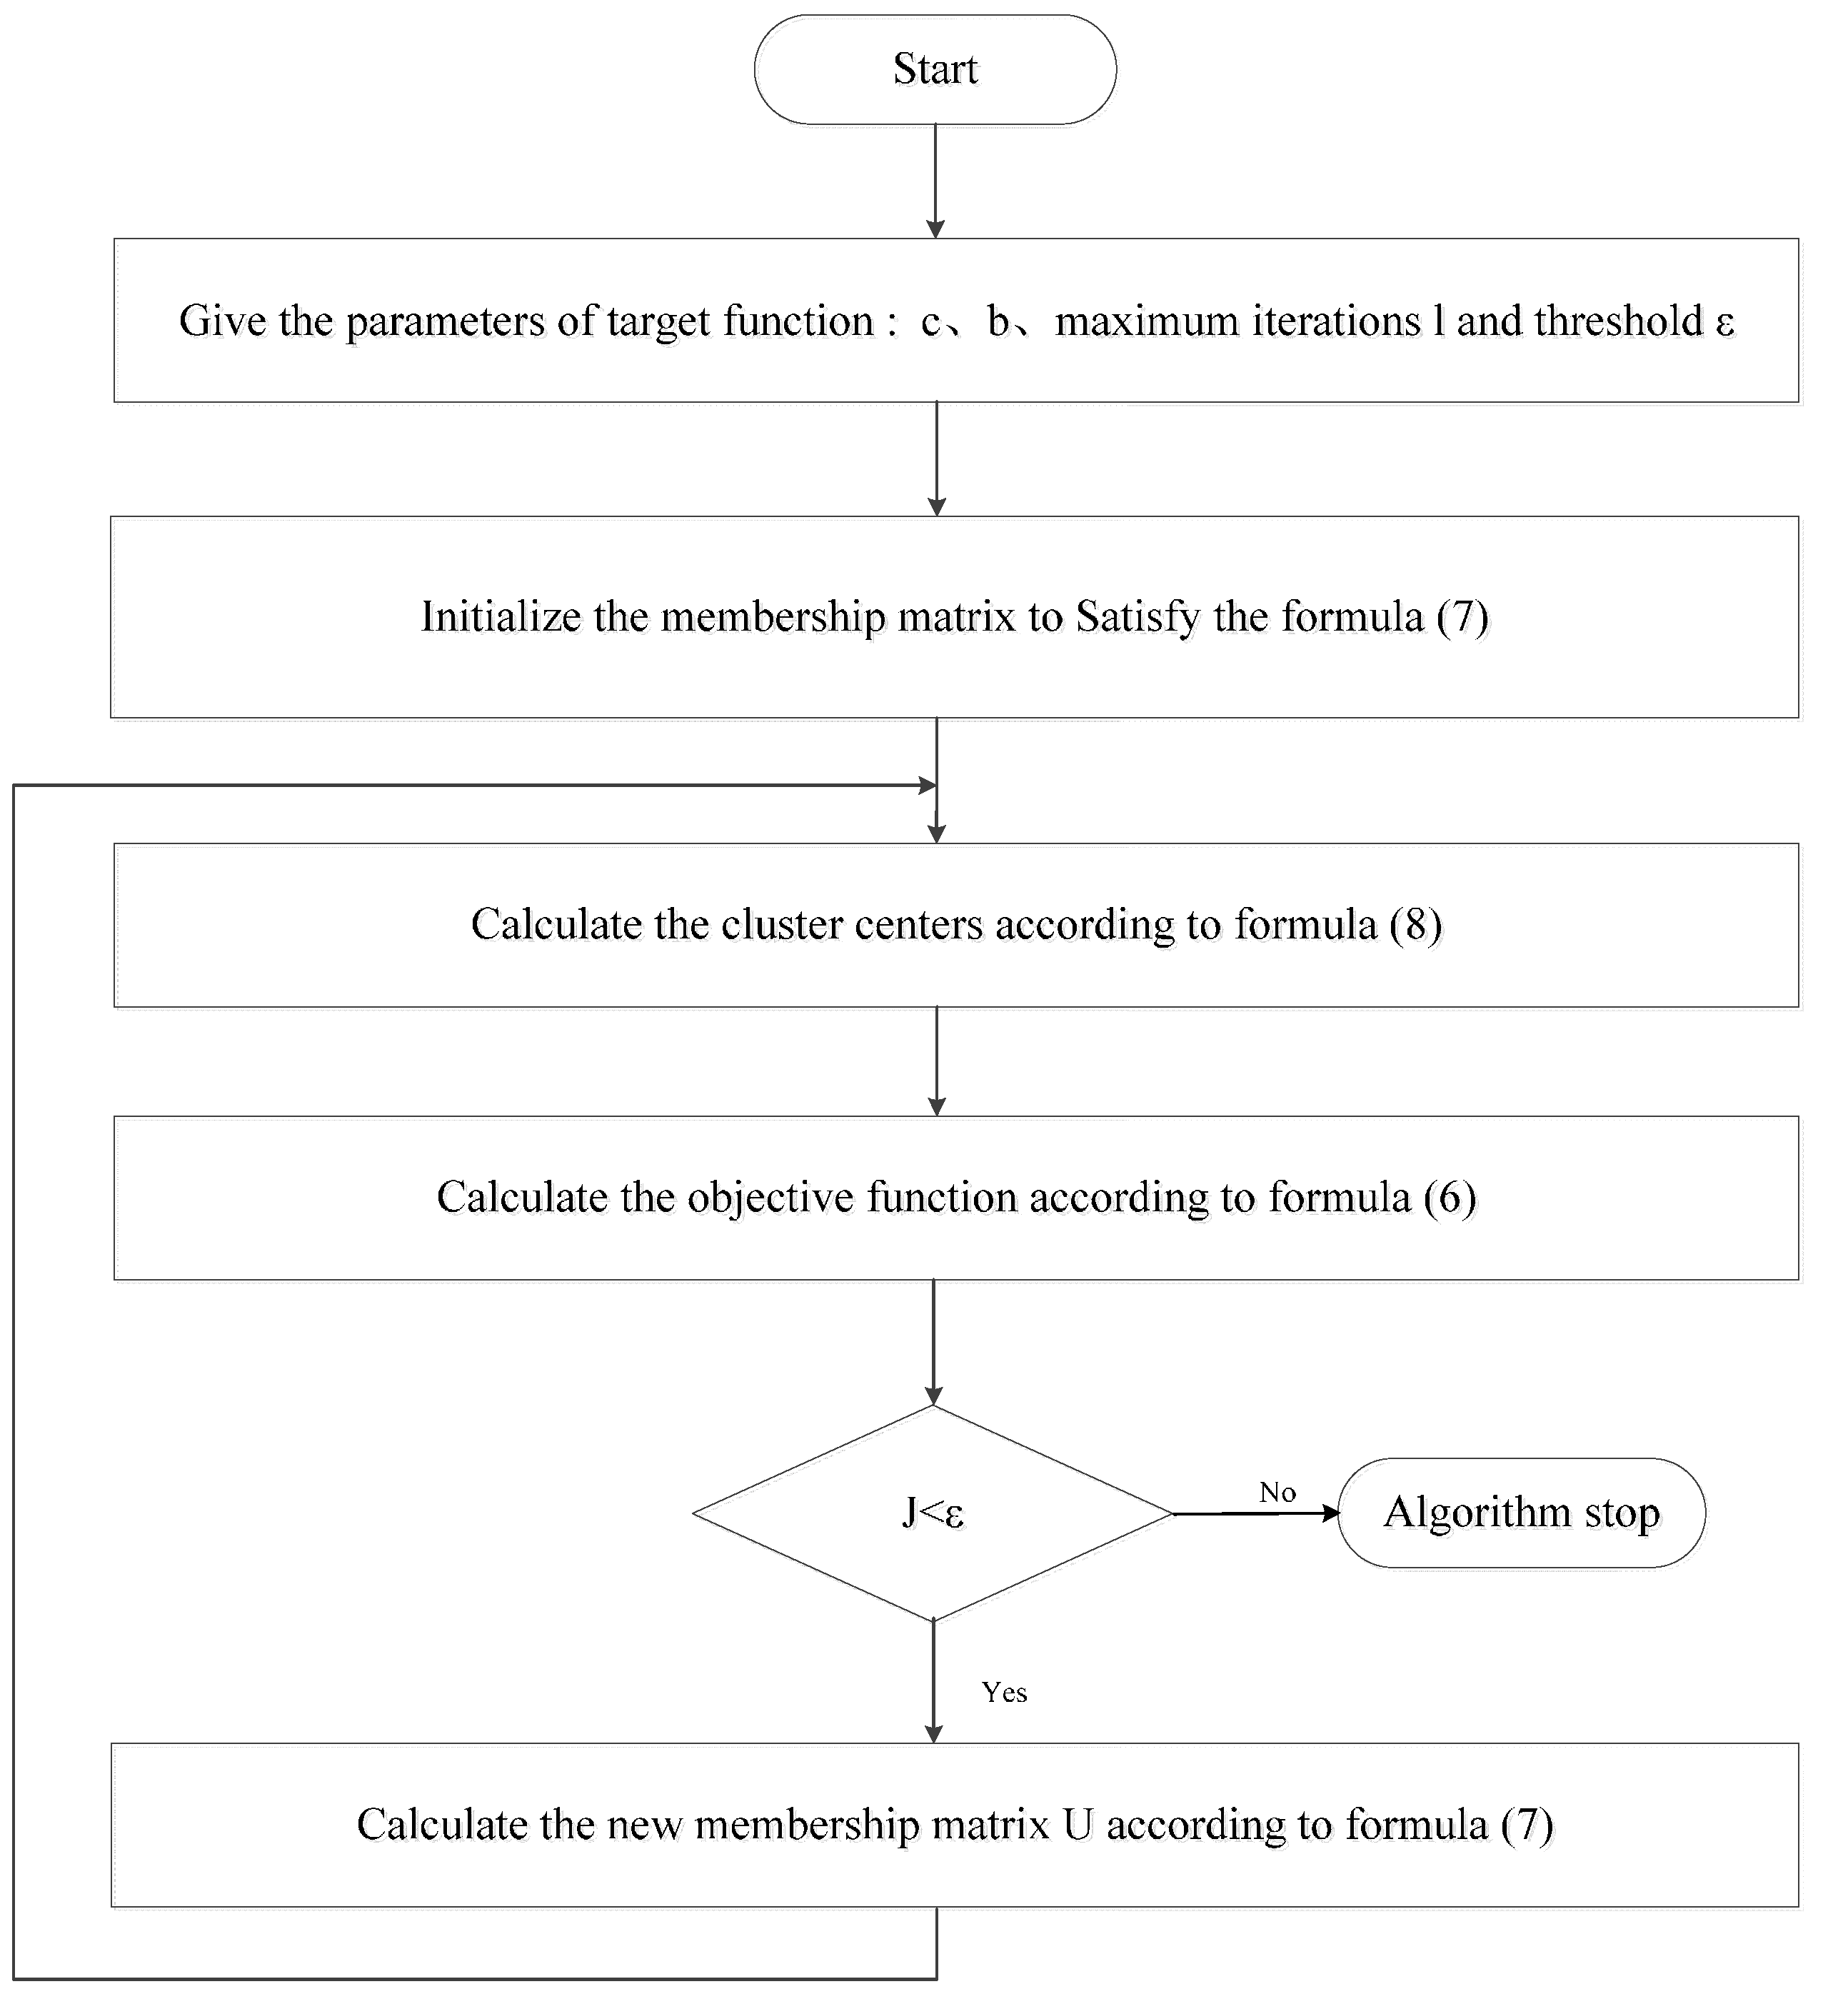
3.1. Fuzzy C-Mean Clustering Algorithm

Fuzzy clustering is commonly applied within knowledge discovery, pattern recognition, and many other research fields. The FCM algorithm is one of the most widely used and successful algorithms for fuzzy clustering, which improves Hard C-mean clustering (HCM) algorithm, and represents the foundation upon which other fuzzy clustering analysis methods have been developed in theory and application.
FCM is a classification method as well as a clustering algorithm. The membership degree of individual sample points is obtained iteratively by optimizing the objective function. The class of sample points is determined to achieve the automatic classification of sample data. As discussed above, this method is commonly used in the fault diagnosis field [20].
Set up n data sample as X = | x i ,   i = 1 , 2 , , n | = { x 1 , x 2 , , x n } , divide n data vectors Xi into a c fuzzy group, then calculate the c cluster center v = {v1, v2, …, vn}. This produces the minimum value of objective functions. Next, determine the level of each data point belonging to each group according to the membership degree, which is any value in the [0, 1] interval. The sum of membership values of each sample point to each cluster center is 1. The following two principles must be satisfied:
μ i k [ 0 , 1 ]
j = 1 c μ i k = 1 , i = 1 , 2 , , n
The general form of FCM algorithm’s objective function Jb can be expressed as follows:
J b ( U , v ) = i = 1 n k = 1 c ( μ i ˙ k ) b ( d i k ) 2
where n is the number of samples, c (2 ≤ cn) is the number of cluster centers; μik is the membership degree between sample xi and class Ak; dik is a Euclidean measurement distance between the i sample xi and k central point, dik = d(xi − vk) = j = 1 m ( x i j v k j ) 2 ; m is the characteristic number of samples; b is a weighted parameter ∞ in the range 1 ≤ b ≤ ∞.
The membership degree μik between the sample xi and class Ak is calculated as follows:
μ i k = 1 j = 1 c ( d i k d l k ) 2 b 1
Set up I k = { i | 2 c < n ; d i , k = 0 } , for all i classes, iIk, μik = 0. The cluster centers are calculated as follows:
v i = k = 1 n ( μ i k ) b x k j k = 1 n ( μ i k ) b
We modify the cluster centers and membership repeatedly according to Equations (3) and (4). When the algorithm converges, the cluster center and membership degree of each sample to each class can be obtained successfully and the fuzzy clustering division is complete. The analysis shows that FCM algorithm is a simple iteration process, the general steps of determining cluster center and membership matrix based on the FCM algorithm [20,25] are as shown in Figure 4.
The FCM algorithm converges rapidly with relatively few training samples; it can thus facilitate fault diagnosis very efficiently. MATLAB software (R2015b) also provides a rich functions for the FCM algorithm and is easily operable for fault diagnosis personnel [20].

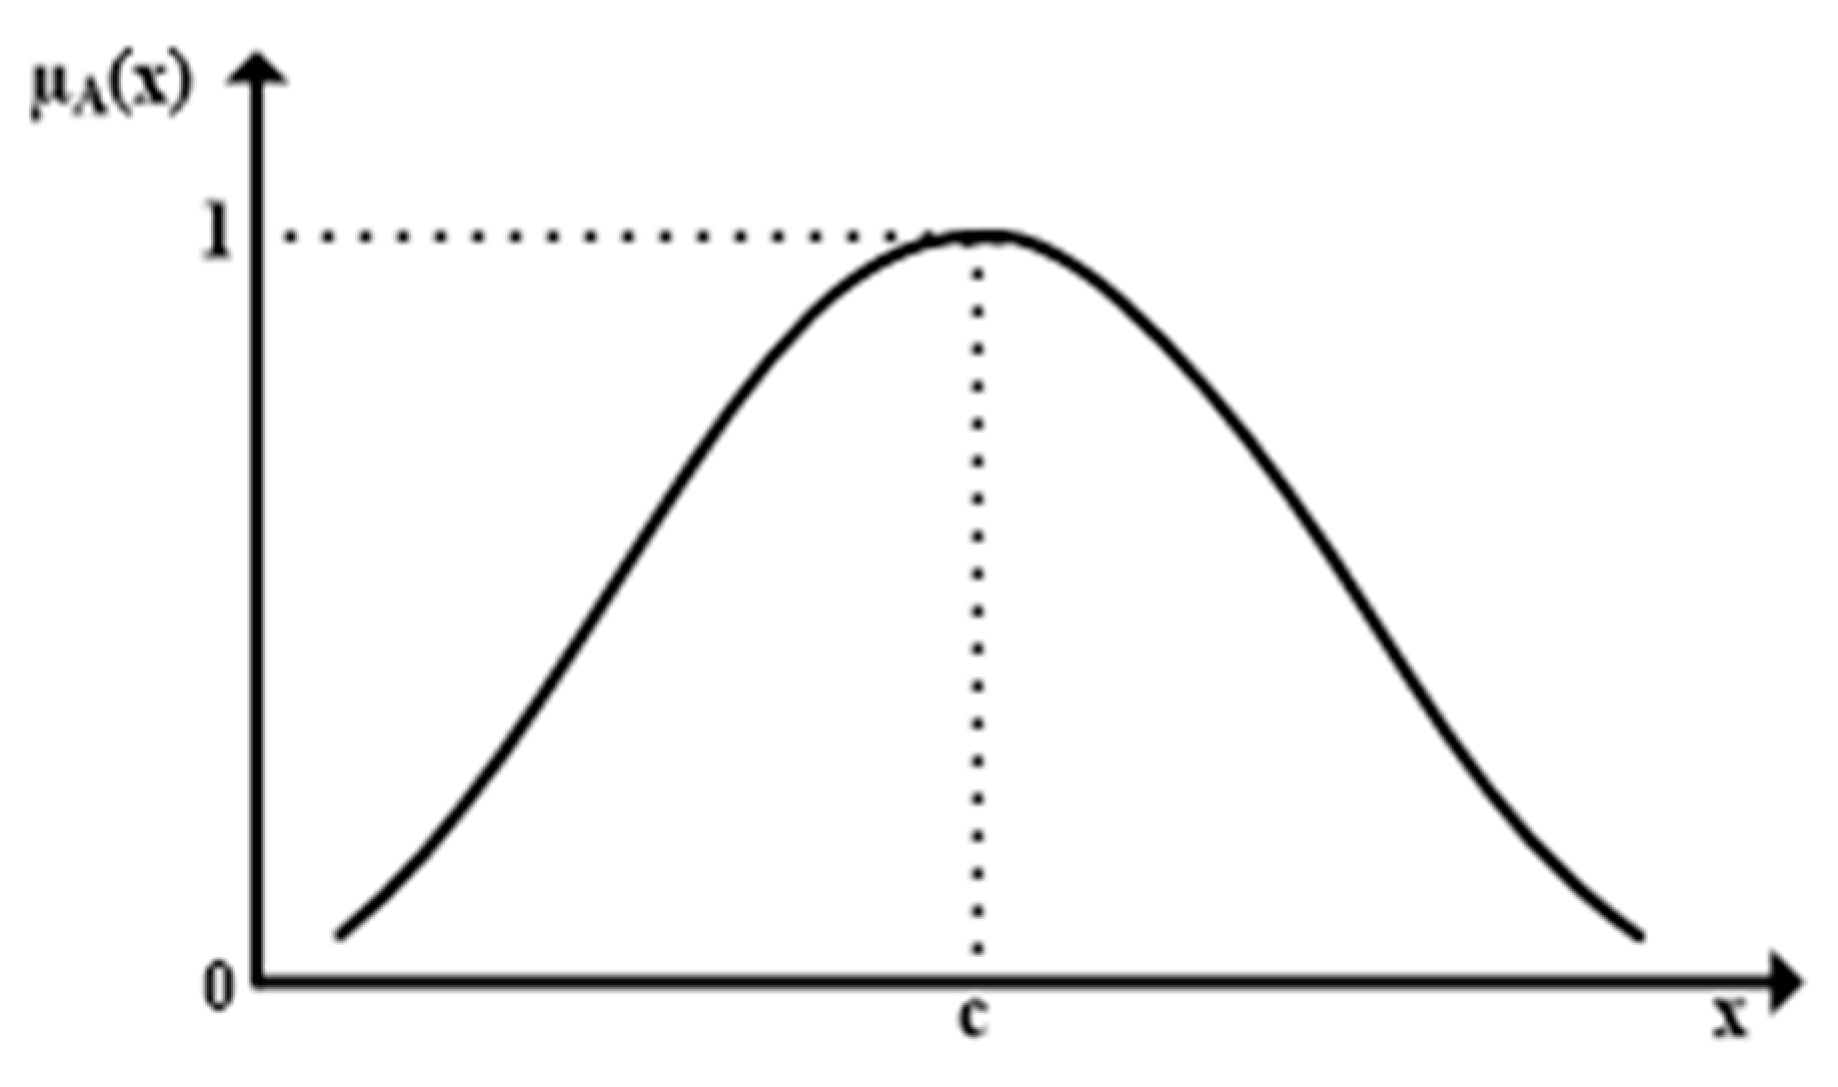
3.2. Membership Function Algorithm Based on Fuzzy Normal Distribution

Fuzzy sets are completely described by their corresponding membership functions. In classical sets, the membership degree between sets and elements can only be 0; in fuzzy sets, the membership degree between sets and elements can be any value in the [0, 1] interval. It can thus be used to describe the extent to which an element belongs to the concept in the domain U. The membership function is the most fundamental concept of fuzzy mathematics as it quantizes the necessary fuzzy sets [26,27,28].
To define the fuzzy set, make sure that fuzzy subset A in the domain U encompasses the characteristics of membership function μA and construct the following map:
μ A : U [ 0 , 1 ]
where μA is the membership function of the fuzzy subset; μA(x) is the membership degree of U to A, which represents the degree of the element u belonging to its fuzzy subset A in the domain U with continuous variables on a closed interval [0, 1]. The closer μA(x) is to 1, the greater the extent to which u belongs to A. The closer μA(x) is to 0, the lesser the degree of u belonging to A.
For the fault diagnosis of PV array, the characteristic parameters change in a certain range, PV array is under healthy conditions with these parameters in a certain scope, and PV array is under faulty conditions while these parameters out the scope, so the typical normal distribution function is selected to calculate membership degree between diagnosis samples and the cluster center in the PV system to diagnose the PV array directly and clearly according to the membership degree. Figure 5 shows the curve of Normal Distribution Membership Function. The membership function of normal distribution-Gaussian function is used to calculate the membership degree of each parameter:
μ ( x ) = e ( x μ ) 2 2 σ 2 × 100 %
where μ(x) is the membership degree of the parameter x; μ is expected value of the distribution; σ is the width of the Gaussian function.
According to the Gaussian function characteristics, 99.73% of the area under the function curve is within three standard deviations (3σ) of the expected value μ. In this paper, 6σ is used as the function domain. The value of σ was obtained as follows:
σ = μ max μ min 6
where μmax, μmin are the maximum and minimum values of the parameters.

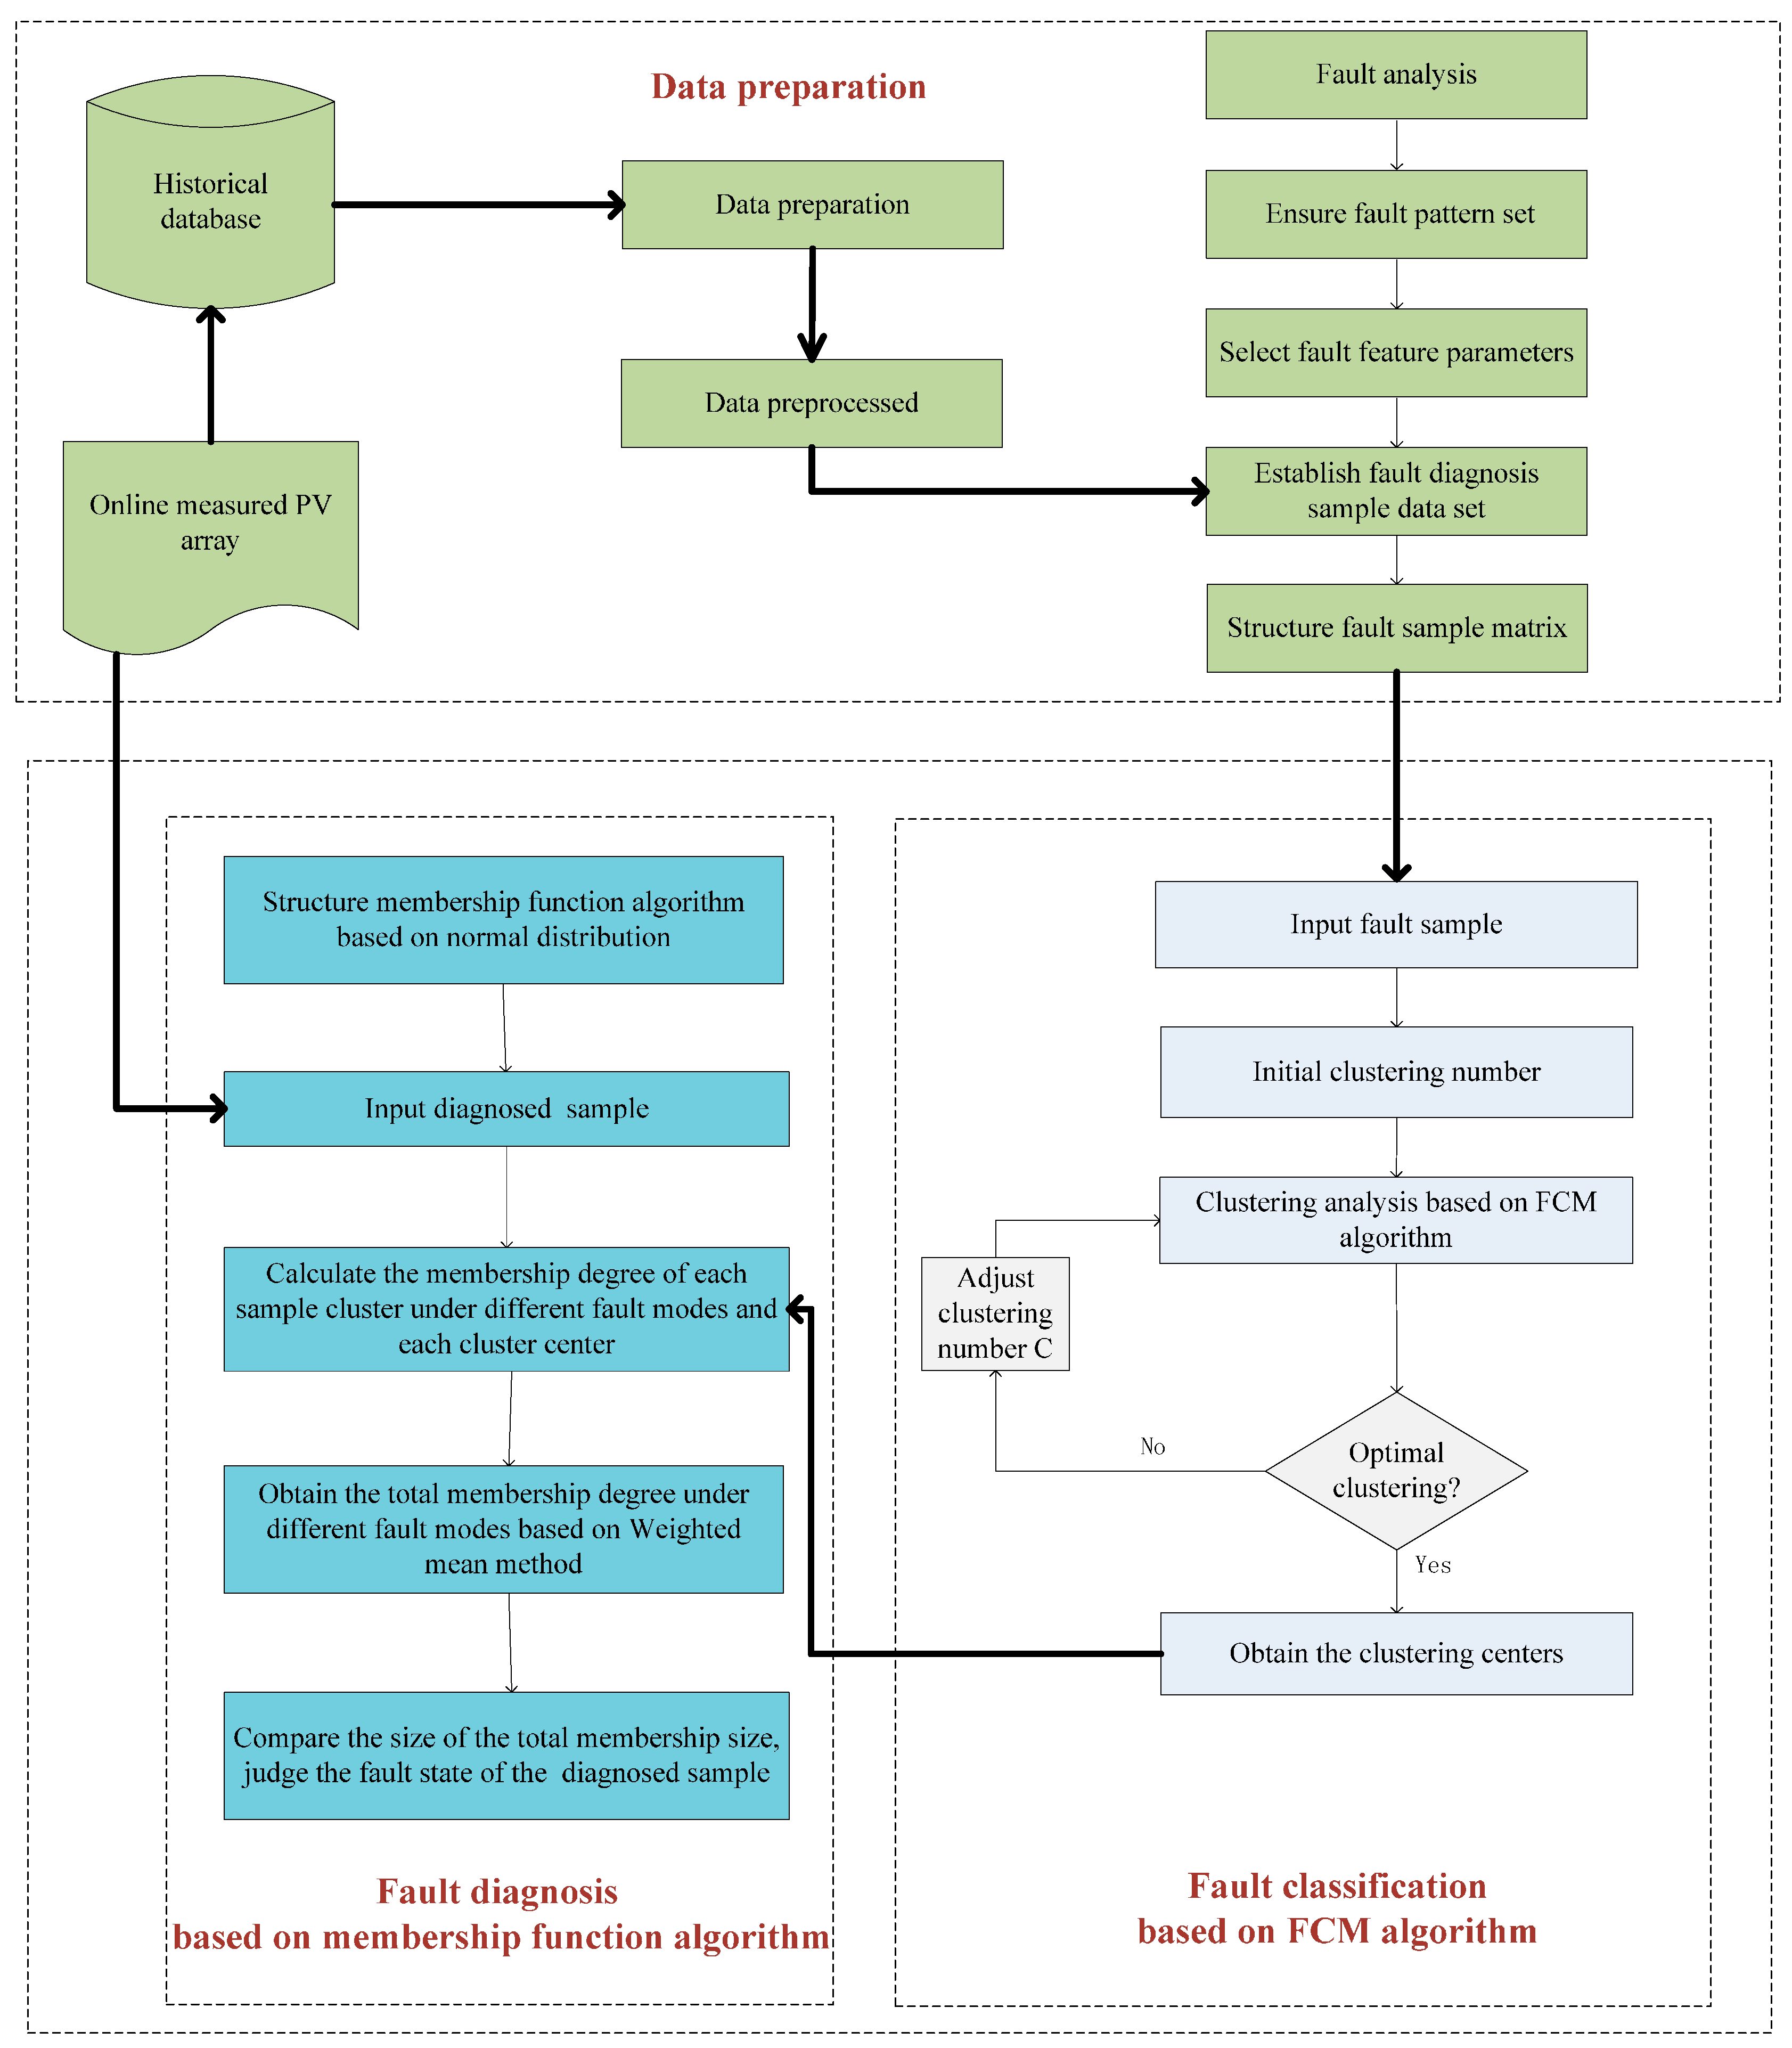
3.3. Fault Diagnosis Based on FCM Algorithm and Fuzzy Membership Algorithm

The relationship between the fault category and the fault eigenvectors is established to improve robustness of the fault diagnosis methods based on the FCM algorithm, considering the randomness and uncertainty of the fault eigenvectors. The fuzzy membership algorithm (membership function based on fuzzy normal distribution) is a distance algorithm. It is used to quantize fuzzy sets to diagnose fault samples. By measuring the membership degree between fault samples and each fault mode, the fault diagnosis is finished by fuzzy membership algorithms.
The purpose of this study, as stated above, was to establish a novel PV array fault diagnosis technique based on the FCM clustering and fuzzy membership algorithms. The proposed method effectively exploits the advantages of FCM (excellent classification ability) as well as the membership function algorithm (excellent distance computing ability), improving the proposed method’s accuracy. Firstly, the FCM clustering algorithm is used to conduct clustering analysis of PV array fault samples and give the cluster centers of various fault states. Then, the fuzzy membership function is designed and used to carry out the fault diagnosis of PV array. Figure 6 shows the fault diagnosis framework of a PV array.
Step 1: Several fault feature parameters are selected through fault analysis, and fault samples are collected under various fault modes based on simulated (or measured) data, structure fault sample matrix. The fault sample sets are obtained. Meanwhile, the clustering number is also obtained by the types of the faults through fault analysis, which is set as the input parameter of the FCM algorithm.
Step 2: The FCM clustering algorithm is used to classify the selected fault samples. The optimal cluster centers of various fault states are obtained by adjusting clustering number C and the fault data sets are clustered under different fault types based on the FCM algorithm, which means that the fault classification is complete. The data classification process based on FCM algorithm is that the FCM classifies the existing fault data into several classes, comparable with established the number of fault types, known as cluster centers. In the process, the changes of the fault characteristics caused the changes of clustering center. When the new data was input, we can adjust some parameters of the FCM algorithm to obtain the new clustering center based on the process shown in Figure 6.
Step 3: The membership function algorithm based on fuzzy normal distribution is used to diagnose the faults using operation data, then calculate the degree of membership according to the cluster centers obtained by step 2. By transforming the fuzzy membership function into the distance function, it quantize the faults, calculate the membership degree of fault samples between each fault mode and each cluster center to complete the diagnosis, then the total membership degree of each failure mode is calculated via weighted mean method.
Step 4: The total membership degrees under various fault modes are sorted, then the largest membership degree is selected as the fault state of the diagnosed sample. The fault diagnosis is complete.

4. Simulation Study

4.1. Formation of Fault Sample Data Sets

To simulate fault characteristics in different light intensities and temperatures in a typical PV system, an 3 × 13 PV array simulation model was built in MATLAB/Simulink (R2015b) as shown in Figure 7.
The irradiance of the model was set to range from 900 W/m2 and 1000 W/m2 and the temperature from 25 °C and 45 °C to simulate six different fault modes of the PV module; each fault mode’s value of Uoc, Isc, Um, Im, Pm was obtained accordingly. Fault data samples under various fault modes were collected through multiple cycles of simulation. In each fault mode, 15 sample data points were randomly collected under different irradiation intensities to make a total of 90 data samples across six fault modes constituting fault sample matrix X:
X = { x 1 , , x 2 , , x 90 }

4.2. FCM Algorithm Cluster Analysis
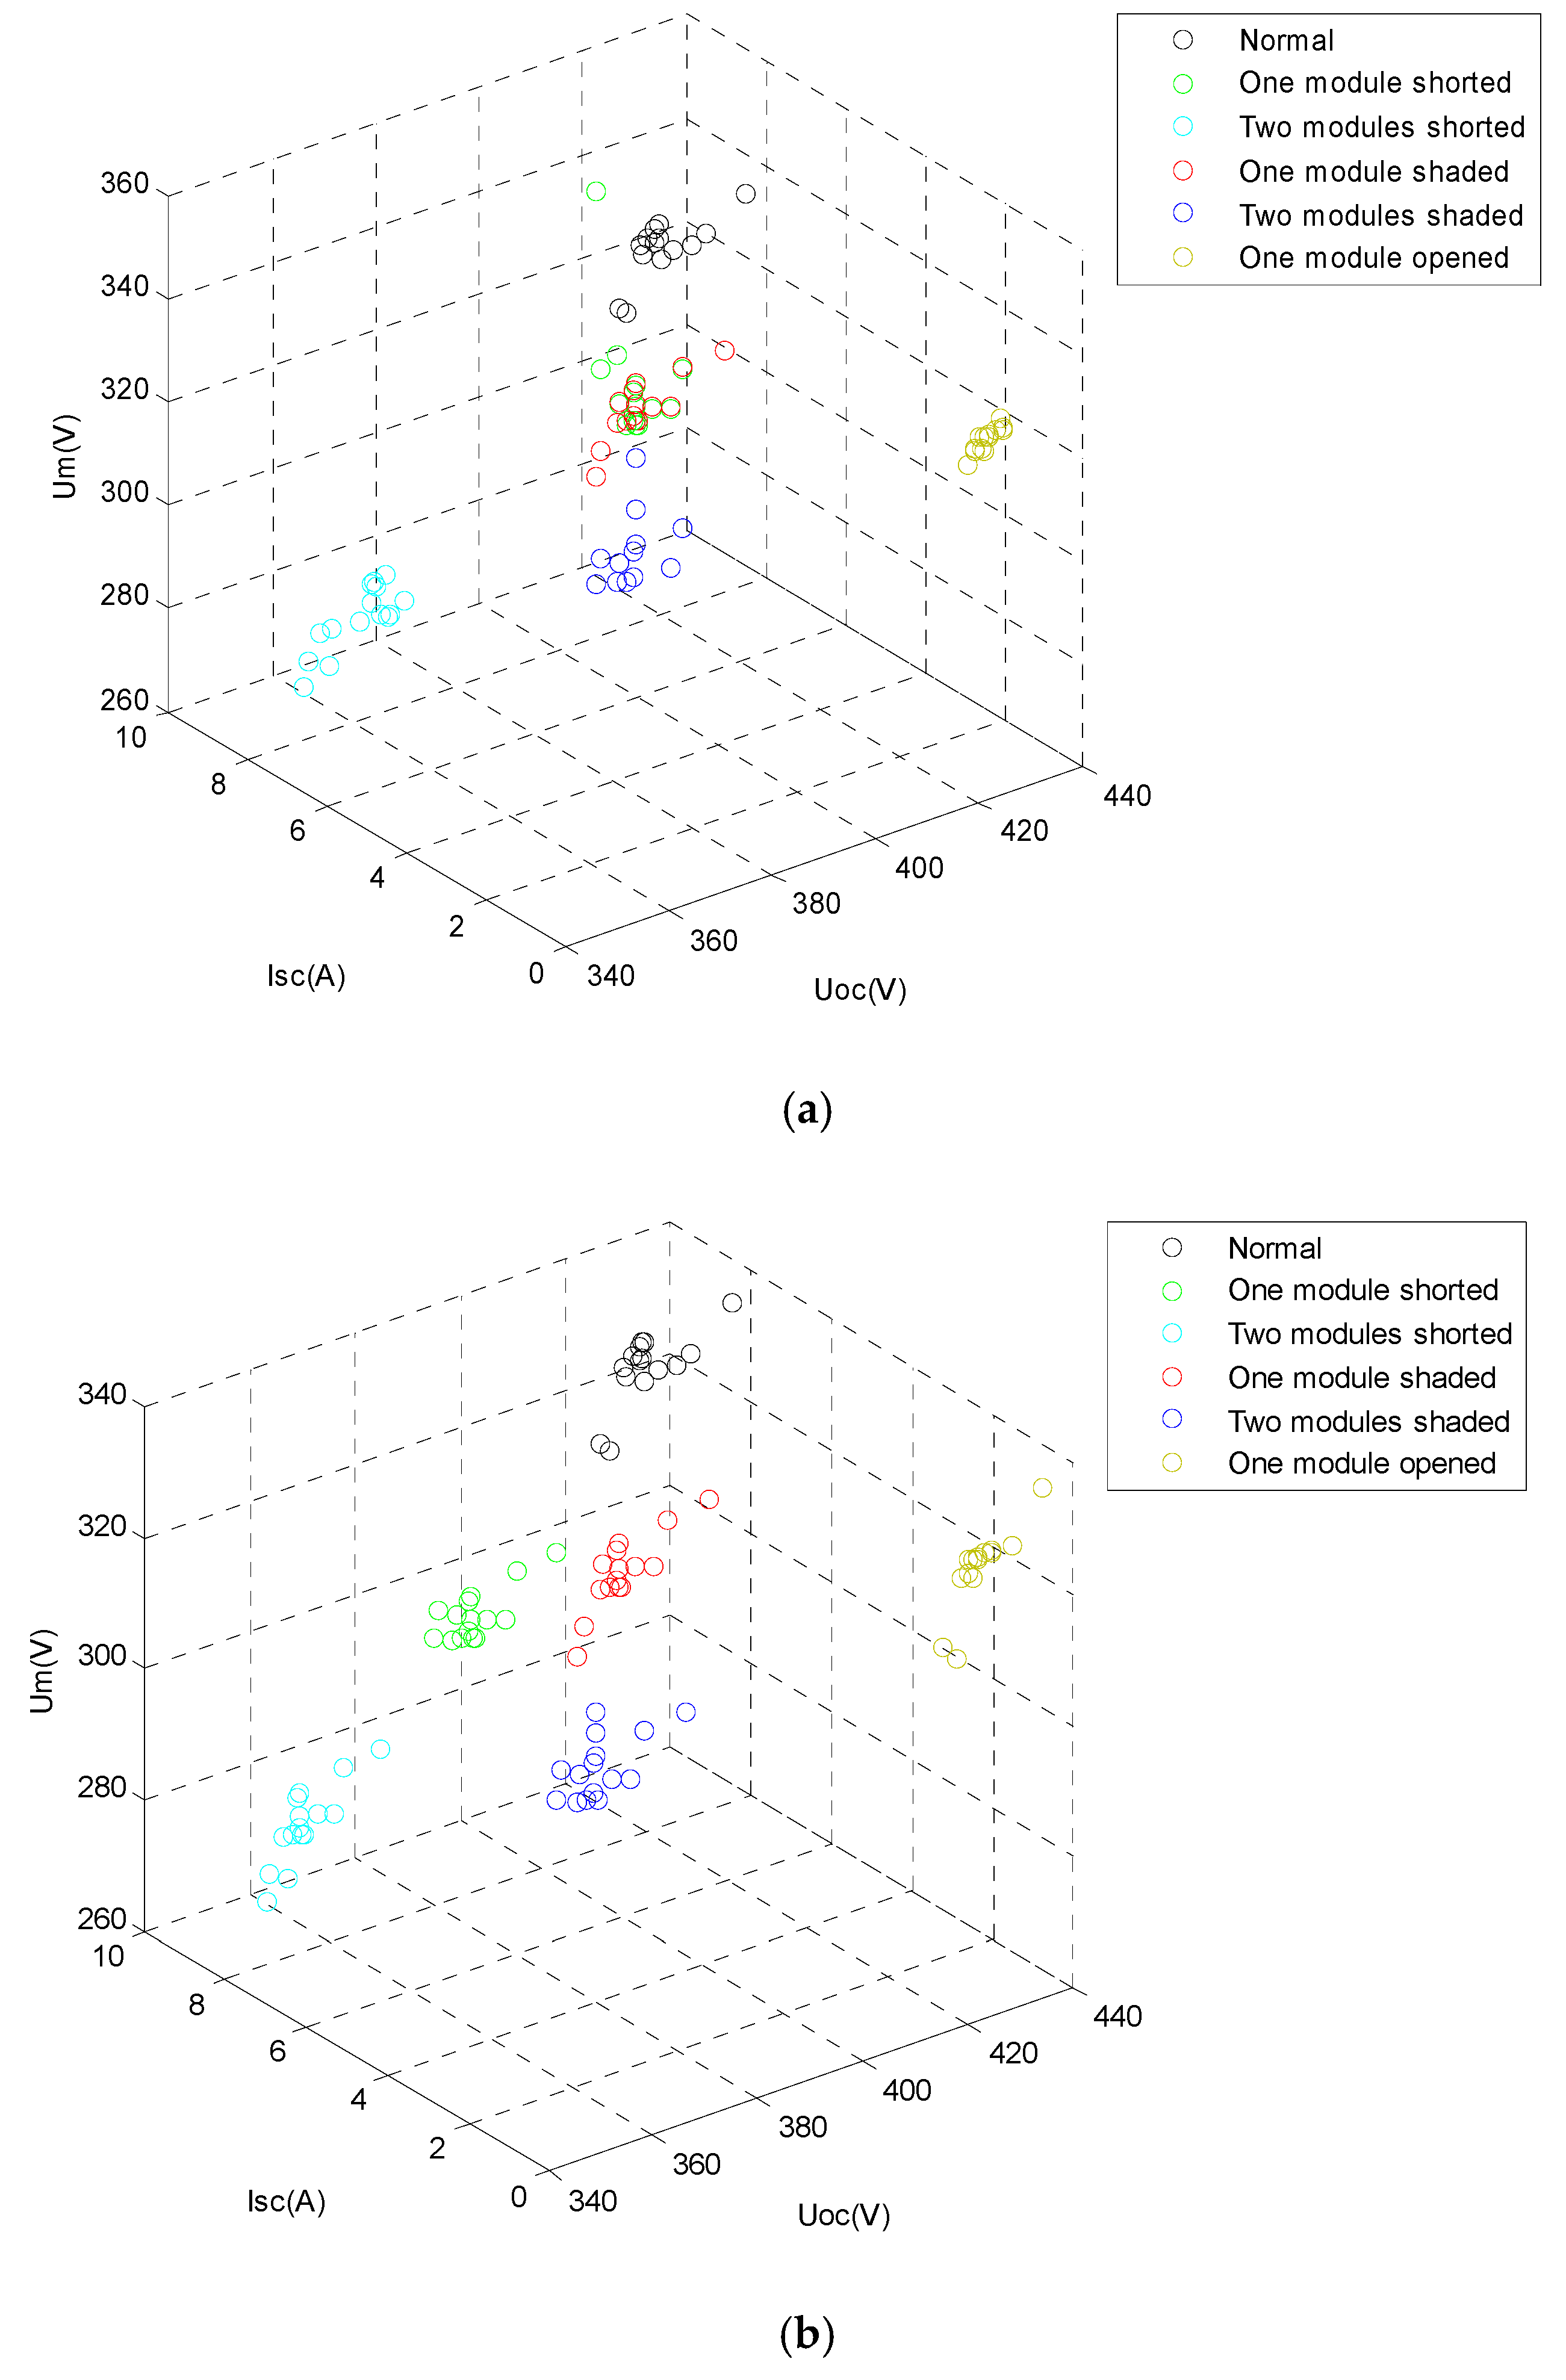
The selection of clustering number C for the FCM algorithm is very important. Generally, C is significantly smaller than the total number of cluster samples, and clustering number C > 1. Through the analysis of Section 2.2, PV array is taken as basic fault diagnosis units, and fault is classified into six classes: a one module short circuit, two module short circuit, local shadow shading in one string group, local shadow shading in two string groups, and one module open circuit. The number of fault types equals to clustering number C of FCM algorithm. So the parameters of the FCM algorithm (Equations (3) and (4)) include clustering number C = 6, weighted exponent m = 2, maximum iteration number L = 1000, and stopping iteration threshold ε = 10−5. The cluster centers of six fault modes were obtained using the FCM function as shown in Table 3. Each cluster center is the typical value of each fault mode and can be plugged into the fault dictionary of the PV array diagnostic system.
The cluster center rules under different fault modes were quantified as shown in Table 4 according to the initial diagnosis and cluster centers of six fault modes in the PV array system (Table 3).
Five rules correspond to the results in Table 4 in comparison against the normal operation state.
(1)
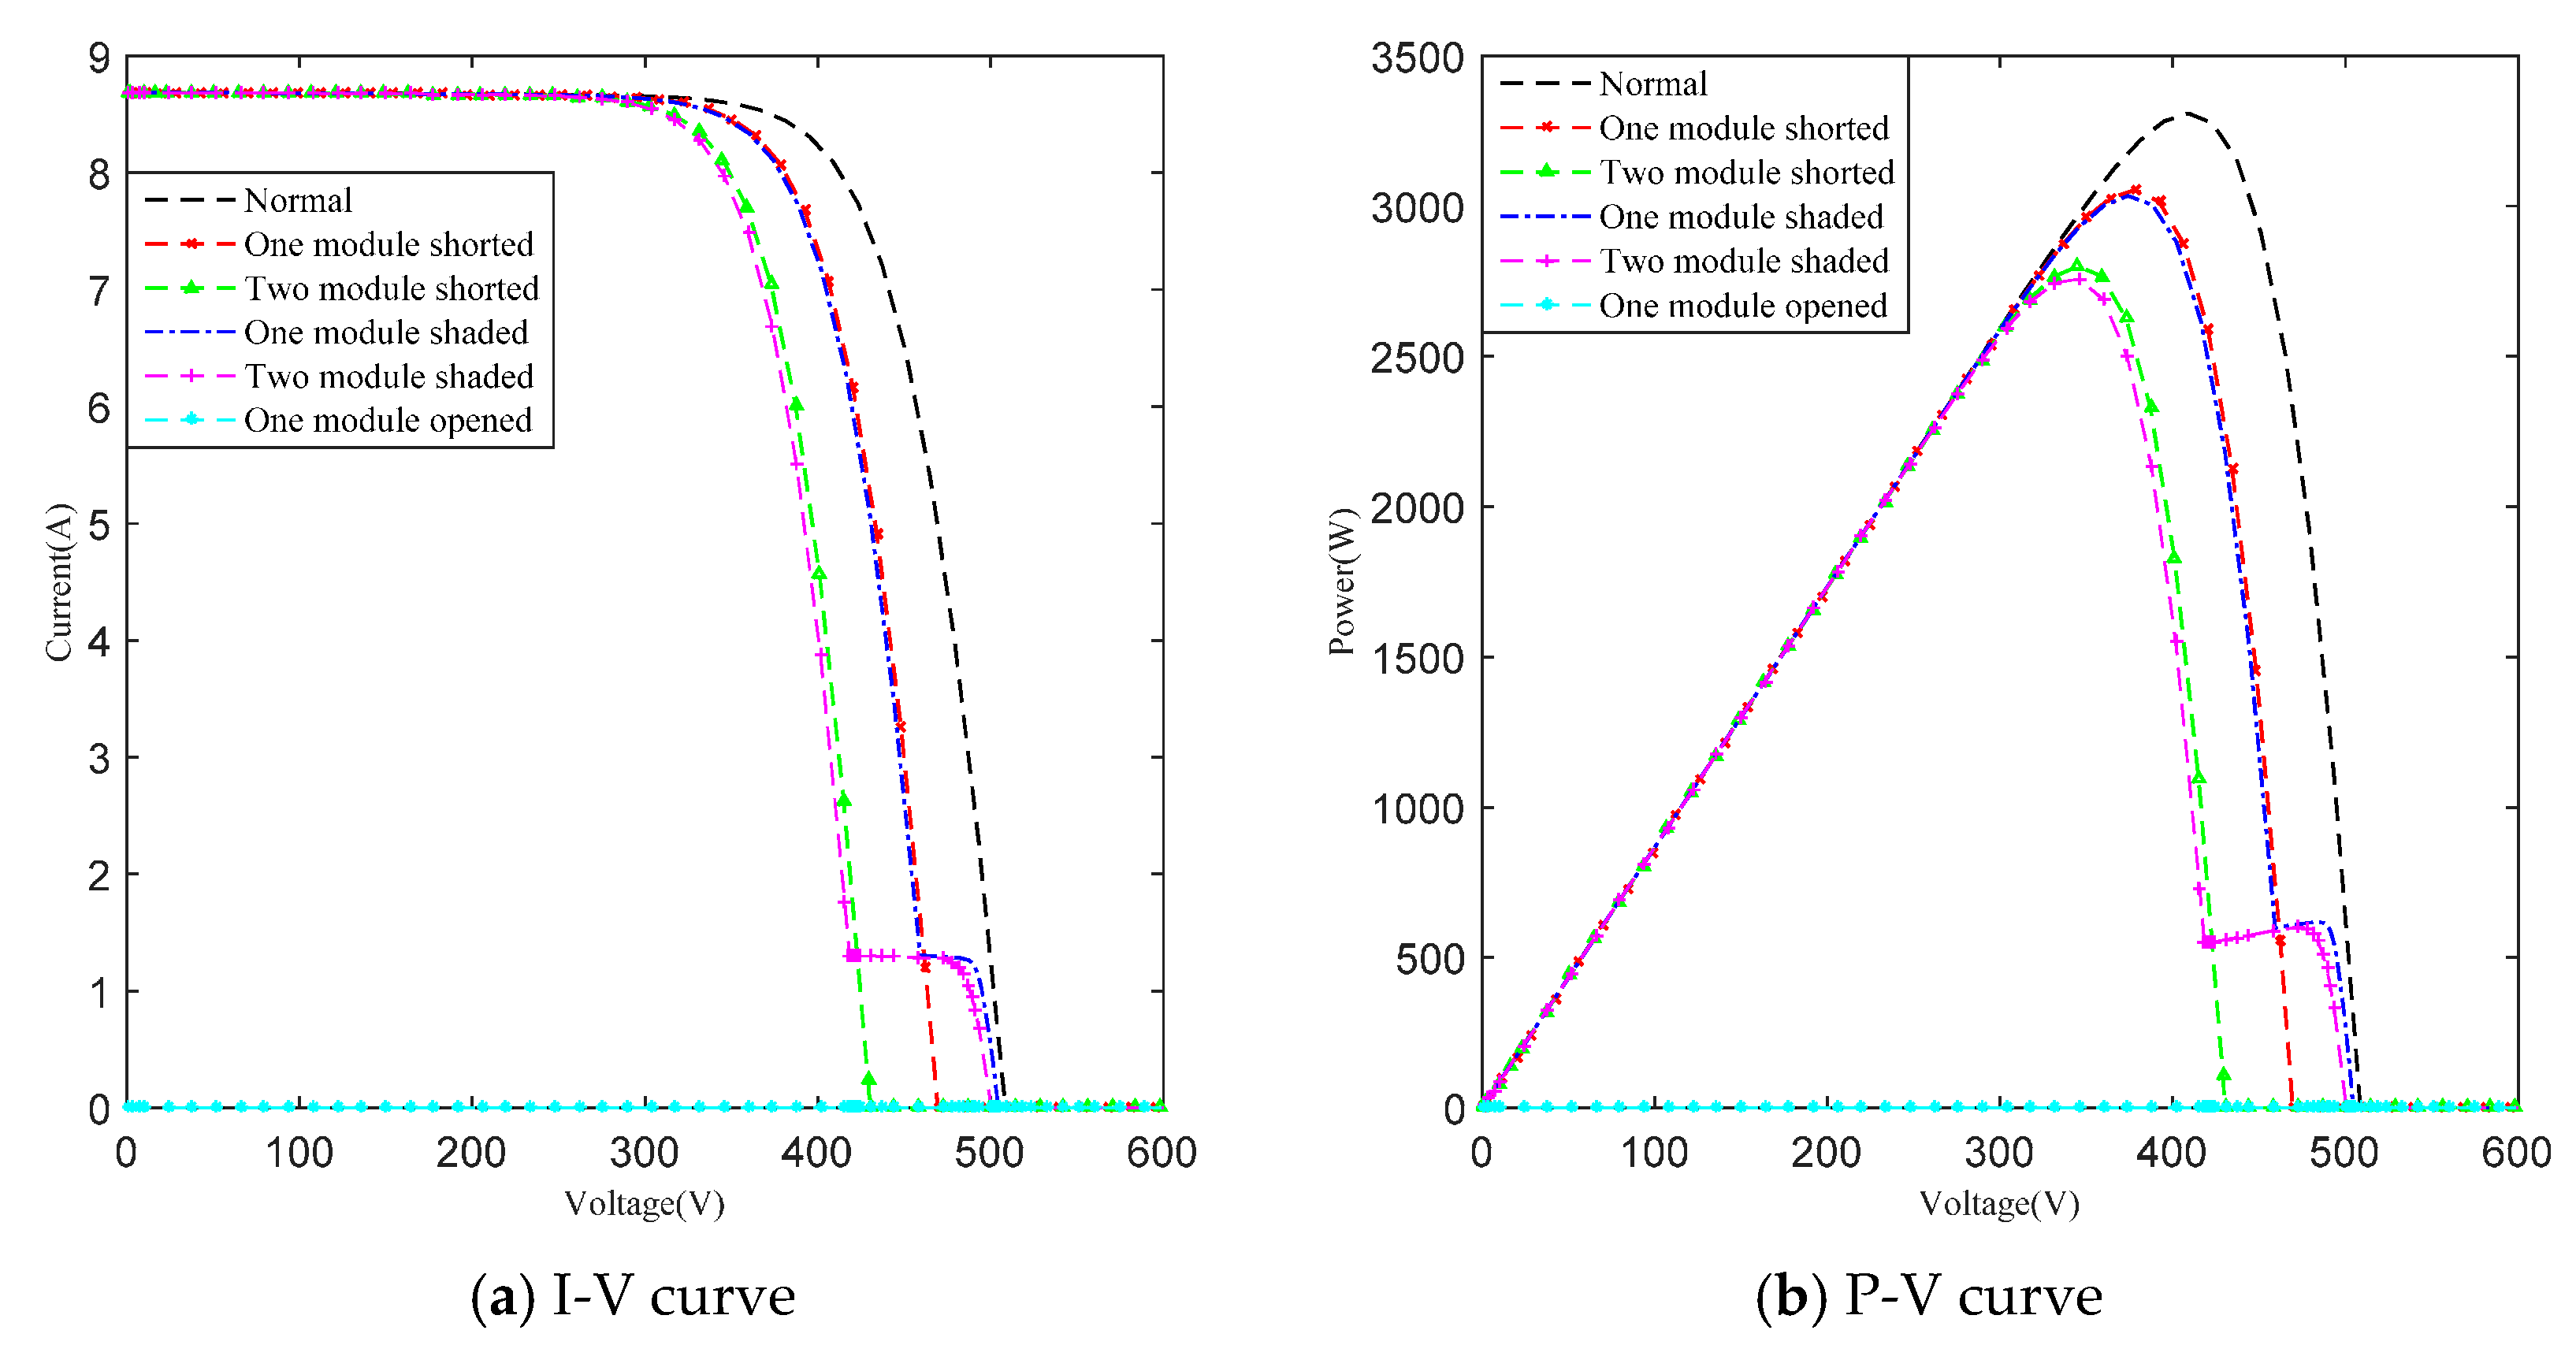
When the open-circuit voltage drops about 32 V, the maximum-power-point voltage drops about 28 V and the maximum power drops 185 W. This is diagnosed as F2, i.e., one module short-circuit fault.
(2)
When the open-circuit voltage drops about 65 V, the maximum-power-point voltage drops about 52 V and the maximum power drops 380 W. This is diagnosed as F3, i.e., two modules short-circuit fault.
(3)
When the open-circuit voltage drops about 4 V, the maximum-power-point voltage drops about 30 V and the maximum power drops 200 W; this is an F4, or one module shaded fault.
(4)
When the open-circuit voltage drops about 9 V, the maximum-power-point voltage drops about 58 V and the maximum power drops 420 W; this is an F5, or two modules shaded fault.
(5)
When all the characteristic parameters are zero the fault is an F6, or one module opened fault.

4.3. Fault Diagnosis Using Fuzzy Membership Algorithm

The cluster centers of the PV array diagnosis system (Table 3) can be combined with the fuzzy membership function algorithm to calculate the membership degree between fault diagnosed samples and their cluster centers for complete fault diagnosis of the PV array. As mentioned above, the larger the membership degree, the more likely the diagnosis sample is to belong to the given fault state.
To apply the membership function algorithm based on fuzzy normal distribution to the PV array fault diagnosis, select a sample randomly and obtain the diagnosed parameters: Uoc = 361.0858 V, Isc = 7.7779 A, Um = 281.8601 V, Im = 7.0669 A, Pm = 1987.7488 W. According to the deviation theory σ2 introduced in Section 2.2, calculate the standard deviation of five fault characteristic parameters, then set up the membership function of the open-circuit voltage (Uoc), the short-circuit current (Isc), the maximum-power-point voltage (Um), the maximum-power-point current(Im), and maximum power (Pm):
{ μ ( U ) = e ( U μ U ) 2 693.7701 × 100 % μ ( I s c ) = e ( I s c μ I sc ) 2 0.3716 × 100 % μ ( U m ) = e ( U m μ U m ) 2 633.7355 × 100 % μ ( I m ) = e ( I m μ I m ) 2 0.3639 × 100 % μ ( P m ) = e ( P m μ P m ) 2 112202.4769 × 100 %
Plug the parameters of the measured sample into Formula (10) to obtain the membership degree of fault samples between each fault mode and each cluster center as shown in Table 5. The extent to which PV power impacts each characteristic parameter is the same; the weighted total membership degree in the last column of Table 5 is the average value of Uoc, Isc, Um, Im, Pm.
Once the total membership degrees are sorted (Table 5), select the largest membership degree as the fault state of the diagnosed sample. As shown in the last column of Table 5, μF3 > μF5 > μF4 > μF2 > μF1 > μF6. Within the total membership degree sorting results, F4 two modules shorted fault comprises the largest proportion—that is, the diagnosed samples in the F4 fault state are consistent with the preset fault type, indicating that the proposed fault diagnosis method is effective and accurate.
Next, the selected range of the sample irradiance was expanded to 700 W/m2 and 1000 W/m2 and 150 fault samples of the PV array were selected based on the proposed method. Only six fault samples showed diagnostic errors out of the 150 sample. During actual diagnosis, some fault types are easily misjudged which may cause some errors, due to the similarity of faults types. The error analysis of fault samples is shown in Table 6. The diagnostic accuracy was 96%, effective, indicating that the proposed method is also highly feasible.
To verify the adaptability of the proposed method when a new fault was coming, a new fault named F7 which six PV modules are shaded in one string is addressed. With a perfect scalability of FCM algorithm, and the clustering number C is changed to 7, new cluster center is obtained, and the faults types are identified by comparing the membership degree based on the fuzzy membership function algorithm. Seven faults are re-simulated based on simulated PV array model established in this paper, 175 fault samples of the PV array were selected based on the proposed method. And the diagnostic accuracy was 96.6%. The result shows that the proposed method has a good scalability and adaptability.

4.4. Comparison of Algorithm Performance

4.4.1. Comparison of Classification Algorithms

K-Means algorithm is popular as one of hard C-means (HCM) clustering algorithms. When the data set and clustering number are given, K-Mean classifies the data into different clustering domain iteratively according to specific distance function, and its membership degree can only be 0 or 1. FCM algorithm is the improvement of HCM algorithm and extends HCM algorithm to a fuzzy case, its membership degree can be any value in the [0, 1] interval. FCM algorithm is more suitable for extraction of the fault feature and classification of the fault data in the course of PV array fault diagnosis.
In order to verify the performance of FCM algorithm, K-Means algorithm and FCM algorithm are used for the classification of 6 types fault described in Table 1. Fifteen samples are given for each fault, and the total number of fault samples is 90.
The clustering result of different algorithm is shown in Figure 8, which describes six fault states of PV array fault modes. Figure 8a shows that there are mixings between different clustering result, and the clustering result of K-Means is not ideal. While Figure 8a shows the FCM clustering algorithm can divide the data into six groups, and six types of fault data are aggregated in cluster center. For PV array’s fault data classification, compared with the K-Means algorithm, the FCM algorithm can cluster and classify the fault data accurately and effectively.
Table 7 shows the comparison of different algorithms by wrong classified number, running time and accuracy. The running time of FCM algorithm is larger than the K-Means algorithm in, but the clustering accuracy of FCM algorithm is much higher than the K-Means algorithm, which indicates that the FCM algorithm has a better clustering performance.

4.4.2. Comparison of Diagnostic Algorithms

As a typical intelligent-based fault diagnosis method, the BP neural network is widely applied in the field of fault diagnosis, but its fault detection is mainly determined by its parameter setting and the training data. In order to verify the performance of the proposed diagnostic method, the diagnostic performance is compared between the BP neural network methods. The 90 fault samples describing six typical fault types are selected for the training of BP neural network and the proposed method. 24 typical fault data samples are selected for the testing of different method. The results are shown in Table 8. According to Table 8, the proposed method in this paper has one diagnosis error, and the BP neural network diagnosis method has three diagnostic errors. The contrast analysis shows that the proposed algorithm is more accurate the BP-based method. The reason for the low accuracy of BP neural network diagnosis method is that the general neural network needs a large amount of fault samples for the training process, but the sparsity of the fault samples in actual operation data leads to the limitation of the neural network diagnosis method.

4.5. Dynamic Attribute of the Algorithm

To illustrate the adaptability of the proposed method when transient faults come, a transient fault is set up in PV array 1 based on the simulation model showed in Figure 6. The introduced transient fault is a shadow fault occurs in PV array 1 within a period of time and other time is normal in a day. The simulation conditions are described as Figure 9.
Table 9 shows the dynamic adaptability and diagnosis results of the proposed method for transient fault. According to Figure 9, there are five status modes for different PV arrays: PV array 1 before the failure, PV array 1 in the failure, PV array 1 after the failure, PV array 2 and PV array 3. These modes are marked M1, M2, M3, M4 and M5, and the diagnosis results are shown in Table 9. Table 9 shows that the proposed method can identify the unknown transient faults effectively, and the faults can be classified according to the feature distribution of faults.

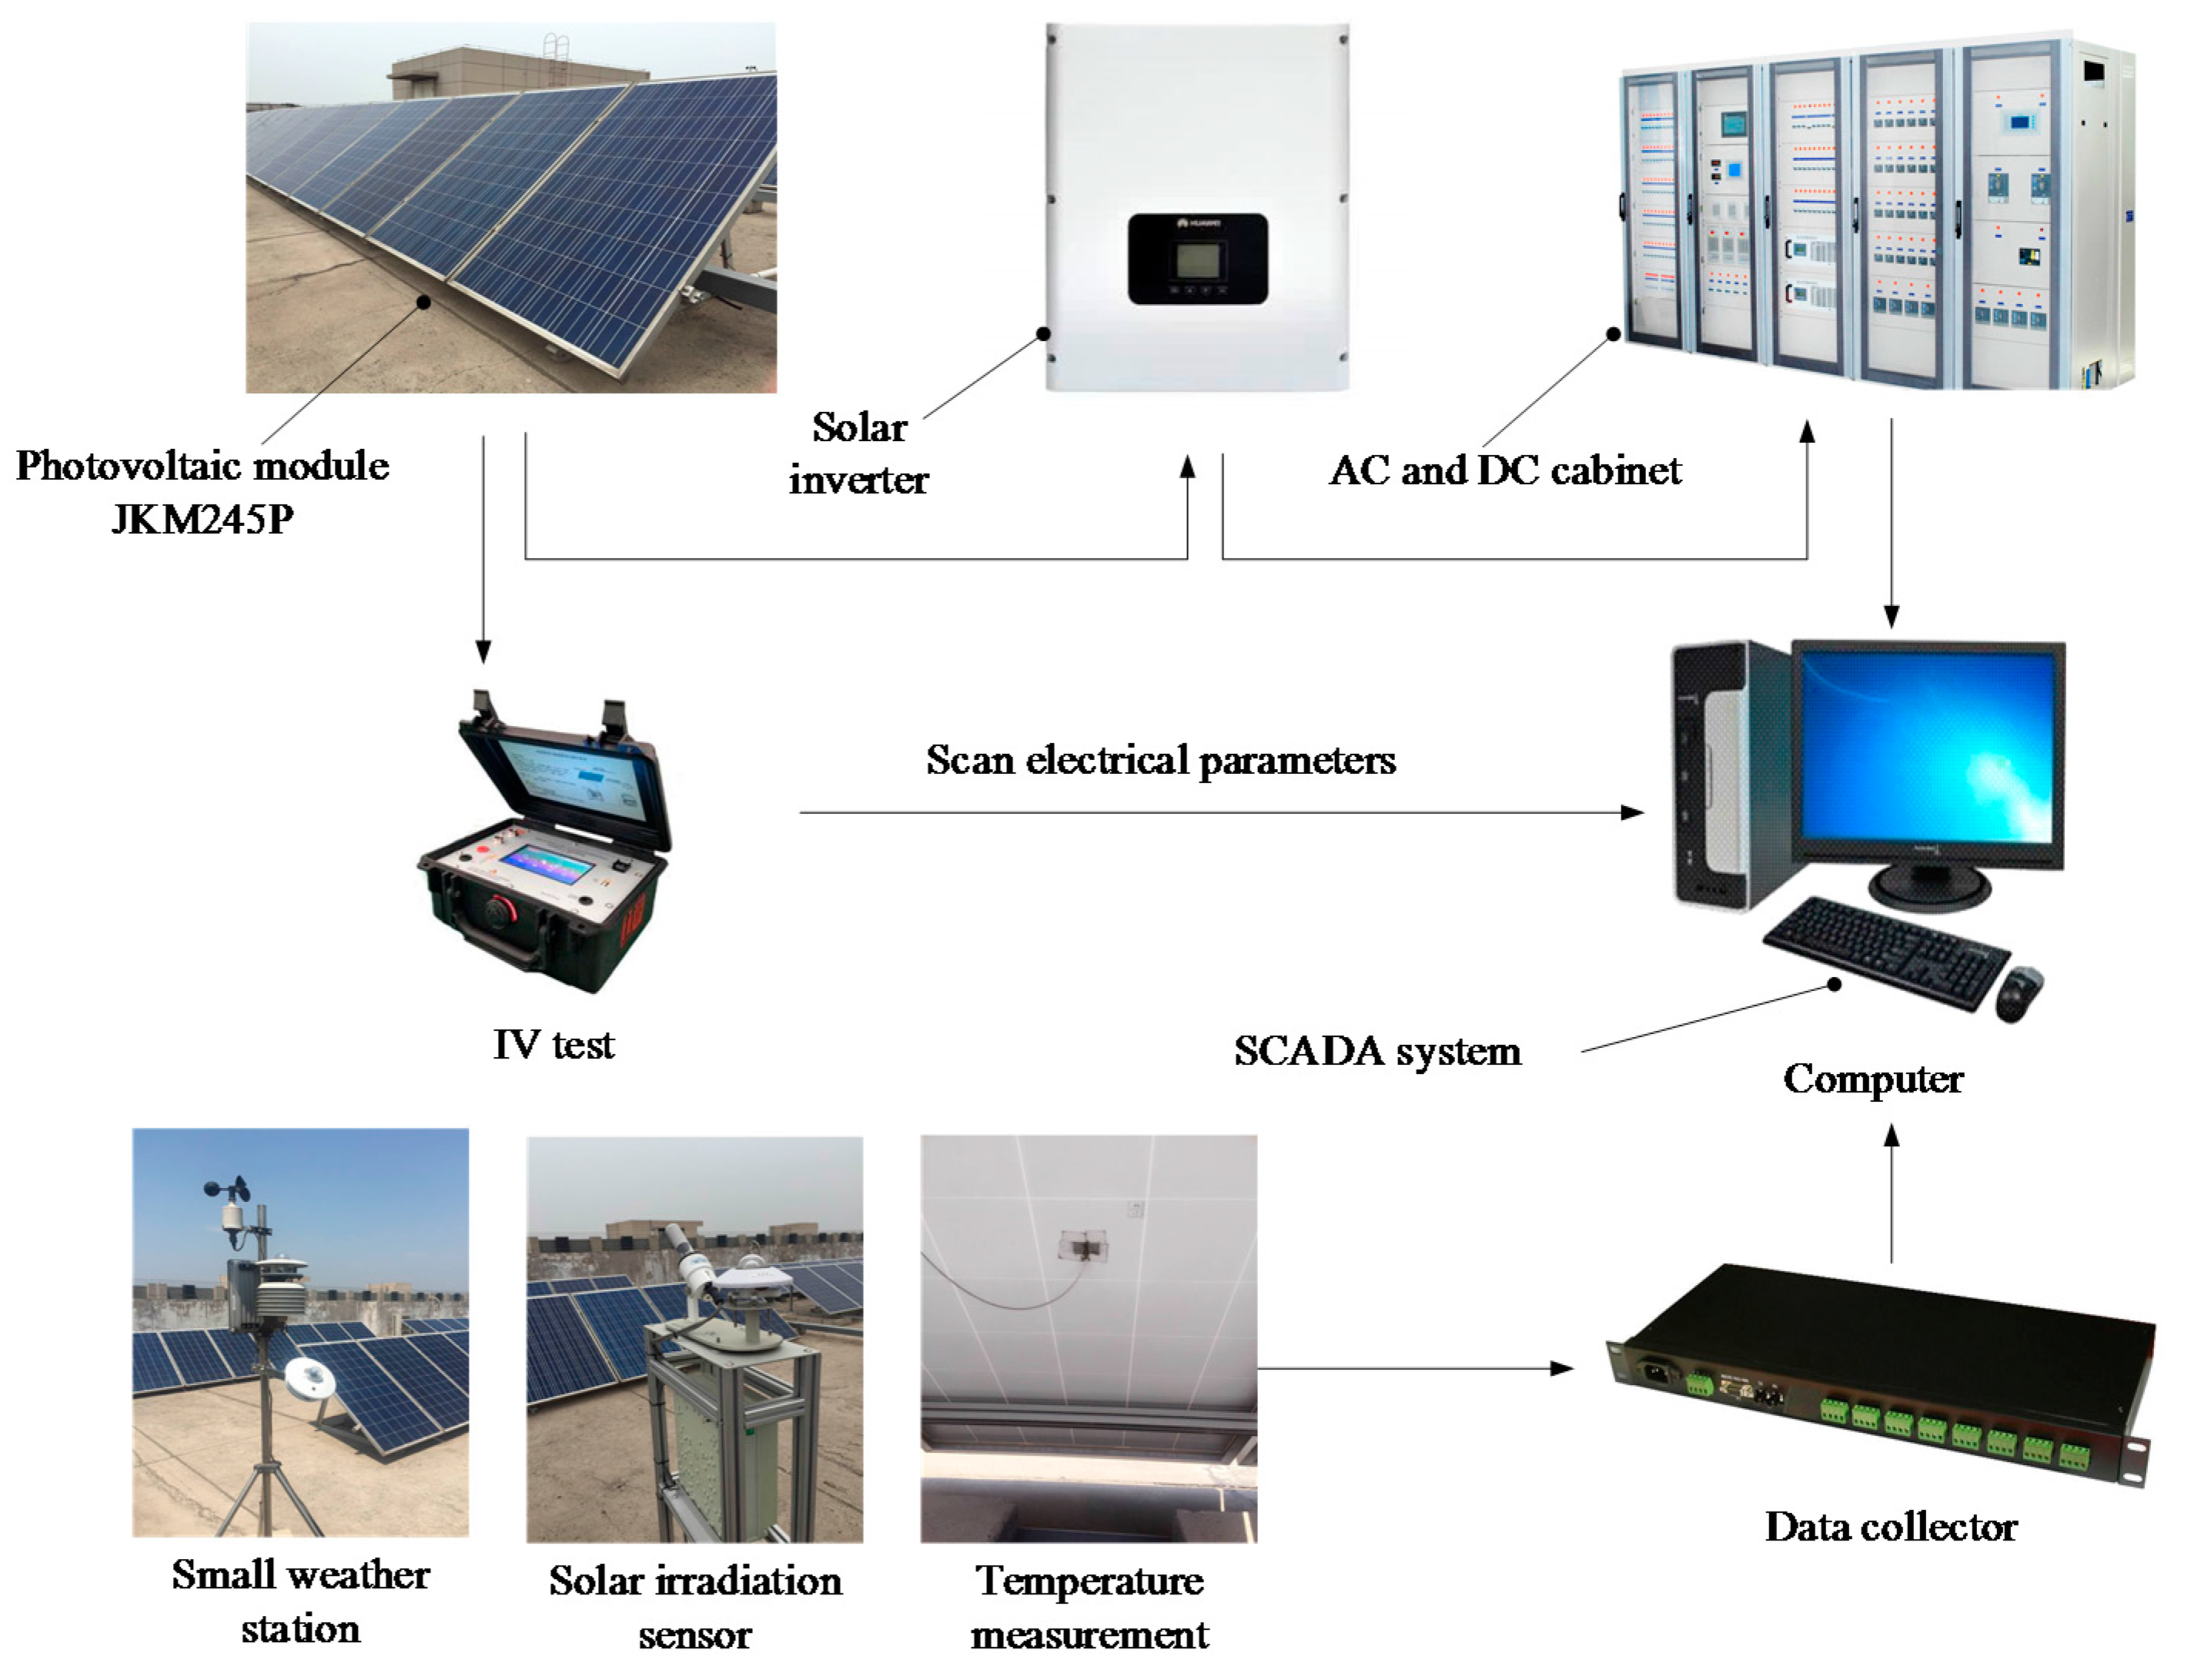
5. Experiment Analysis

To verify the correctness and effectiveness of the proposed method, experiments were carried out under short circuit, open circuit, and partial occlusion conditions. The fault conditions of each data sample cover a wide range of work irradiances and temperatures. First, some labeled data samples under different fault conditions were collected on an experimental platform. Then, tests and analyses were carried out based on the proposed diagnosis method.

5.1. Experimental Description

In order to verify the correctness and effectiveness of the proposed diagnosis method in this paper under different environmental conditions, an empirical test platform for PV power generation is constructed. Figure 10 illustrates the system structure of the empirical test platform. The platform installed capacity is 9.555 kWp. Thirty nine PV modules are used and the electrical parameters are shown in Table 10. In order to better analyze the influence of external environment on the PV power generation and performance, the experimental platform includes a high-precision irradiator for measuring solar irradiance, a small weather station for measuring the external environmental parameters such as global solar irradiance, temperature, wind speed, a temperature sensor for measuring the operating temperature, a data collector for measuring the current and voltage, an I-V scanner, etc., then those data are stored in the computer through a Supervisory Control And Data Acquisition (SCADA) system, which can collect multiple operating parameters of PV plant such as the PV power generation, the current of AC and DC sides and the voltage of AC and DC sides. Table 10 illustrates the specific parameters of the experimental platform. Different tests under short circuit, open circuit, and partial shading conditions were run on an empirical platform.

5.2. Experimental Data Acquisition

Five PV array faults (normal, one module shorted, two modules shorted, one module shaded, and two modules shaded) were tested (Table 11) based on the PV array experimental platform. 200 data samples were collected. The description of the selected data was shown in Table 12.

5.3. Experimental Result Analysis

Five typical fault data samples were selected from the five fault modes mentioned above as shown in Table 13. The diagnosis results obtained via the proposed method are shown in Table 14.
Again, a larger membership degree indicates a greater likelihood that the diagnosis sample is in the given fault state. As shown in Table 14, the five diagnosed samples fell into F1, F2, F3, F4, and F5 states, once more indicating that the proposed method yields correct results.

6. Conclusions

This paper proposed a novel PV array fault diagnosis method based on the FCM and fuzzy membership algorithms. The proposed method effectively detects short circuit, open circuit, partial occlusion, and other faults. Simulation analysis indicated that the diagnostic accuracy of the proposed method was 96%. Field experiments further verified the correctness and effectiveness of the proposed method, and the method can complete the PV array diagnosis. The innovations of this paper can be summarized as follows:
(1)
The FCM algorithm described the distribution characteristics of fault data effectively based on small amounts of fault samples data, and avoided the difficult for obtaining the fault samples.
(2)
By using the membership function of vague math as the fault diagnosis function, it quantized the membership degree between fault samples and each fault mode, and described the degree of similarity between fault samples and each fault mode clearly and objectively.
(3)
The proposed method effectively exploits the advantages of FCM (excellent classification ability) as well as the membership function algorithm (excellent distance computing ability). And the proposed method didn’t need additional equipment support, concerned people can detect the fault module quickly by measuring voltage, current, power and other parameters.
(4)
The distribution characteristics of the FCM cluster centers reflected the fault characteristics, and the distribution characteristics can be used for updating membership function.
(5)
The clustering centers obtained by the FCM algorithm can be used as the typical value of each fault state, and then fault characteristic database can be established. Based on the fault characteristic database, combined with other intelligent methods, it will be much easier to develop new ideas for the PV array fault diagnosis.

Acknowledgments

The authors would like to acknowledge the Fundamental Research Funds for the Central Universities “2016MS52, 2016MS31” and the Research Funds from State Grid Corporation of China “SGHE0000KXJS1700074”.

Author Contributions

All authors contributed to this work by collaboration. Qiang Zhao is the first author in this manuscript. All authors revised and approved for the publication.

Conflicts of Interest

The authors declare no conflict of interest.

References

  1. Zhang, X.; Gao, D.; Liu, H.; Ye, J.; Wang, S. A novel method for multi-sensor fault detection and positioning of photovoltaic array. Renew. Energy Resour. 2016, 34, 166–172. [Google Scholar]
  2. Stellbogen, D. Use of PV circuit simulation for fault detection in PV array fields. In Proceedings of the 23th Photovoltaic Specialists Conference, Louisville, KY, USA, 6 August 2002; pp. 1302–1307. [Google Scholar]
  3. Chuang, W.; Chen, C.; Yen, J.; Hsu, Y. Using MPCA of spectra model for fault detection in a hot strip mill. J. Mater. Process. Technol. 2009, 209, 4162–4168. [Google Scholar] [CrossRef]
  4. Karatepe, E.; Boztepe, M.; Colak, M. Development of a suitable model for characterizing PV arrays with shaded solar cells. Sol. Energy 2007, 81, 977–992. [Google Scholar] [CrossRef]
  5. Noguchi, T.; Togashi, S. Short-current pulse-based Maximum-power-point tracking method for multiple PV-and-converter module system. IEEE Trans. Ind. Electron. 2002, 49, 217–223. [Google Scholar] [CrossRef]
  6. Chowdhury, S.R.; Saha, H. Maximum power point tracking of partially shaded solar PV arrays. Sol. Energy Mater. Sol. Cells 2010, 94, 1441–1447. [Google Scholar] [CrossRef]
  7. Miyatake, M.; Inada, T.; Hiratsuka, I.; Zhao, H.; Otsuka, H.; Nakano, M. Control characteristics of a fibonacci-search-based maximum power point tracker when a PV array is partially shaded. In Proceedings of the 4th International Power Electronics and Motion Control Conference, Xi’an, China, 14–16 August 2004; pp. 816–821. [Google Scholar]
  8. Wang, X.; Wang, S.; Du, H.; Wang, P. Fault Diagnosis of Chemical Industry Process Based on FRS and SVM. Control Decis. 2015, 353–356. [Google Scholar] [CrossRef]
  9. Zhong, D. Research on Fault Detection of PV Array Based on Composite Data Fusion; Tianjin University: Tianjin, China, 2010. [Google Scholar]
  10. Cheng, Z.; Zhong, D.; Li, B.; Liu, Y. Research on fault detection of PV array based on data fusion and fuzzy mathematics. In Proceedings of the 2011 Asia-Pacific Power and Energy Engineering Conference, Wuhan, China, 25–28 March 2011; pp. 1–4. [Google Scholar]
  11. Chao, K.H.; Ho, S.H.; Wang, M.H. Modeling and fault diagnosis of a PV system. Electr. Power Syst. Res. 2008, 78, 97–105. [Google Scholar] [CrossRef]
  12. Xu, R.; Chen, H.; Hu, Y.; Sun, X. Fault Location of Photovoltaic Array Based on Gaussian Process. Trans. China Electrotech. Soc. 2013, 28, 249–256. [Google Scholar]
  13. Zhao, Y.; Yang, L.; Lehman, B.; de Palma, J.-F.; Mosesian, J.; Lyons, R. Decision tree-based fault detection and classification in solar PV arrays. In Proceedings of the 2012 27th Annual IEEE Applied Power Electronics Conference and Exposition, Orlando, FL, USA, 5–9 February 2012; pp. 93–99. [Google Scholar]
  14. Li, Z.; Wang, Y.; Zhou, D.; Wu, C. An Intelligent Method for Fault Diagnosis in Photovoltaic Array. In System Simulation and Scientific Computing; Springer: Berlin/Heidelberg, Germany, 2012; pp. 10–16. [Google Scholar]
  15. Wang, Y.; Wu, C.; Fu, L.; Zhou, D.; Li, Z. Fault diagnosis of PV array based on BP neural network. Power Syst. Prot. Control 2013, 41, 108–114. [Google Scholar]
  16. Zhang, X.; Zhou, J.; Huang, Z.; Li, C.; He, H. Vibrant Fault Diagnosis for Hydro-turbine Generating Unit Based on Rough sets and Multi-class Support Vector Machine. Proc. CSEE 2010, 30, 88–93. [Google Scholar]
  17. Han, S.; Zhu, J.; Mao, J.; Zhan, W. Fault Diagnosis of Transformer Based on Particle Swarm optimization-Based Support Vector Machine. Electr. Meas. Instrum. 2014, 11, 509–513. [Google Scholar]
  18. Dong, S.; Xu, X.; Chen, R. Application of fuzzy C-means method and classification model of optimized K-nearest neighbor for fault diagnosis of bearing. J. Braz. Soc. Mech. Sci. Eng. 2015, 38, 1–9. [Google Scholar] [CrossRef]
  19. Hu, Y.; Deng, Y.; He, X. A Summary on PV Array Fault Diagnosis Method. Power Electron. 2013, 3, 21–23. [Google Scholar]
  20. Krishnapuram, R.; Keller, J.M. A possibilistic approach to clustering. IEEE Trans. Fuzzy Syst. 2002, 1, 98–110. [Google Scholar] [CrossRef]
  21. Du, W.; Lie, X.; LV, F. Research on Transformer Fault Diagnosis Based on Fuzzy Clustering Algorithm. Transformer 2009, 46, 65–69. [Google Scholar]
  22. Li, J.; Qi, J.; Hu, J.; Peng, Y. Similarity Measurement Method Based on Membership Function and Its Application. Appl. Res. Comput. 2010, 27, 891–893. [Google Scholar]
  23. Hariharan, R.; Chakkarapani, M.; Ilango, G.S.; Nagamani, C. A Method to Detect Photovoltaic Array Faults and Partial Shading in PV Systems. IEEE J. Photovol. 2016, 6, 1278–1285. [Google Scholar] [CrossRef]
  24. Zhou, L.; Wang, G.; Jie, G. Simulation Research on Photovoltaic Cells, Modules, and Arrays Model. Ship Electr. Technol. 2011, 31, 25–29. [Google Scholar]
  25. Wang, Z.T.; Zhao, N.B.; Wang, W.Y.; Tang, R.; Li, S.Y. A Fault Diagnosis Approach for Gas Turbine Exhaust Gas Temperature Based on Fuzzy C-Means Clustering and Support Vector Machine. Math. Probl. Eng. 2015, 1–11. [Google Scholar] [CrossRef]
  26. Wu, J.; Cai, Z.; Hu, C.; Cao, J. Status Evaluation of Protection Relays Based on The Membership Function in Fuzzy Normal Distribution. Power Syst. Prot. Control 2012, 40, 48–52. [Google Scholar]
  27. Liu, X.; Liu, X.; Wang, M. The Determination of Membership Function and Use. Comput. Knowl. Technol. 2010, 6, 8831–8832. [Google Scholar]
  28. Huang, L.; Hou, J.; Luo, L. Soft Fault Diagnosis of Analog Circuits with Tolerance Based on Fuzzy C-means Clustering Algorithm and Membership Algorithm. Signal Process. 2011, 27, 624–628. [Google Scholar]
Figure 1. Simulated faults in laboratory PV array.
Energies 11 00238 g001
Figure 2. Output characteristic curves of PV array under different fault conditions, (a) I-V curve under different fault conditions; (b) P-V curve under different fault conditions.
Energies 11 00238 g002
Figure 3. PV array electrical parameters change under different fault conditions, (a) Change in the electrical parameter Uoc under different fault conditions; (b) Change in the electrical parameter Isc under different fault conditions; (c) Change in the electrical parameter Um under different fault conditions; (d) Change in the electrical parameter Im under different fault conditions; (e) Change in the electrical parameter Pm under different fault conditions.
Energies 11 00238 g003
Figure 4. FCM flow chart.
Energies 11 00238 g004
Figure 5. The curve of Normal Distribution Membership Function.
Energies 11 00238 g005
Figure 6. Framework of proposed fault diagnosis technique.
Energies 11 00238 g006
Figure 7. Simulated PV array model.
Energies 11 00238 g007
Figure 8. Comparison of clustering results, (a) Clustering analysis results of six fault states based on K-Means algorithm; (b) Clustering analysis results of six fault states based on FCM algorithm.
Energies 11 00238 g008
Figure 9. The simulation of transient fault.
Energies 11 00238 g009
Figure 10. Outdoor experimental PV module platform.
Energies 11 00238 g010
Table 1. PV array fault features.
Fault TypesDescriptionsElectrical Characteristics
F1Normal
F2One module shortedCurrent normal, voltage decreases
F3Two modules shortedCurrent normal, voltage decreases
F4One module shadedCurrent normal, voltage decreases
F5Two modules shadedCurrent normal, voltage decreases
F6One module openedNo current, no voltage
Table 2. Selected fault characteristic parameters.
Fault ParametersNameDescriptions
UocOpen-circuit voltage of the arrayShort-circuit fault caused the decline of Um, Uoc.
IscShort-circuit current of the array
UmMaximum power-point voltage of the arrayOpen-circuit fault caused the decline of Isc, Im.
ImMaximum power-point current of the array
PmMaximum power of the arrayShadow fault caused the decline of Um, Im
Table 3. Clustering results of typical faults.
Fault TypesUoc/VIsc/AUm/VIm/APm/W
F1 Normal426.40717.8172333.47517.08202357.7497
F2 One module shorted393.58927.8174305.96127.12912176.4355
F3 Two modules shorted360.79377.8170281.52607.10091995.3092
F4 One module shaded422.04717.8168303.54067.12752159.3655
F5 Two modules shaded417.71417.8159276.32807.11161959.9594
F6 One module opened00000
Table 4. Cluster center rules under different fault modes.
RulesInput (Electrical Characteristic Parameters)Fault Mode
F1F2F3F4F5F6
R1ΔUoc ≈ 32 V,010000
ΔUm ≈ 28 V,
ΔPm ≈ 185 W,
R2ΔUoc ≈ 65 V,001000
ΔUm ≈ 52 V,
ΔPm ≈ 380 W,
R3ΔUoc ≈ 4 V,000100
ΔUm ≈ 30 V,
ΔPm ≈ 200 W,
R4ΔUoc ≈ 9 V,000010
ΔUm ≈ 58 V,
ΔPm ≈ 420 W,
R5All the characteristic parameters are zero000001
Table 5. Membership degree between fault sample and each cluster center.
Fault TypesUoc MembershipIsc MembershipUm MembershipIm MembershipPm MembershipTotal Membership
F14.55 × 10−60.9916880.0002230.9987510.0871400.415561
F20.0475680.9916030.1599100.9789200.5301400.541628
F30.9997540.9917700.9996480.9936500.9989820.996761
F42.22 × 10−50.9918730.2268650.9800150.5915650.558068
F59.66 × 10−50.9922340.9079350.9890780.9863290.775134
F65.8 × 10−1643.9 × 10−1421.3 × 10−1096.3 × 10−1202.59 × 10−315.18 × 10⁻³²
Table 6. Error analysis of fault samples.
Obtained Class12500000100.00%
16.67%0.00%0.00%0.00%0.00%0.00%0.00%
2024020092.31%
0.00%16.00%0.00%1.33%0.00%0.00%7.69%
3002402092.31%
0.00%0.00%16.00%0.00%1.33%0.00%7.69%
4010230095.83%
0.00%0.67%0.00%15.33%0.00%0.00%4.17%
5001023095.83%
0.00%0.00%0.67%0.00%15.33%0.00%4.17%
60000025100.00%
0.00%0.00%0.00%0.00%0.00%16.67%0.00%
100.00%96.00%96.00%92.00%92.00%100.00%96.00%
0.00%4.00%4.00%8.00%8.00%0.00%4.00%
123456
Actual Class
Table 6 gives the misdiagnosis rate of the fault samples. Among them, the correct number of diagnosed samples is marked with green, the wrong number of diagnosed samples is marked with orange, the misdiagnosis rate of each sample is marked with gray, and the misdiagnosis rate of all samples is marked with blue.
Table 7. The experimental comparison results of K-Means algorithm and FCM algorithm.
Clustering MethodsWrong Clustering NumberRunning Time/sAccuracy/%
K-Means150.12800183.3
FCM80.4674491.1
Table 8. The comparison results of different fault diagnosis methods for testing samples.
Group NumberF1 MembershipF2 MembershipF3 MembershipF4 MembershipF5 MembershipF6 MembershipProposed MethodBP Neural NetworkActual Results
10.99790.91080.72590.93110.79032.7 × 10−11F1F1F1
20.98670.89750.71720.92090.78334.8 × 10−11F1F1F1
30.99060.93810.75770.95230.81612.3 × 10−11F1F1F1
40.99310.88790.69470.90840.76386.4 × 10−12F1F1F1
50.89380.99780.91670.97170.90674.1 × 10−10F2F2F2
60.89130.99870.92410.97510.91696.7 × 10−10F2F2F2
70.87460.98820.92670.96520.91731.4 × 10−9F2F2F2
80.84860.95700.90110.93650.89362.9 × 10−9F2F1F2
90.71380.91620.99930.86430.91319.9 × 10−9F3F3F3
100.70780.91020.99890.85930.91491.4 × 10−8F3F3F3
110.68630.88700.98640.83710.90142.8 × 10−8F3F3F3
120.65620.85050.95120.80160.86655.4 × 10−8F3F3F3
130.92400.97500.86350.99890.93095.4 × 10−10F4F4F4
140.91870.97240.86850.99900.93778.8 × 10−10F4F4F4
150.90040.98700.86860.96000.93661.8 × 10−9F2F2F4
160.86990.92360.83900.95330.90823.9 × 10−9F4F4F4
170.76830.89400.90810.91900.99592.0 × 10−8F5F5F5
180.79050.90720.91020.93460.99152.7 × 10−8F5F4F5
190.75030.87210.90070.89920.98965.2 × 10−8F5F5F5
200.72740.84270.87280.87200.96179.1 × 10−8F5F5F5
210.32690.39950.34370.36890.33180.6135F6F6F6
220.33870.39950.33200.37940.34090.6117F6F6F6
230.36570.36960.27110.39910.35290.6105F6F6F6
240.35720.36970.27880.39970.36160.6181F6F6F6
Table 9. The dynamic adaptability analysis of the algorithm.
The Results
M1 membership0.99790.68630.99060.98670.9931
M2 membership0.91080.98640.93810.89750.8879
M3 membership0.72590.8870.75770.71720.6947
M4 membership0.93110.83710.95230.92090.9084
M5 membership0.79030.90140.81610.78330.7638
Diagnostic resultsNormalShadedNormalNormalNormal
Table 10. The description of the experimental equipment.
NameModelDescription of Parameters
3 kW power station (3 × 13 serial-parallel module)JKM245PMaximum power: 254 Wp;
Optimal operating voltage (Vmp): 30.1 V;
Optimal operating current (Imp): 8.14 A;
Module efficiency: 14.97%;
Operating temperature range: −40~+85 °C;
Cell operating temperature: 45 ± 2 °C.
I-V scannerMP-11power measurement range: 10 W~18 kW;
Voltage measurement range: 10~1000 V;
Current measurement range: 100 mA~30 A.
Current and voltmeterPZ72Voltage measurement range: 0~1000 V;
Current measurement range: 0~10 A.
Backplane temperature sensorWRM-101Temperature range: −50~200 °C;
Measuring accuracy: ≤±0.2 °C.
Solar irradiance meterMS-80Irradiation measurement range:0~2000 W/m2;
Measuring accuracy: ≤±3%;
Operating temperature: −40 °C~80 °C.
Weather stationWS200Temperature, wind, humidity and total, direct, scattered radiation observation.
Table 11. Experiments description.
Fault TypesFault DescriptionsFault Pictures
F1 NormalNormal condition. Energies 11 00238 i001
F2 One module shorted
F3 Two modules shorted
The short-circuit fault is tested by short-circuiting some PV modules. Energies 11 00238 i002
F4 One module shaded
F5 Two modules shaded
The partial shading condition is tested by covering some PV modules with shield panels. Energies 11 00238 i003
F6 One module openedThe open-circuit fault is tested by open-circuiting some PV modules. Energies 11 00238 i004
Table 12. Experimental collection distribution.
NormalOne Module ShortedTwo Modules ShortedOne Module ShadedTwo Modules Shaded
Data number2040405050
Proportion (%)1020202525
Table 13. PV array fault diagnosis samples.
Group NumberUoc/VIsc/AUm/VIm/APm/WF1F2F3F4F5
1426.75667.7779333.88687.04762348.768010000
2393.91187.7779306.40417.09332168.067001000
3361.08587.7779281.86017.06691987.749000100
4422.39817.7776303.90817.09342151.173000010
5418.05837.7772276.86817.07321952.617000001
Table 14. Proposed method diagnosis results.
Group NumberF1F2F3F4F5
10.9965790.5343970.4168600.6955470.565517
20.5328410.9964780.5526090.8121290.541072
30.4155610.5416280.9967610.5580680.775134
40.6952570.8102630.5691310.9966750.708160
50.5725190.5261650.7778340.7006640.996326

