Article

Performance Recovery of Natural Draft Dry Cooling Systems by Combined Air Leading Strategies

Key Laboratory of Condition Monitoring and Control for Power Plant Equipment of Ministry of Education, School of Energy Power and Mechanical Engineering, North China Electric Power University, Beijing 102206, China
*
Author to whom correspondence should be addressed.
Energies 2017, 10(12), 2166; https://doi.org/10.3390/en10122166
Submission received: 9 November 2017 / Revised: 10 December 2017 / Accepted: 12 December 2017 / Published: 18 December 2017

Abstract

:
The cooling efficiency of natural draft dry cooling system (NDDCS) are vulnerable to ambient winds, so the implementation of measures against the wind effects is of great importance. This work presents the combined air leading strategies to recover the flow and heat transfer performances of NDDCS. Following the energy balance among the exhaust steam, circulating water, and cooling air, numerical models of natural draft dry cooling systems with the combined air leading strategies are developed. The cooling air streamlines, volume effectiveness, thermal efficiency and outlet water temperature for each cooling delta of the large-scale heat exchanger are obtained. The overall volume effectiveness, average outlet water temperature of NDDCS and steam turbine back pressure are calculated. The results show that with the air leading strategies inside or outside the dry-cooling tower, the thermo-flow performances of natural draft dry cooling system are improved under all wind conditions. The combined inner and outer air leading strategies are superior to other single strategy in the performance recovery, thus can be recommended for NDDCS in power generating units.

1. Introduction

With the excellent superiority in water saving, natural draft dry cooling systems (NDDCSs) have been widely adopted by power plants and seen rapid development in past decades [1]. Under windy conditions, the air-cooled heat exchanger under the tower shell will suffer severely from crosswinds, so wind leading strategies may contribute to strengthening the cooling performance of NDDCSs.
In the past decade, more studies on the flow and heat transfer performances of NDDCS under crosswind conditions have been carried out. Using wind tunnel tests and full-scale measurements, Wei et al. [2] concluded that the low efficiency of natural draft dry cooling systems basically results from the chaotic pressure distribution near the tower inlet, hot plume breaking and flow separation of the leading edge at the tower outlet. With the CFD method, Yang et al. [3] studied the wind effects and obtained the thermo-flow performances of air-cooled heat exchanger. Ma et al. [4] developed the cold end system, namely a coupled NDDCS and steam condenser model, so as to control the outlet water temperatures of NDDCS precisely versus various wind speeds and ambient temperatures. With specific experiments, Lu et al. [5] explored the crosswind effects on a small cylindrical natural draft dry cooling tower, pointing out the critical wind speed which incurs the most adverse thermo-flow performances. Zhao et al. [6,7] studied the inflow deviation angle of each sector under windy conditions, finding that the performance deterioration can be alleviated by air deflectors. Yang et al. [8] numerically disclosed the flow and heat transfer characteristics of NDDCS, indicating that the performances are most deteriorated at a critical wind speed, besides the hot plume even penetrates through the lateral or middle rear cooling deltas under high crosswinds.
For restraining the adverse impacts of crosswinds on natural draft dry cooling system, various measures are proposed. Goodarzi [9] investigated an alternative outlet structure of the dry-cooling tower to cripple the throttling effect, showing that the cooling efficiency of NDDCS is recovered by 9 % under a crosswind of 10 m/s. Moreover, Goodarzi [10,11] suggested the tower height change to reduce the wind load, and the elliptical dry-cooling tower reconstruction to improve the cooling efficiency. For the dry-cooling tower, Liao et al. [12] recommended a low ratio of height to diameter. Furthermore, Liao et al. [13] put forward a novel triangular layout of the large-scale air-cooled heat exchanger for regions with gale winds all year round. Kong et al. [14] proposed the bilaterally arranged cooling deltas under the tower shell, which raise the cooling efficiency of NDDCS significantly under crosswinds.
In addition to the above studies, the use of windbreakers to restrain the adverse wind effects has received great attention. Al-Waked et al. [15] introduced windbreak walls around the tower inlet, by which the thermal efficiency is improved by 15% and 35% under crosswinds of 10 and 20 m/s respectively. Goodarzi and Keimanesh [16,17] studied the radiator-type windbreakers and Savonius turbines installed at the lateral heat exchanger bundles normal to the incoming winds, which are superior to the solid windbreakers. Lu et al. [18,19,20] investigated windbreakers with tri-blade-like configuration installed at the small tower inlet to improve the heat capacity of cooling air. Zhao et al. [21] proposed the air deflectors installed circumferentially around the inlets of heat exchangers, which prove substantial benefits to cooling efficiency of NDDCS. Gu et al. [22] optimized various windbreak structures (cross wall, windbreak wall, cross line-screen and louvers) for dry-cooling tower. With the windbreak walls installed at the heat exchanger inlet, Ma et al. [23] pointed out that the windbreak wall angle should equal the inflow deviation angle without airflow separation. What’s more, the enclosure type of windbreakers around the heat exchanger was also suggested for NDDCS [24,25], by which not only the cooling performance is improved, but the wind momentum can also be used.
The above works place more emphases on the flow and heat transfer performances of NDDCS under crosswind conditions and various measures against unfavorable wind effects, including the tower shell modification, novel heat exchanger arrangement and windbreakers application. With respect to the windbreakers, the turbine back pressure change is still not clear. Furthermore, based on the energy balance among cooling air, circulating water and exhaust steam, the coupled iterative procedure can present the actual working status of NDDCS under ambient winds, which is however rarely involved in the current studies.
In our previous work [26], the thermo-flow performances of NDDCS coupled with condenser have been thoroughly investigated, and the concept of interior and exterior windbreakers is proposed. For better restraining the wind effects and achieving the energy-efficient operation of the power generating unit, various combined air leading strategies for NDDCS will be presented and optimized in this work, which may contribute to their industrial applications in future.

2. Modeling and Approaches
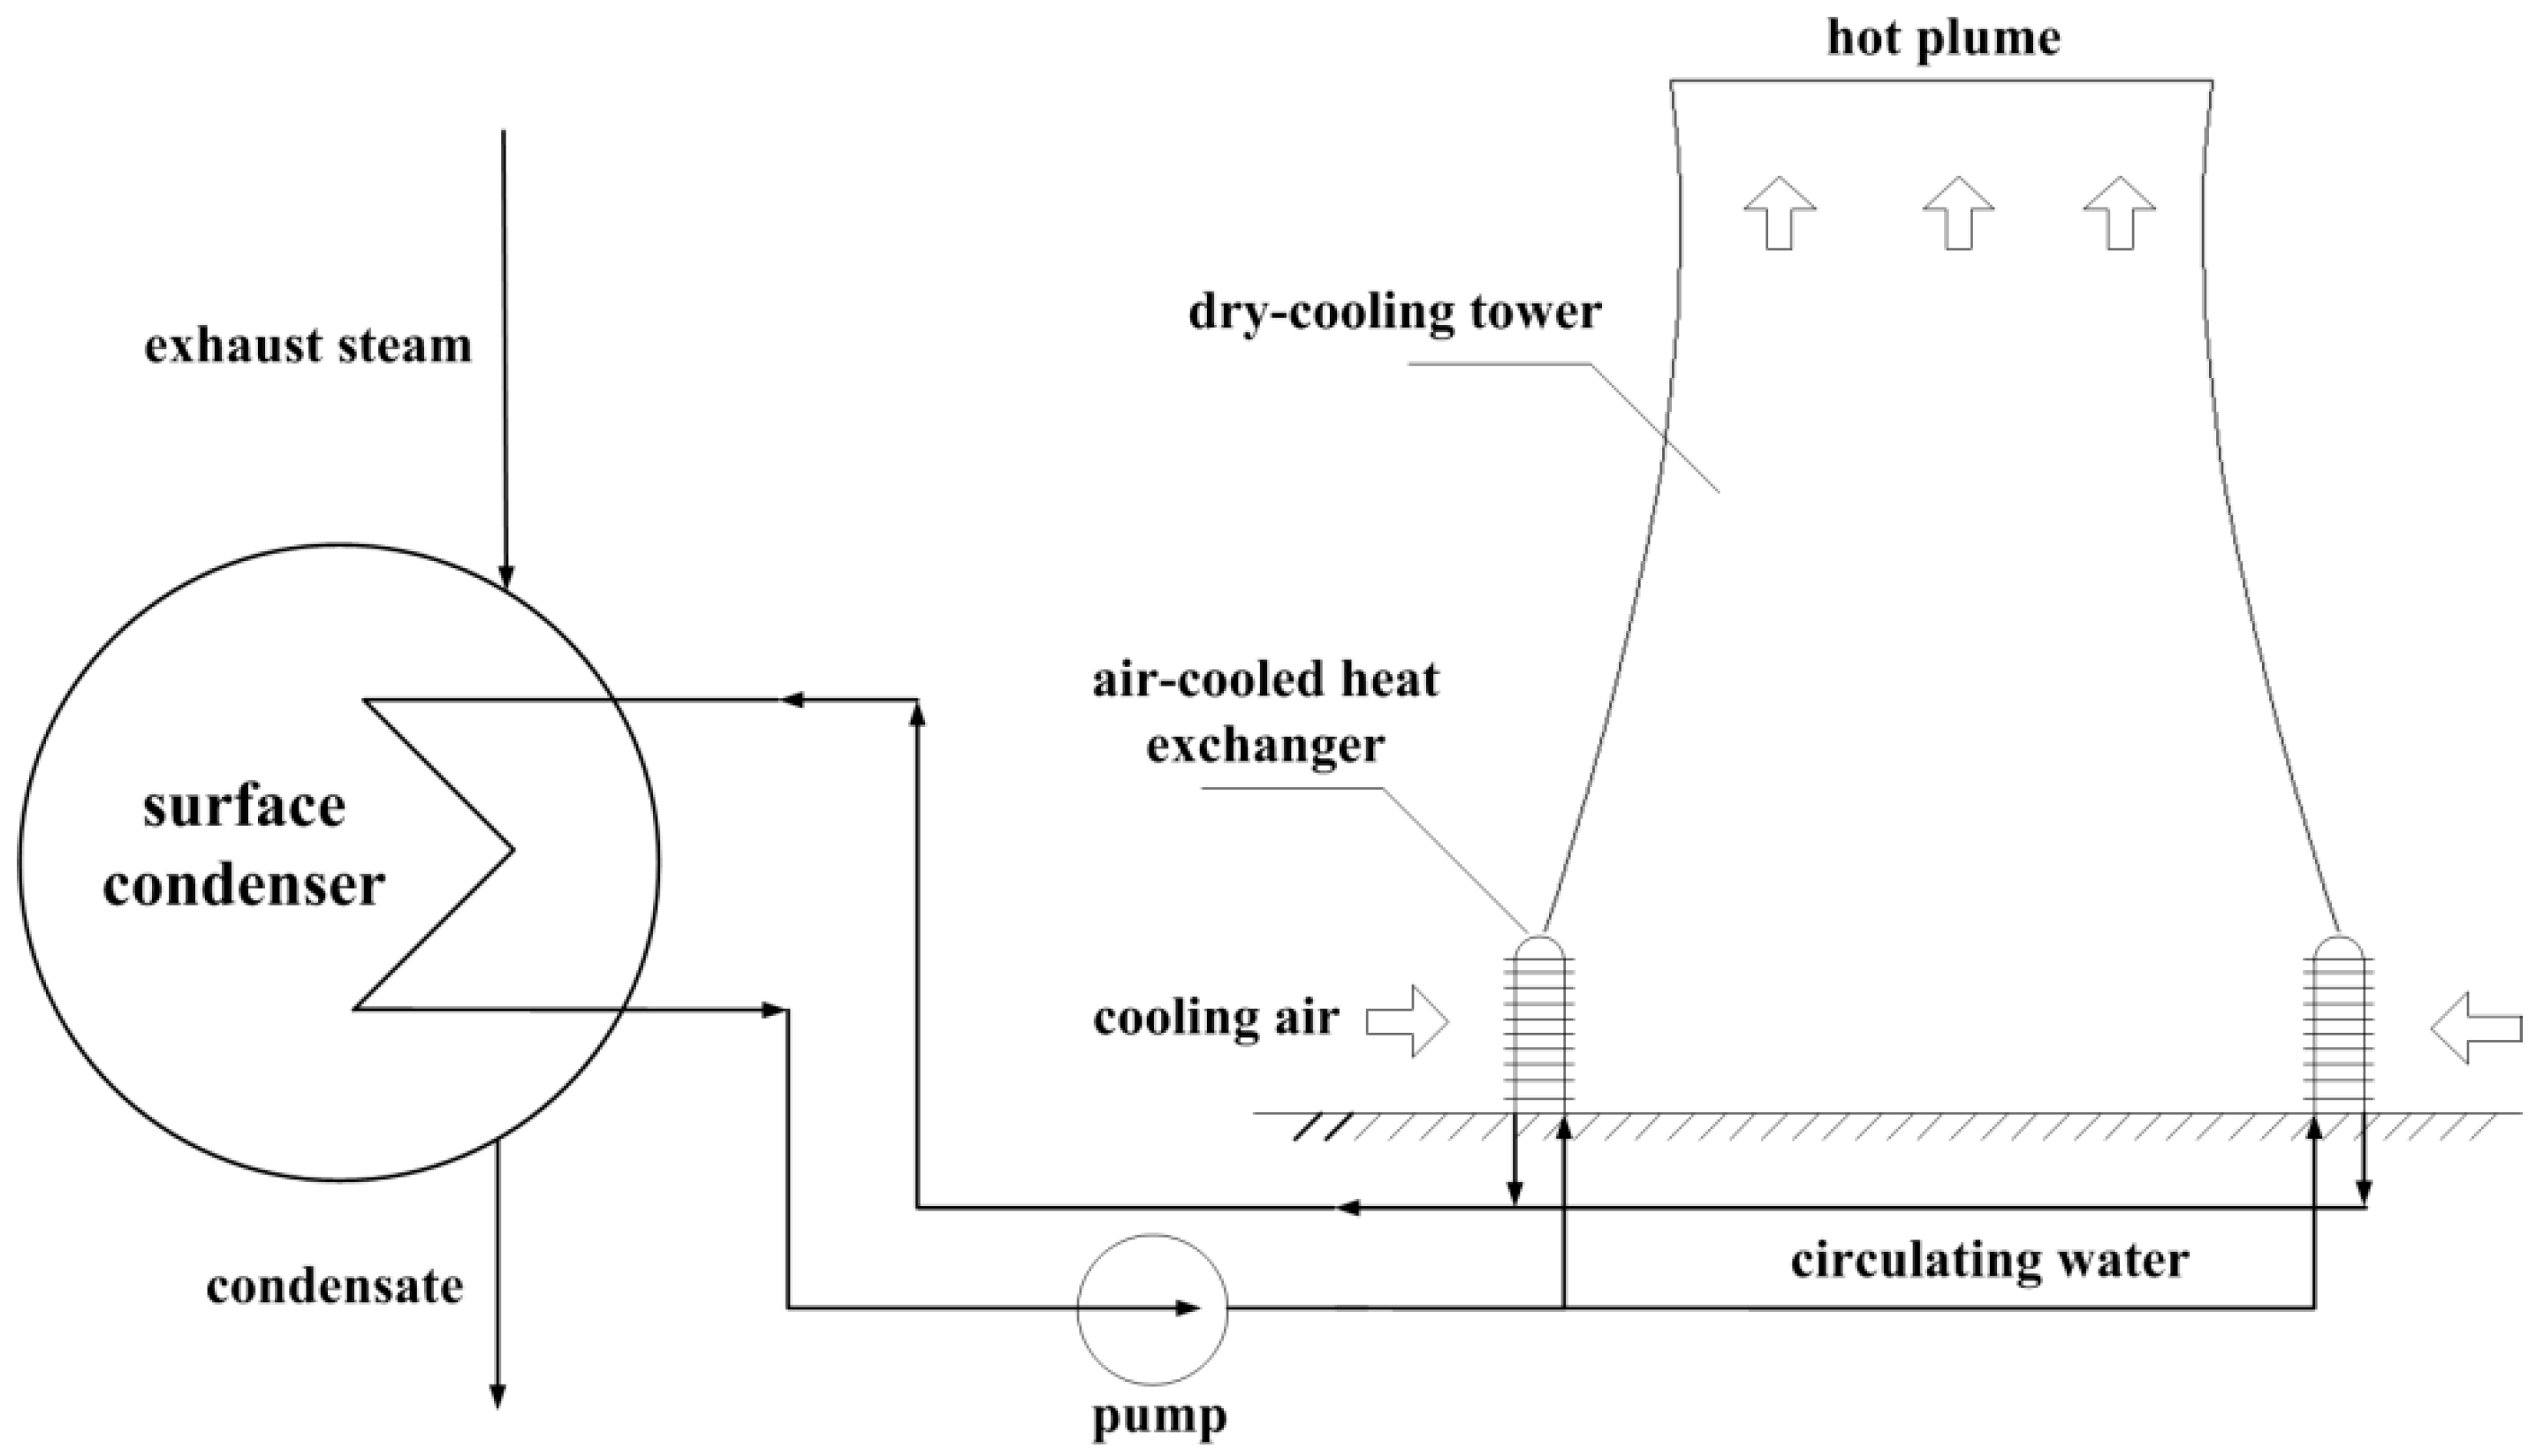
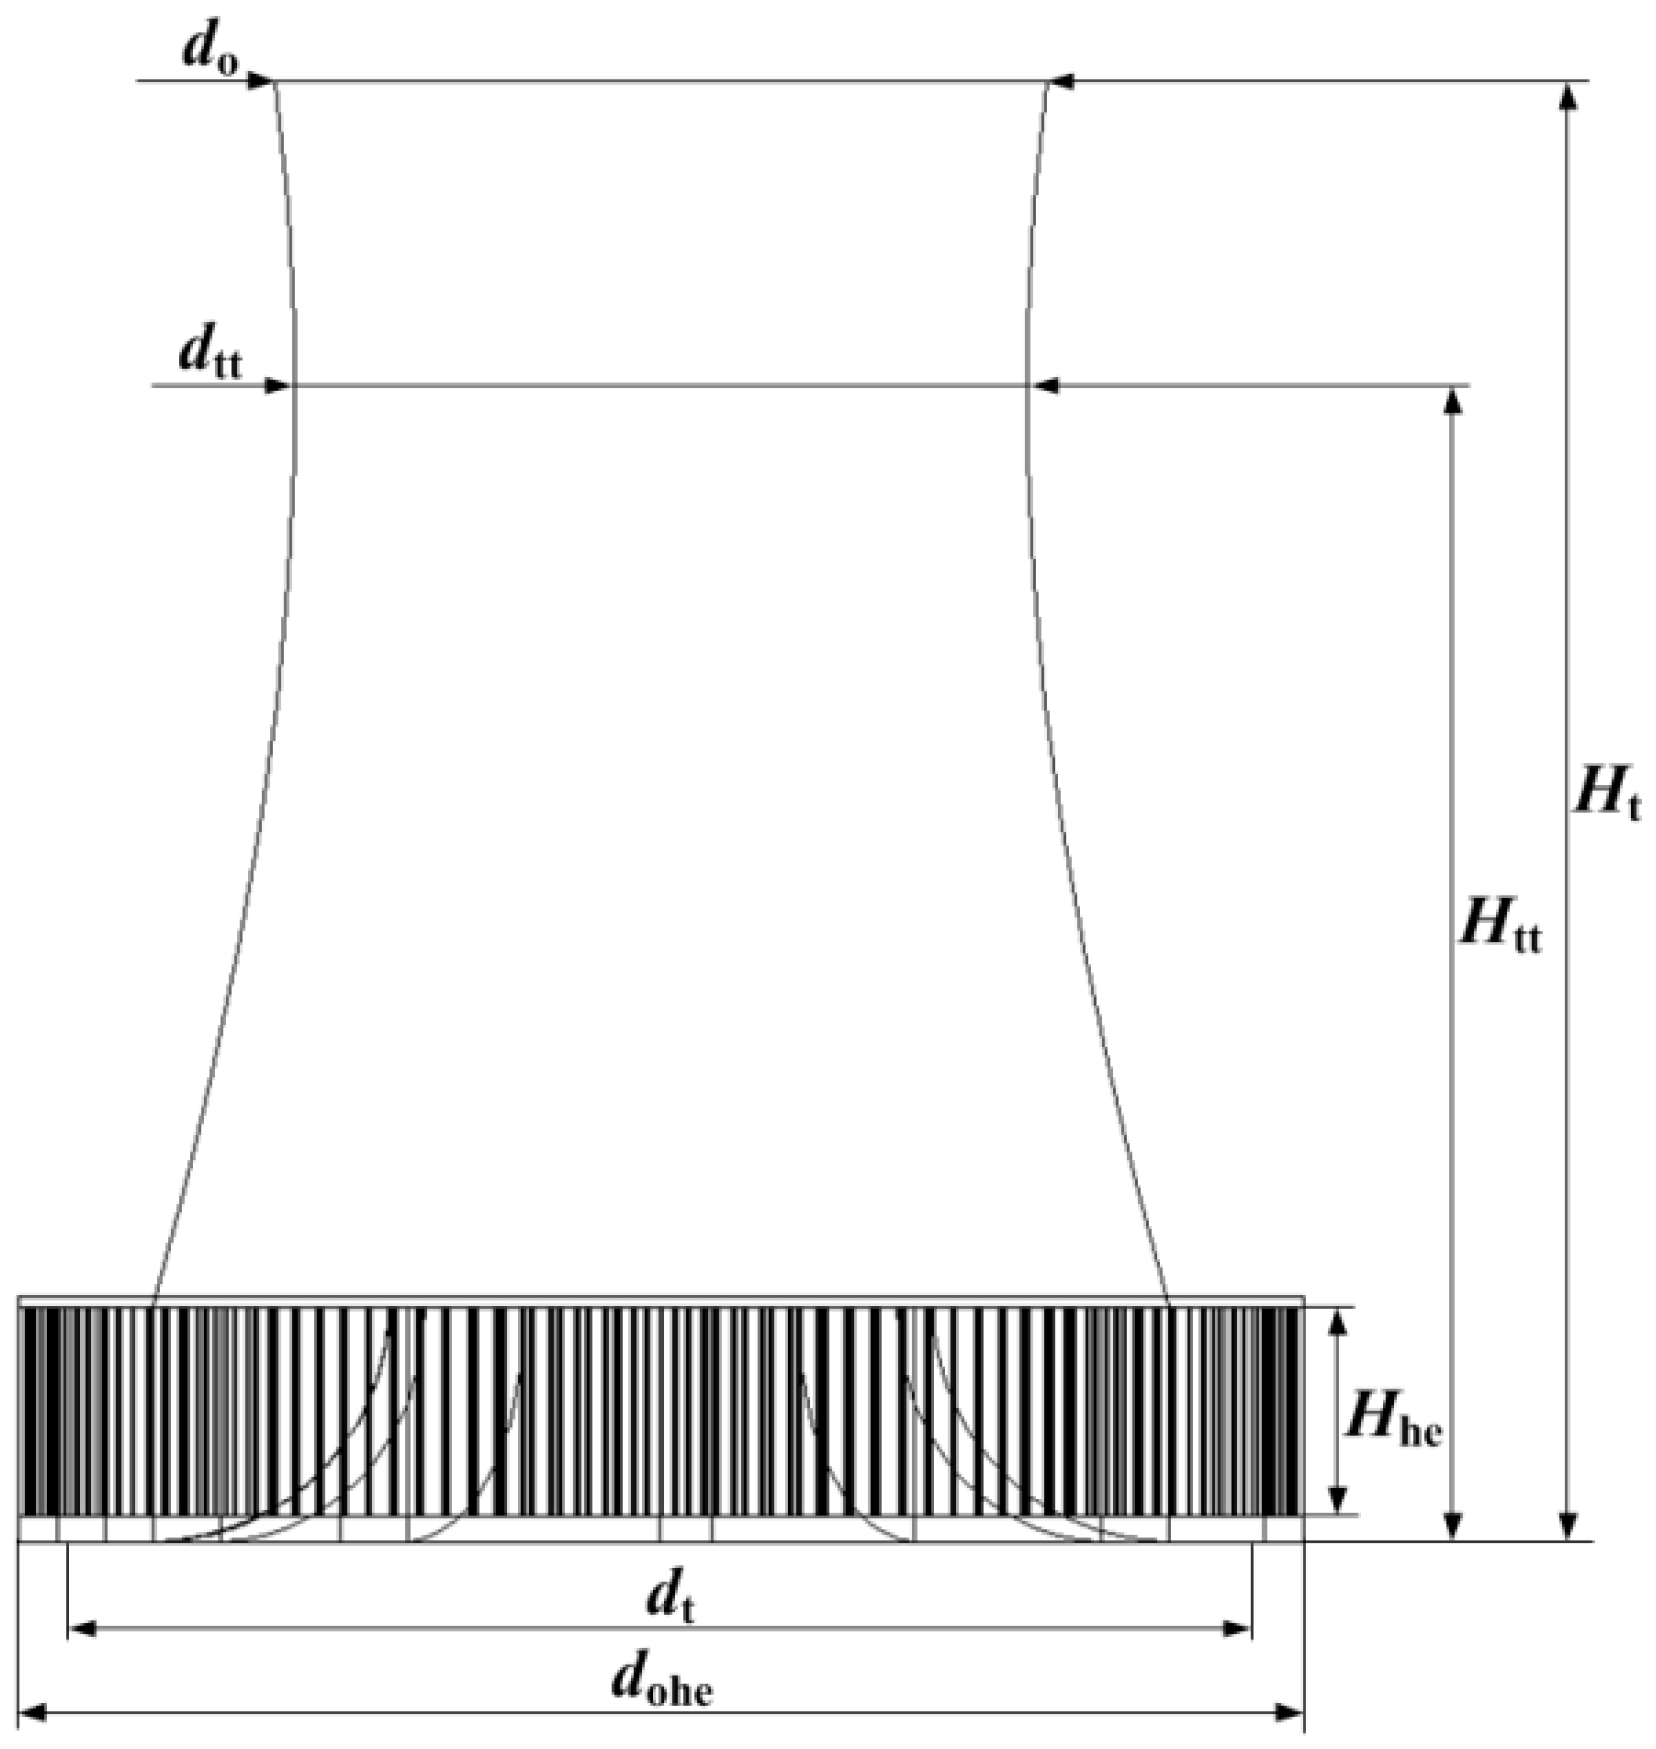
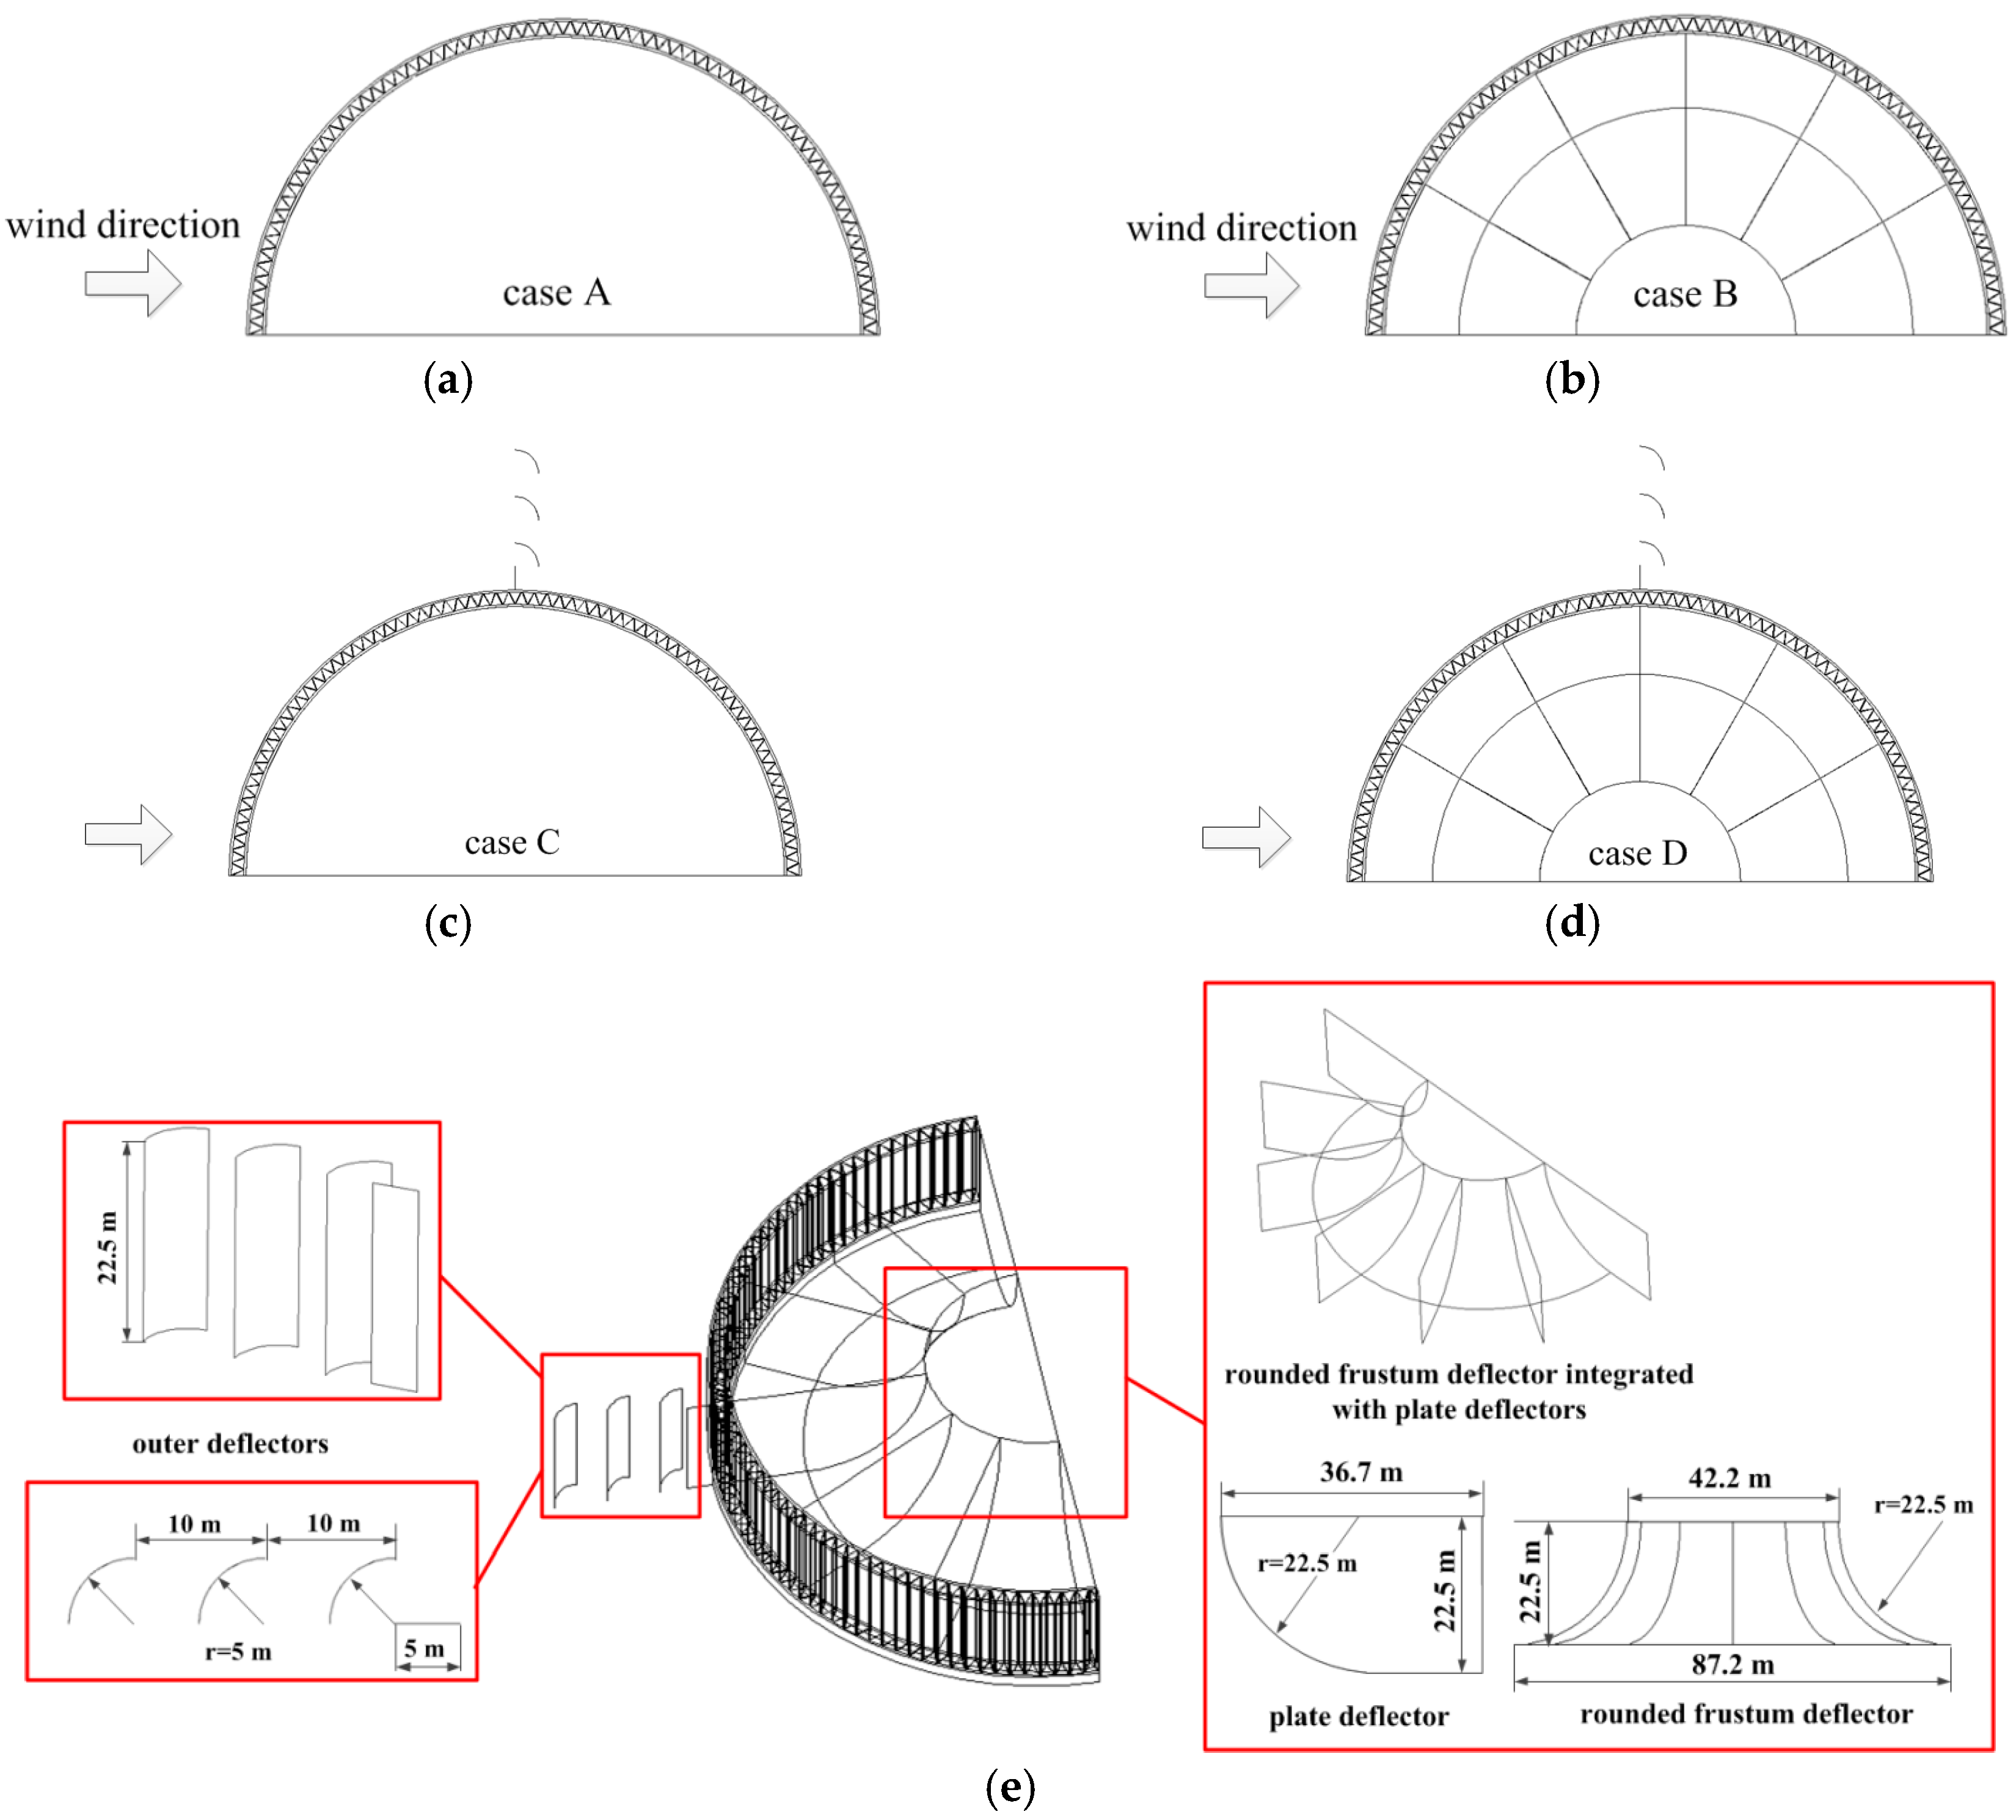
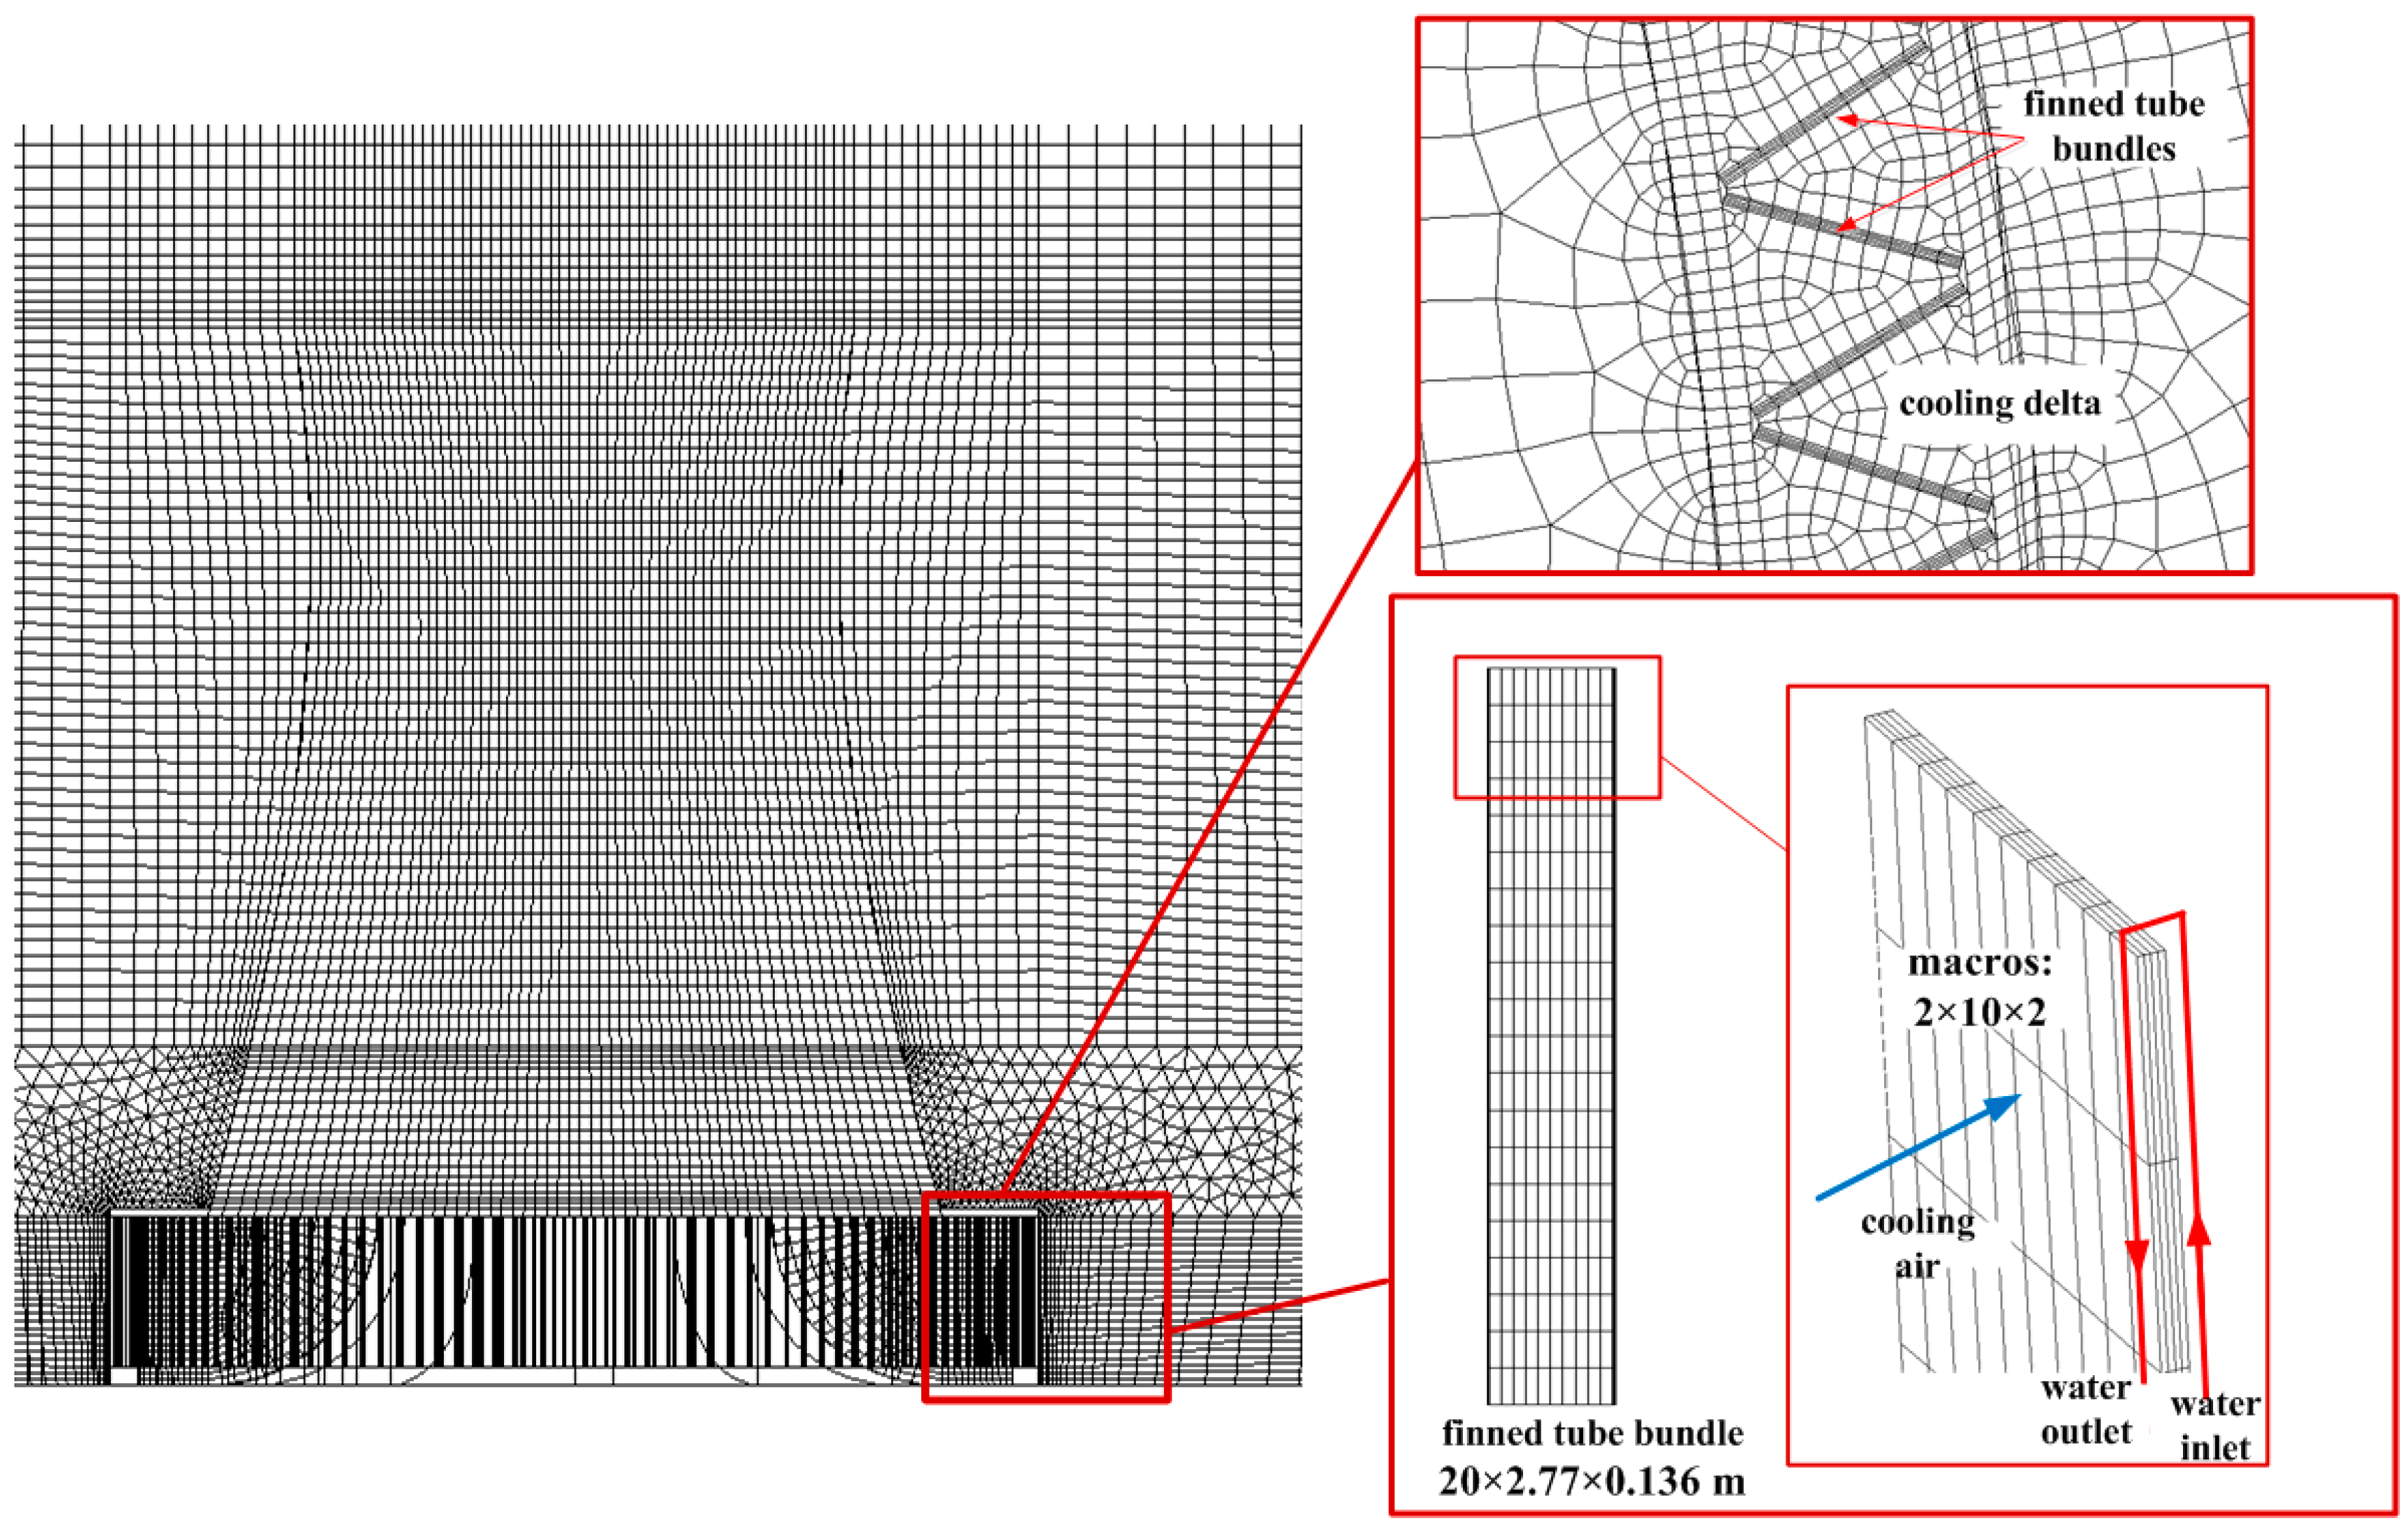
2.1. Physical Model

The cold end system of a 350 MW dry cooling power plant is investigated. Figure 1 presents the subsystems as the surface condenser and NDDCS with the large-scale air-cooled heat exchanger. Figure 2 displays the hyperbolic tower shell and air-cooled heat exchanger incorporated in NDDCS, meanwhile their geometric parameters are listed in Table 1. Thanks to the geometric symmetry, a computational model of half the dry cooling system is created. Figure 3 shows the air leading strategies in this work, where the air leading baffles are located inside or outside the dry-cooling tower. For comparisons, the conventional dry cooling system without any air leading measures named case A is also studied as shown in Figure 3a. For the air leading strategy termed case B, as shown in Figure 3b, a rounded frustum integrated with flat baffles is placed inside the tower. Figure 3c presents the air leading strategy of case C, where the air baffles are installed outside the air-cooled heat exchanger normal to the incoming winds. For the air leading strategy of case D shown in Figure 3d, both the inner and outer air leading measures are employed combining case B with case C. The configurations of the air leading strategies are schematically shown in Figure 3e.
The numerical domain with and without ambient winds is shown in Figure 4 with the large-scale dimensions of 2200 m in length, 1100 m in width and 1000 m in height, which can prevent the unrealistic effects of the boundary conditions on the air flows through NDDCS. For generating the high quality grids, the numerical domain is usually separated into several hexahedral blocks in GAMBIT (14.0 ed., ANSYS Inc., Pittsburgh, PA, USA).
The hybrid grids are set for the central block, while the hexahedral ones are generated in other zones, besides the local meshes are specifically presented in Figure 5. For each column of cooling delta, a heat exchanger model has two passes, with each pass divided into 10 rows and 2 columns of macros. The grid size for the heat exchanger zone is 0.034 × 0.0277 × 1 m, while for the tower section, it is set 2 × 2 × 2 m. As a result, 2,516,438 cells are produced for the computational domain. In addition, when the grid sizes turn to be 0.034 × 0.0277 × 0.5 m and 1 × 1 × 1 m for the two parts, there will be 3,157,281 cells. If the grid sizes are set at 0.034 × 0.0277 × 2 m and 3 × 3 × 3 m separately, 1,732,452 cells are generated. The air mass flow rate through the tower outlet has a fairly small variation of 0.3% at the designed wind speed of 4 m/s with the former two densities applied, so a cell number of 2,516,438 is finally employed.

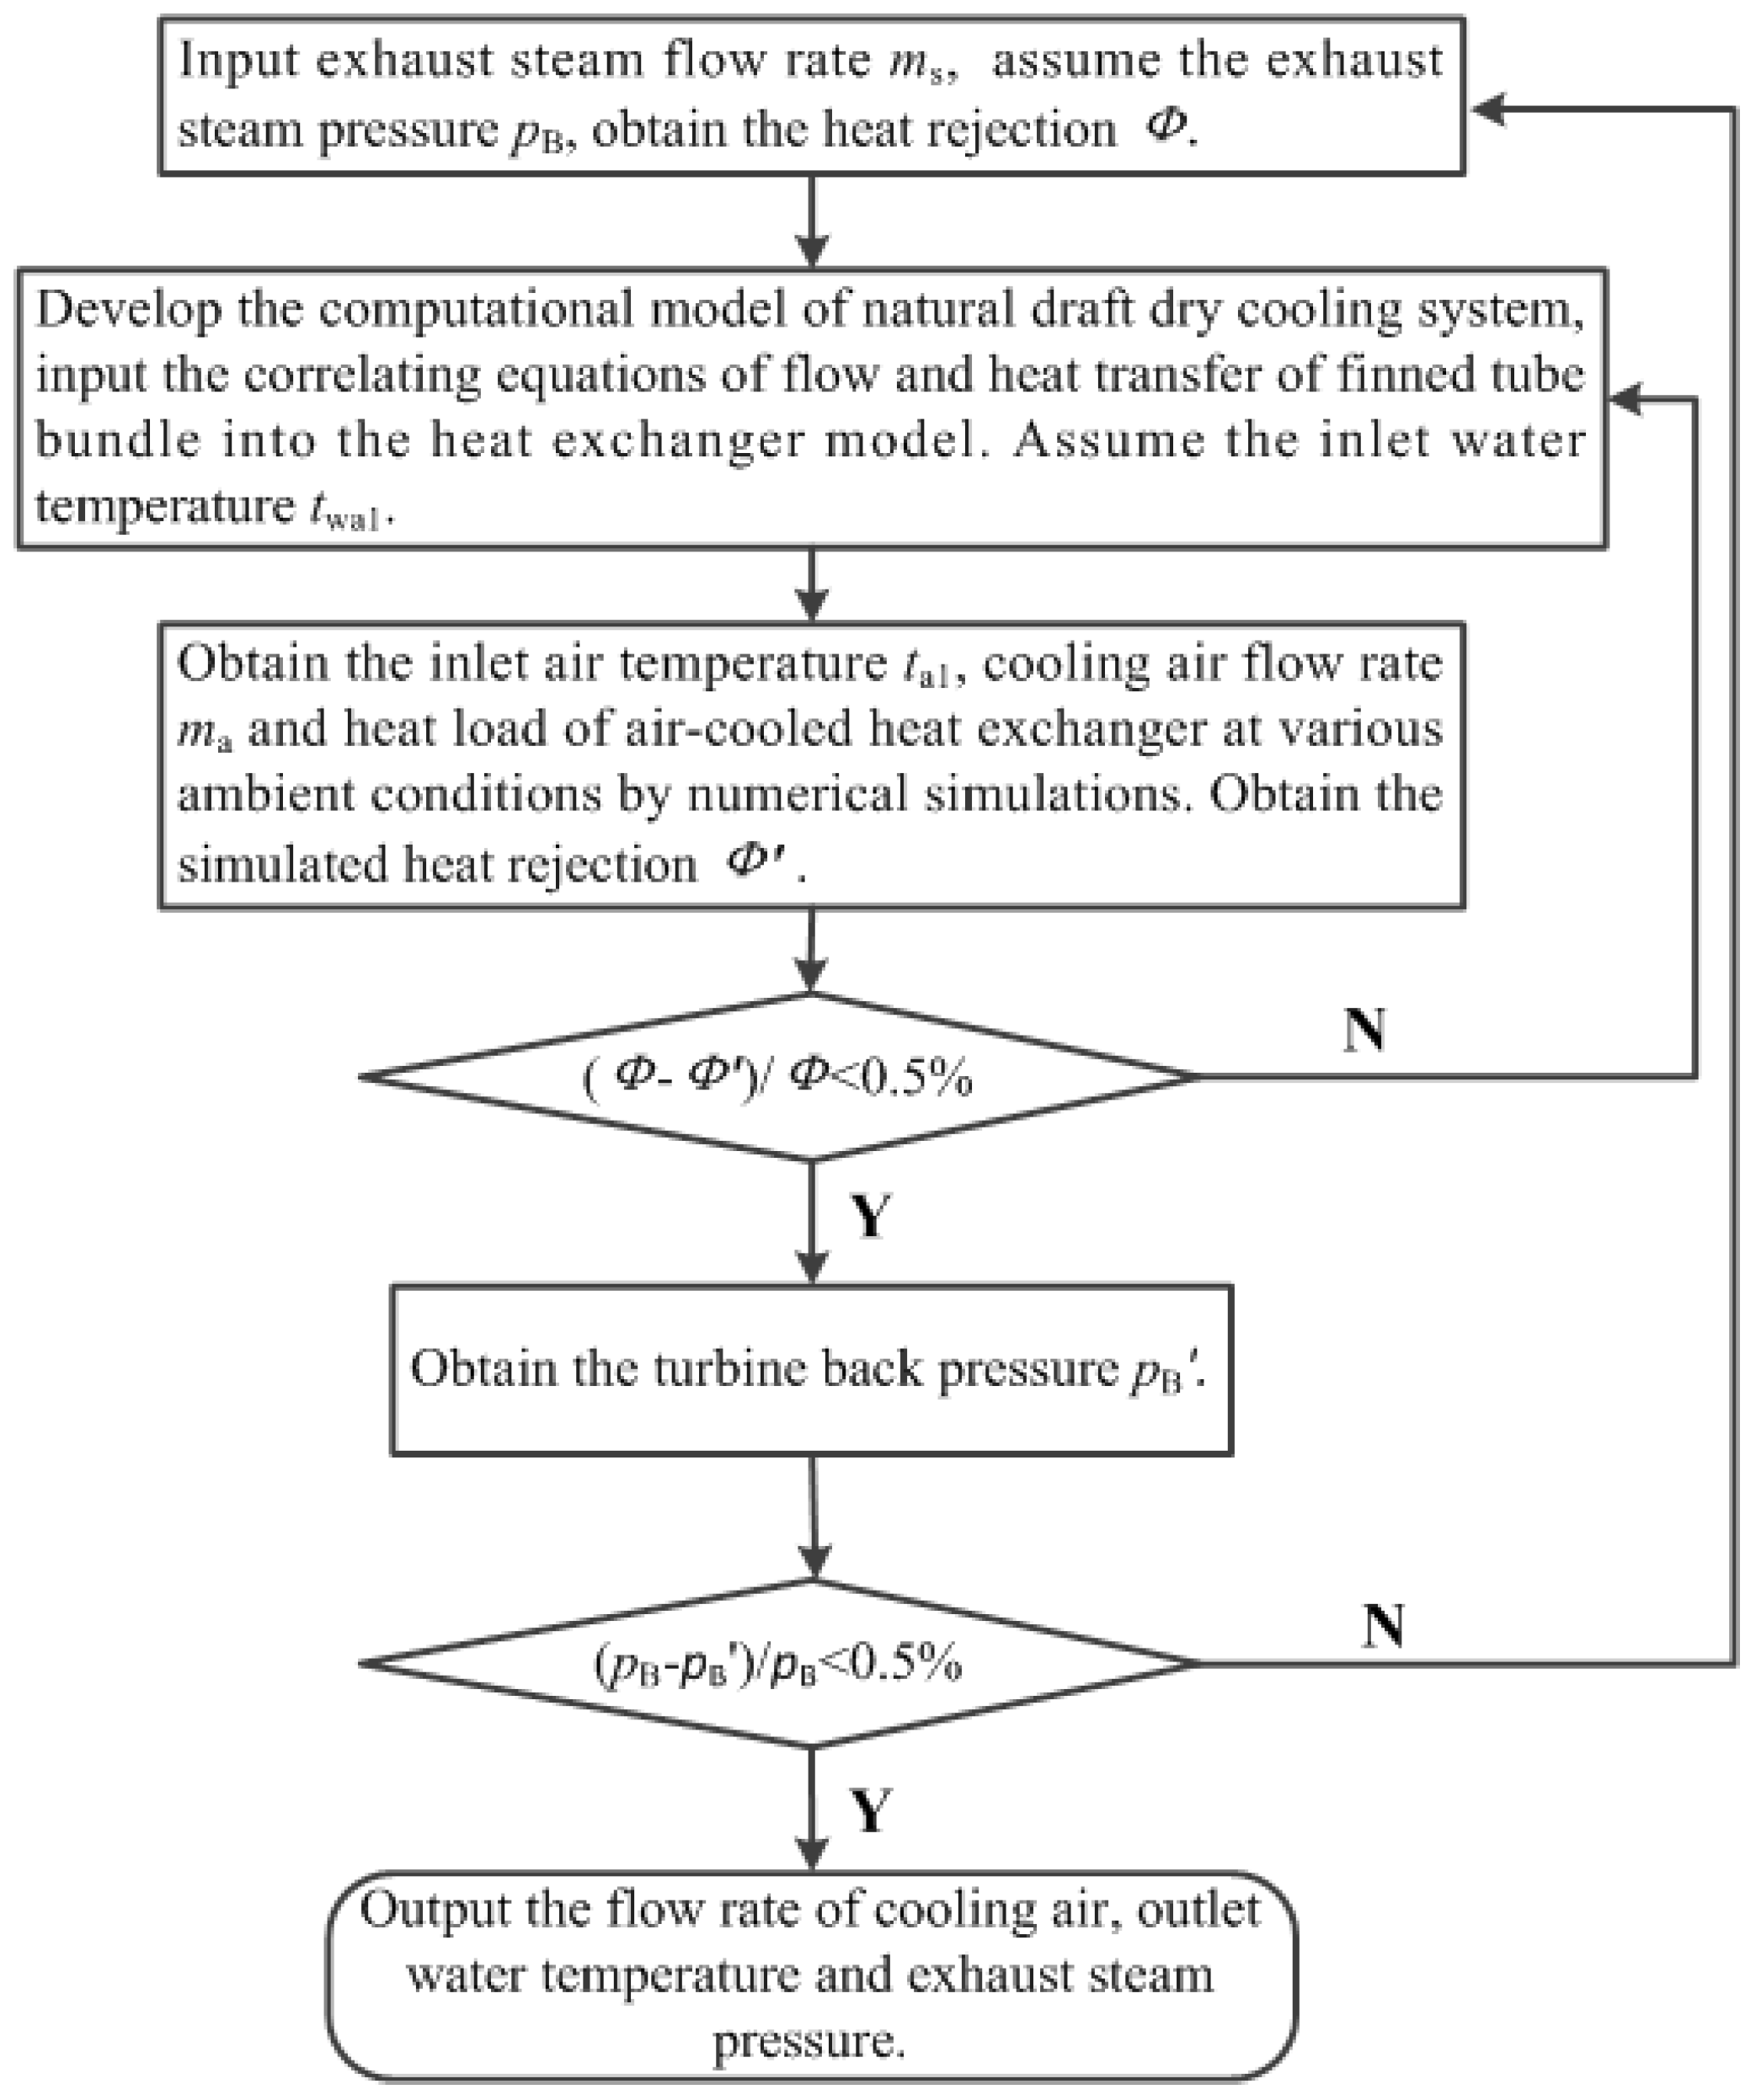
2.2. Mathematical Model

2.2.1. Macro Heat Exchanger Model

By using the macro heat exchanger model, the pressure drop Δp of the primary fluid, cooling air, can be expressed as [27,28,29]:
Δ p = 1 2 f ρ u A min 2
where ρ, uAmin are the air density and velocity at the minimum flow area. f is the loss coefficient expressed as follows:
f = ( K i + 1 σ 2 ) ( 1 σ 2 K e ) v e v i + 2 ( v e v i 1 ) + f c A A min v m v i
where σ means the ratio of the minimum flow area to face area. A, Amin are areas of the air side surface and minimum cross-section. vi and ve are the specific volumes at the inlet and exit, while vm equals the mean value. Ki and Ke are the inlet and exit loss coefficients set to be 0 because of the core friction factor fc key role in the loss coefficient:
f c = a R e A min b
where a and b are coefficient and exponent of the core friction. ReAmin represents the Reynolds number with the air velocity at the minimum flow section.
For the simple-effectiveness method, the heat transfer from the circulating water to cooling air gives:
Φ cell = ε he ( m C p ) a ( T in , wa T cell )
Φ macro = all cells in macro Φ cell
Φ total = all   macros Φ macro
where εhe is the heat exchanger effectiveness. (mCp)a represents the air heat capacity. Tin,wa is the inlet water temperature, while Tcell means the cell temperature. The macro heat flow rate Φmacro equals the summation of heat rejections from all cells, while the total value Φtotal can be achieved by summing the heat loads of all macros. For the macro heat exchanger model, the pressure loss coefficients and heat transfer effectiveness are listed in Table 2 [27,28].

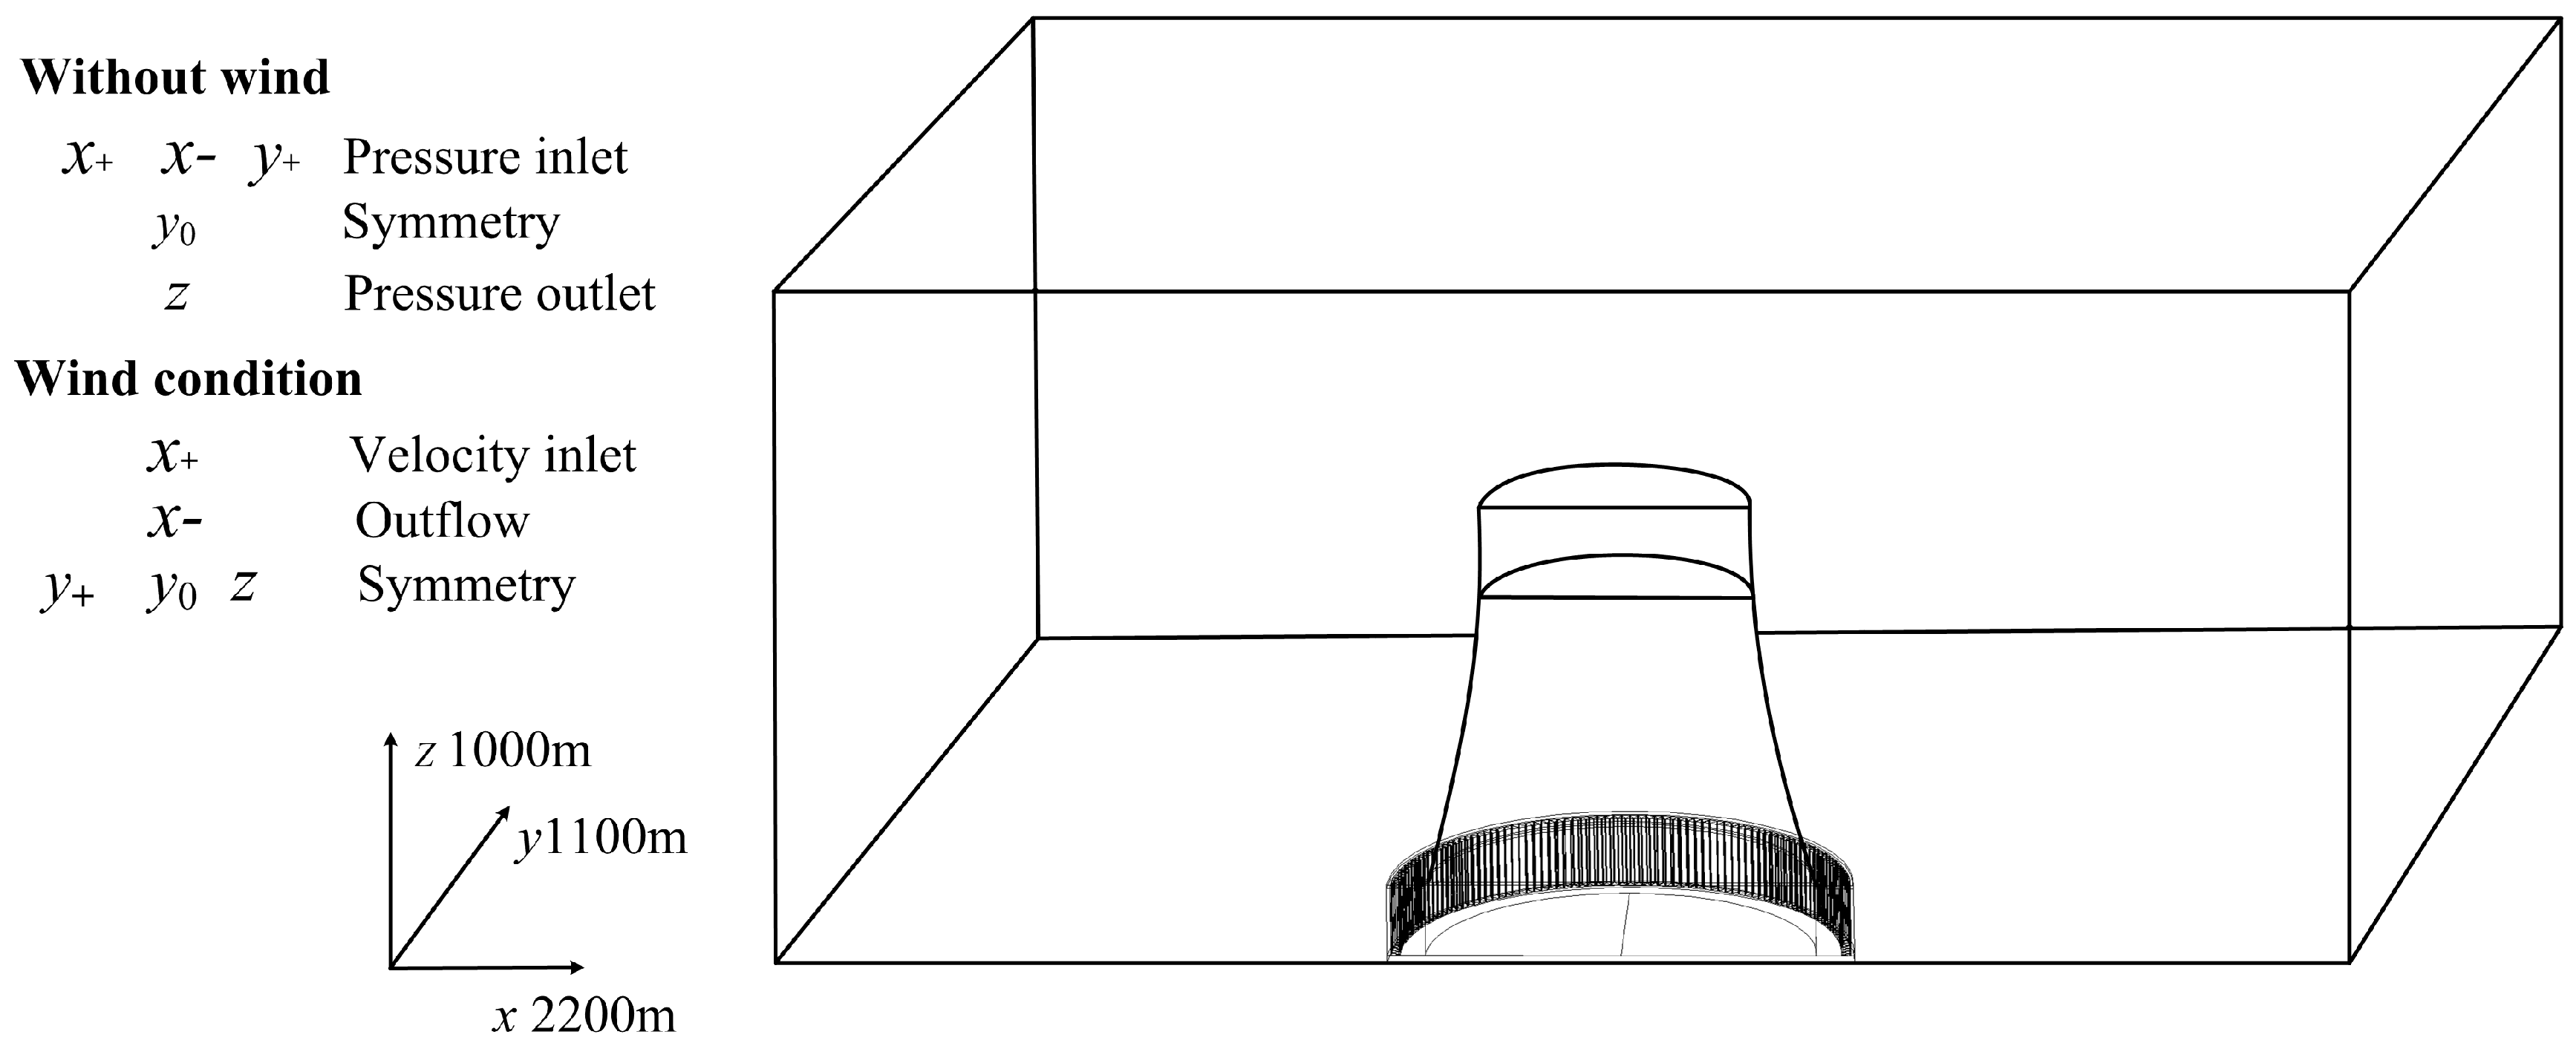
2.2.2. Conservation Equations and Numerical Approach

The air-side conservation equations have the following form:
ρ u j φ x j = x j ( Γ φ φ x j ) + S φ   ( j = 1 , 2 , 3 )
where uj represents the velocity in the xj direction. φ, Γφ and Sφ are the variable, variable diffusivity coefficient and source [3,8,21,29]. For the viscous turbulent flow, the two-equation realizable k-ε model is employed. With the closed numerical equations, the rotation flows, boundary layer flows along with severely adverse pressure gradients which may also incur the recirculation flows, can be accurately predicted for NDDCS.
With the ambient winds as shown in Figure 4, the turbulent kinetic energy k and dissipation rate ε at the inlet boundary are expressed with the following forms:
k = 1.5 ( u avg I ) 2
ε = ρ C k 2 μ ( μ t μ ) 1
where uavg and I are the average velocity and turbulence intensity. The turbulence intensity is typically set 10%. C is the empirical constant with the value of 0.09. μt/μ is the turbulent viscosity ratio and assigned 1.1 in this work.
Along the height of the inlet surface, wind speed uwind takes the power-law equation:
u wind = u w ( z 10 ) e
where uw is the wind speed at the reference height of 10 m with values of 4, 8, 12, 16 and 20 m/s. The exponent e is basically set 0.2 to represent the common ground roughness and atmosphere. The ambient temperature is set as 15 °C for the domain boundaries. The pressure outlet is set for the outlet surface, while symmetry for other planes. When without winds, the pressure inlet is appointed for three domain surfaces, while the pressure outlet for the top one.
The second-order upwind scheme is adopted to discretize the conservation equations, and the SIMPLE method is used to deal with the pressure-velocity coupling. The divergence-free criterion of 10−4 for all the variable scaled residuals is prescribed. Moreover, the mass flow rate through the dry-cooling tower and the average air temperature at the tower exit are also monitored to ensure the computations are converged to accurate results.
The flow and heat transfer performances of NDDCS interact with the turbine back pressure, so the numerical simulation should be iterated. With the CFD method and heat balance analysis, the turbine back pressure under different ambient conditions can be calculated. The iteration flow chart coupling the dry cooling system with condenser is shown in Figure 6, and summarized as follows.
First of all, assume the turbine back pressure pB, and then the condenser heat rejection Φ is obtained according to Equation (11). The inlet water temperature twa1 of the air-cooled heat exchanger is then assumed and imported to the computational model of NDDCS. By numerical simulations, the heat rejection of air-cooled heat exchanger Φ' is obtained, and the average inlet air temperature ta1, total air mass flow rate ma can be obtained as well. If the relative error between Φ and Φ' is within the limit, the condensation temperature ts can be achieved following Equation (12), therefore the relevant turbine back pressure pB' can be calculated. If the calculated error between pB and pB' satisfies the allowed value, this iterating procedure is converged. Otherwise, re-start the whole process:
Φ = m s ( h s h w )
t s = Φ C p , a m a 1 1 e k A / C p , a m a + t a 1
ms is the steam mass flow rate, hs and hw are enthalpies of exhaust steam and condensate. Cp,a represents the air specific heat. K and A equal the overall heat transfer coefficient and total heat exchanger area.

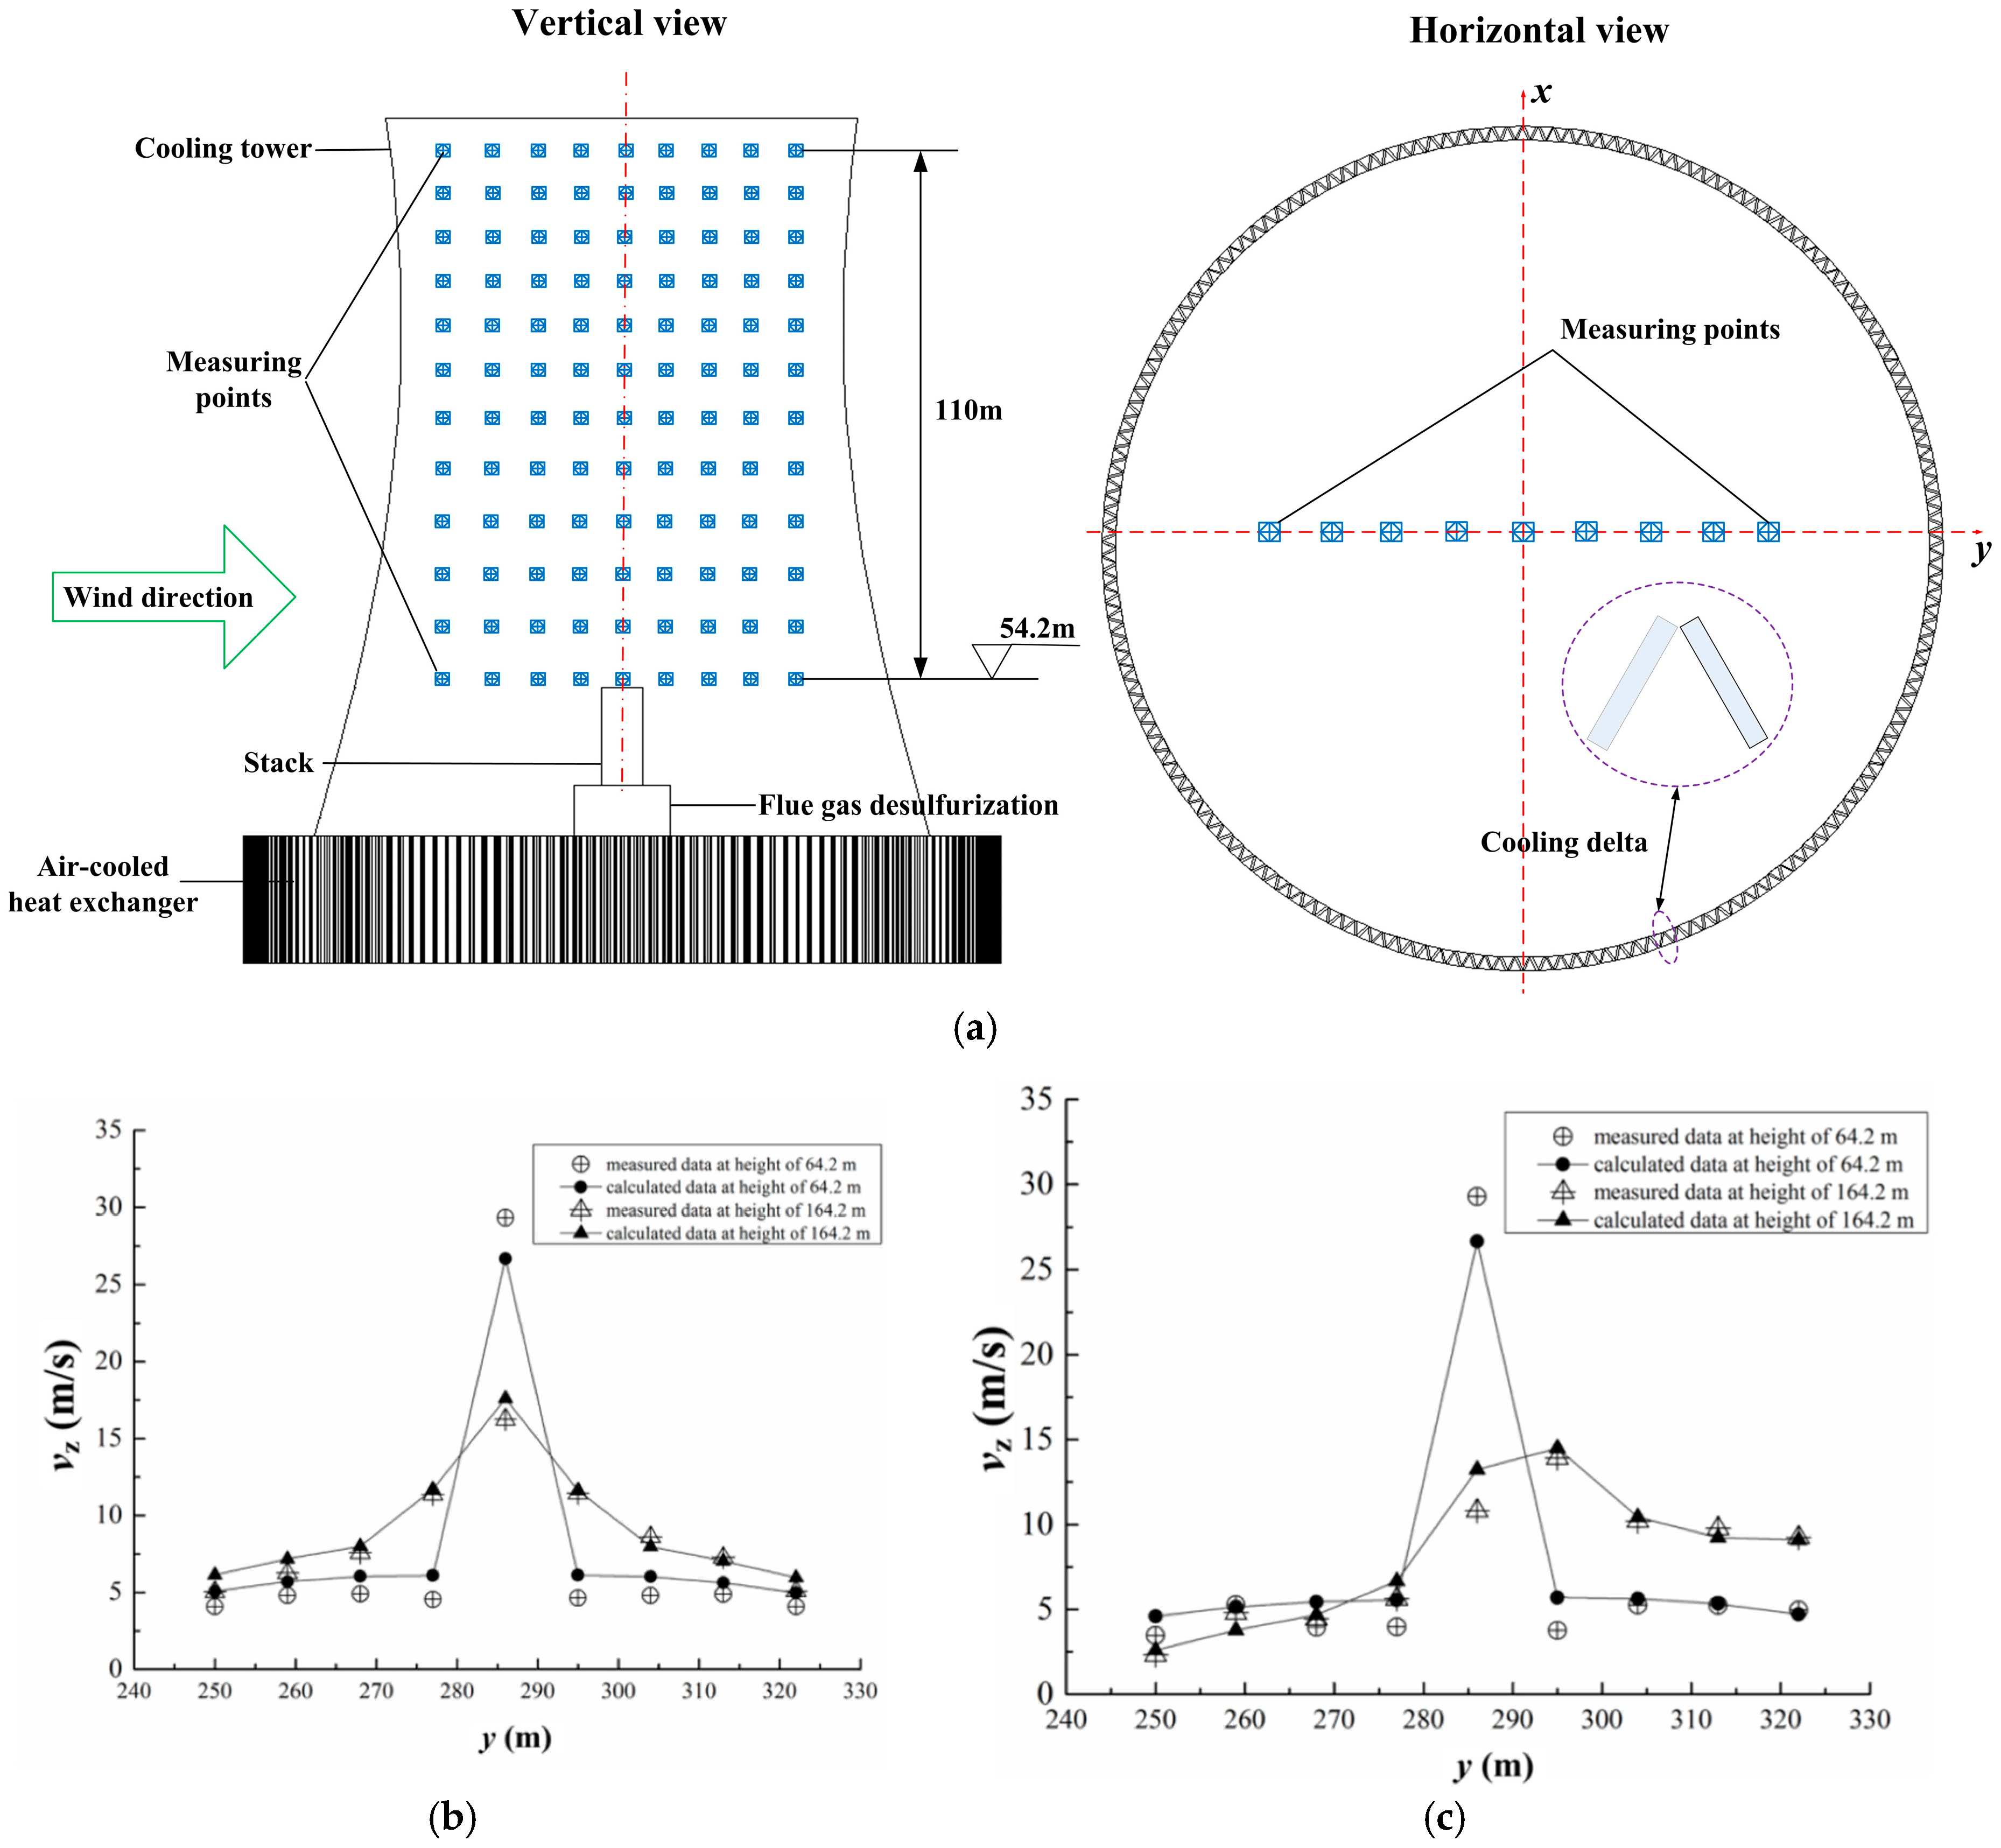
2.3. Experimental Validation

The thermo-flow performances of dry cooling system can hardly be measured on the spot due to the frequently changing ambient winds. Therefore, the wind tunnel model test has been widely adopted as an effective alternative. In our previous works [3,8,12], a practical model of NDDCS with the air-cooled heat exchanger installed under the tower shell was tested in a wind tunnel. The experimental section is 20 m in length, 3.5 m in width and 2.2 m in height, in which the wind speed can change from 0.1 m/s to 6.5 m/s. When the flow was stable, the ascending velocities of cooling air at one layer with nine typical points can be measured simultaneously by the hot-wire transducer. The test points at each horizontal cross section inside the tower are described in Figure 7.
Meanwhile, the numerical model of NDDCS was developed with reference to the prototype. The corresponding air ascending velocities were computed by means of numerical simulations. The numerical and experimental results are compared at two typical horizontal planes with the heights of 64.2 m and 164.2 m, as shown in Figure 7b with no winds and Figure 7c at the designed wind speed of 4 m/s. In both the absence and presence of winds, the modelling results match well with those obtained by experiment, proving that the numerical method is accurate and reliable enough for predicting the cooing performance of NDDCS. The computational approach in this research shows completely same as the aforementioned one, which indirectly justifies the rationality of the modeling results.

3. Results and Discussion

For various air leading strategies, the air streamlines through the dry cooling system, and the flow effectiveness, heat transfer effectiveness and outlet water temperature of each cooling delta are compared and analyzed.

3.1. With No Air Leading
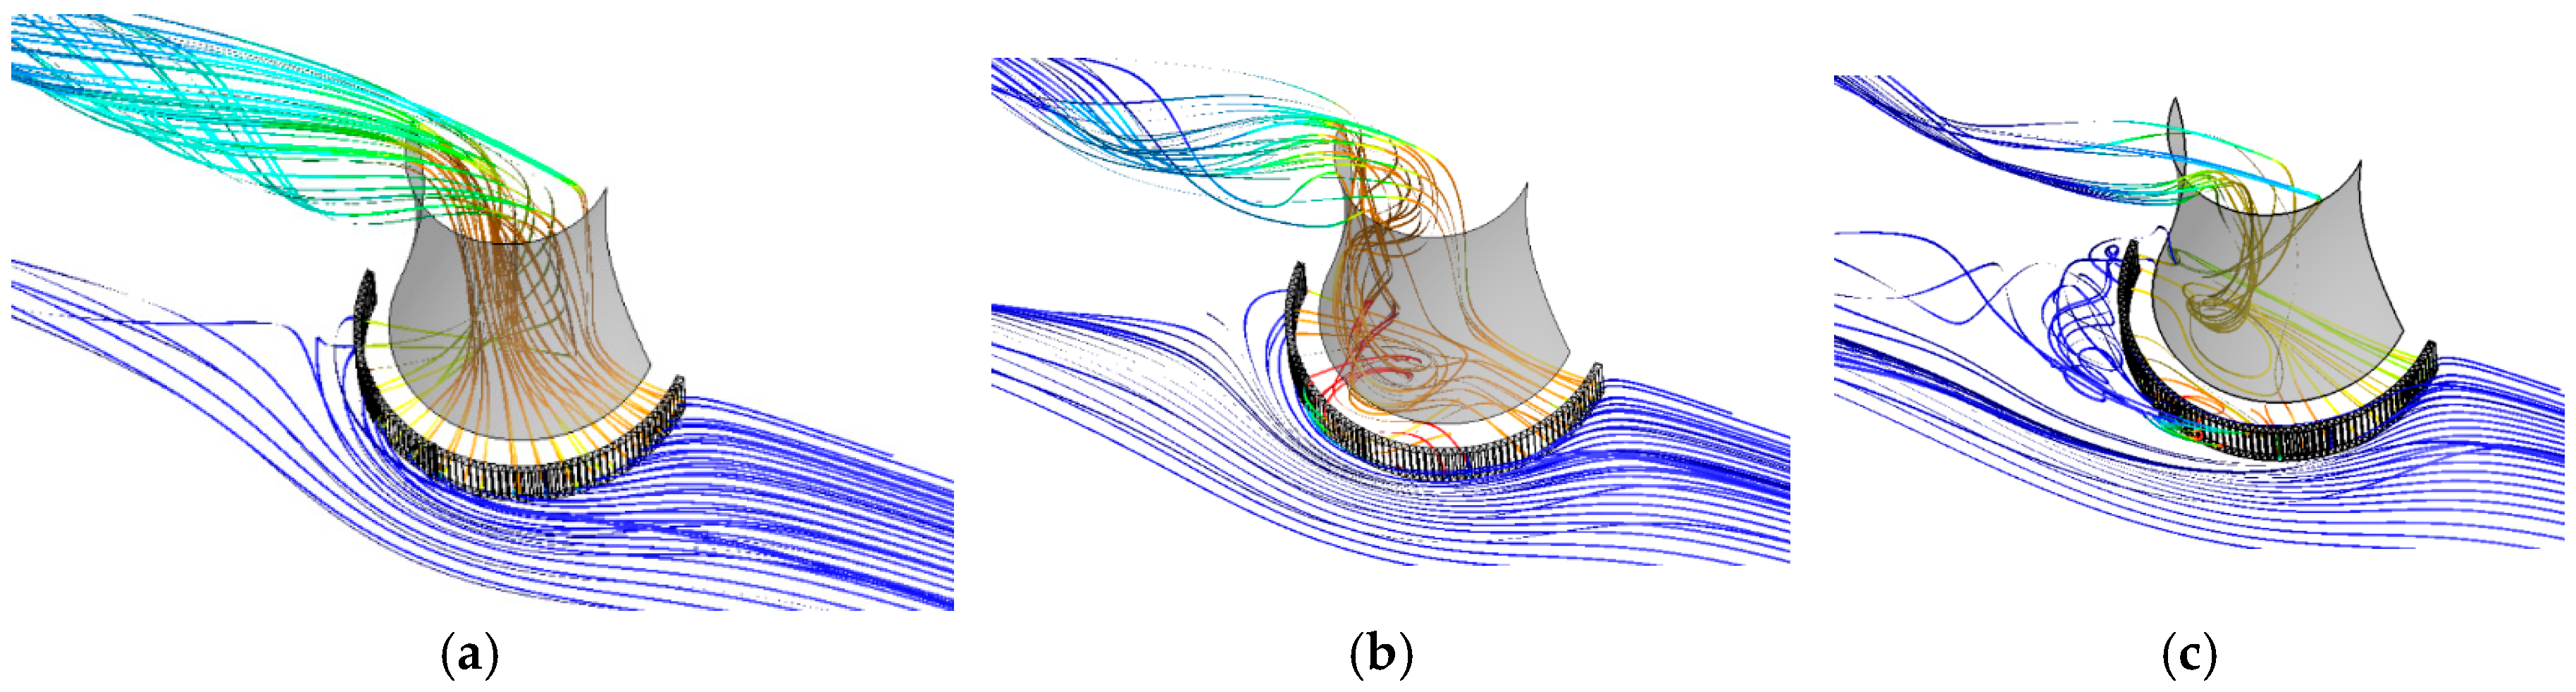
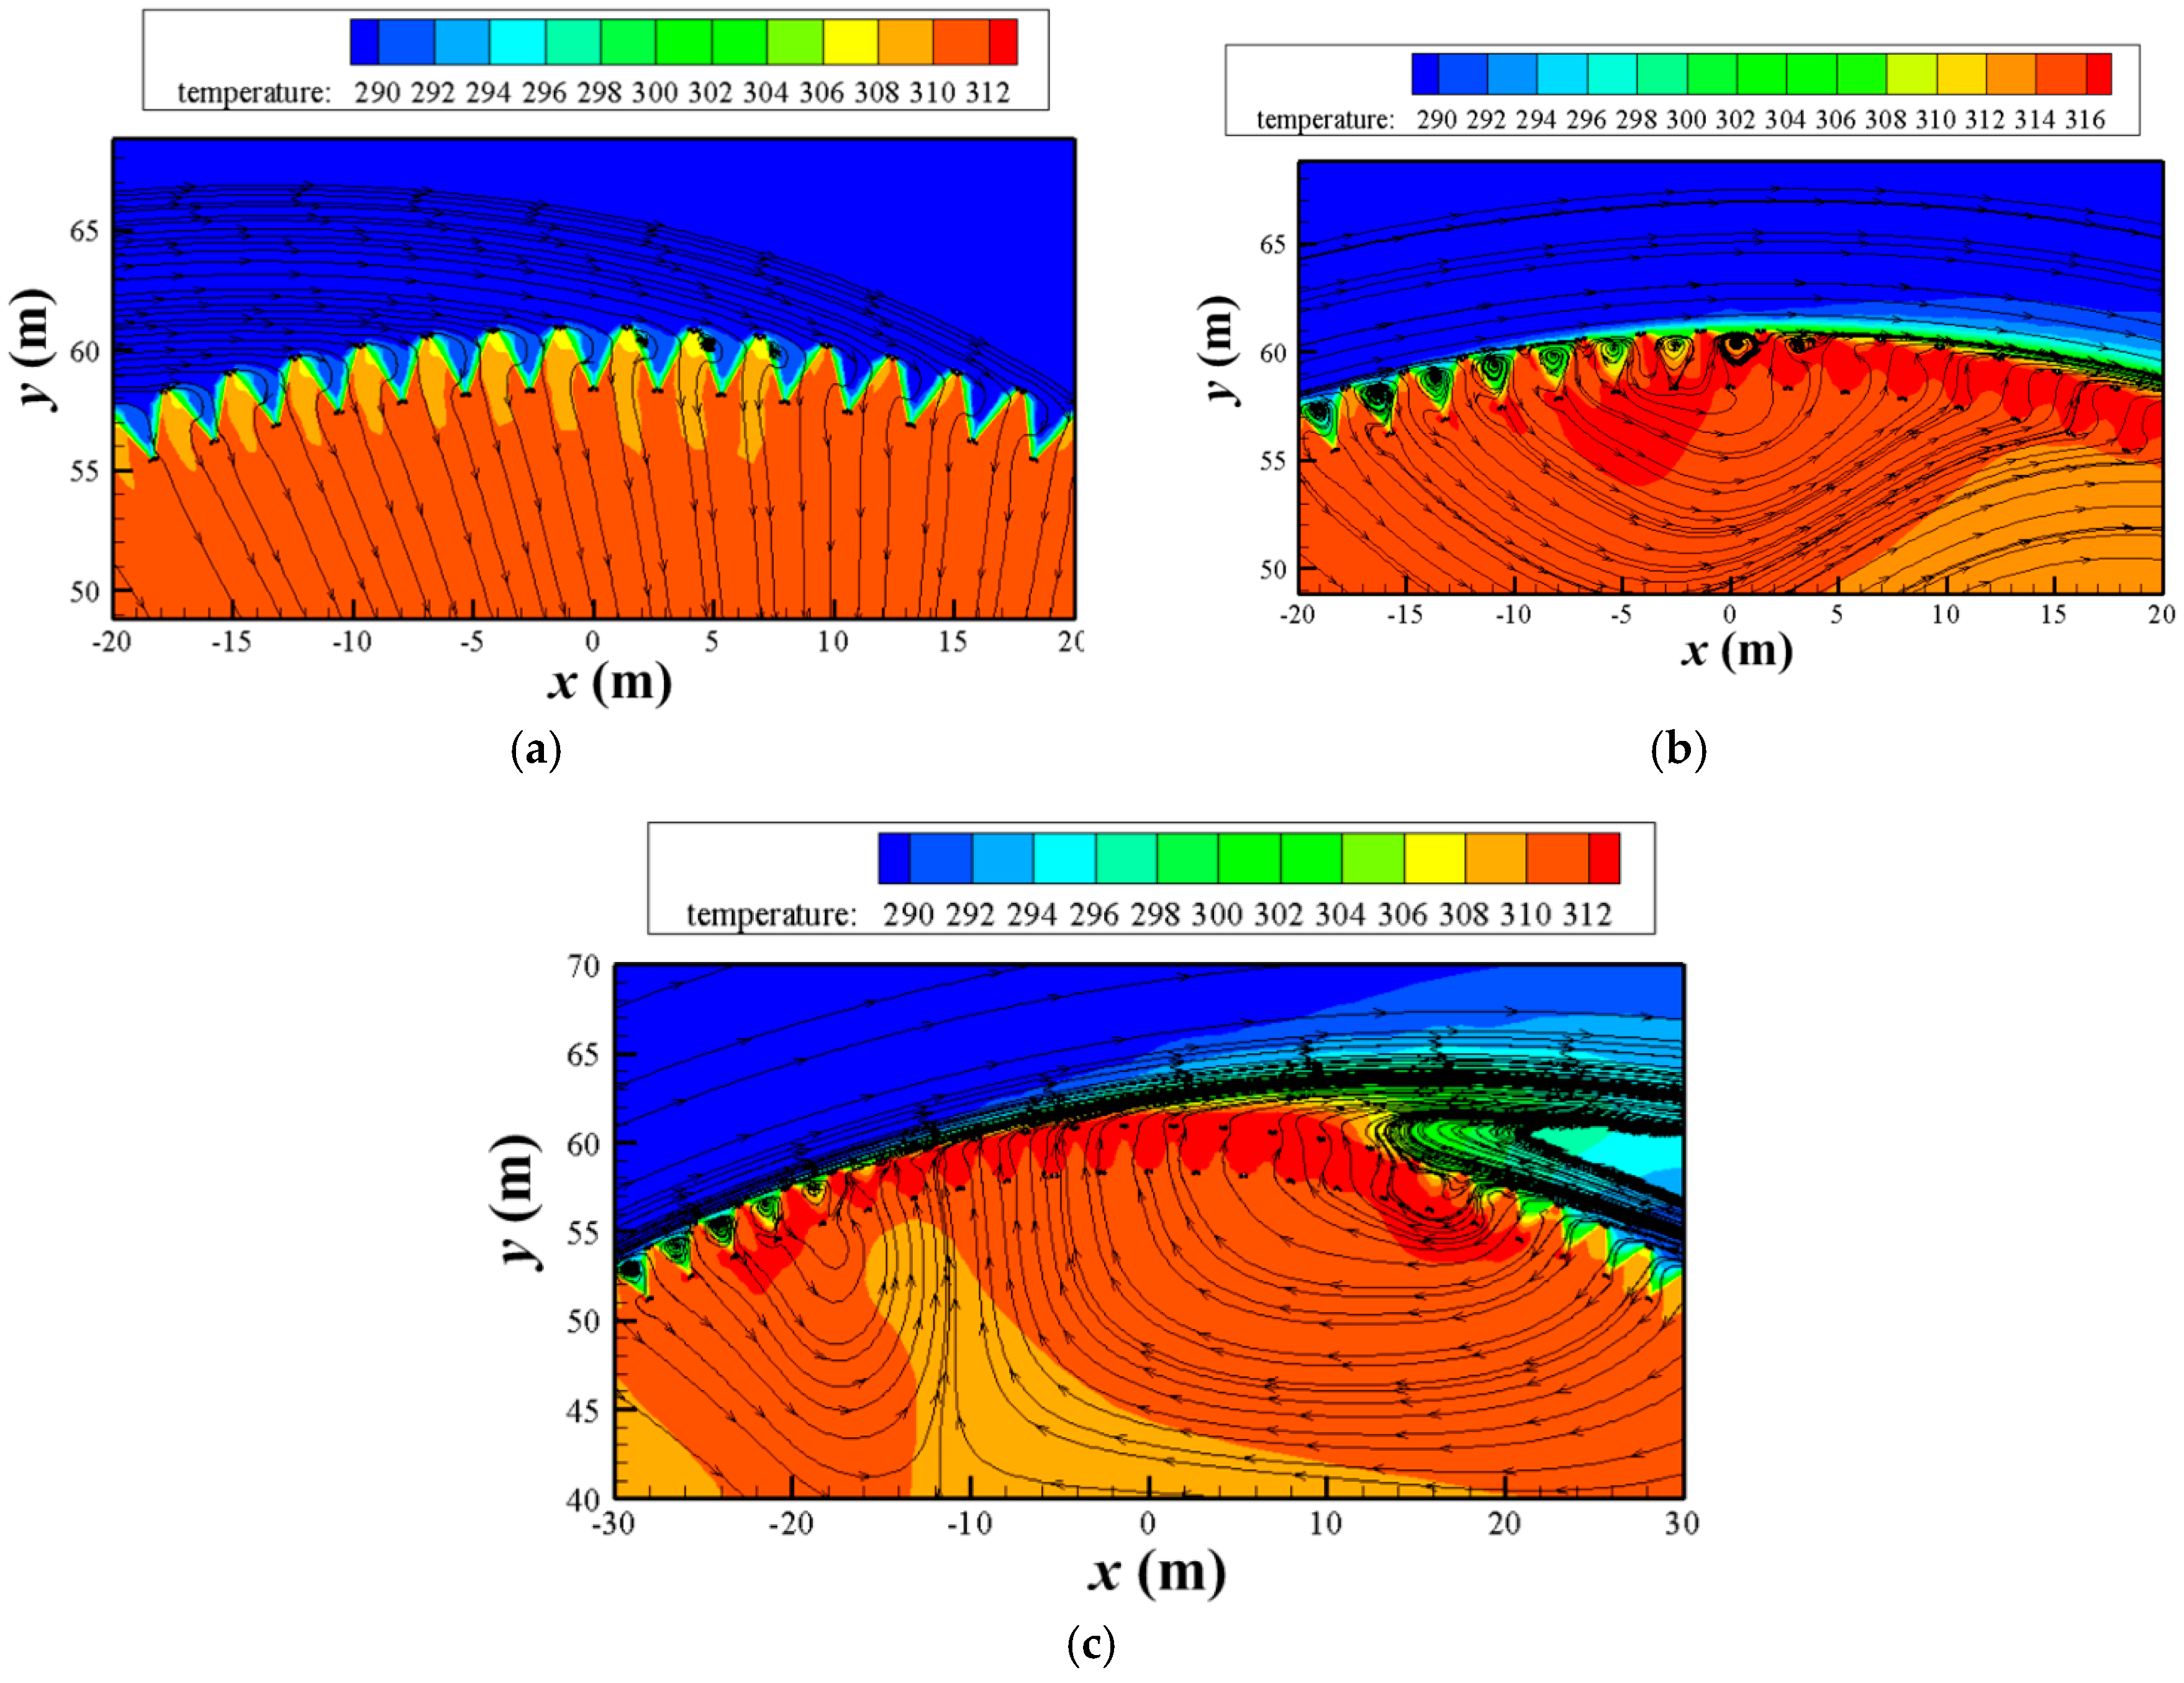
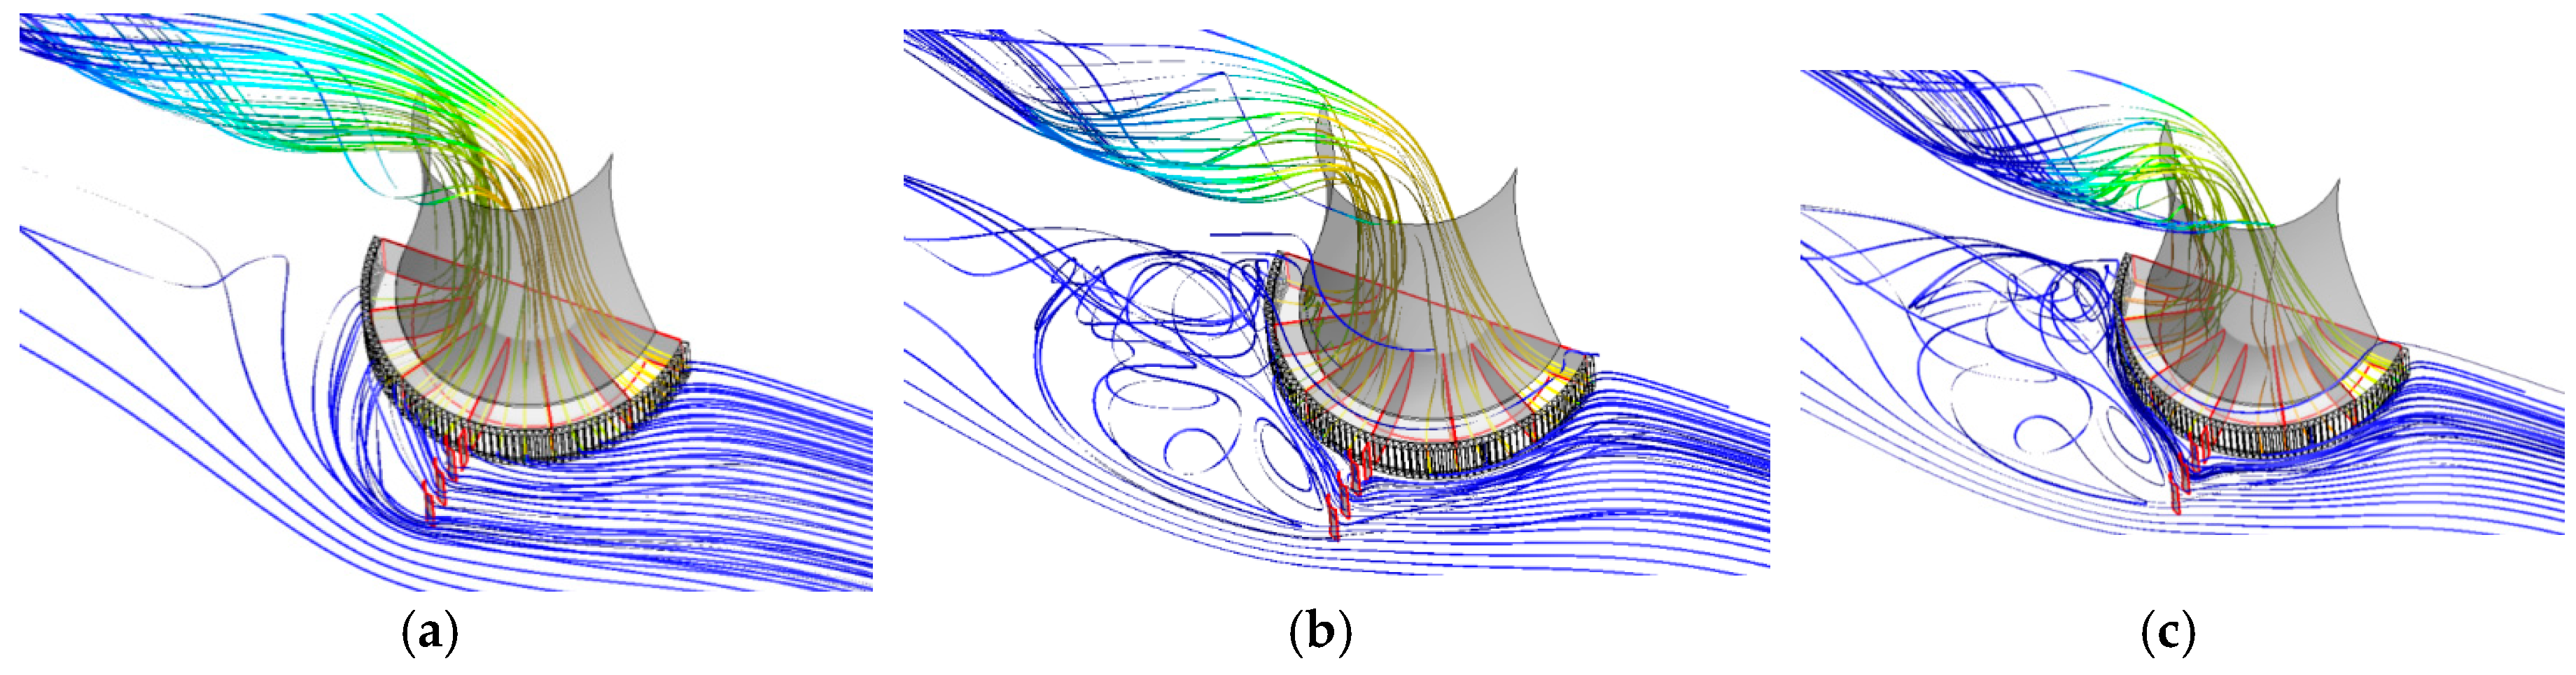
3.1.1. Streamlines

For the conventional dry cooling system of case A, the streamlines at representative wind speeds are presented in Figure 8. Under the small crosswind of 4 m/s, Figure 8a shows that the streamlines around the tower inlet are relatively homogeneous. When the wind speed increases, the high velocity zone is formed near the inlets of lateral cooling deltas just like the flow around a cylinder, which results in a low pressure and a reduced pressure difference between the outside and inside of lateral cooling deltas. As a result, the cooling air fails to flow directly through the lateral sector. What’s worse, the reverse flow may occur and result in more deteriorated thermo-flow performances. Due to the central asymmetry of flow field, the large vortices are generated inside the tower, besides the hot air deviates towards the downstream tower shell as shown in Figure 8b,c.
The flow fields near the lateral cooling deltas are provided in Figure 9. The cooling air flowing through the lateral cooling deltas deviates from incoming direction, and the vortices appear at the inlets of cooling deltas. As the crosswind becomes higher, the hot air from the upstream deltas flows reversely out of the downstream cooling deltas, where the high temperature region is formed, as observed in Figure 9b,c, thus result in a low cooling efficiency. Under the gale crosswind of 20 m/s, the high temperature region moves forward owing to the flow separation happened in the rear cooling deltas.

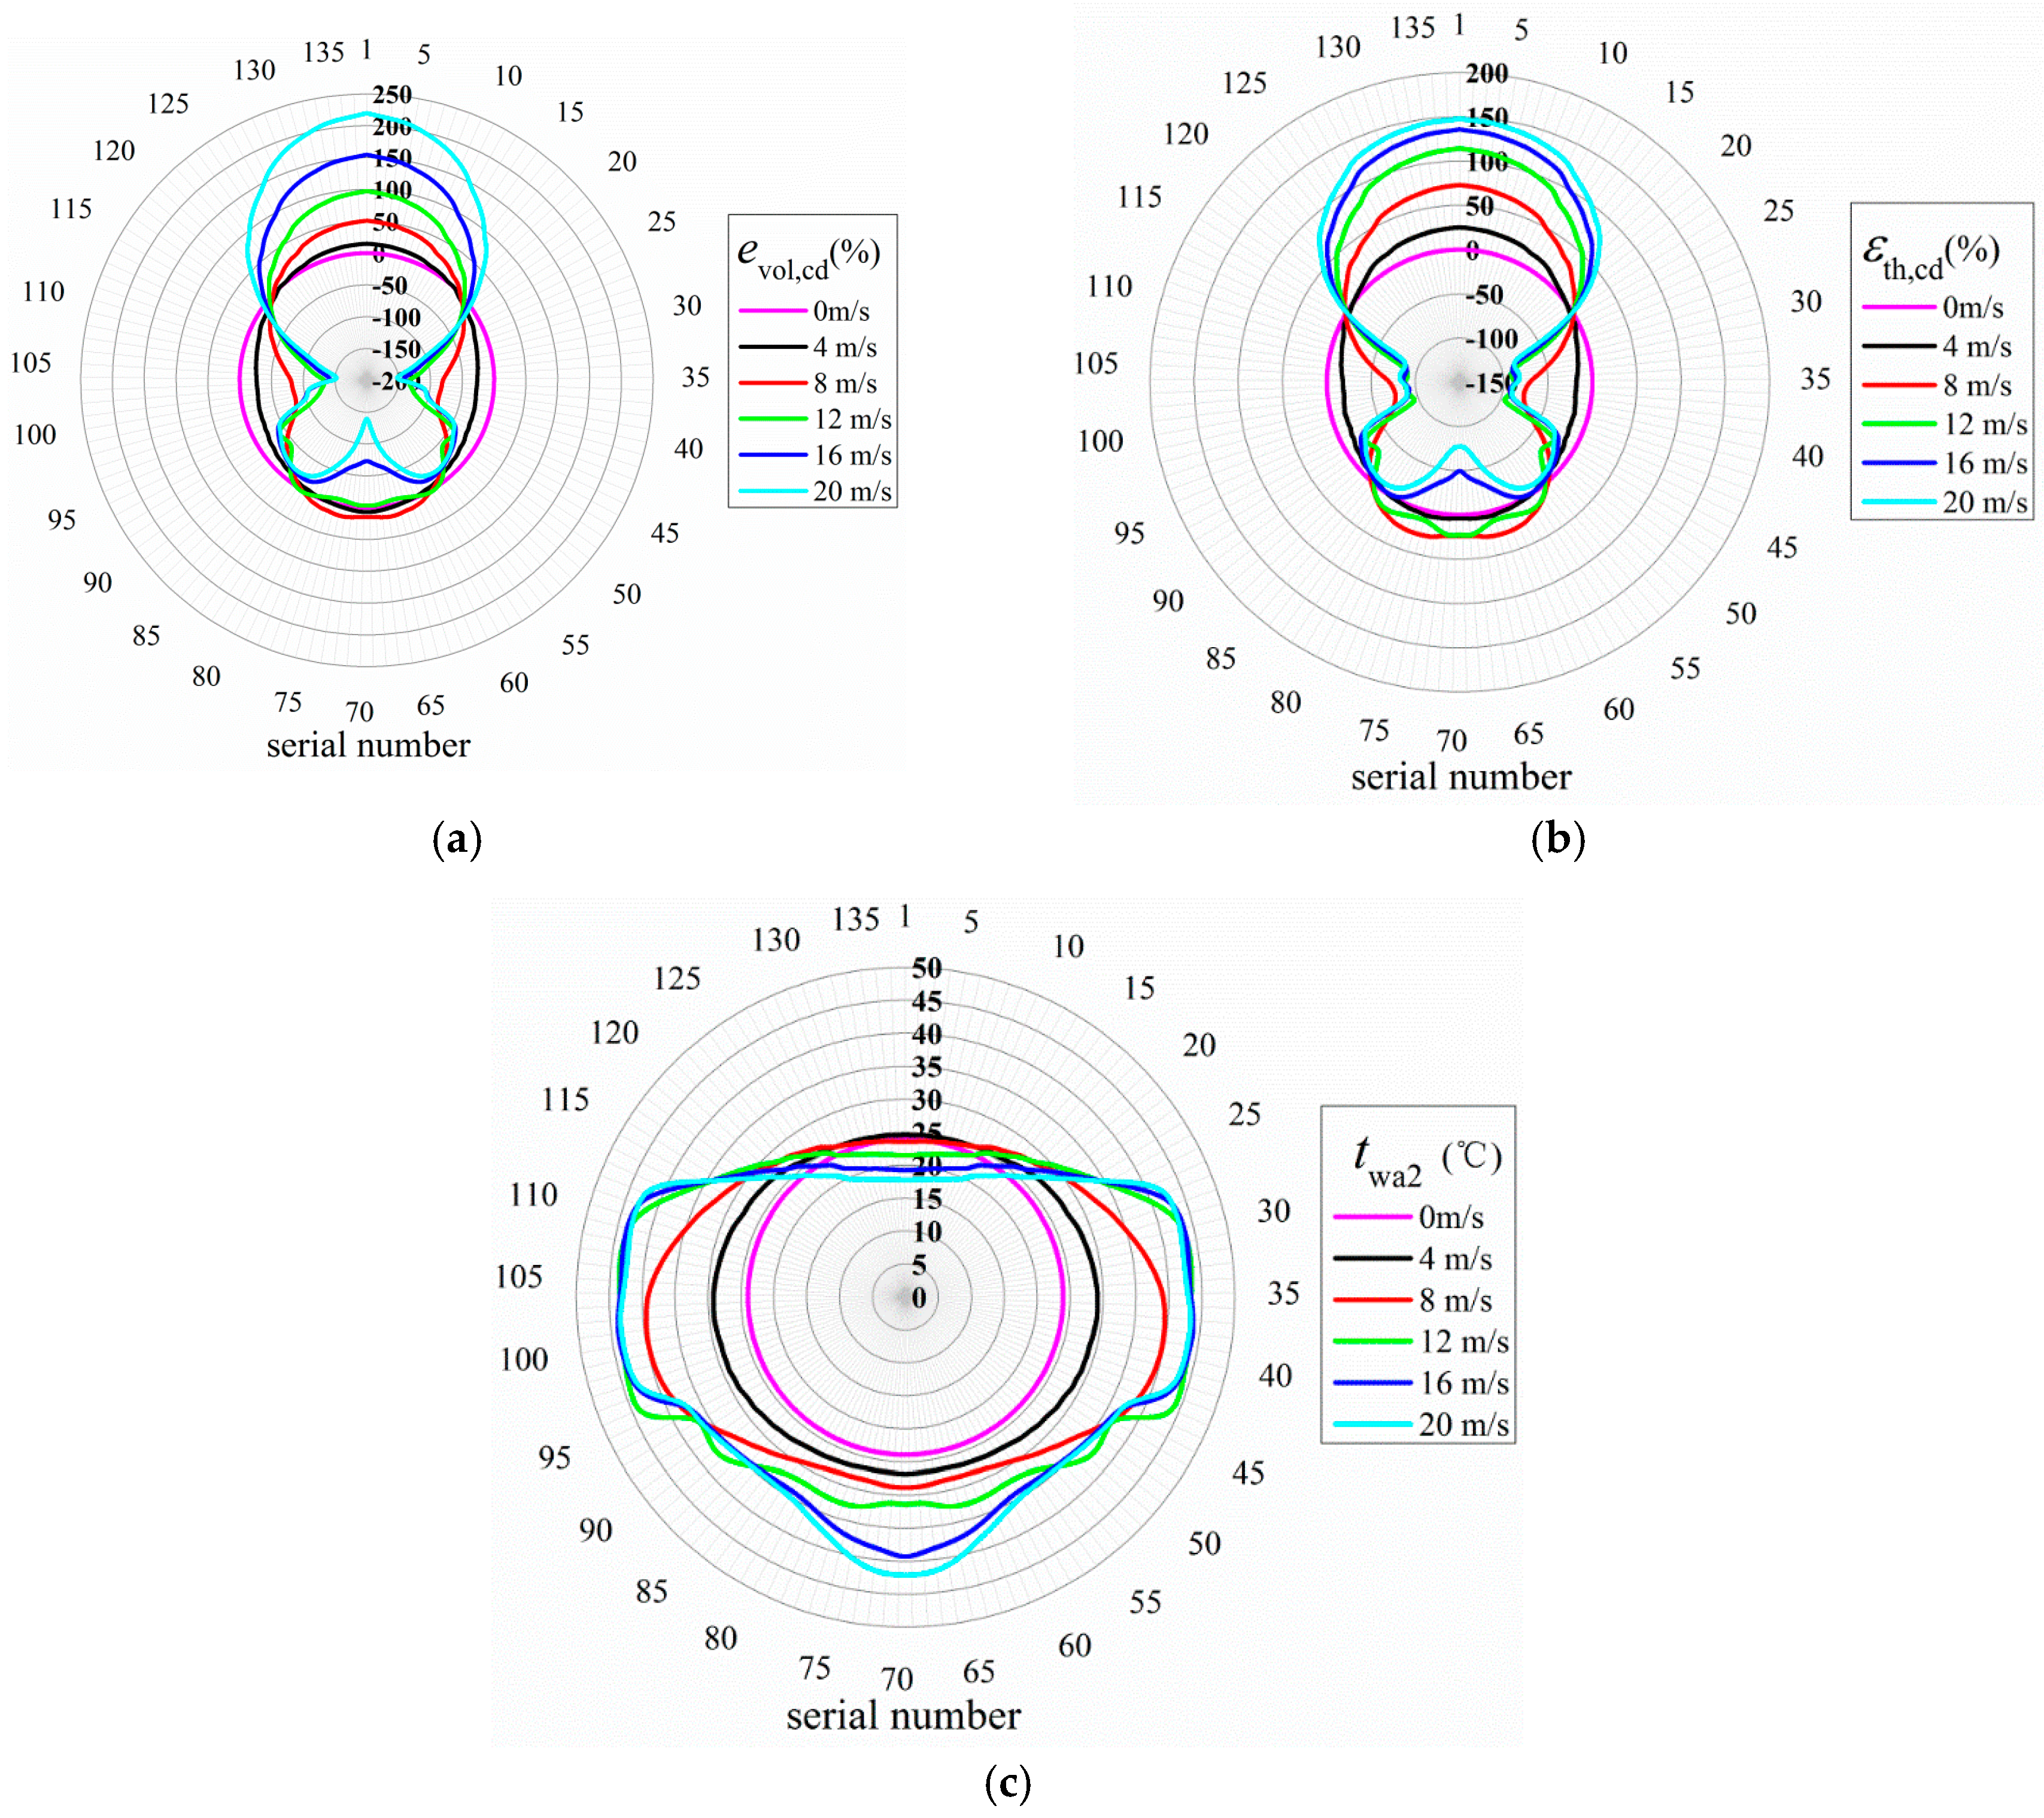
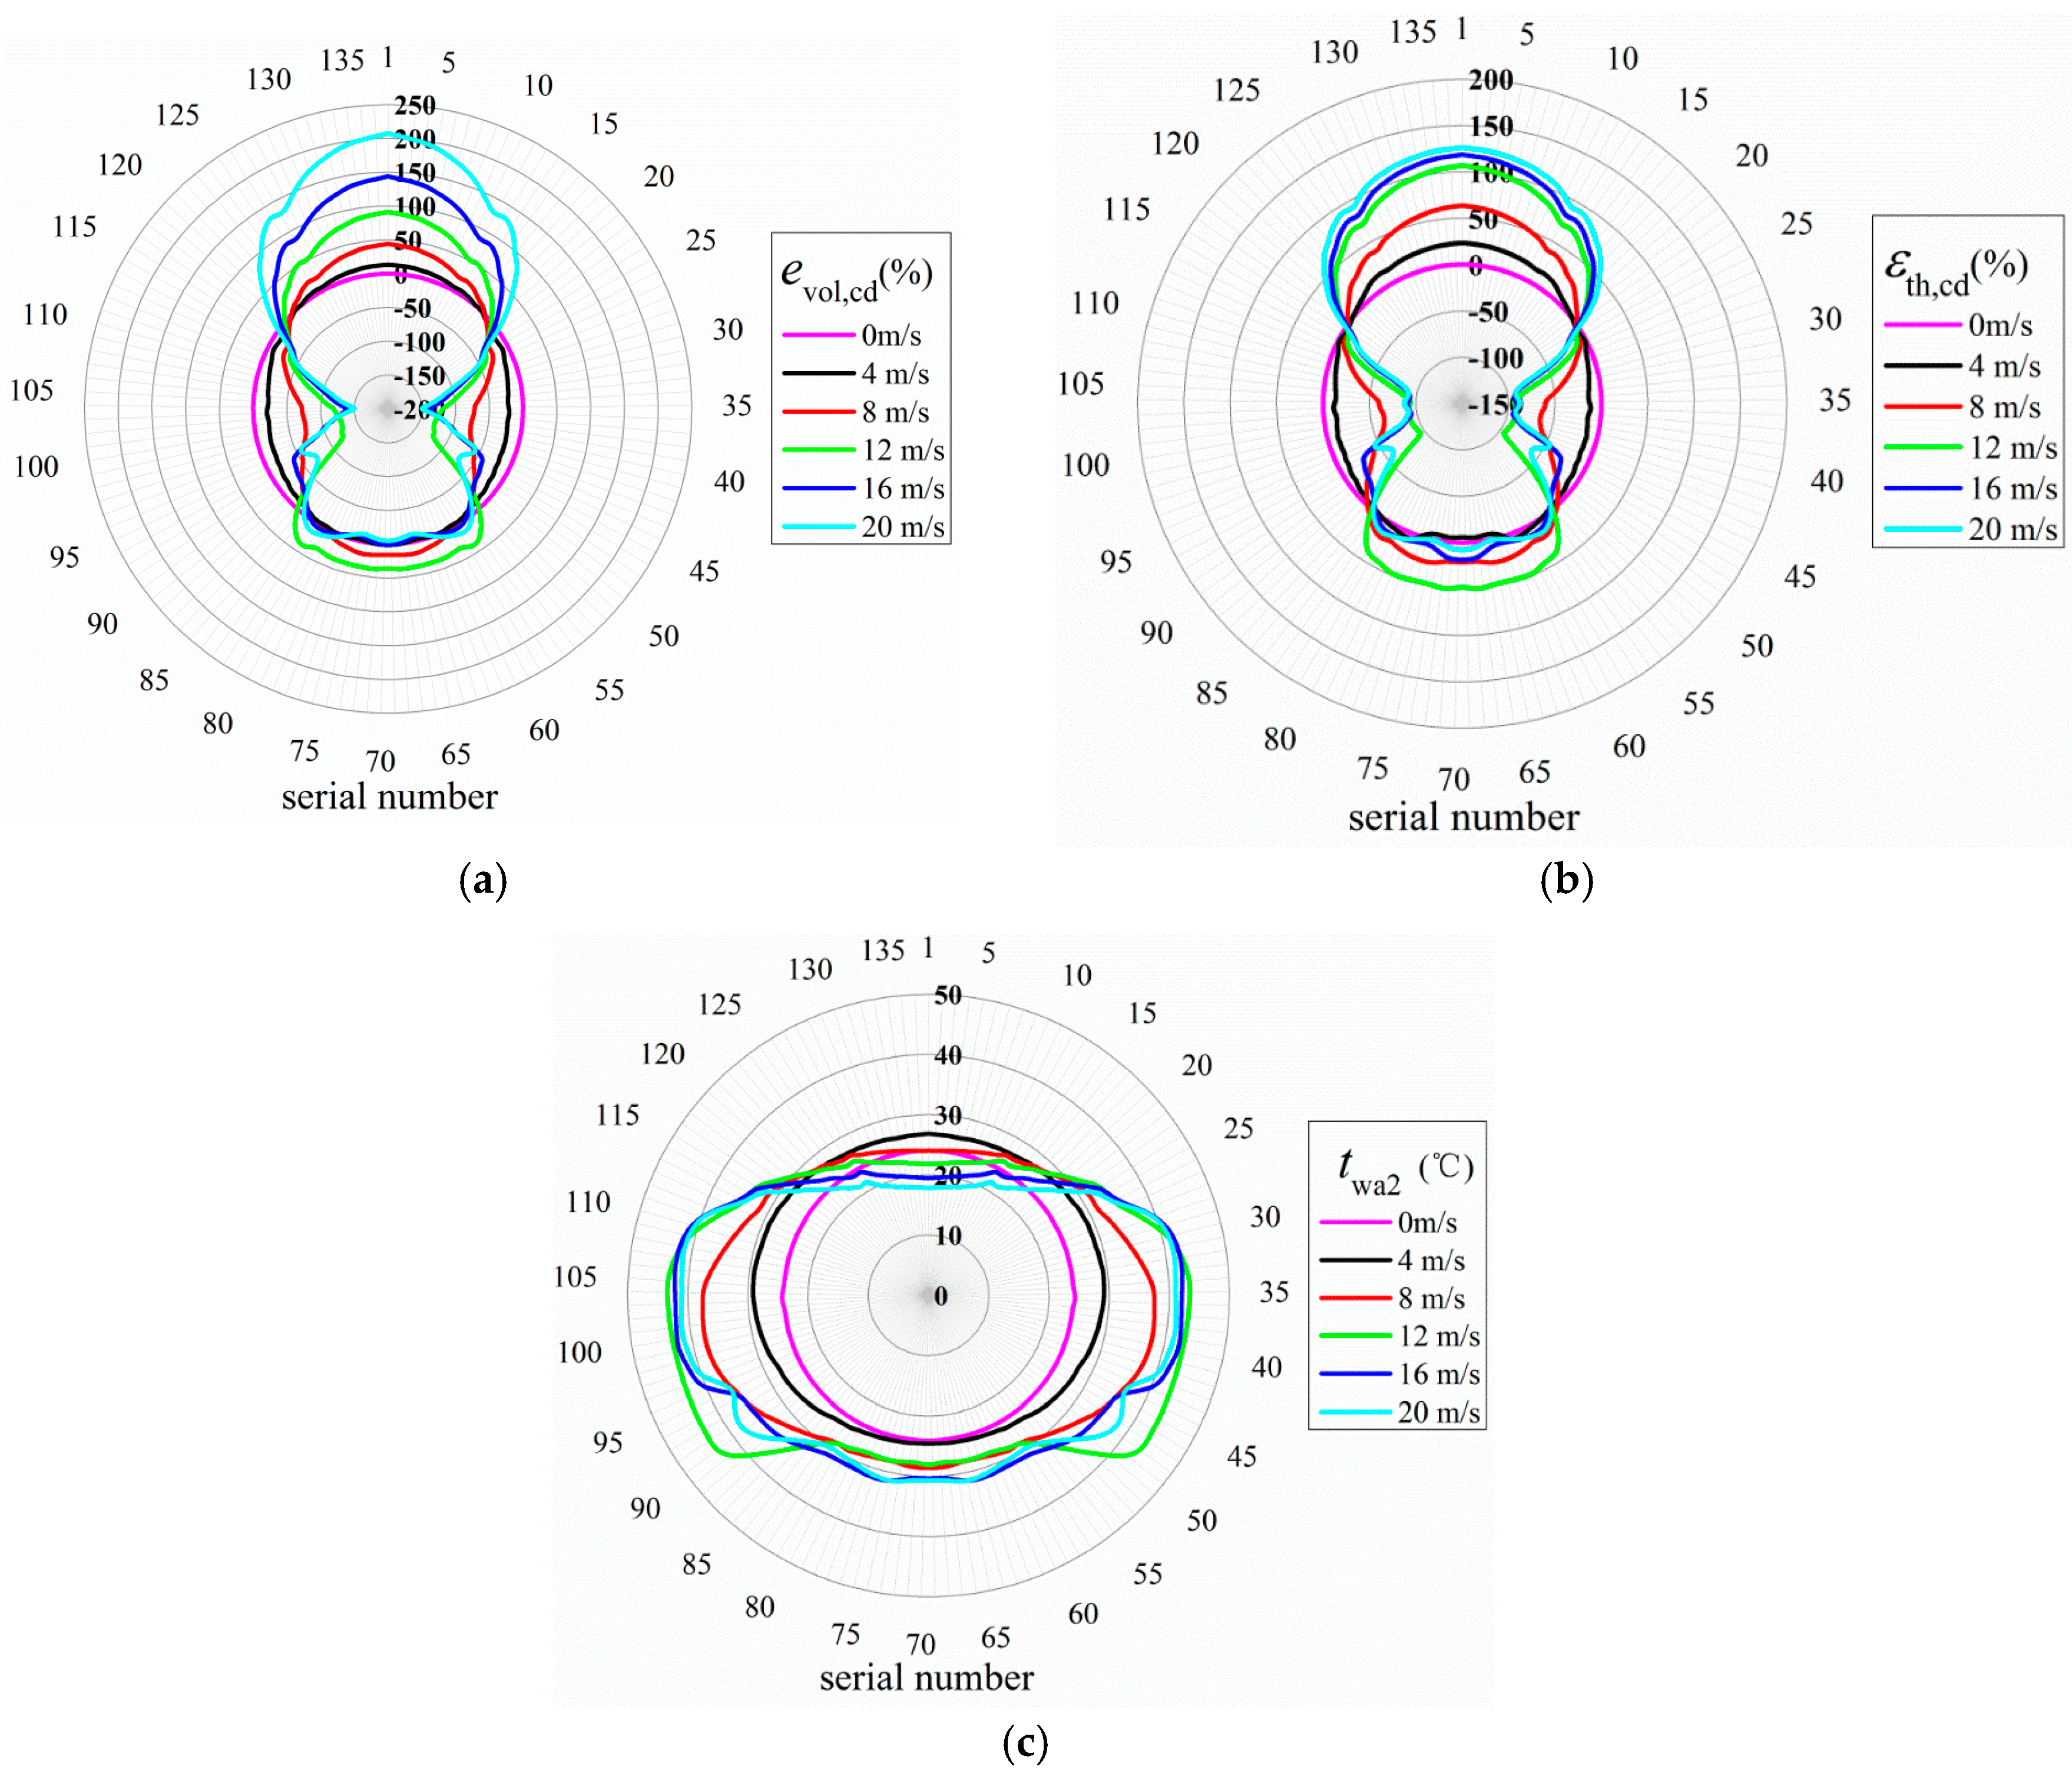
3.1.2. Performances of Cooling Deltas

Aiming at the unfavorable wind effect evaluation, the volume effectiveness of cooling delta evol,cd is proposed and defined as follows:
e vol , cd = V w V 0 V 0 × 100   ( % )
where Vw and V0 are the volumetric flow rates under windy conditions and with no winds.
For the thermal efficiency of cooling delta εth,cd, it is defined as follows:
ε th , cd = Φ w , cd Φ 0 , cd Φ 0 , cd × 100   ( % )
where Φw,cd and Φ0,cd are the heat rejections of cooling delta in the presence and absence of winds.
The volume effectiveness, thermal efficiency and outlet water temperature for all the cooling deltas of case A are presented in Figure 10. If the wind speed increases, the volume effectiveness rises for the frontal deltas, and reaches the maximum value of 216% under the high crosswind of 20 m/s, as illustrated in Figure 10a. For the leeward deltas, the volume effectiveness varies little with a maximum critical value of 15% at the wind speed of 8 m/s, and it decreases even to −139% at 20 m/s due to the penetration flows. The volume effectiveness of the lateral cooling deltas always decreases at all wind speeds, and the lowest value of −148% turns up under 20 m/s resulting from the reverse flows.
From the thermal efficiency distribution shown in Figure 10b, it can be observed that the maximum thermal efficiency arrives at 148% for the fontal cooling deltas at the wind speed of 20 m/s. Due to the deteriorated thermo-flow performances of lateral cooling deltas, the thermal efficiency decreases to below −90% as the wind speed becomes higher than 8 m/s, showing the lateral cooling deltas almost cannot work under gale winds. For the leeward cooling deltas, the thermal efficiency increases slightly at low wind speeds, and reaches a maximum value about 24% at 8 m/s. However, under the extremely high crosswind of 20 m/s, the thermal efficiency becomes as low as −77%.
The outlet temperature of circulating water for each cooling delta is provided in Figure 10c. When without winds, the outlet water temperatures of deltas are basically the same, and equal to 23.94 °C. Along with the increased wind speed, the outlet water temperature of the frontal deltas will decrease to the minimum value of 17.74 °C at 20 m/s. But the outlet water temperatures of lateral deltas increase clearly due to the severe inflow deviation and reverse flows. The values can reach more than 43.54 °C but then stop increasing when the crosswind becomes higher than 12 m/s. As for the leeward cooling deltas, the outlet water temperature increases gradually with increasing the wind speed and it reaches a maximum value of 42.12 °C at 20 m/s.
The aforementioned results show that, the performances of the fontal cooling deltas are enhanced with crosswinds, while they suffer a severe deterioration for the lateral ones. Thus, the air leading strategies are recommended to form a favorable flow field for NDDCS.

3.2. With Air Leading Strategies
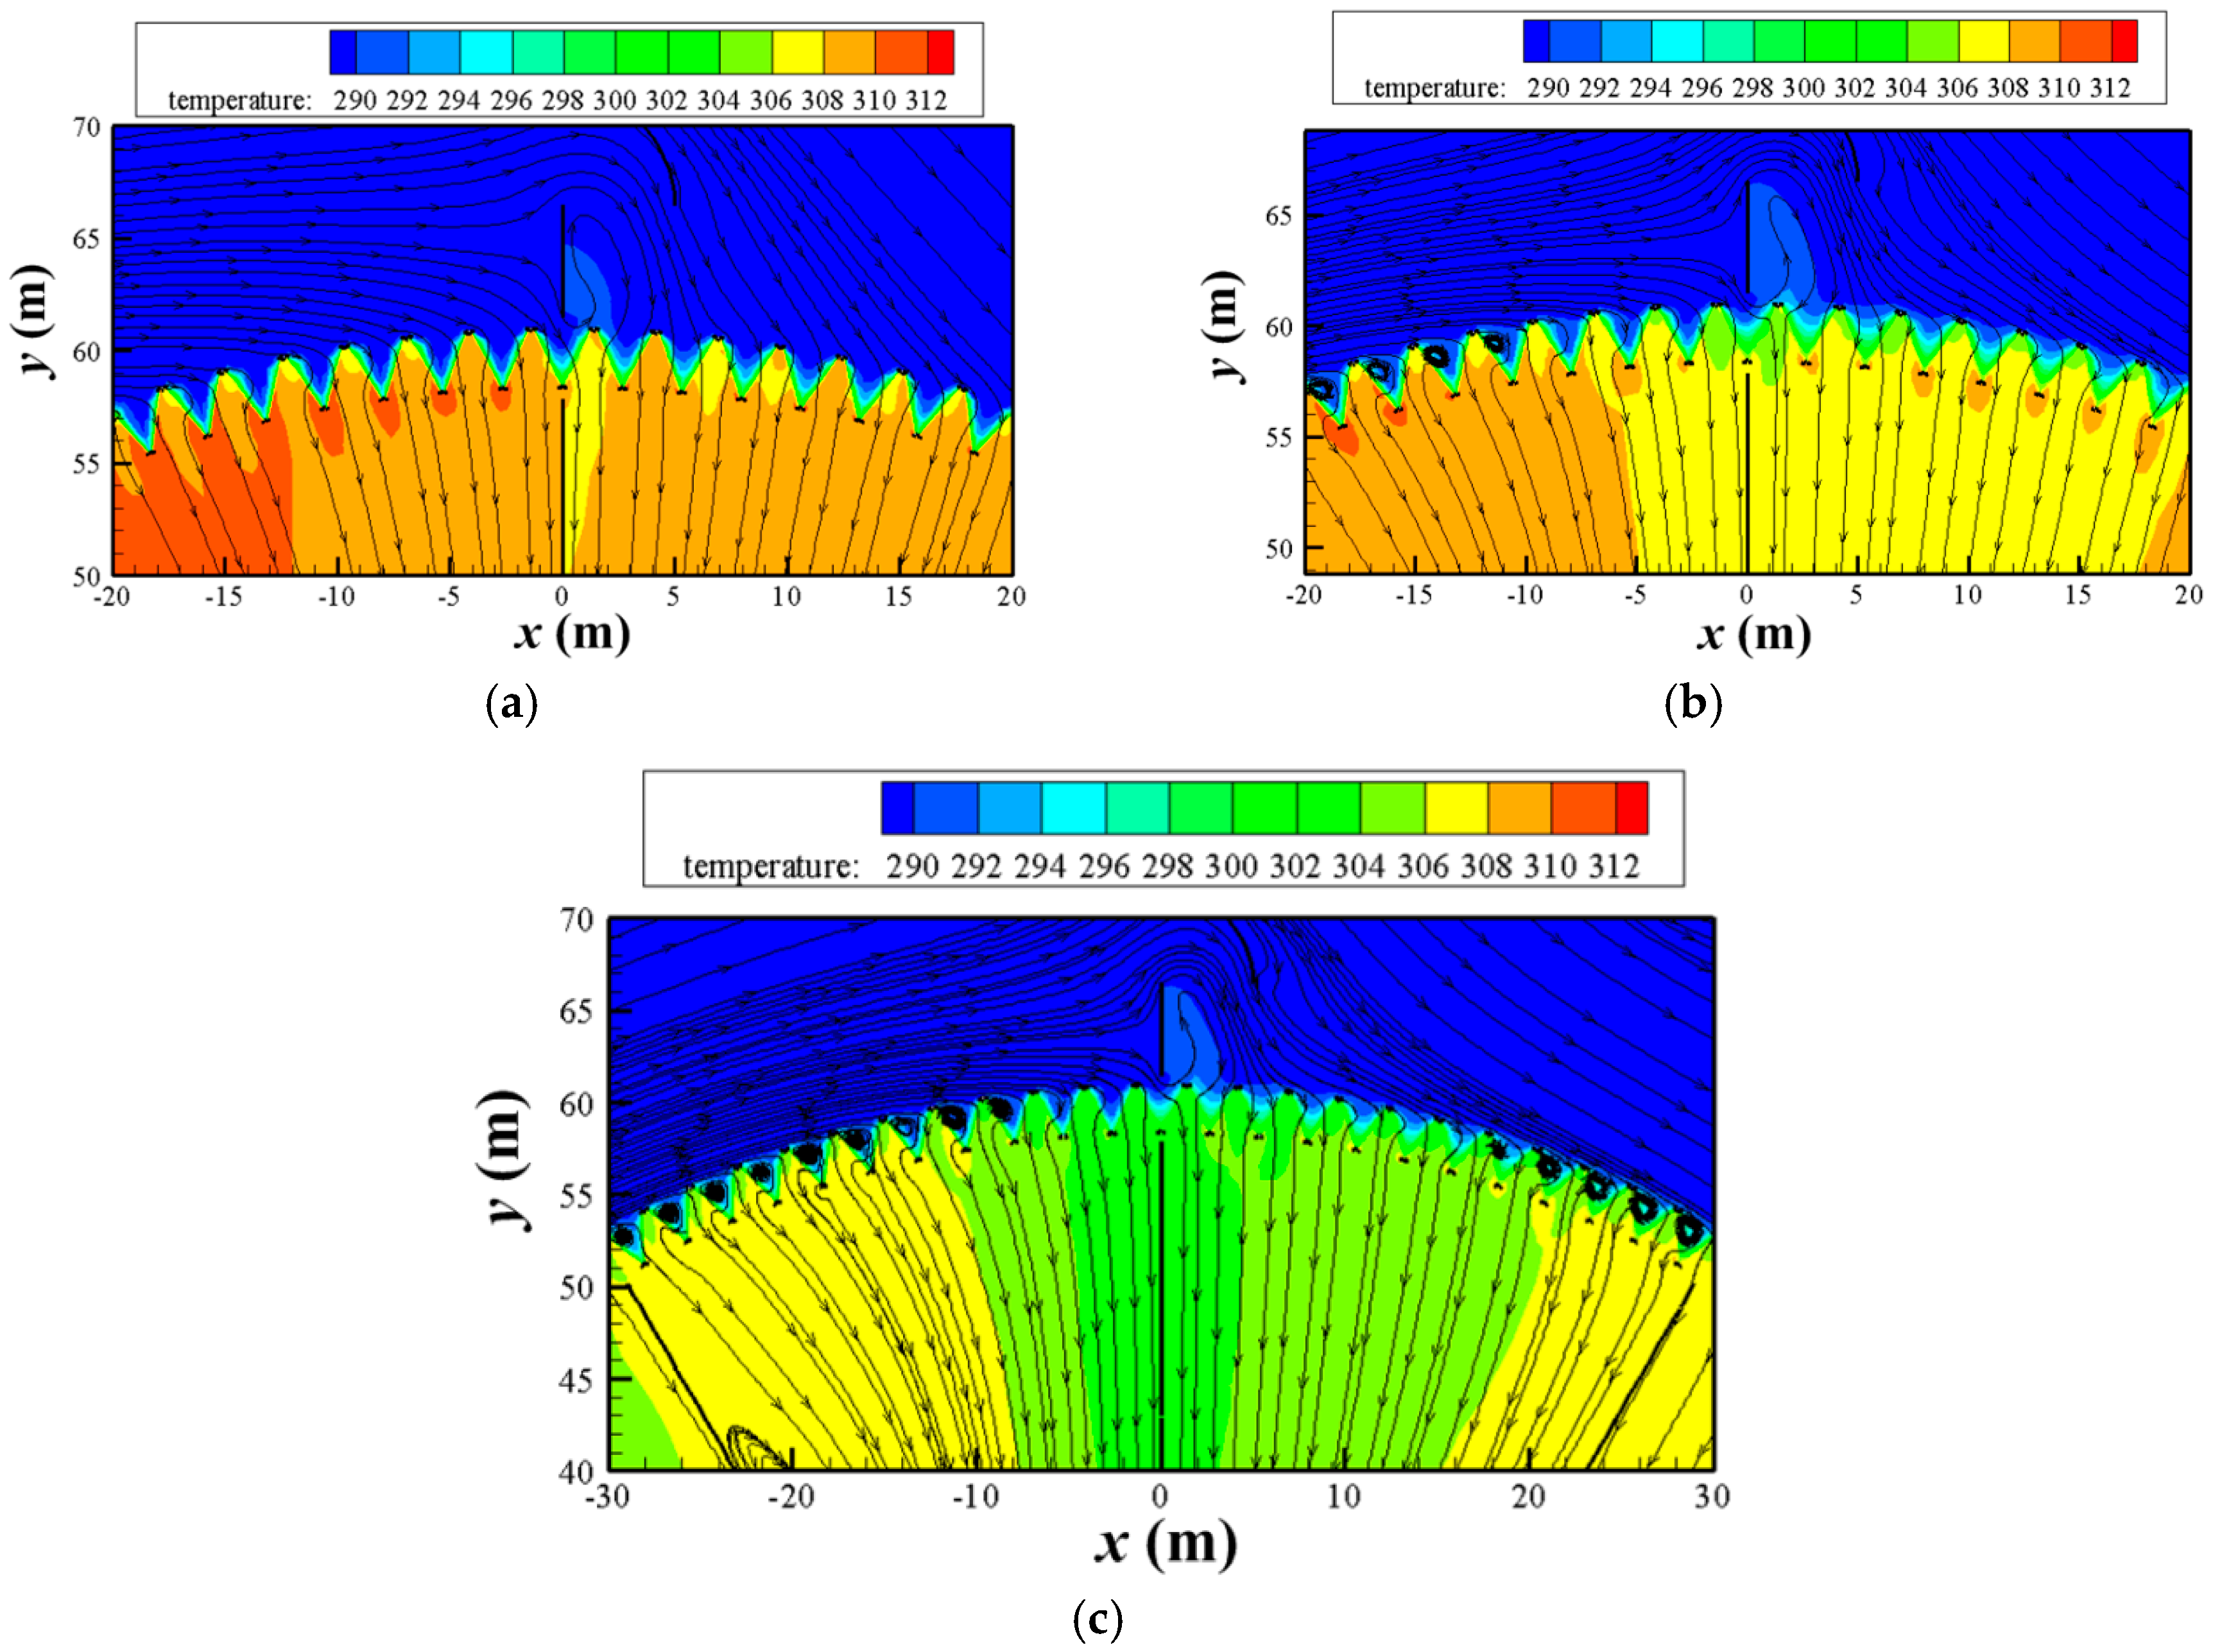
3.2.1. Streamlines

As an example, the air flow fields for case D combining case B and case C are displayed in Figure 11 and Figure 12. The air flows inside the tower are well organized in Figure 11, the hot air out of the heat exchanger is led by the central rounded frustum to flow smoothly through the dry-cooling tower. At high wind speeds, the large vortices are broken by the air leading baffles and frustum. What’s more, the incoming air flows at high wind speeds are decelerated and gathered towards the air-cooled heat exchanger by the outer leading baffles. From the detailed flow fields near the lateral cooling deltas, it can be seen from Figure 12 that the incoming air flow is induced towards the entrance of cooling deltas by the outer air leading baffles, which weakens the inflow deviation.

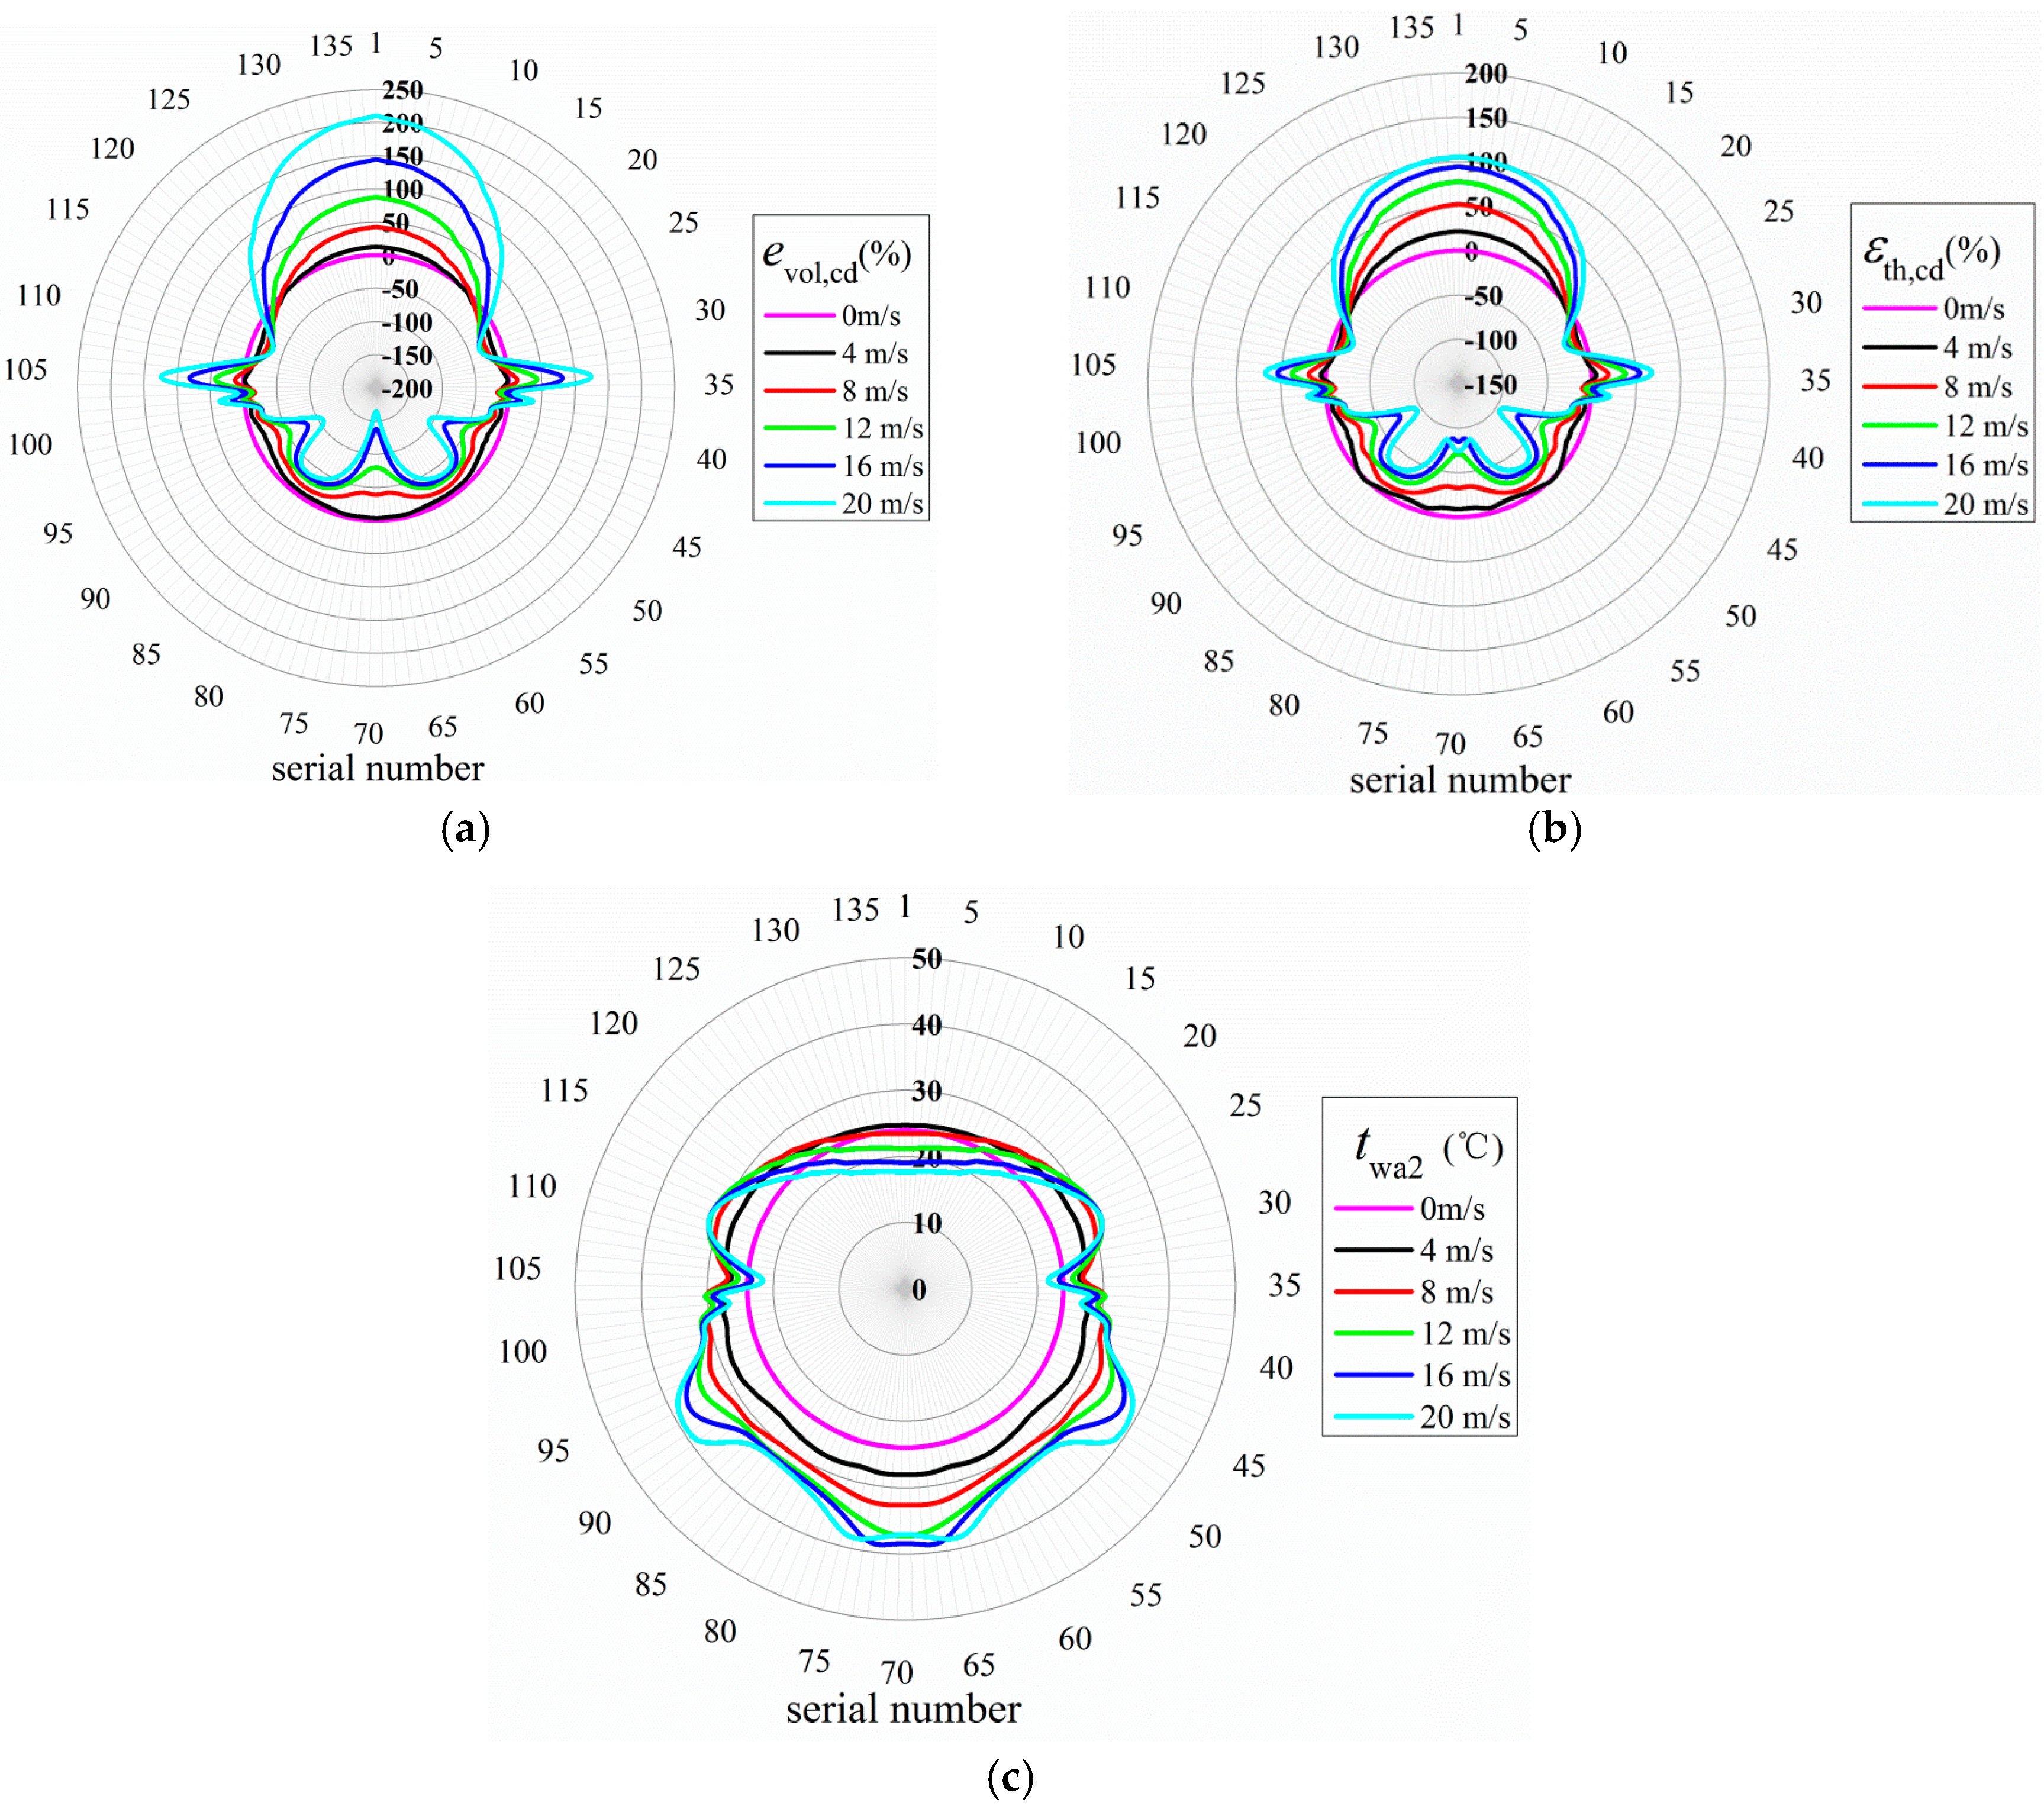
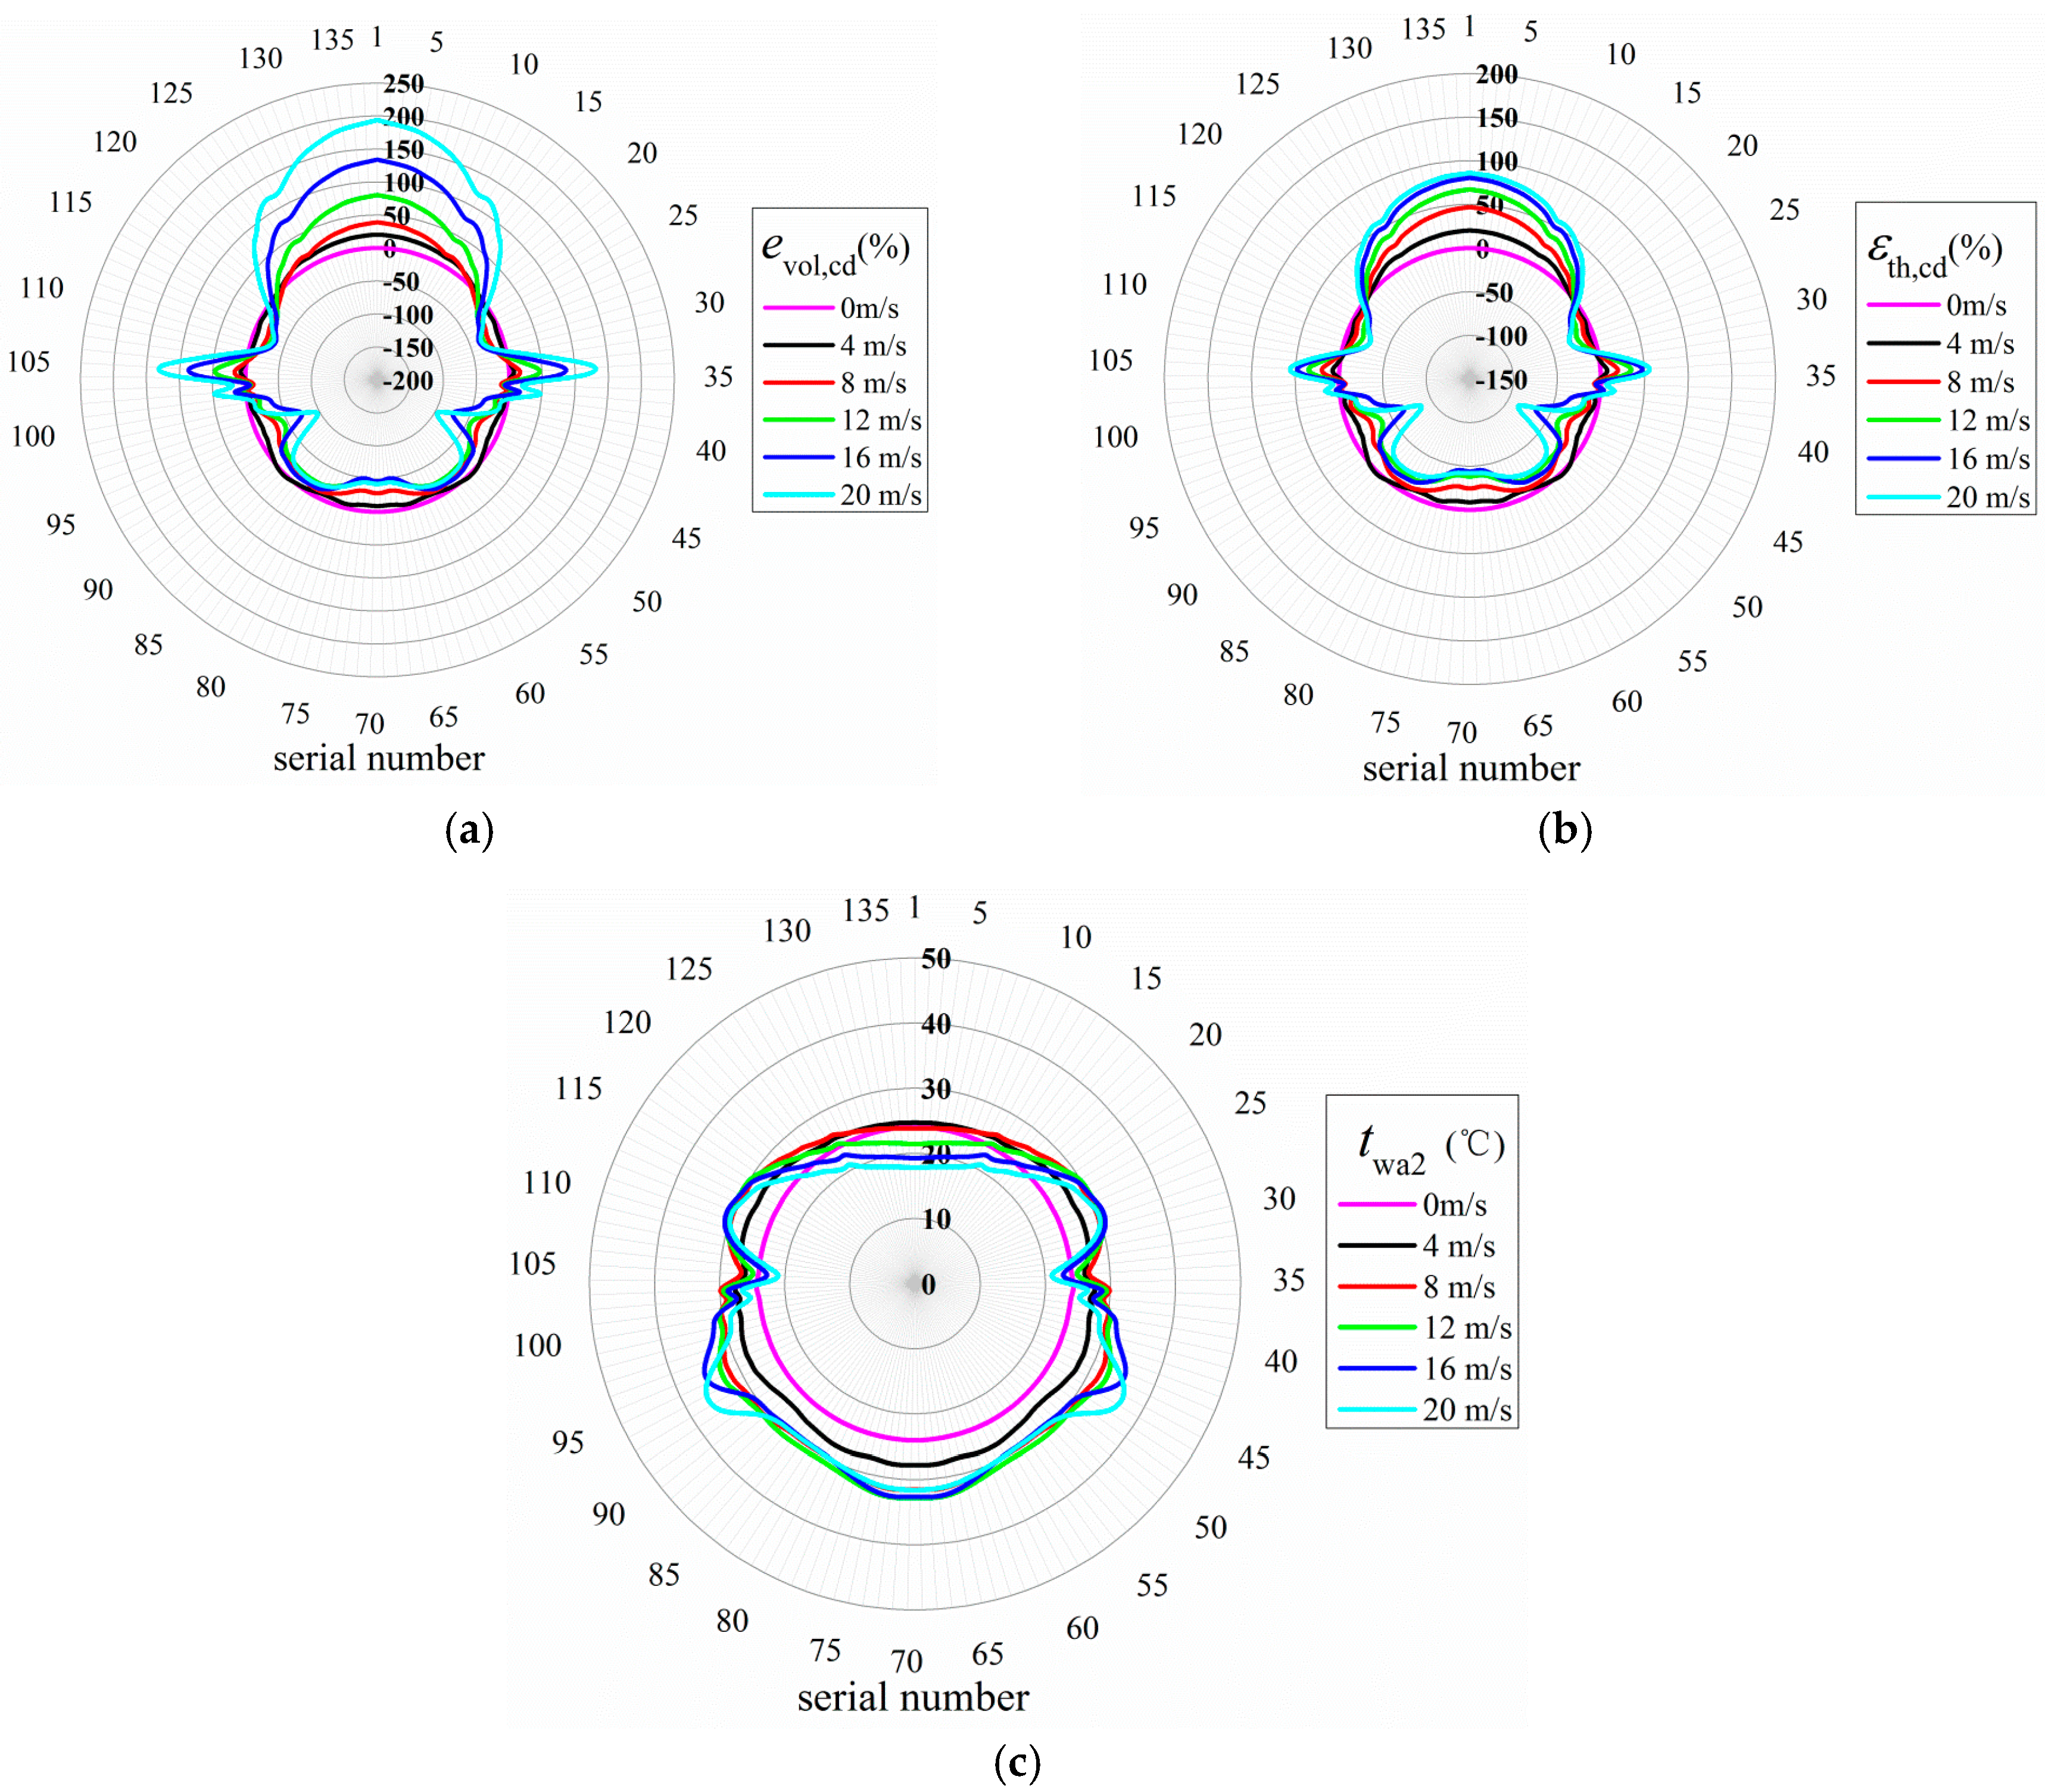
3.2.2. Performances of Cooling Deltas

The thermo-flow performances for case B with only inner rounded frustum and flat leading baffles are shown in Figure 13. Compared with case A, it can be seen that the variations of the related parameters for the frontal and lateral cooling deltas are basically the same, but they are clearly enhanced for the leeward cooling deltas. As shown in Figure 13a, the volume effectiveness of the leeward cooling deltas is improved at all wind speeds, and it reaches −4.67%, increased by even about 134% at 20 m/s. Accordingly, the thermal efficiency of these cooling deltas arrives at 7.82%, improved by 84.8% as displayed in Figure 13b, and the corresponding outlet water temperature reaches 30.6 °C, declined by 11.5 °C, as disclosed in Figure 13c. In summary, the flow field inside the tower shell is well organized by the inner air leading strategy, and the penetration flows at the leeward cooling deltas are eliminated. Furthermore, the thermo-flow performances of NDDCS get recovered significantly under high crosswinds.
With respect to case C, only the outer three arc leading baffles and one flat baffle are installed at the lateral of the large-scale heat exchanger, by which the strong incoming air flows at the lateral region are decelerated and induced towards the entrance of the cooling deltas. Figure 14 explains the volume effectiveness, thermal efficiency, and outlet temperature of circulating water along the circumference of heat exchanger. Compared with case A, the related parameters for the frontal and leeward cooling deltas are reduced a little under windy conditions, but they are conspicuously enhanced for the lateral cooling deltas. As shown in Figure 14a, the volume effectiveness of the lateral cooling deltas significantly increases while it decreases a little for the frontal and leeward cooling deltas. Under increased crosswinds, the volume effectiveness of the lateral cooling deltas becomes bigger with the maximum value of 138% at 20 m/s. Moreover, the volume effectiveness is basically positive, showing that the reverse flows are well restrained. Correspondingly, with more cooling air flowing through the lateral cooling deltas, the thermal efficiency reaches 74.3%, improved by about 157% as shown in Figure 14b, but for the frontal and leeward cooling deltas, the thermal efficiency is reduced compared to that of case A, resulting in a much more uniform thermal efficiency distribution. As shown in Figure 14c, the outlet water temperature of the lateral cooling deltas decreases conspicuously, and the minimum value of 20.95 °C turns up under 20 m/s. Conclusively, the heat loads of lateral deltas are recovered prominently with the air leading strategy case C, and the performance distributions become more uniform although the frontal and leeward cooling deltas suffer from the wind effects a little more.
The numerical results for case D are displayed in Figure 15, in which more uniform distributions of related parameters are generated. The thermo-flow performances for the combine air leading structures are superior to each single one. From Figure 15a it can be concluded that the volume effectiveness of the leeward or lateral cooling deltas is enhanced significantly compared with case A, especially under high crosswinds. At 20 m/s, the volume effectiveness of the lateral cooling deltas reaches 144.4%, increased by even about 292%, and it arrives at −42.3%, increased maximally by 97% for the middle leeward cooling deltas, but for the frontal cooling deltas, the volume effectiveness is 194%, decreased maximally by 22%. Accordingly, as presented in Figure 15b, the thermal efficiencies of the middle leeward and lateral cooling deltas arrive at −41.9% and 61.4% respectively, increased by 35% and 144% compared with case A, while it reaches 86% for the frontal cooling deltas, decreased by 62%. As shown in Figure 15c, the outlet circulating water temperatures of the middle leeward and lateral deltas reach 20.4 °C and 31.6 °C, decreased by 23.1 °C and 10.5 °C respectively compared with case A. It shows that the air leading strategy of case D combines the advantages of case B and C, thus is preferentially proposed for NDDCS in power generating units.

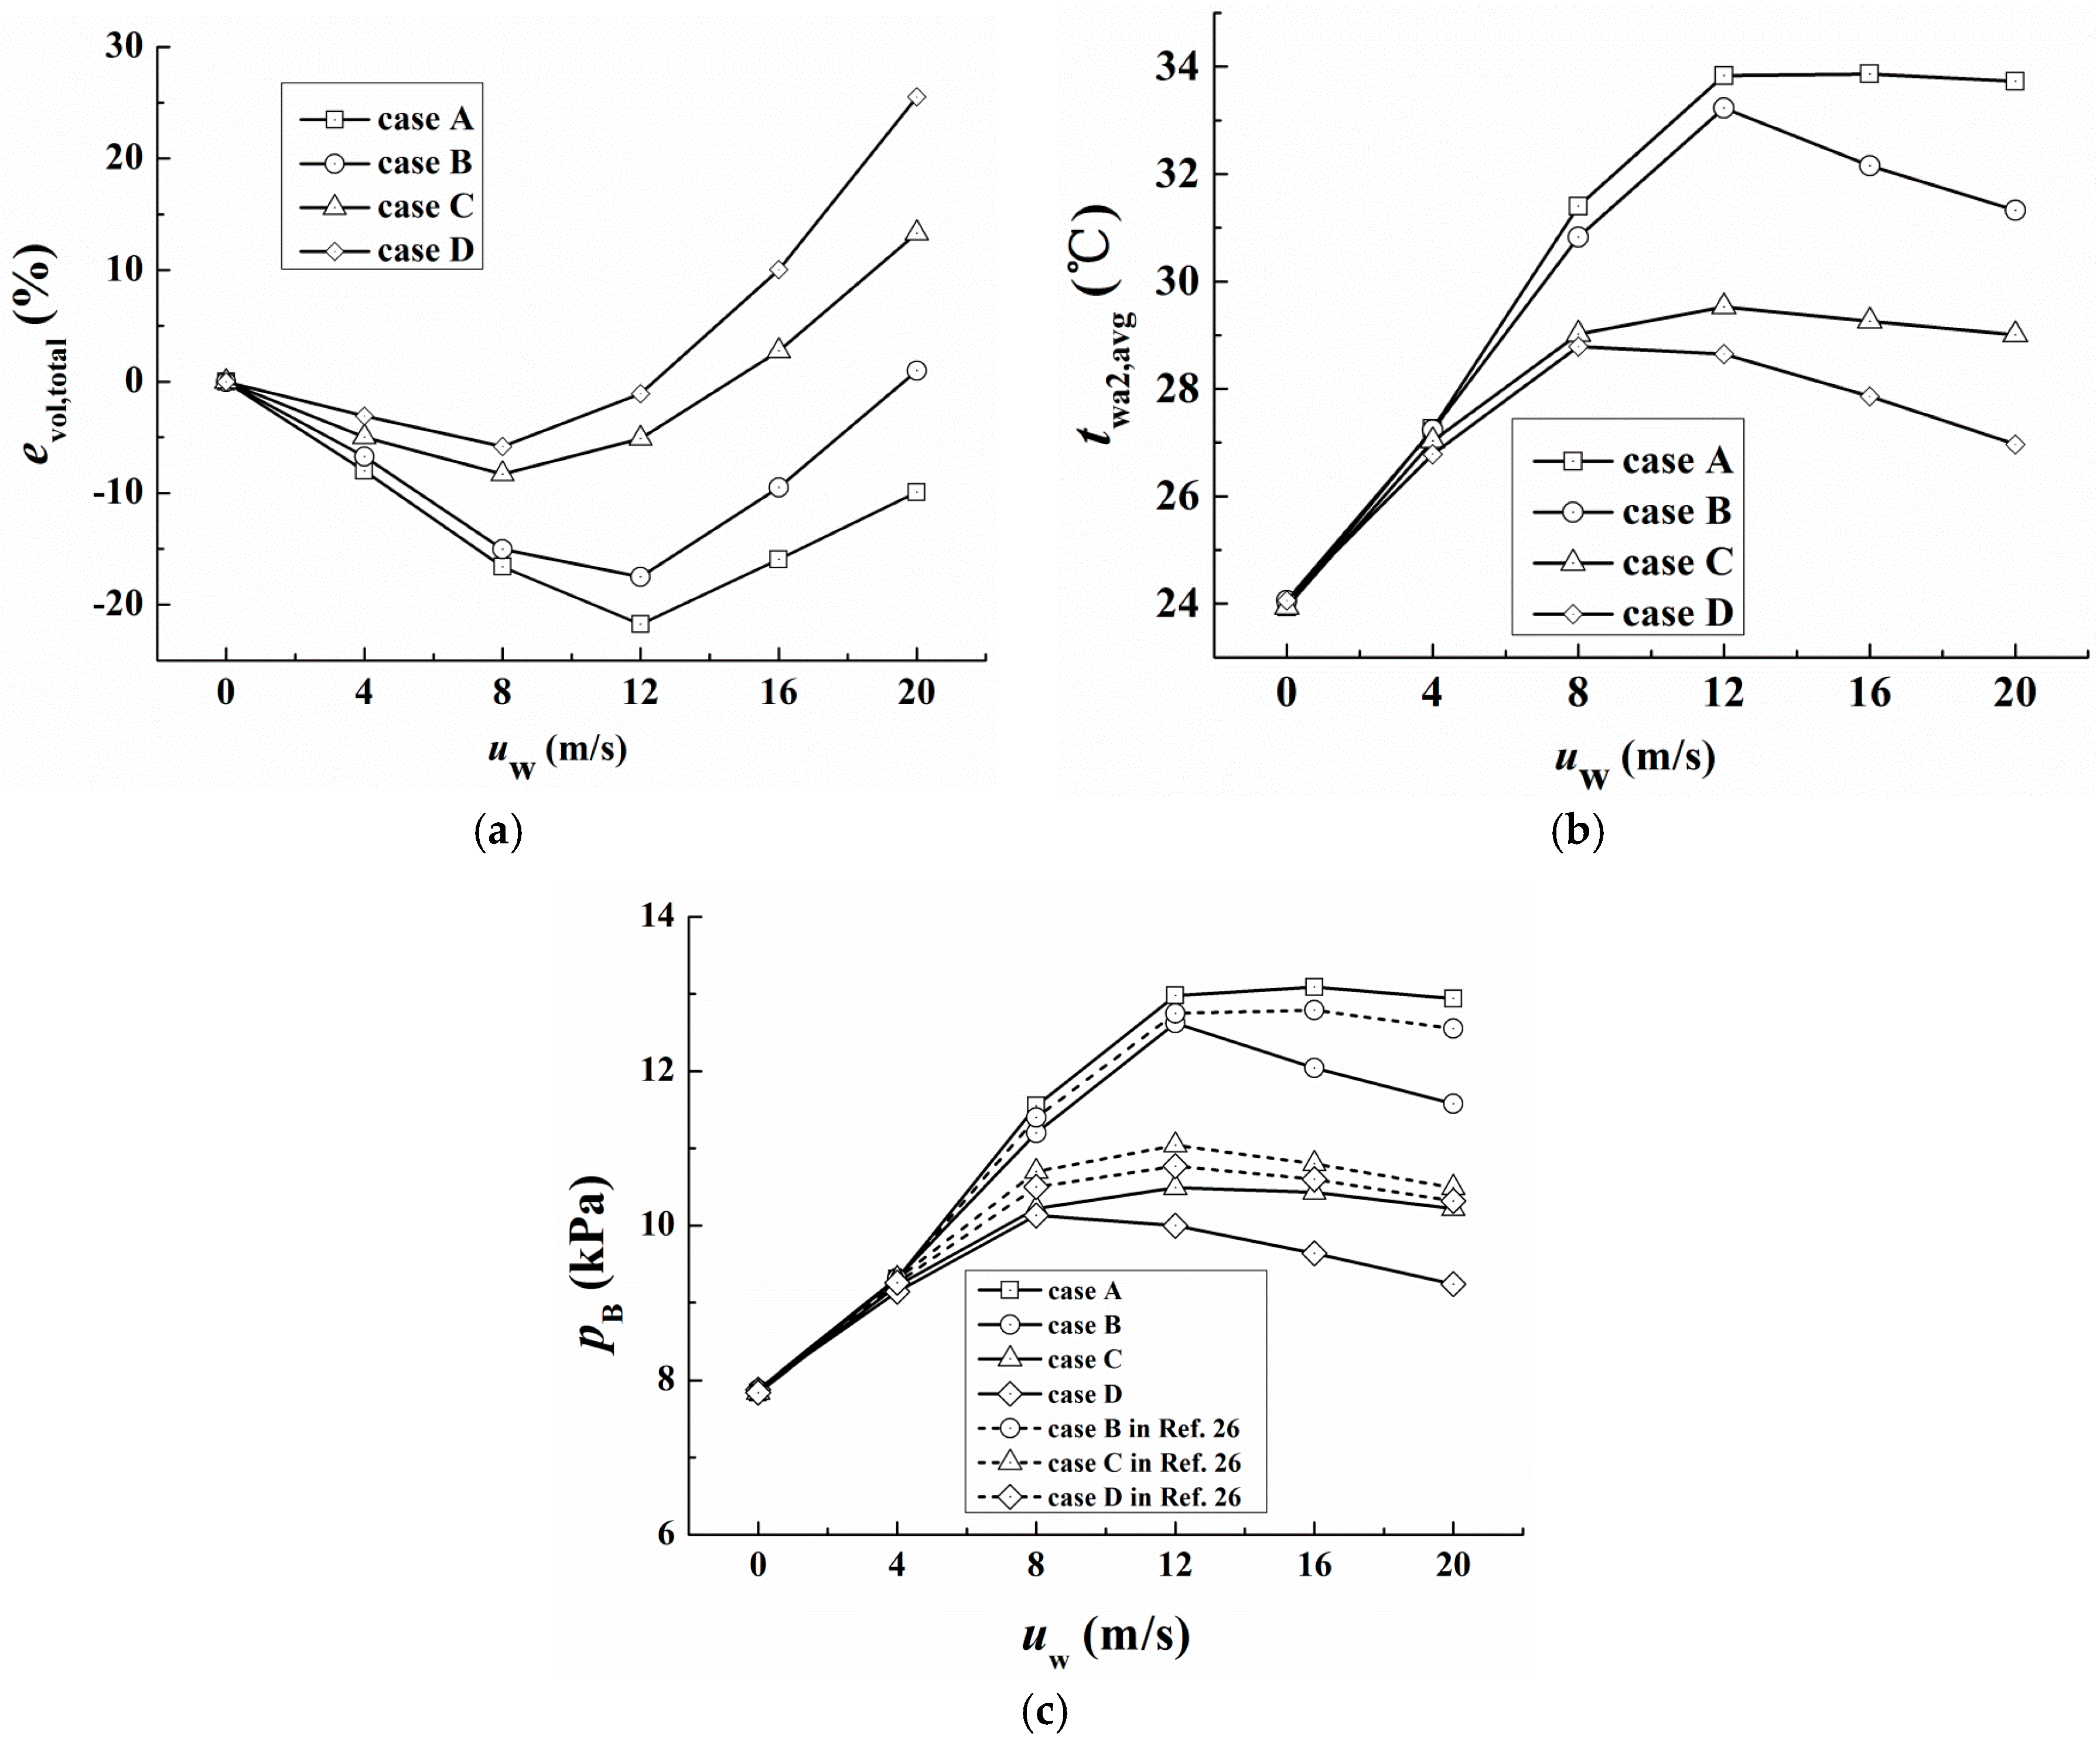
3.3. Overall Performance

To evaluate the general performance recovery by the air leading strategies, the overall volume effectiveness of dry-cooling tower evol,dct, average outlet temperature of circulating water twa2,avg and turbine back pressure pB are calculated and compared, as shown in Figure 16.
For all the air leading strategies, the overall volume effectiveness of dry-cooling tower increases at all wind speeds as shown in Figure 16a. For case B, the overall volume effectiveness decreases if the wind speed within the span of small values increases, while it goes up when the wind speed exceeds 12 m/s. For cases C and D, the overall volume effectiveness decreases slightly under the small wind speeds and then increases clearly as the crosswind surpasses 8 m/s. Because case D combines the advantages of cases B and C, the overall volume effectiveness reaches a highest value of 30.17% at 20 m/s. Accordingly, large amount of cooling air brings on a higher cooling capacity, resulting in a lower outlet temperature of circulating water. In Figure 16b, the average outlet water temperature of the air-cooled heat exchanger firstly rises and then decreases with the increased ambient winds. For cases A and B, the critical wind speed appears to be 12 m/s, while it equals 8 m/s for cases C and D. The average outlet water temperatures for case B, C and D decrease by about 2.4 °C, 4.73 °C and 6.76 °C respectively compared with case A under 20 m/s.
The predicted turbine back pressure versus ambient wind is presented in Figure 16c, where the air leading strategies proposed in our previous work [26] are also used to compare with this work. It can be observed that the air leading strategies in this work are superior to previous ones. By means of the air leading strategies, the turbine back pressure is conspicuously reduced at high wind speeds, especially for case D. Under the high crosswind of 20 m/s, the back pressure of case D drops by 3.7 kPa compared with case A. In conclusion, the optimal air leading strategy of case D is preferred for the NDDCS under strong winds all year round.

4. Conclusions

For the conventional dry cooling system with no air leading, severe inflow deviation occurs at the lateral cooling deltas and the large vortices are formed inside the tower, and even worse, penetration flows may occur for some leeward cooling deltas under gale crosswinds.
The air leading baffles and rounded frustum inside the tower break the inner vortices and induce the hot air flowing upwards, which successfully eliminate the penetration flows. For the air leading baffles outside the tower, the strong incoming air flows near the lateral cooling deltas are decelerated and induced towards the air-cooled heat exchanger, thus weakening the inflow deviation of the lateral cooling deltas. For the combined inner and outer air leading strategies, the cooling efficiency of natural draft dry cooling system is most improved, which are superior to other single air leading approach.
With various air leading strategies, the unfavorable phenomena are restrained and the cooling efficiency of natural draft dry cooling system gets recovered under all wind conditions. Besides, under the high crosswind of 20 m/s, the average outlet water temperatures for case B, C and D drops about 2.4 °C, 4.73 °C and 6.76 °C respectively compared with case A. With the combined inner and outer air leading structures, the turbine back pressure shows the highest decrease of 3.7 kPa under 20 m/s, so case D is preferred for the engineering application in future.

Acknowledgments

The financial supports for this research, from the National Natural Science Foundation of China (Grant No. 51476055) and the National Basic Research Program of China (Grant No. 2015CB251503), are gratefully acknowledged.

Author Contributions

Weijia Wang and Lei Chen conceived and designed the numerical schemes; Weijia Wang performed the entire numerical work; Weijia Wang and Xianwei Huang analyzed the data; Weijia Wang wrote the paper; Lijun Yang revised the paper; Xiaoze Du offered computational resources and valuable numerical suggestions.

Conflicts of Interest

We declare we have no conflicts of interest.

References

  1. Kroger, D. Air-Cooled Heat Exchangers and Cooling Towers: Thermal-Flow Performance Evaluation and Design; PennWell Corporation: Tulsa, OK, USA, 2004. [Google Scholar]
  2. Wei, Q.; Zhang, B.; Liu, K.; Du, X.; Meng, X. A study of the unfavorable effects of wind on the cooling efficiency of dry cooling towers. J. Wind Eng. Ind. Aerodyn. 1995, 54–55, 633–643. [Google Scholar] [CrossRef]
  3. Yang, L.; Wu, X.; Du, X.; Yang, Y. Dimensional characteristics of wind effects on the performance of indirect dry cooling system with vertically arranged heat exchanger bundles. Int. J. Heat Mass Transf. 2013, 67, 853–866. [Google Scholar] [CrossRef]
  4. Ma, H.; Si, F.; Li, L.; Yan, W.; Zhu, K. Effects of ambient temperature and crosswind on thermo-flow performance of the tower under energy balance of the indirect dry cooling system. Appl. Therm. Eng. 2015, 78, 90–100. [Google Scholar] [CrossRef]
  5. Lu, Y.; Guan, Z.; Gurgenci, H.; Hooman, K.; He, S.; Bharathan, D. Experimental study of crosswind effects on the performance of small cylindrical natural draft dry cooling towers. Energy Convers. Manag. 2015, 91, 238–248. [Google Scholar] [CrossRef]
  6. Zhao, Y.; Long, G.; Sun, F.; Li, Y.; Zhang, C. Numerical study on the cooling performance of dry cooling tower with vertical two-pass column radiators under crosswind. Appl. Therm. Eng. 2015, 75, 1106–1117. [Google Scholar] [CrossRef]
  7. Zhao, Y.; Sun, F.; Li, Y.; Long, G.; Yang, Z. Numerical study on the cooling performance of natural draft dry cooling tower with vertical delta radiators under constant heat load. Appl. Energy 2015, 149, 225–237. [Google Scholar] [CrossRef]
  8. Yang, L.; Chen, L.; Du, X.; Yang, Y. Effects of ambient winds on the thermo-flow performances of indirect dry cooling system in a power plant. Int. J. Therm. Sci. 2013, 64, 178–187. [Google Scholar] [CrossRef]
  9. Goodarzi, M. A proposed stack configuration for dry cooling tower to improve cooling efficiency under crosswind. J. Wind Eng. Ind. Aerodyn. 2010, 98, 858–863. [Google Scholar] [CrossRef]
  10. Goodarzi, M. Proposing a new technique to enhance thermal performance and reduce structural design wind loads for natural drought cooling towers. Energy 2013, 62, 164–172. [Google Scholar] [CrossRef]
  11. Goodarzi, M.; Ramezanpour, R. Alternative geometry for cylindrical natural draft cooling tower with higher cooling efficiency under crosswind condition. Energy Convers. Manag. 2014, 77, 243–249. [Google Scholar] [CrossRef]
  12. Liao, H.; Yang, L.; Du, X.; Yang, Y. Influences of height to diameter ratios of dry-cooling tower upon thermo-flow characteristics of indirect dry cooling system. Int. J. Therm. Sci. 2015, 94, 178–192. [Google Scholar] [CrossRef]
  13. Liao, H.; Yang, L.; Du, X.; Yang, Y. Triangularly arranged heat exchanger bundles to restrain wind effects on natural draft dry cooling system. Appl. Therm. Eng. 2016, 99, 313–324. [Google Scholar] [CrossRef]
  14. Kong, Y.; Wang, W.; Yang, L.; Du, X.; Yang, Y. A novel natural draft dry cooling system with bilaterally arranged air-cooled heat exchanger. Int. J. Therm. Sci. 2017, 112, 318–334. [Google Scholar] [CrossRef]
  15. Al-Waked, R.; Behnia, M. The performance of natural draft dry cooling towers under crosswind: CFD study. Int. J. Energy Res. 2004, 28, 147–161. [Google Scholar] [CrossRef]
  16. Goodarzi, M.; Keimanesh, R. Heat rejection enhancement in natural draft cooling tower using radiator-type windbreakers. Energy Convers. Manag. 2013, 71, 120–125. [Google Scholar] [CrossRef]
  17. Goodarzi, M.; Keimanesh, R. Numerical analysis on overall performance of Savonius turbines adjacent to a natural draft cooling tower. Energy Convers. Manag. 2015, 99, 41–49. [Google Scholar] [CrossRef]
  18. Lu, Y.; Guan, Z.; Gurgenci, H.; Zou, Z. Windbreak walls reverse the negative effect of crosswind in short natural draft dry cooling towers into a performance enhancement. Int. J. Heat Mass Transf. 2013, 63, 162–170. [Google Scholar] [CrossRef]
  19. Lu, Y.; Gurgenci, H.; Guan, Z.; He, S. The influence of windbreak wall orientation on the cooling performance of small natural draft dry cooling towers. Int. J. Heat Mass Transf. 2014, 79, 1059–1069. [Google Scholar] [CrossRef]
  20. Lu, Y.; Guan, Z.; Gurgenci, H.; Alkhedhair, A.; He, S. Experimental investigation into the positive effects of a tri-blade-like windbreak wall on small size natural draft dry cooling towers. Appl. Therm. Eng. 2016, 105, 1000–1012. [Google Scholar] [CrossRef]
  21. Zhao, Y.; Long, G.; Sun, F.; Li, Y.; Zhang, C.; Liu, J. Effect mechanism of air deflectors on the cooling performance of dry cooling tower with vertical delta radiators under crosswind. Energy Convers. Manag. 2015, 93, 321–331. [Google Scholar] [CrossRef]
  22. Gu, H.; Wang, H.; Gu, Y.; Yao, J. A numerical study on the mechanism and optimization of wind-break structures for indirect air-cooling towers. Energy Convers. Manag. 2016, 108, 43–49. [Google Scholar] [CrossRef]
  23. Ma, H.; Si, F.; Kong, Y.; Zhu, K.; Yan, W. Wind-break walls with optimized setting angles for natural draft dry cooling tower with vertical radiators. Appl. Therm. Eng. 2017, 112, 326–339. [Google Scholar] [CrossRef]
  24. Wang, W.; Zhang, H.; Liu, P.; Li, Z.; Lv, J.; Ni, W. The cooling performance of a natural draft dry cooling tower under crosswind and an enclosure approach to cooling efficiency enhancement. Appl. Energy 2017, 186, 336–346. [Google Scholar] [CrossRef]
  25. Zavaragh, H.; Ceviz, M.; Tabar, M. Analysis of windbreaker combinations on steam power plant natural draft dry cooling towers. Appl. Therm. Eng. 2016, 99, 550–559. [Google Scholar] [CrossRef]
  26. Chen, L.; Yang, L.; Du, X.; Yang, Y. Performance improvement of natural draft dry cooling system by interior and exterior windbreaker configurations. Int. J. Heat Mass Transf. 2016, 96, 42–63. [Google Scholar] [CrossRef]
  27. Wang, W.; Yang, L.; Du, X.; Yang, Y. Anti-freezing water flow rates of various sectors for natural draft dry cooling system under wind conditions. Int. J. Heat Mass Transf. 2016, 102, 186–200. [Google Scholar] [CrossRef]
  28. Wang, X.; Yang, L.; Du, X.; Yang, Y. Performance improvement of natural draft dry cooling system by water flow distribution under crosswinds. Int. J. Heat Mass Transf. 2017, 108, 1924–1940. [Google Scholar] [CrossRef]
  29. Chen, L.; Yang, L.; Du, X.; Yang, Y. A novel layout of air-cooled condensers to improve thermo-flow performances. Appl. Energy 2016, 165, 244–259. [Google Scholar] [CrossRef]
Figure 1. Schematic of cold end with natural draft dry cooling system and surface condenser.
Energies 10 02166 g001
Figure 2. Geometry of natural draft dry cooling system.
Energies 10 02166 g002
Figure 3. Schematics of combined air leading strategies. (a) Case A without air leading; (b) Case B with inner air leading baffles and rounded frustum; (c) Case C with outer air leading baffles; (d) Case D with both inner and outer air leading measures; (e) Geometric parameters.
Energies 10 02166 g003
Figure 4. Numerical domain and boundaries.
Energies 10 02166 g004
Figure 5. Local grids for dry-cooling tower and finned tube bundles.
Energies 10 02166 g005
Figure 6. Numerical heat transfer process of cold end system.
Energies 10 02166 g006
Figure 7. Experimental validation for numerical simulation. (a) Measuring points in vertical and horizontal views; (b) Ascending velocity without winds; (c) Ascending velocity at 4 m/s.
Energies 10 02166 g007
Figure 8. Streamlines colored by temperature for case A at various wind speeds. (a) at 4 m/s; (b) at 12 m/s; (c) at 20 m/s.
Energies 10 02166 g008
Figure 9. Flow and temperature fields through lateral cooling deltas for case A at various wind speeds. (a) at 4 m/s; (b) at 12 m/s; (c) at 20 m/s.
Energies 10 02166 g009
Figure 10. Performance distributions for case A. (a) Volume effectiveness; (b) Thermal efficiency; (c) Outlet water temperature.
Energies 10 02166 g010
Figure 11. Streamlines colored by temperature for case D at various wind speeds. (a) at 4 m/s; (b) at 12 m/s; (c) at 20 m/s.
Energies 10 02166 g011
Figure 12. Flow and temperature fields through lateral cooling deltas of case D at various wind speeds. (a) at 4 m/s; (b) at 12 m/s; (c) at 20 m/s.
Energies 10 02166 g012
Figure 13. Performance distributions for case B. (a) Volume effectiveness; (b) Thermal efficiency; (c) Outlet water temperature.
Energies 10 02166 g013
Figure 14. Performance distributions for case C. (a) Volume effectiveness; (b) Thermal efficiency; (c) Outlet water temperature.
Energies 10 02166 g014
Figure 15. Performance distributions for case D. (a) Volume effectiveness; (b) Thermal efficiency; (c) Outlet water temperature.
Energies 10 02166 g015
Figure 16. Overall thermo-flow performances of natural draft dry cooling system with air leading strategies. (a) Overall volume effectiveness; (b) Average outlet water temperature; (c) Turbine back pressure.
Energies 10 02166 g016
Table 1. Geometric parameters of dry-cooling tower and air-cooled heat exchanger of NDDCS.
ParametersSymbolValue
Height of tower Ht140 m
Base diameter of towerdb114 m
Outlet diameter of towerdo78 m
Throat height of towerHtt110 m
Throat diameter of towerdtt74 m
Height of air-cooled heat exchangerHhe20 m
Outlet diameter of heat exchangerdohe122 m
Number of cooling deltasncd136
Table 2. Pressure drop and heat transfer parameters in heat exchanger model.
Pressure Loss Coefficients
σKiKeab
0.492000.9255−0.34123
Effectiveness Versus Velocity
va (m/s)0.511.522.533.544.5
εhe0.755840.635240.555150.496120.45010.412890.382010.355880.33342

