Article

Spatially Resolved Microglia/Macrophages in Recurrent Glioblastomas Overexpress Fatty Acid Metabolism and Phagocytic Genes

by
Akshitkumar M. Mistry
1,2,*,
Jonah Daneshmand
3,
SeonYeong Jamie Seo
1,
Norman L. Lehman
4,
Donald M. Miller
2,5,
Dylan A. Goodin
6,
Hermann B. Frieboes
2,6,
Joseph Chen
6,
Adrianna Masters
2,7,
Brian J. Williams
1,2 and
Kavitha Yaddanapudi
2,8,9,*
1
Department of Neurosurgery, University of Louisville, Louisville, KY 40202, USA
2
Brown Cancer Center, University of Louisville, Louisville, KY 40202, USA
3
Department of Bioinformatics, University of Louisville, Louisville, KY 40202, USA
4
Departments of Pathology and Laboratory Medicine, University of Louisville, Louisville, KY 40202, USA
5
Department of Medicine, University of Louisville, Louisville, KY 40202, USA
6
Department of Bioengineering, University of Louisville, Louisville, KY 40202, USA
7
Department of Radiation Oncology, University of Louisville, Louisville, KY 40202, USA
8
Department of Microbiology and Immunology, University of Louisville, Louisville, KY 40202, USA
9
Department of Surgery, University of Louisville, Louisville, KY 40202, USA
*
Authors to whom correspondence should be addressed.
Curr. Oncol. 2024, 31(3), 1183-1194; https://doi.org/10.3390/curroncol31030088
Submission received: 7 January 2024 / Revised: 9 February 2024 / Accepted: 19 February 2024 / Published: 23 February 2024
(This article belongs to the Topic Advances in Tumor Microenvironment)

Abstract

:
Background: Glioblastoma (GBM) tumors are rich in tumor-associated microglia/macrophages. Changes associated with treatment in this specific cell population are poorly understood. Therefore, we studied changes in gene expression of tumor-associated microglia/macrophages (Iba1+) cells in de novo versus recurrent GBMs. Methods: NanoString GeoMx® Digital Spatial Transcriptomic Profiling of microglia/macrophages (Iba1+) and glial cells (Gfap+) cells identified on tumor sections was performed on paired de novo and recurrent samples obtained from three IDH-wildtype GBM patients. The impact of differentially expressed genes on patient survival was evaluated using publicly available data. Results: Unsupervised analyses of the NanoString GeoMx® Digital Spatial Profiling data revealed clustering based on the transcriptomic data from Iba1+ and Gfap+ cells. As expected, conventional differential gene expression and enrichment analyses revealed upregulation of immune-function-related genes in Iba1+ cells compared to Gfap+ cells. A focused differential gene expression analysis revealed upregulation of phagocytosis and fatty acid/lipid metabolism genes in Iba1+ cells in recurrent GBM samples compared to de novo GBM samples. Importantly, of these genes, the lipid metabolism gene PLD3 consistently correlated with survival in multiple different publicly available datasets. Conclusion: Tumor-associated microglia/macrophages in recurrent GBM overexpress genes involved in fatty acid/lipid metabolism. Further investigation is needed to fully delineate the role of PLD phospholipases in GBM progression.

1. Introduction

Glioblastoma (GBM) is the most common primary malignant brain tumor [1]. Survival is poor, with a median life expectancy of approximately 14 months despite aggressive treatment with surgery, radiotherapy, and chemotherapy [1,2]. The mortality from GBM remains high, with approximately 12,000 cases diagnosed each year and 12,000 deaths occurring each year [2]. Current treatment includes maximally safe surgical excision, radiation, and chemotherapy (Temozolomide); despite these measures, recurrence is inevitable [3]. Clinical trials designed to improve the current standard of care have not been successful in improving treatment results [4]. After disease recurrence, treatment is even less effective, with a median survival of approximately 6 months with aggressive treatment [5,6]. Although immunotherapy, including immune checkpoint inhibitors (e.g., anti-PD-1 antibody Pembrolizumab), has dramatically improved survival in melanoma and non-small-cell lung cancer patients [7], it has not had a significant impact on the survival of GBM patients (either as a replacement for Temozolomide with initial therapy or at the time of recurrence versus Bevacizumab) [8,9].
The overall lack of progress in GBM treatment is multifactorial and most likely reflects unique impediments to drug delivery to brain tumors, including the blood–brain barrier limiting the efficacy of cytotoxic therapies and the immune-suppressive tumor microenvironment limiting the efficacy of immunotherapy [8,9,10,11,12,13]. The complex biology of GBM includes dramatic inter-tumoral genetic heterogeneity (tumor differences from patient to patient) as well as intra-tumoral heterogeneity (varied histological appearance and expression pattern in different areas of the same tumor) [14]. The poor prognosis of GBM patients and the lack of progress in clinical trials underscore the critical need for a better understanding of the underlying biology of GBM.
To address the concerns of inter-tumoral molecular heterogeneity, in this pilot study, we identified three patients with paired samples from initial resection at the time of diagnosis and recurrence after treatment and used NanoString GeoMx® Digital Spatial Profiling (DSP) technology to map gene expression changes in de novo versus recurrent GBM tumors resected from these three patients. DSP is a platform for high-plex spatial and temporal profiling of proteins or RNAs, suitable for use on formalin-fixed, paraffin-embedded (FFPE) tissue samples [15,16]. In this pilot study, we show that tumor-associated macrophages/microglia in recurrent GBM overexpress genes involved in fatty acid/lipid metabolism.

2. Materials and Methods

2.1. Patient Samples

Human tumor tissue samples were surgically resected from patients with glioblastoma (GBM) in the supratentorial compartment of the brain who underwent surgery at the University of Louisville. Both histopathological criteria as well as absence of an IDH1/2 mutation were used to diagnosed GBM. For Digital Spatial Profiling (DSP) analyses, three patients who previously had surgery for de novo GBM and then recurrent GBM performed at the University of Louisville were identified through a medical records search. All patients provided informed consent to a protocol that was approved by the University of Louisville IRB (IRB# 22.0332 and 20.1107). All specimens were reviewed by a certified neuropathologist to confirm the diagnosis. For each specimen, unstained slides were cut at 5 µm thickness from formalin-fixed, paraffin-embedded (FFPE) blocks and collected on adhesive glass slides. Each of the slides contained a paired primary and recurrent GBM section from each patient. Characteristics of patients included in the DSP analyses are listed in Table 1.

2.2. Digital Spatial Profiling—Selection and Segmenting of Regions of Interest

The GeoMx™ instrument and associated commercial software were used to analyze the GBM samples. The FFPE GBM sections were stained with a cocktail of fluorophore-tagged human antibodies against Iba1+, Gfap+, and DAPI, each of which is conjugated with a synthetic oligonucleotide via a UV-labile cross-linker. The stained slides were scanned using the GeoMxTM instrument, and 3-channel immunofluorescent (IF) digital images (Figure 1) were generated to visualize nuclei (DAPI), glial cells (Gfap+), and microglia/macrophages (Iba1+). These images at 20× magnification were then used to select twenty-five rectangular regions of interest (ROIs) across all of the slides, balancing a nearly equal number of ROIs in each tissue. The size of the ROI was the same. The ROIs were selected to capture glia-enriched and microglia/microphage-enriched regions. Two antibody-guided immunofluorescence masks/areas were computer-generated within each ROI to generate distinct segmentation areas to guide laser illumination: the Iba1+ and Gfap+ masks display the highly enriched segments in these cells. The ROIs were then selectively illuminated with cycles of UV light. With each illumination cycle, photocleaved oligos were collected and hybridized for analysis on the NanoString nCounter system.

2.3. Data Analysis

2.3.1. Nanostring Data Normalization

Oligonucleotides in each segment (Iba1+ and Gfap+) were quantified with the conventional NanoString nCounter technology. NanoString’s bioinformatics pipeline processed and normalized the data. The normalized data were used for downstream bioinformatic analyses.
R software version 4.2 (R Foundation for Statistical Computing, Vienna, Austria) and accompanying statistical R packages were used to conduct all analyses and generate plots. Between-group differences in continuous variables were tested using nonparametric t tests. Significance was set at a two-tailed p-value of 0.05 unless stated otherwise below.

2.3.2. Unsupervised Clustering

Hierarchical clustering was performed using the “ward.D” method. Dimensionality reduction of the expression data with t-distributed Stochastic Neighbor Embedding (t-SNE) was performed to facilitate visualization using the following parameters (dimensions = 2, perplexity = 15, iterations = 1000) using the Rtsne package (ver: 0.16).

2.3.3. Differential Expression and Pathway Analyses

Differential expression was performed using DESeq2 (v: 1.38.3). Any gene with a log fold change greater than ±1 and a p-value < 0.05/total number genes (i.e., Bonferroni’s correction) was considered to be differentially expressed. Pathway analyses were conducted on these differentially expressed genes using clusterProfiler (v: 3.17).

2.3.4. Survival Analyses

Survival data from IDH wildtype GBM samples available in GlioVis (http://gliovis.bioinfo.cnio.es; accessed on 1 August 2023) were downloaded. Because each dataset analyzed the expression data differently, we performed survival analysis by first identifying a cut point in the range of the normalized expression level of the gene of interest that was associated with the greatest divergence in survival. This cut point was used to dichotomize the dataset into 2 groups (i.e., patients with high and low expression of the gene of interest). For visualization, we plotted the survival data of the 2 groups using right-censored Kaplan–Meier curves. We used the survminer v0.4.9 R package for this analysis and plot generation. We compared the curves using the log-rank statistical test.

3. Results

We analyzed microglia/macrophages in newly diagnosed and recurrent matched pairs of GBM (IDH-wildtype) samples from three patients aged 43, 62, and 68 years. Inclusion criteria included diagnosis of GBM from initial resection, lack of isocitrate dehydrogenase mutation (IDH), and additional resection stored in the biorepository after recurrence. One was female, and all were non-Hispanic Caucasians who received the standard-of-care treatment with radiation and Temozolomide. The patients had overall survival of 148, 336, and 564 days. Variables including age, integrated molecular diagnosis, treatments, and survival are provided in Table 1.

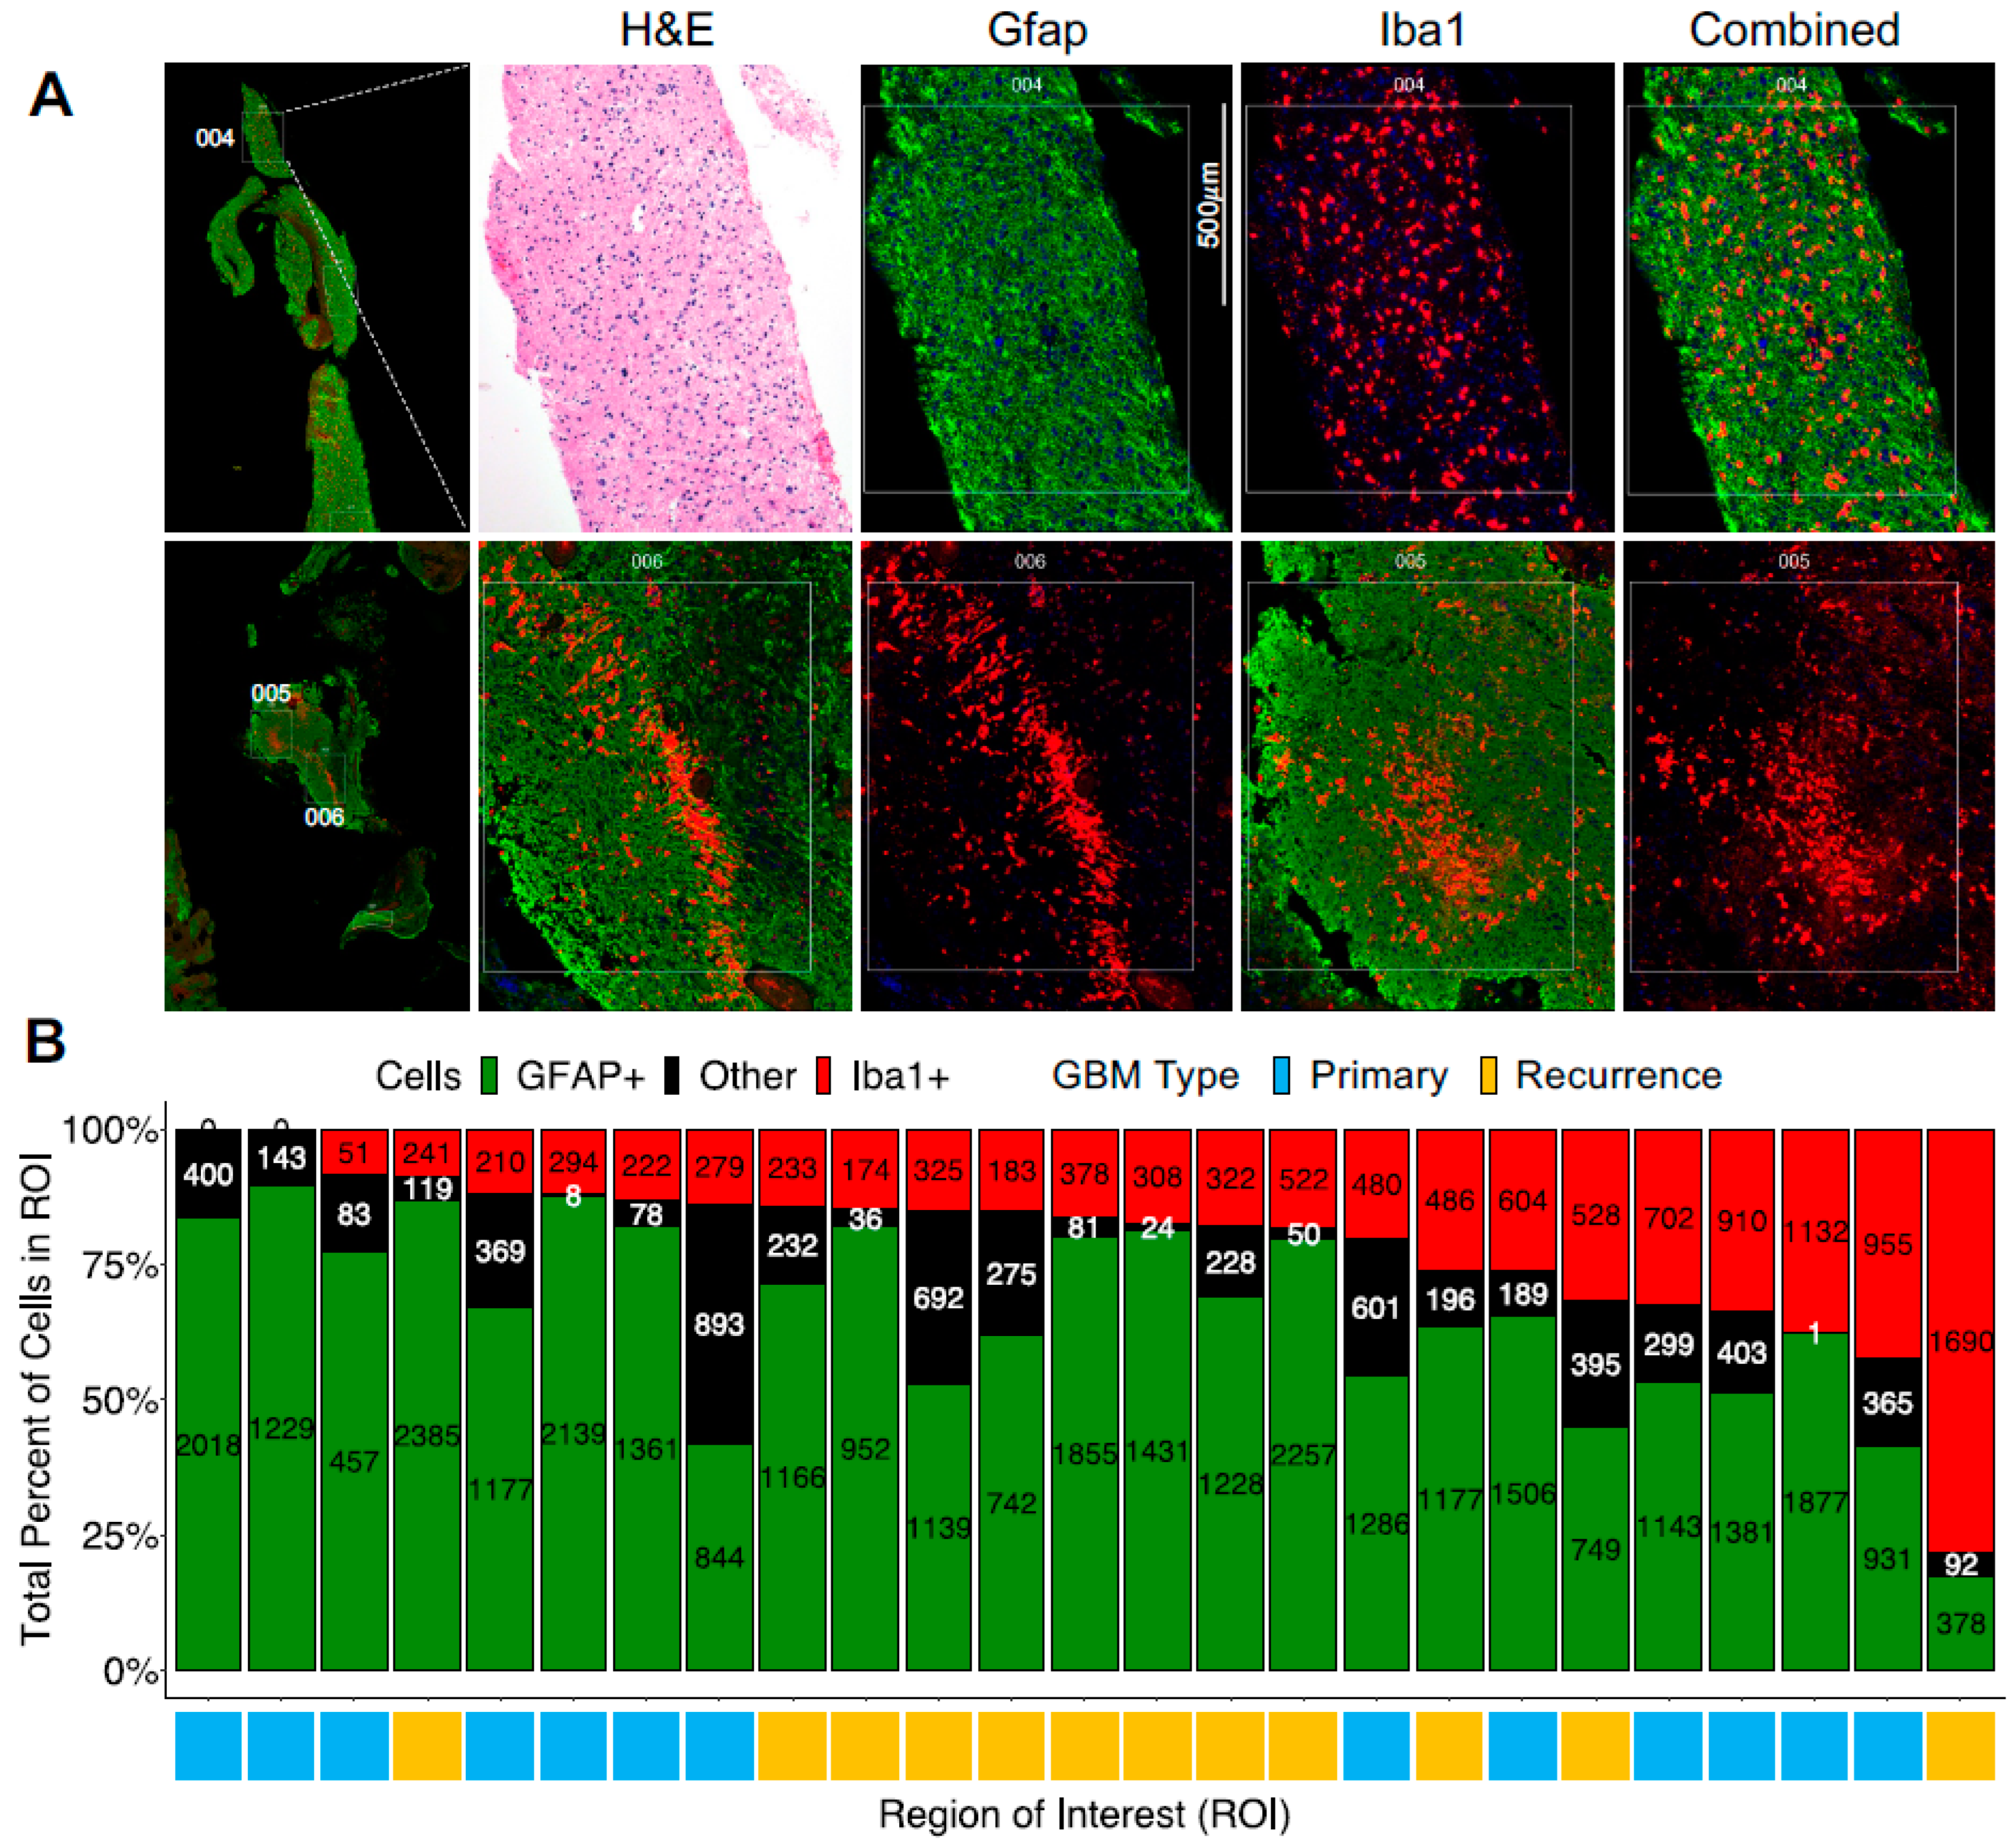
3.1. The Presence of a Tumor-Associated Microglia/Macrophage Niche in GBM

Most of the 25 selected ROIs were enriched with Gfap+ cells, except for 1, where Iba1+ cells constituted nearly 75% of the cells. Two ROIs did not have any Iba1+ cells. Rarely were the Iba1+ cells diffusely located (Figure 1A, top panel); instead, in many ROIs, the Iba1+ cells formed a niche (i.e., they were spatially together with high local density; Figure 1A, bottom panels).

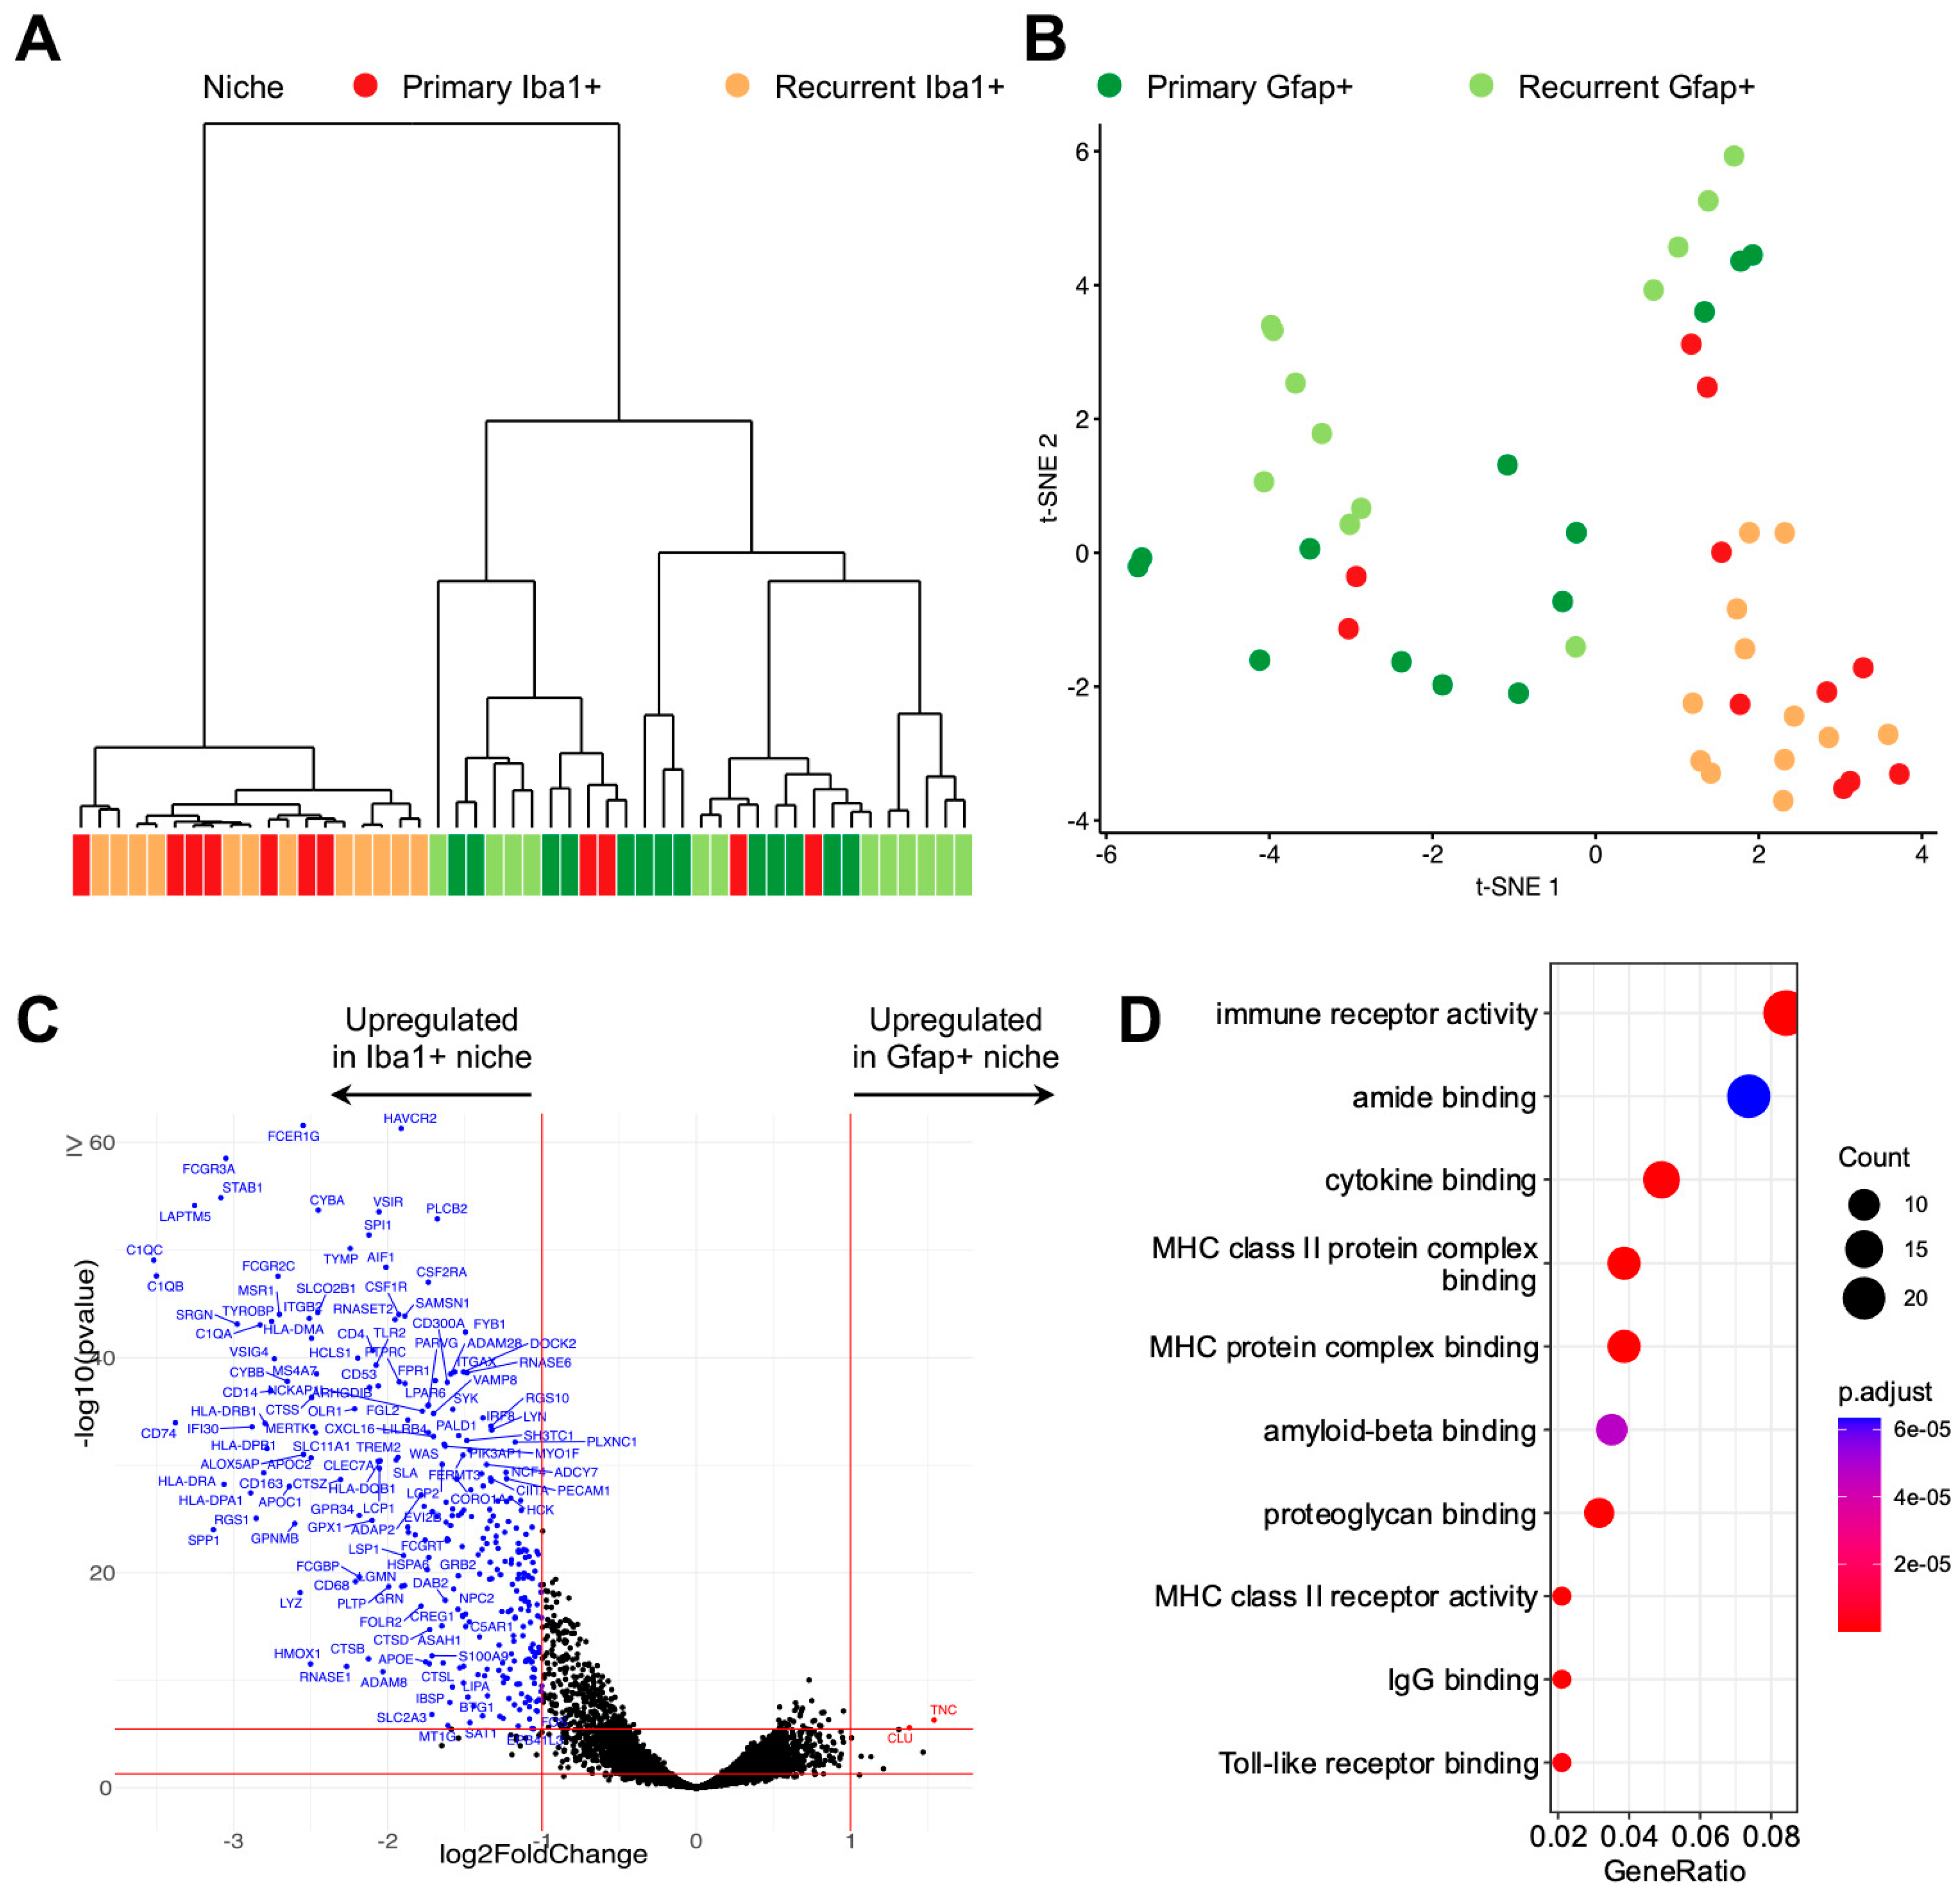
3.2. Digital Spatial Transcriptomic Profiling of Tumor-Associated Microglia/Macrophages

We conducted a digital spatial transcriptomic profiling of the Gfap+ and Iba1+ segments within the 25 different ROIs from matched primary and recurrent GBM samples of these three patients (Figure 1A). The transcriptomic profiling was successfully conducted on varying numbers of Gfap+ and Iba+ nuclei (DAPI positive), with a minimum of 51 nuclei (Figure 1B). Unsupervised hierarchical clustering of the gene expression data from digital spatial capturing of Iba1+ and Gfap+ cells revealed identity-specific clustering (Figure 2A). Four Iba1+ segments in the ROIs of newly diagnosed GBMs clustered with Gfap+ segments. To confirm this finding with another unsupervised form of analysis, we reduced the high-dimensional gene expression data to two dimensions using the t-SNE algorithm. The resulting two-dimensional plot of the segments revealed local clustering of Iba1+ segments, confirming the prior results (Figure 2B). In both analyses, the segments did not cluster based on the GBM’s recurrence status. We then identified differentially expressed genes. Nearly all of these genes were upregulated and specific to Iba1+ cells (Figure 2C). The KEGG pathway analysis of these genes revealed that most of them contributed to immune functions (Figure 2D).

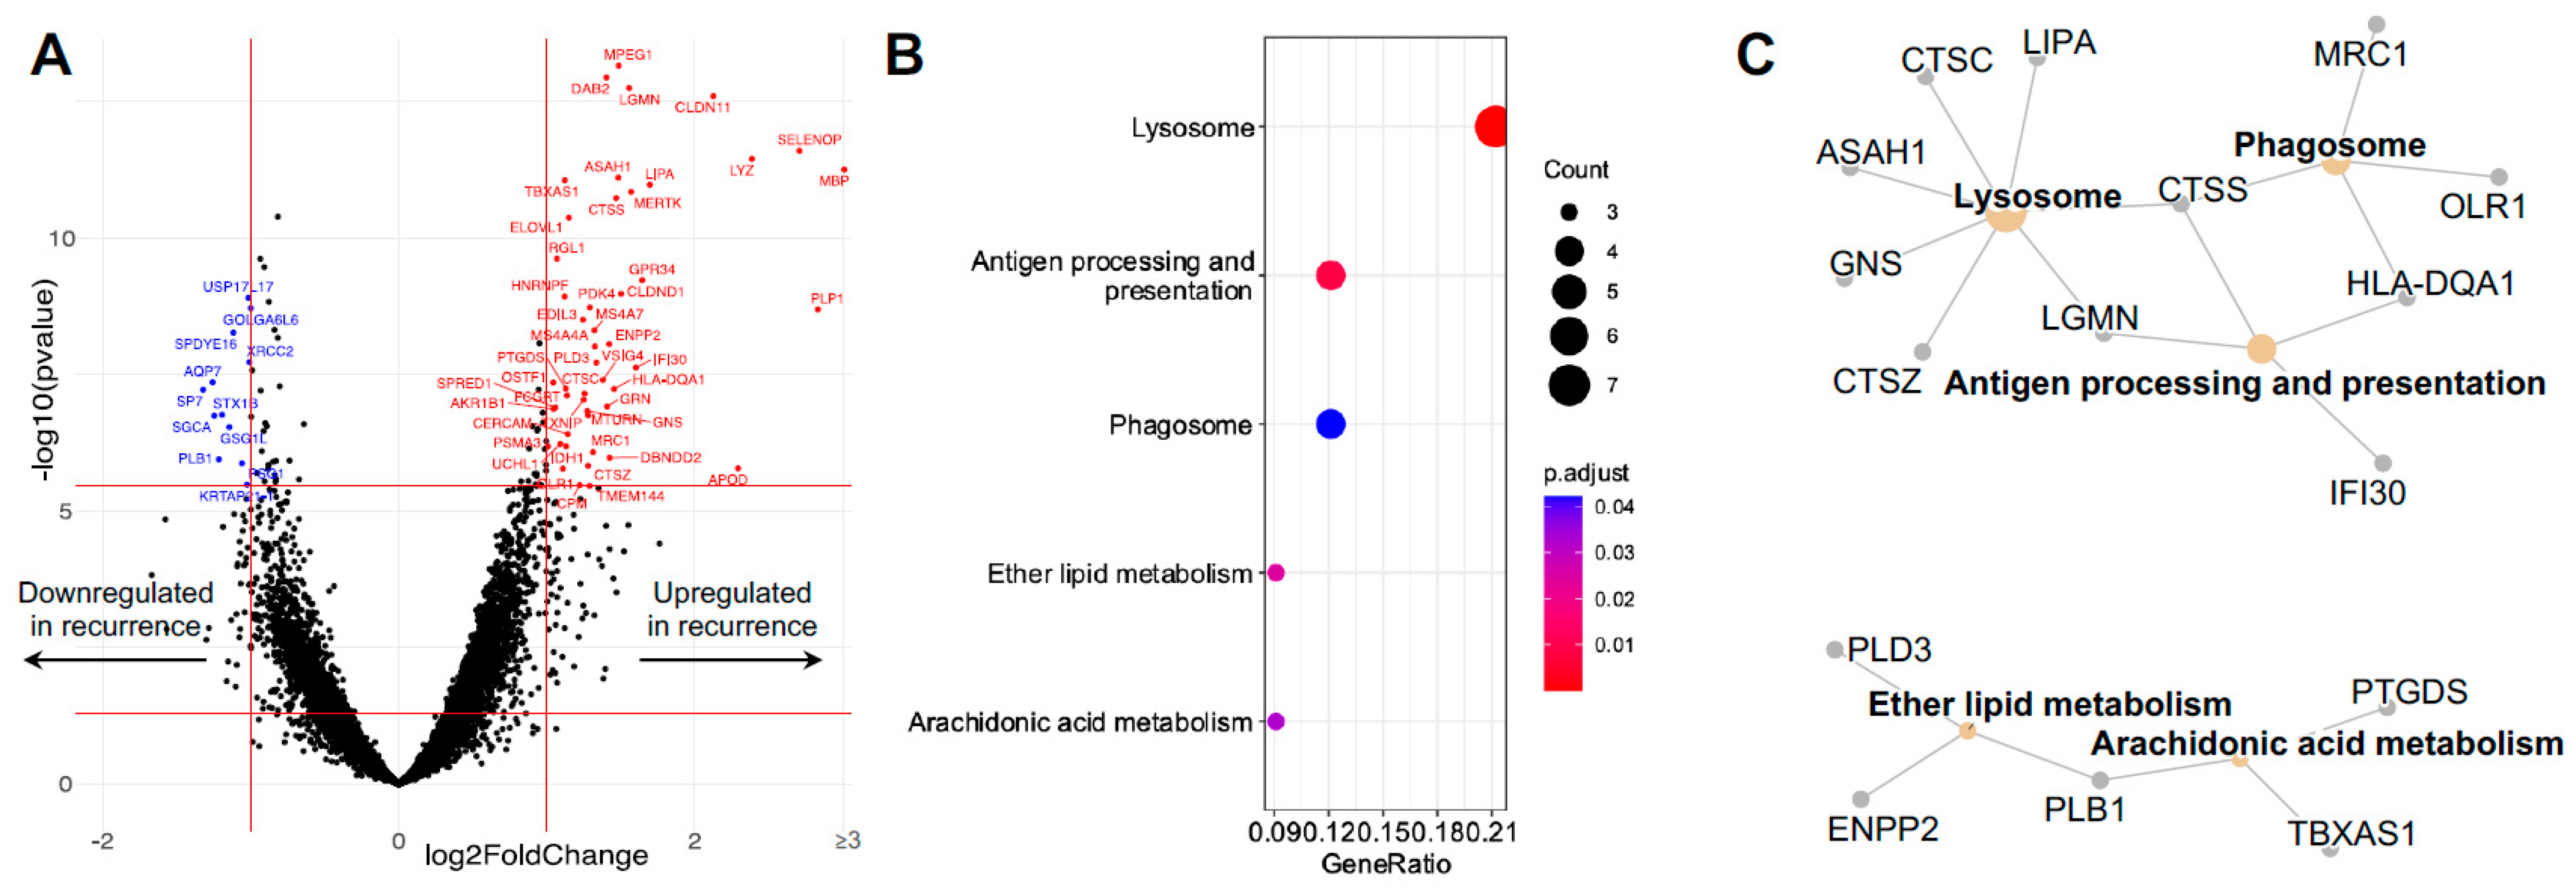
3.3. Differentially Expressed Microglial/Macrophage Genes in Recurrent GBM

To understand differences in the Iba1+ population in newly diagnosed and recurrent GBMs, we examined the differentially expressed genes. Most of the differentially expressed genes were upregulated in the Iba1+ cells present in the recurrent GBM samples (Figure 3A). The KEGG pathway analysis of these genes revealed that they belonged to two general biological processes: phagocytosis and fatty acid/lipid metabolism (Figure 3B). Phagocytosis incites the lysosome and antigen processing and presentation. The differentially expressed genes relevant to phagocytosis are (depicted in Figure 3C) MRC1, HLA-DQA1, OLR1, LIPA, CTSC, ASAH1, GNS, CTSZ, LGMN, and IFI30; on the other hand, PLD3, ENPP2, PLB1, TBXAS1, and PTGDS were identified as upregulated genes in recurrent GBMs that are involved in fatty acid/lipid metabolism. Differentially expressed genes in the Gfap+ cells could not be readily attributed to any specific biological process using the KEGG pathway analysis.

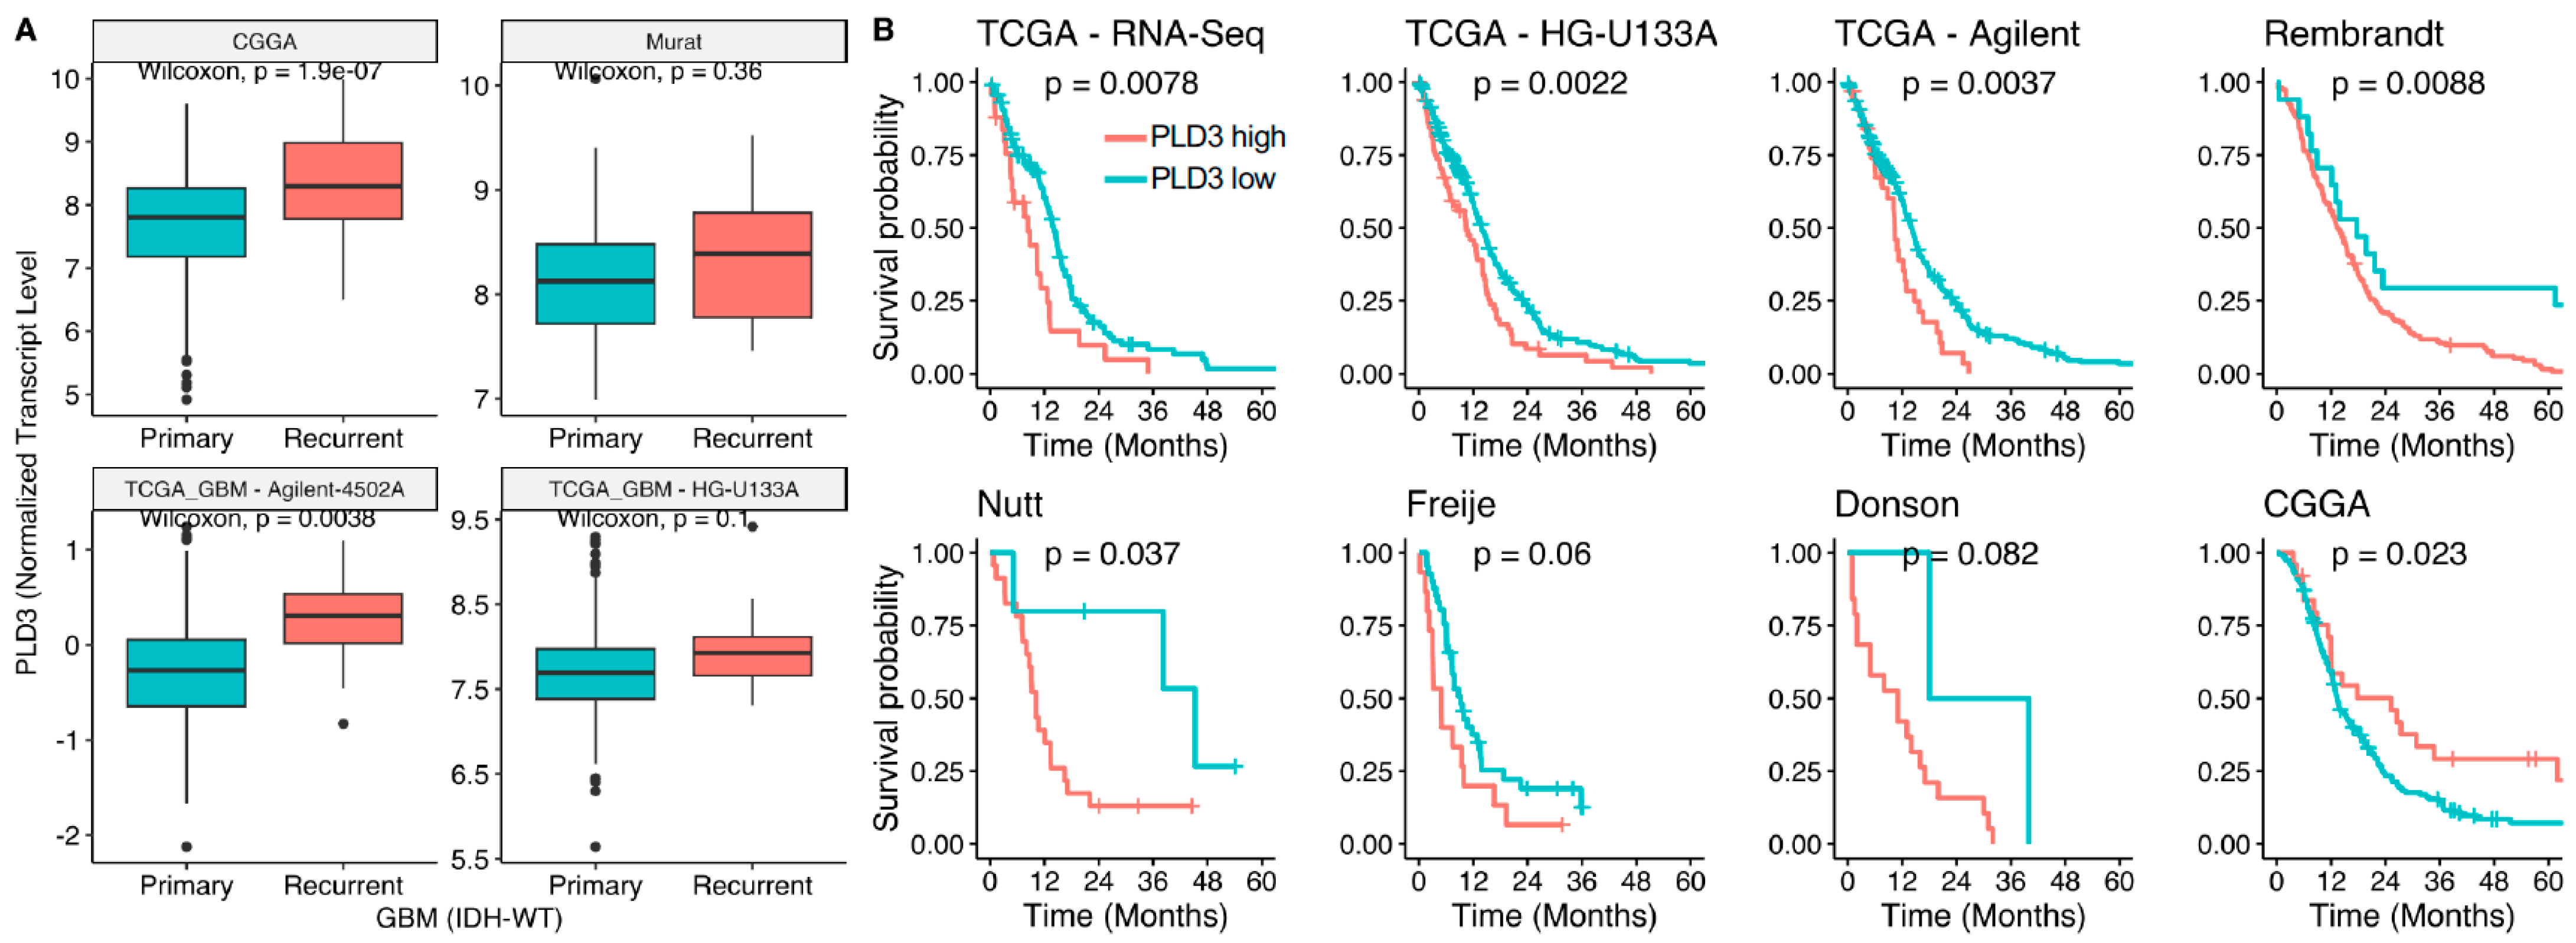
3.4. Lipid Metabolism Gene PLD3 Correlates with Survival in Several GBM Cohorts

While prior works have shown the prognostic value of genes, such as IFI30, responsible for phagocytosis-mediated protein degradation [17], here, we evaluated whether lipid metabolism genes correlated with survival using the publicly available datasets. Of the five upregulated genes, PLD3 consistently correlated with survival in nearly all cohorts tested. Analysis of publicly available transcriptomic data comparing newly diagnosed and recurrent GBMs revealed that levels of PLD3 were higher in recurrent GBMs in all four cohorts analyzed (Figure 4A). Importantly, higher levels of PLD3 correlated with lower survival in newly diagnosed GBM patients (IDH-wildtype without CpG island methylator phenotype) in nearly all publicly available GBM cohort data (Figure 4B).

4. Discussion

In this small proof-of-concept study, we performed gene expression profiling of paired de novo and recurrent GBM (from 25 different ROIs in tissues from n = 3 patients) using DSP with an overarching goal of identifying tumor-associated microglia/macrophage-intrinsic molecular aberrations within the GBM lesions that may be responsible for disease relapse. Our main finding is the identification of genes upregulated in the Iba1+ cells in the recurrent GBM samples that primarily belong to two general biological processes: phagocytosis and fatty acid/lipid metabolism. Importantly, of these genes, the increased expression of the lipid metabolism gene PLD3 consistently correlated with survival in several GBM cohorts. Overall, this study highlights the utility of snapshot, spatial multiomic approaches to gain insight into GBM recurrence and its molecular complexities [18].
The DSP platform (NanoString Technologies) relies on the multiplexed readout of proteins or RNAs using oligonucleotide tags; oligonucleotide tags are attached to affinity reagents (antibodies or RNA probes) through a photocleavable (PC) linker. Photocleaving light is projected onto the tissue sample to release PC oligonucleotides in any spatial pattern across a region of interest (ROI) covering 1 to ~5000 cells. With each illumination cycle, photocleaved oligos are collected and hybridized for analysis on the NanoString nCounter system. DSP is capable of high sensitivity within an ROI, with RNA detection feasible down to ~600 individual mRNA transcripts, allowing for in-depth analysis of prognostic and predictive biomarkers in a cell-type-specific manner.
GBM tumors display several layers of immune and molecular heterogeneity, including variations in architectural tumor arrangements and spatial infiltration of cells of the tumor immune microenvironment, which includes microglia/macrophages [19]. This heterogeneity, which can be both dynamic and temporal, is apparent not only among different individuals but also in different regions of the same tumor. To delineate this heterogeneity between primary and recurrent GBM, we have profiled gene expression in glioma-rich and microglia/macrophage-rich spatially defined ROIs using Gfap and Iba1 as the respective visualizing markers. Gfap is the most common glial biomarker, and it is expressed by both normal and malignant glial cells [20]. Iba1-expressing tumor-associated microglia/macrophages are recruited to the tumors and constitute a single cluster in the tumor microenvironment. However, studies have identified brain-resident microglia cells as an ontogenically distinct population from the peripheral macrophages; they are long-lived with self-renewal capability without relying on bone-marrow-derived progenitors [21,22,23,24,25,26]. Microglia, under homeostatic conditions, are initiators of the innate immune response; however, under the influence of tumor-generated signals, they become immunosuppressive, tumor-promoting cells, and they are associated with worse prognosis in GBM [27,28,29]. Some contributions of glioma-associated microglia toward tumor progression are well-recognized and documented [30,31,32,33], while many others are yet to be discovered, especially those that contribute to disease recurrence. In this report, two such potential pathways are identified. Under homeostatic conditions, microglia have a transcriptional signature consisting of diminished expression of MHC Class II molecules and lipid metabolism genes and enriched in P2RY13, TMEM119, CX3CR1, P2RY12, CSF1R, MARCKS, and SELPLG genes [28,34]. Our study provides new insights into variations in the composition of tumor-resident microglia/macrophages present in de novo and recurrent GBM; those in recurrent GBMs have a higher expression of genes related to phagocytosis and lipid metabolism, suggesting a phenotypic shift towards a more inflammatory and pro-tumoral phenotype. Our findings of microglia/macrophage-specific gene expression changes in recurrent GBM may also indicate their potential role in response to therapeutic intervention.
To further examine the relationship between spatial microenvironmental features and disease outcome, we evaluated microglial/macrophage gene signatures defined by the DSP analysis and their association with clinical outcomes in GBM. We found that higher levels of PLD3 correlated with lower survival in newly diagnosed GBM patients. The PLD3 gene encodes a member of the phospholipase D (PLD) family of enzymes that catalyzes the hydrolysis of membrane phospholipids and generates bioactive lipid mediator phosphatidic acid [35]. PLD activity has been shown to promote cancer progression, including growth, metabolism, and mobility [36]. An increase in global PLD activity was shown to induce matrix metalloproteinase 2 (MMP2) secretion and glioma cell invasion [37]. In our study, microglia/macrophage cell-type-specific increase in PLD3 expression in recurrent GBM suggests that dysregulation in the phospholipase signaling circuit and lipid-mediated activation of downstream effectors, specifically in tumor-associated microglia/macrophages, can contribute to tumor recurrence. Further investigation is needed to fully delineate the role of PLD phospholipases in the context of de novo and recurrent GBM.
Recent advancements in our comprehension of cancer metabolism have unveiled the highly heterogeneous nature of GBM metabolism [38,39,40]. Cancer stem cells as well as stromal cells within GBM display distinct metabolic characteristics that underpin their unique functionalities. GBM microenvironment is lipid-rich and fatty acid metabolism has emerged as a significant focus in this area, given its critical role in numerous biological processes that are central to GBM pathogenesis. Lipid metabolism influences several processes that play a crucial role in the development and progression of GBM. Tumor-mediated reprogramming of these processes encompasses changes in import/export signaling pathways, lipid anabolism, catabolism (fatty acid oxidation), regulation of ferroptosis, and alteration in de novo lipid synthesis and signaling pathways that include lipogenesis and cholesterol synthesis and targeting these pathways may represent a potential therapeutic strategy to overcome GBM progression and disease recurrence [41,42,43]. Fatty acid metabolism has been shown to contribute to immune suppression in GBM. Published work has demonstrated that treatment with etomoxir, an inhibitor of fatty acid oxidation, suppressed myeloid-derived suppressor cell metabolism and their T cell immunosuppressive functions in tumors [44]. Furthermore, immune suppressive T regulatory cells (Tregs) in GBM have been shown to express elevated levels of multiple fatty acid transporters and inhibition of fatty acid transporters as well as fatty acid metabolism in Tregs resulted in inhibition of their suppressive activity [45,46]. These studies suggest that fatty acid metabolism can influence the immune suppressive activity of tumor-infiltrating myeloid cells in GBM. However, numerous questions remain unanswered in the field of fatty acid metabolism in GBM. Efforts are warranted to unravel these intricate processes.
Last, the influence of the immune microenvironment on the GBM subtype and evolution is well-established [47,48]. Recent studies have also revealed its influence on the metabolome [49,50,51]. With our pilot data, we, too, show the importance of immune-cell-specific ASAH1 in recurrent GBM, as did a recent 2023 proteometabolomics study [49].
A limitation of this study is the utilization of samples from only three patients available for the spatial profiling; therefore, further validation of results using a larger patient cohort with a greater number of ROIs is required. Other limitations include the absence of validation of the gene expression data at the protein level, lack of single-cell expression data, and limited information on the molecular pathways activated in other myeloid and non-myeloid immune cells present in the tumor stromal regions selected. Despite these shortcomings, the data in this pilot study suggest that the tumor microenvironment of microglia/macrophage-rich regions in recurrent GBM may hold prognostic value for overall patient survival with therapeutic implications, and this study opens further investigations into confirmation and the biological basis/mechanism of our findings.

Author Contributions

A.M.M., D.M.M., B.J.W. and K.Y. contributed to this study’s conception and design. Material preparation, data collection, and analysis were performed by A.M.M., J.D., S.J.S., N.L.L., D.A.G. and H.B.F. The first draft of the manuscript was written jointly by A.M.M. and K.Y. and all authors commented on previous versions of the manuscript. All authors have read and agreed to the published version of the manuscript.

Funding

This work was supported by Henry Vogt Endowment Funds.

Institutional Review Board Statement

The study was approved by the University of Louisville IRB (IRB# 22.0332 and 20.1107).

Informed Consent Statement

Informed consent was obtained from all subjects involved in the study.

Data Availability Statement

The datasets generated and analyzed in this study are available from the corresponding author upon reasonable request.

Conflicts of Interest

The authors declare no conflict of interest.

References

  1. Stupp, R.; Mason, W.P.; van den Bent, M.J.; Weller, M.; Fisher, B.; Taphoorn, M.J.; Belanger, K.; Brandes, A.A.; Marosi, C.; Bogdahn, U.; et al. Radiotherapy plus concomitant and adjuvant temozolomide for glioblastoma. N. Engl. J. Med. 2005, 352, 987–996. [Google Scholar] [CrossRef]
  2. Ostrom, Q.T.; Price, M.; Neff, C.; Cioffi, G.; Waite, K.A.; Kruchko, C.; Barnholtz-Sloan, J.S. CBTRUS Statistical Report: Primary Brain and Other Central Nervous System Tumors Diagnosed in the United States in 2015–2019. Neuro Oncol. 2022, 24, v1–v95. [Google Scholar] [CrossRef]
  3. Nabors, L.B.; Portnow, J.; Ahluwalia, M.; Baehring, J.; Brem, H.; Brem, S.; Butowski, N.; Campian, J.L.; Clark, S.W.; Fabiano, A.J.; et al. Central Nervous System Cancers, Version 3.2020, NCCN Clinical Practice Guidelines in Oncology. J. Natl. Compr. Cancer Netw. 2020, 18, 1537–1570. [Google Scholar] [CrossRef]
  4. Bagley, S.J.; Kothari, S.; Rahman, R.; Lee, E.Q.; Dunn, G.P.; Galanis, E.; Chang, S.M.; Nabors, L.B.; Ahluwalia, M.S.; Stupp, R.; et al. Glioblastoma Clinical Trials: Current Landscape and Opportunities for Improvement. Clin. Cancer Res. 2022, 28, 594–602. [Google Scholar] [CrossRef]
  5. Gorlia, T.; Stupp, R.; Brandes, A.A.; Rampling, R.R.; Fumoleau, P.; Dittrich, C.; Campone, M.M.; Twelves, C.C.; Raymond, E.; Hegi, M.E.; et al. New prognostic factors and calculators for outcome prediction in patients with recurrent glioblastoma: A pooled analysis of EORTC Brain Tumour Group phase I and II clinical trials. Eur. J. Cancer 2012, 48, 1176–1184. [Google Scholar] [CrossRef]
  6. Vaz-Salgado, M.A.; Villamayor, M.; Albarran, V.; Alia, V.; Sotoca, P.; Chamorro, J.; Rosero, D.; Barrill, A.M.; Martin, M.; Fernandez, E.; et al. Recurrent Glioblastoma: A Review of the Treatment Options. Cancers 2023, 15, 4279. [Google Scholar] [CrossRef]
  7. Larkin, J.; Chiarion-Sileni, V.; Gonzalez, R.; Grob, J.J.; Rutkowski, P.; Lao, C.D.; Cowey, C.L.; Schadendorf, D.; Wagstaff, J.; Dummer, R.; et al. Five-Year Survival with Combined Nivolumab and Ipilimumab in Advanced Melanoma. N. Engl. J. Med. 2019, 381, 1535–1546. [Google Scholar] [CrossRef] [PubMed]
  8. Reardon, D.A.; Brandes, A.A.; Omuro, A.; Mulholland, P.; Lim, M.; Wick, A.; Baehring, J.; Ahluwalia, M.S.; Roth, P.; Bahr, O.; et al. Effect of Nivolumab vs Bevacizumab in Patients With Recurrent Glioblastoma: The CheckMate 143 Phase 3 Randomized Clinical Trial. JAMA Oncol. 2020, 6, 1003–1010. [Google Scholar] [CrossRef] [PubMed]
  9. Omuro, A.; Brandes, A.A.; Carpentier, A.F.; Idbaih, A.; Reardon, D.A.; Cloughesy, T.; Sumrall, A.; Baehring, J.; van den Bent, M.; Bahr, O.; et al. Radiotherapy combined with nivolumab or temozolomide for newly diagnosed glioblastoma with unmethylated MGMT promoter: An international randomized phase III trial. Neuro Oncol. 2023, 25, 123–134. [Google Scholar] [CrossRef] [PubMed]
  10. Hersh, D.S.; Wadajkar, A.S.; Roberts, N.; Perez, J.G.; Connolly, N.P.; Frenkel, V.; Winkles, J.A.; Woodworth, G.F.; Kim, A.J. Evolving Drug Delivery Strategies to Overcome the Blood Brain Barrier. Curr. Pharm. Des. 2016, 22, 1177–1193. [Google Scholar] [CrossRef]
  11. Omuro, A.; Vlahovic, G.; Lim, M.; Sahebjam, S.; Baehring, J.; Cloughesy, T.; Voloschin, A.; Ramkissoon, S.H.; Ligon, K.L.; Latek, R.; et al. Nivolumab with or without ipilimumab in patients with recurrent glioblastoma: Results from exploratory phase I cohorts of CheckMate 143. Neuro Oncol. 2018, 20, 674–686. [Google Scholar] [CrossRef] [PubMed]
  12. Tomaszewski, W.; Sanchez-Perez, L.; Gajewski, T.F.; Sampson, J.H. Brain Tumor Microenvironment and Host State: Implications for Immunotherapy. Clin. Cancer Res. 2019, 25, 4202–4210. [Google Scholar] [CrossRef] [PubMed]
  13. Lim, M.; Weller, M.; Idbaih, A.; Steinbach, J.; Finocchiaro, G.; Raval, R.R.; Ansstas, G.; Baehring, J.; Taylor, J.W.; Honnorat, J.; et al. Phase III trial of chemoradiotherapy with temozolomide plus nivolumab or placebo for newly diagnosed glioblastoma with methylated MGMT promoter. Neuro Oncol. 2022, 24, 1935–1949. [Google Scholar] [CrossRef]
  14. Baxter, M.E.; Miller, H.A.; Chen, J.; Williams, B.J.; Frieboes, H.B. Metabolomic differentiation of tumor core versus edge in glioma. Neurosurg. Focus 2023, 54, E4. [Google Scholar] [CrossRef]
  15. Barber, H.; Tofias, A.; Lander, B.; Daniels, A.; Gong, J.; Ren, Y.; Ren, X.; Liang, Y.; White, P.; Kurian, K.M. Advanced Molecular Characterization Using Digital Spatial Profiling Technology on Immunooncology Targets in Methylated Compared with Unmethylated IDH-Wildtype Glioblastoma. J. Oncol. 2021, 2021, 8819702. [Google Scholar] [CrossRef]
  16. Hernandez, S.; Lazcano, R.; Serrano, A.; Powell, S.; Kostousov, L.; Mehta, J.; Khan, K.; Lu, W.; Solis, L.M. Challenges and Opportunities for Immunoprofiling Using a Spatial High-Plex Technology: The NanoString GeoMx((R)) Digital Spatial Profiler. Front Oncol. 2022, 12, 890410. [Google Scholar] [CrossRef]
  17. Unanue, E.R.; Turk, V.; Neefjes, J. Variations in MHC Class II Antigen Processing and Presentation in Health and Disease. Annu. Rev. Immunol. 2016, 34, 265–297. [Google Scholar] [CrossRef]
  18. Miller, D.M.; Yadanapudi, K.; Rai, V.; Rai, S.N.; Chen, J.; Frieboes, H.B.; Masters, A.; McCallum, A.; Williams, B.J. Untangling the web of glioblastoma treatment resistance using a multi-omic and multidisciplinary approach. Am. J. Med. Sci. 2023, 366, 185–198. [Google Scholar] [CrossRef] [PubMed]
  19. Becker, A.P.; Sells, B.E.; Haque, S.J.; Chakravarti, A. Tumor Heterogeneity in Glioblastomas: From Light Microscopy to Molecular Pathology. Cancers 2021, 13, 761. [Google Scholar] [CrossRef]
  20. Rajaratnam, V.; Islam, M.M.; Yang, M.; Slaby, R.; Ramirez, H.M.; Mirza, S.P. Glioblastoma: Pathogenesis and Current Status of Chemotherapy and Other Novel Treatments. Cancers 2020, 12, 937. [Google Scholar] [CrossRef]
  21. Goldmann, T.; Wieghofer, P.; Jordao, M.J.; Prutek, F.; Hagemeyer, N.; Frenzel, K.; Amann, L.; Staszewski, O.; Kierdorf, K.; Krueger, M.; et al. Origin, fate and dynamics of macrophages at central nervous system interfaces. Nat. Immunol. 2016, 17, 797–805. [Google Scholar] [CrossRef]
  22. Gomez Perdiguero, E.; Klapproth, K.; Schulz, C.; Busch, K.; Azzoni, E.; Crozet, L.; Garner, H.; Trouillet, C.; de Bruijn, M.F.; Geissmann, F.; et al. Tissue-resident macrophages originate from yolk-sac-derived erythro-myeloid progenitors. Nature 2015, 518, 547–551. [Google Scholar] [CrossRef]
  23. Crotti, A.; Ransohoff, R.M. Microglial Physiology and Pathophysiology: Insights from Genome-wide Transcriptional Profiling. Immunity 2016, 44, 505–515. [Google Scholar] [CrossRef]
  24. Sousa, C.; Biber, K.; Michelucci, A. Cellular and Molecular Characterization of Microglia: A Unique Immune Cell Population. Front. Immunol. 2017, 8, 198. [Google Scholar] [CrossRef]
  25. Korin, B.; Ben-Shaanan, T.L.; Schiller, M.; Dubovik, T.; Azulay-Debby, H.; Boshnak, N.T.; Koren, T.; Rolls, A. High-dimensional, single-cell characterization of the brain’s immune compartment. Nat. Neurosci. 2017, 20, 1300–1309. [Google Scholar] [CrossRef]
  26. Chinnery, H.R.; Ruitenberg, M.J.; McMenamin, P.G. Novel characterization of monocyte-derived cell populations in the meninges and choroid plexus and their rates of replenishment in bone marrow chimeric mice. J. Neuropathol. Exp. Neurol. 2010, 69, 896–909. [Google Scholar] [CrossRef] [PubMed]
  27. Li, Q.; Barres, B.A. Microglia and macrophages in brain homeostasis and disease. Nat. Rev. Immunol. 2018, 18, 225–242. [Google Scholar] [CrossRef] [PubMed]
  28. Bowman, R.L.; Klemm, F.; Akkari, L.; Pyonteck, S.M.; Sevenich, L.; Quail, D.F.; Dhara, S.; Simpson, K.; Gardner, E.E.; Iacobuzio-Donahue, C.A.; et al. Macrophage Ontogeny Underlies Differences in Tumor-Specific Education in Brain Malignancies. Cell Rep. 2016, 17, 2445–2459. [Google Scholar] [CrossRef] [PubMed]
  29. Hambardzumyan, D.; Gutmann, D.H.; Kettenmann, H. The role of microglia and macrophages in glioma maintenance and progression. Nat. Neurosci. 2016, 19, 20–27. [Google Scholar] [CrossRef] [PubMed]
  30. Gabrusiewicz, K.; Ellert-Miklaszewska, A.; Lipko, M.; Sielska, M.; Frankowska, M.; Kaminska, B. Characteristics of the alternative phenotype of microglia/macrophages and its modulation in experimental gliomas. PLoS ONE 2011, 6, e23902. [Google Scholar] [CrossRef]
  31. Brandenburg, S.; Muller, A.; Turkowski, K.; Radev, Y.T.; Rot, S.; Schmidt, C.; Bungert, A.D.; Acker, G.; Schorr, A.; Hippe, A.; et al. Resident microglia rather than peripheral macrophages promote vascularization in brain tumors and are source of alternative pro-angiogenic factors. Acta Neuropathol. 2016, 131, 365–378. [Google Scholar] [CrossRef]
  32. Li, W.; Graeber, M.B. The molecular profile of microglia under the influence of glioma. Neuro. Oncol. 2012, 14, 958–978. [Google Scholar] [CrossRef]
  33. Sorensen, M.D.; Dahlrot, R.H.; Boldt, H.B.; Hansen, S.; Kristensen, B.W. Tumour-associated microglia/macrophages predict poor prognosis in high-grade gliomas and correlate with an aggressive tumour subtype. Neuropathol. Appl. Neurobiol. 2018, 44, 185–206. [Google Scholar] [CrossRef]
  34. Geribaldi-Doldan, N.; Fernandez-Ponce, C.; Quiroz, R.N.; Sanchez-Gomar, I.; Escorcia, L.G.; Velasquez, E.P.; Quiroz, E.N. The Role of Microglia in Glioblastoma. Front. Oncol. 2020, 10, 603495. [Google Scholar] [CrossRef] [PubMed]
  35. Park, J.B.; Lee, C.S.; Jang, J.H.; Ghim, J.; Kim, Y.J.; You, S.; Hwang, D.; Suh, P.G.; Ryu, S.H. Phospholipase signalling networks in cancer. Nat. Rev. Cancer 2012, 12, 782–792. [Google Scholar] [CrossRef] [PubMed]
  36. Wang, X.; Devaiah, S.P.; Zhang, W.; Welti, R. Signaling functions of phosphatidic acid. Prog. Lipid Res. 2006, 45, 250–278. [Google Scholar] [CrossRef]
  37. Park, M.H.; Ahn, B.H.; Hong, Y.K.; Min, D.S. Overexpression of phospholipase D enhances matrix metalloproteinase-2 expression and glioma cell invasion via protein kinase C and protein kinase A/NF-kappaB/Sp1-mediated signaling pathways. Carcinogenesis 2009, 30, 356–365. [Google Scholar] [CrossRef]
  38. Parik, S.; Fernandez-Garcia, J.; Lodi, F.; De Vlaminck, K.; Derweduwe, M.; De Vleeschouwer, S.; Sciot, R.; Geens, W.; Weng, L.; Bosisio, F.M.; et al. GBM tumors are heterogeneous in their fatty acid metabolism and modulating fatty acid metabolism sensitizes cancer cells derived from recurring GBM tumors to temozolomide. Front. Oncol. 2022, 12, 988872. [Google Scholar] [CrossRef] [PubMed]
  39. Eyme, K.M.; Sammarco, A.; Jha, R.; Mnatsakanyan, H.; Pechdimaljian, C.; Carvalho, L.; Neustadt, R.; Moses, C.; Alnasser, A.; Tardiff, D.F.; et al. Targeting de novo lipid synthesis induces lipotoxicity and impairs DNA damage repair in glioblastoma mouse models. Sci. Transl. Med. 2023, 15, eabq6288. [Google Scholar] [CrossRef]
  40. Gimple, R.C.; Kidwell, R.L.; Kim, L.J.Y.; Sun, T.; Gromovsky, A.D.; Wu, Q.; Wolf, M.; Lv, D.; Bhargava, S.; Jiang, L.; et al. Glioma Stem Cell-Specific Superenhancer Promotes Polyunsaturated Fatty-Acid Synthesis to Support EGFR Signaling. Cancer Discov. 2019, 9, 1248–1267. [Google Scholar] [CrossRef] [PubMed]
  41. Miska, J.; Chandel, N.S. Targeting fatty acid metabolism in glioblastoma. J. Clin. Investig. 2023, 133. [Google Scholar] [CrossRef] [PubMed]
  42. Broadfield, L.A.; Pane, A.A.; Talebi, A.; Swinnen, J.V.; Fendt, S.M. Lipid metabolism in cancer: New perspectives and emerging mechanisms. Dev. Cell 2021, 56, 1363–1393. [Google Scholar] [CrossRef] [PubMed]
  43. Guo, D.; Bell, E.H.; Chakravarti, A. Lipid metabolism emerges as a promising target for malignant glioma therapy. CNS Oncol. 2013, 2, 289–299. [Google Scholar] [CrossRef] [PubMed]
  44. Hossain, F.; Al-Khami, A.A.; Wyczechowska, D.; Hernandez, C.; Zheng, L.; Reiss, K.; Valle, L.D.; Trillo-Tinoco, J.; Maj, T.; Zou, W.; et al. Inhibition of Fatty Acid Oxidation Modulates Immunosuppressive Functions of Myeloid-Derived Suppressor Cells and Enhances Cancer Therapies. Cancer Immunol. Res. 2015, 3, 1236–1247. [Google Scholar] [CrossRef] [PubMed]
  45. Miska, J.; Lee-Chang, C.; Rashidi, A.; Muroski, M.E.; Chang, A.L.; Lopez-Rosas, A.; Zhang, P.; Panek, W.K.; Cordero, A.; Han, Y.; et al. HIF-1alpha Is a Metabolic Switch between Glycolytic-Driven Migration and Oxidative Phosphorylation-Driven Immunosuppression of Tregs in Glioblastoma. Cell Rep. 2019, 27, 226–237.e4. [Google Scholar] [CrossRef]
  46. Wang, H.; Franco, F.; Tsui, Y.C.; Xie, X.; Trefny, M.P.; Zappasodi, R.; Mohmood, S.R.; Fernandez-Garcia, J.; Tsai, C.H.; Schulze, I.; et al. CD36-mediated metabolic adaptation supports regulatory T cell survival and function in tumors. Nat. Immunol. 2020, 21, 298–308. [Google Scholar] [CrossRef]
  47. Jakovlevs, A.; Vanags, A.; Gardovskis, J.; Strumfa, I. Molecular classification of diffuse gliomas. Pol. J. Pathol. 2019, 70, 246–258. [Google Scholar] [CrossRef]
  48. Wang, Q.; Hu, B.; Hu, X.; Kim, H.; Squatrito, M.; Scarpace, L.; de Carvalho, A.C.; Lyu, S.; Li, P.; Li, Y.; et al. Tumor Evolution of Glioma-Intrinsic Gene Expression Subtypes Associates with Immunological Changes in the Microenvironment. Cancer Cell 2017, 32, 42–56.e6. [Google Scholar] [CrossRef]
  49. Cosenza-Contreras, M.; Schafer, A.; Sing, J.; Cook, L.; Stillger, M.N.; Chen, C.Y.; Hidalgo, J.V.; Pinter, N.; Meyer, L.; Werner, T.; et al. Proteometabolomics of initial and recurrent glioblastoma highlights an increased immune cell signature with altered lipid metabolism. Neuro Oncol. 2023, noad208. [Google Scholar] [CrossRef]
  50. Wang, L.B.; Karpova, A.; Gritsenko, M.A.; Kyle, J.E.; Cao, S.; Li, Y.; Rykunov, D.; Colaprico, A.; Rothstein, J.H.; Hong, R.; et al. Proteogenomic and metabolomic characterization of human glioblastoma. Cancer Cell 2021, 39, 509–528.e520. [Google Scholar] [CrossRef]
  51. Kesarwani, P.; Prabhu, A.; Kant, S.; Chinnaiyan, P. Metabolic remodeling contributes towards an immune-suppressive phenotype in glioblastoma. Cancer Immunol. Immunother. 2019, 68, 1107–1120. [Google Scholar] [CrossRef] [PubMed]
Figure 1. Regions of interest in paired primary and recurrent GBM tissues. (A) Photomicrographs of a selected case (Slide 1) of paired primary and recurrent GBM tissues. Close-ups of regions 004 (top row), 005 (bottom row), and 006 (bottom row) are shown. The sections were stained with the visualization markers Iba1 (red), Gfap (green), and DNA (blue). (B) Distribution of Gfap+, Iba1+, and other cells within each region of interest. The regions in columns are labeled by GBM type (Primary or Recurrence).
Curroncol 31 00088 g001
Figure 2. Unsupervised clustering of all regions and differential expression analysis of Iba+ niche versus Gfap+ niche. (A) Hierarchical clustering dendrogram of all regions, color-labeled by niche. (B) t-SNE projection of all regions, color-labeled by niche. In both (A,B), a clear separation can be seen between Iba+ and Gfap+ niches. (C) A volcano plot showing differentially expressed genes between Iba+ and Gfap+ niches. Each dot represents a gene, with red dots indicating genes that are significantly upregulated in recurrent tumors (log2 fold change > 1 and adjusted p-value < 0.05), blue dots indicating genes that are significantly downregulated (log2 fold change < −1 and adjusted p-value < 0.05), and black dots indicating genes that are not significantly differentially expressed. The red lines represent the threshold for statistical significance (adjusted p-value < 0.05), and the vertical red lines represent the threshold for fold change (log2 fold change > 1 and < −1). Gene symbols for the most significantly differentially expressed genes are shown. (D) Dot plot showing Gene Ontology enriched terms of differentially expressed genes (DEGs) between Iba+ and Gfap+ niches. The terms shown suggest an immune-related activity, which is to be expected within Iba+ niches.
Curroncol 31 00088 g002
Figure 3. Differential expression analysis of primary versus recurrence regions within the Iba+ niche. (A) Volcano plot of differential gene expression in Iba1+ microglia/macrophages in recurrent GBM tissues compared to primary GBM tissues (all 25 ROIs from n = 3 patients). Each dot represents a gene, with red dots indicating genes that are significantly upregulated in recurrent tumors (log2 fold change > 1 and adjusted p-value < 0.05), blue dots indicating genes that are significantly downregulated (log2 fold change < −1 and adjusted p-value < 0.05), and black dots indicating genes that are not significantly differentially expressed. The dashed red lines represent the threshold for statistical significance (adjusted p-value < 0.05), and the vertical red lines represent the threshold for fold change (log2 fold change >1 and <−1). Gene symbols for the most significantly differentially expressed genes are shown. (B) Dot plot showing Gene Ontology enriched terms of DEGs between primary and recurrent GBMs within the Iba+ niche. (C) Network plot of the Gene Ontology enriched terms and associated represented DEGs.
Curroncol 31 00088 g003
Figure 4. Changes in the level of expression of PLD3 associated with GBM recurrence and its correlation with survival using publicly available datasets. (A) Box plots showing Wilcoxon test comparison of PLD3 expression between primary and recurrent GBMs across four publicly available datasets. (B) Kaplan–Meier plots showing survival analysis between PLD3-high and PLD3-low patients across the eight publicly available datasets.
Curroncol 31 00088 g004
Table 1. Characteristics of three patients with glioblastoma (IDH1 wildtype).
Patient Study IDMGMT Promoter StatusGenderAge at DiagnosisCollection Date (Days Relevant to Diagnosis)Disease Status at CollectionTreatmentRT End Date (Days Relevant to Collection)Overall Survival (Days)
CDSR-01276-CNSUnmethylatedMale430De NovoResection/RT/
Temozolomide
336
CDSR-01276-CNS Male 206ProgressionReresection151
CDSR-01396-CNSMethylatedFemale620De NovoResection/RT/
Temozolomide
564
CDSR-01396-CNS Female 358ProgressionNeedle Biopsy36
CDSR-01595-CNSUnmethylatedMale680De NovoResection/
Lomustine
148
CDSR-01595-CNS Male 77ProgressionReresectionN/A
Disclaimer/Publisher’s Note: The statements, opinions and data contained in all publications are solely those of the individual author(s) and contributor(s) and not of MDPI and/or the editor(s). MDPI and/or the editor(s) disclaim responsibility for any injury to people or property resulting from any ideas, methods, instructions or products referred to in the content.

