Population Survival Kinetics Derived from Clinical Trials of Potentially Curable Lung Cancers

 , ,
, ,
Abstract
:1. Introduction
2. Materials and Methods
3. Results
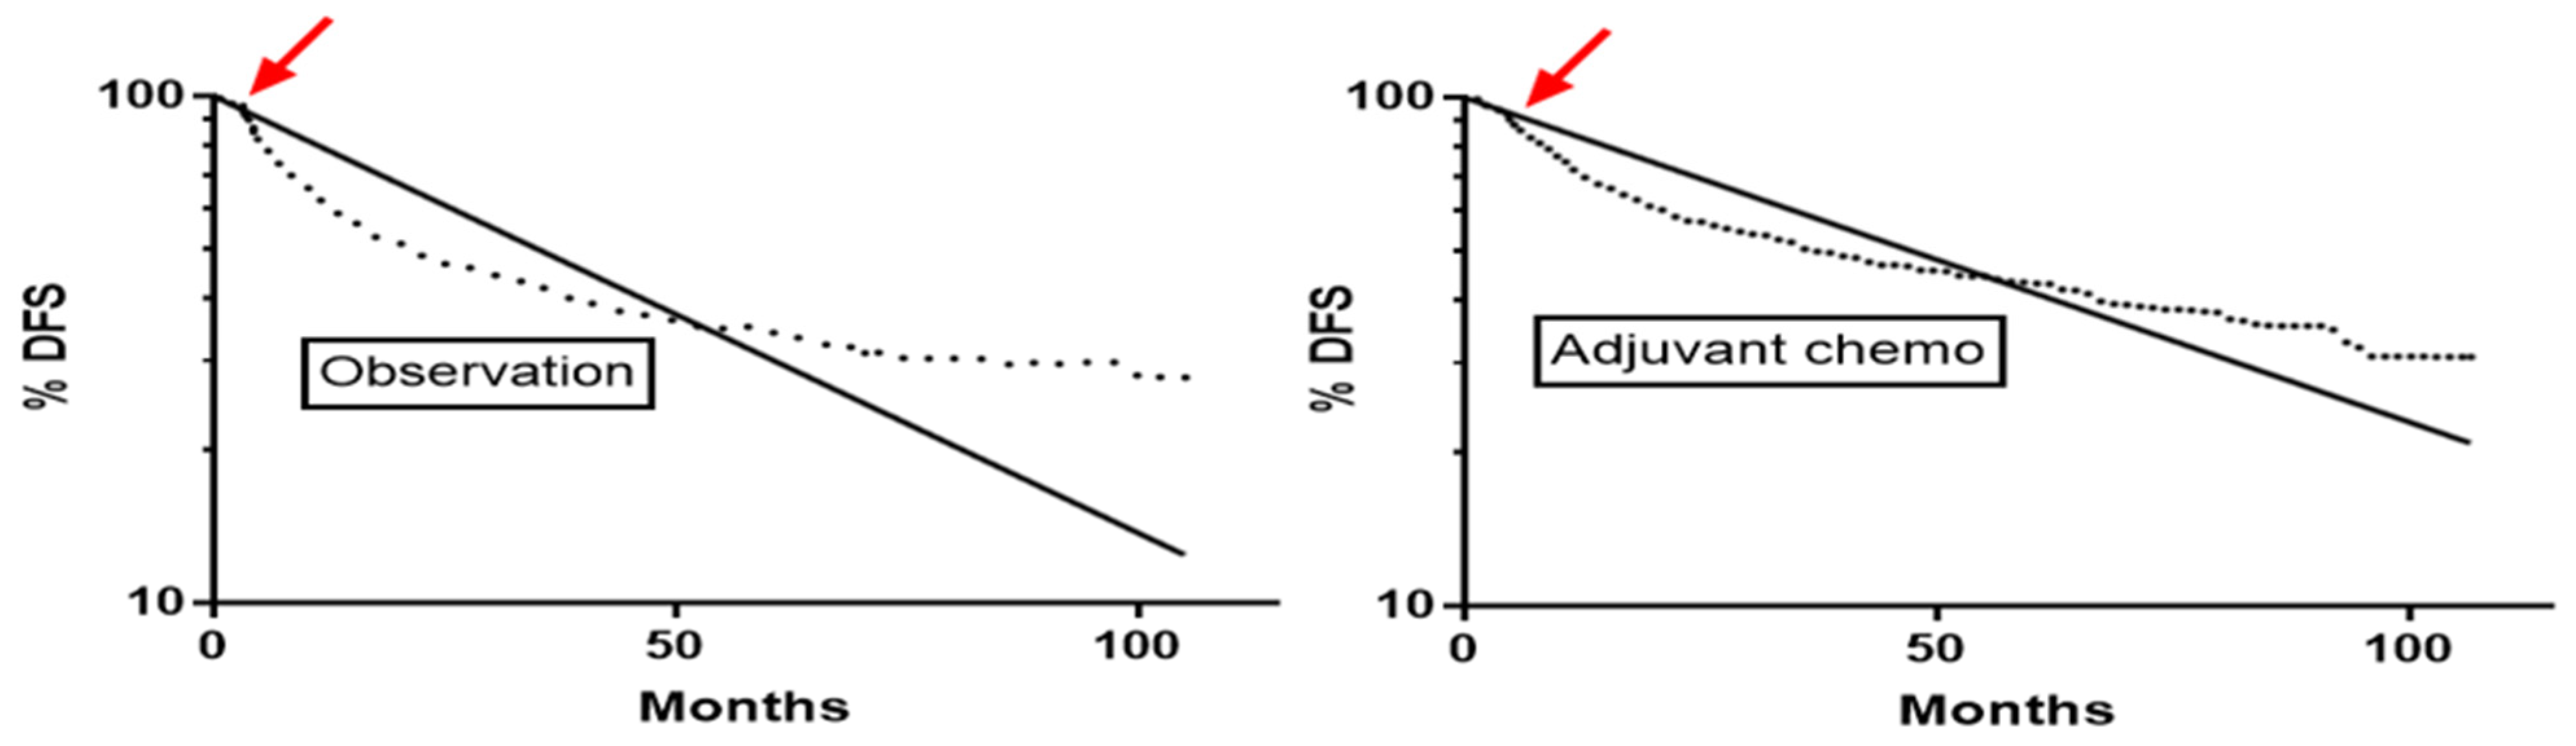
3.1. Overall PFS Half-Lives
3.2. 2-Phase Decay Modeling
3.3. Models “Hitting Constraints”
3.4. Proportion of Patients in Potentially Cured Subpopulations
3.5. PFS Half-Lives for Relapsing Subpopulations
3.6. PFS Half-Lives for Potentially Cured Subpopulations
3.7. Early PFS Curve Convexity on Log–Linear Plots
3.8. Proportion of Remaining Patients Who Would Continue to Be Progression-Free at Different Time Points
3.9. Optimum Frequency of Follow-Up Scans
3.10. Changes in SCLC Outcomes over Time
3.11. Durvalumab Addition to Chemoradiation
3.12. Chemotherapy Regimen Added to Curative Radiotherapy
4. Discussion
5. Limitations
6. Conclusions
Supplementary Materials
Author Contributions
Funding
Institutional Review Board Statement
Informed Consent Statement
Data Availability Statement
Acknowledgments
Conflicts of Interest
References
- Hill, S.A. Pharmacokinetics of drug infusions. Contin. Educ. Anaesth. Crit. Care Pain 2004, 4, 76–80. [Google Scholar] [CrossRef]
- Stewart, D.J.; Bosse, D.; Goss, G.; Hilton, J.F.; Jonker, D.; Fung-Kee-Fung, M. A novel, more reliable approach to use of progression-free survival as a predictor of gain in overall survival: The Ottawa PFS Predictive Model. Crit. Rev. Oncol. Hematol. 2020, 148, 102896. [Google Scholar] [CrossRef]
- Stewart, D.J.; Behrens, C.; Roth, J.; Wistuba, I.I. Exponential decay nonlinear regression analysis of patient survival curves: Preliminary assessment in non-small cell lung cancer. Lung Cancer 2011, 71, 217–223. [Google Scholar] [CrossRef] [PubMed]
- Stewart, D.J.; Bosse, D.; Robinson, A.; Ong, M.; Fung-Kee-Fung, M.; Brule, S.; Hilton, J.F.; Ocana, A. Potential insights from population kinetic assessment of progression-free survival curves. Crit. Rev. Oncol. Hematol. 2020, 153, 103039. [Google Scholar] [CrossRef] [PubMed]
- Broglio, K.R.; Berry, D.A. Detecting an overall survival benefit that is derived from progression-free survival. J. Natl. Cancer Inst. 2009, 101, 1642–1649. [Google Scholar] [CrossRef] [PubMed]
- Del Paggio, J.C.; Berry, J.S.; Hopman, W.M.; Eisenhauer, E.A.; Prasad, V.; Gyawali, B.; Booth, C.M. Evolution of the Randomized Clinical Trial in the Era of Precision Oncology. JAMA Oncol. 2021, 7, 728–734. [Google Scholar] [CrossRef]
- Booth, C.M.; Eisenhauer, E.A. Progression-free survival: Meaningful or simply measurable? J. Clin. Oncol. 2012, 30, 1030–1033. [Google Scholar] [CrossRef]
- Gyawali, B.; Hey, S.P.; Kesselheim, A.S. Evaluating the evidence behind the surrogate measures included in the FDA’s table of surrogate endpoints as supporting approval of cancer drugs. EClinicalMedicine 2020, 21, 100332. [Google Scholar] [CrossRef]
- Prasad, V.; Kim, C.; Burotto, M.; Vandross, A. The Strength of Association Between Surrogate End Points and Survival in Oncology: A Systematic Review of Trial-Level Meta-analyses. JAMA Intern. Med. 2015, 175, 1389–1398. [Google Scholar] [CrossRef]
- Stewart, D.J.; Macdonald, D.B.; Awan, A.A.; Thavorn, K. Optimal frequency of scans for patients on cancer therapies: A population kinetics assessment. Cancer Med. 2019, 8, 6871–6886. [Google Scholar] [CrossRef]
- Stewart, D.J.; Maziak, D.E.; Moore, S.M.; Brule, S.Y.; Gomes, M.; Sekhon, H.; Dennie, C.; Lo, B.; Fung-Kee-Fung, M.; Bradford, J.P.; et al. The need for speed in advanced non-small cell lung cancer: A population kinetics assessment. Cancer Med. 2021, 10, 9040–9046. [Google Scholar] [CrossRef]
- Douillard, J.Y.; Rosell, R.; De Lena, M.; Carpagnano, F.; Ramlau, R.; Gonzales-Larriba, J.L.; Grodzki, T.; Pereira, J.R.; Le Groumellec, A.; Lorusso, V.; et al. Adjuvant vinorelbine plus cisplatin versus observation in patients with completely resected stage IB-IIIA non-small-cell lung cancer (Adjuvant Navelbine International Trialist Association [ANITA]): A randomised controlled trial. Lancet Oncol. 2006, 7, 719–727. [Google Scholar] [CrossRef]
- Arriagada, R.; Dunant, A.; Pignon, J.P.; Bergman, B.; Chabowski, M.; Grunenwald, D.; Kozlowski, M.; Le Pechoux, C.; Pirker, R.; Pinel, M.I.; et al. Long-term results of the international adjuvant lung cancer trial evaluating adjuvant Cisplatin-based chemotherapy in resected lung cancer. J. Clin. Oncol. 2010, 28, 35–42. [Google Scholar] [CrossRef] [PubMed]
- Strauss, G.M.; Herndon, J.E., 2nd; Maddaus, M.A.; Johnstone, D.W.; Johnson, E.A.; Harpole, D.H.; Gillenwater, H.H.; Watson, D.M.; Sugarbaker, D.J.; Schilsky, R.L.; et al. Adjuvant paclitaxel plus carboplatin compared with observation in stage IB non-small-cell lung cancer: CALGB 9633 with the Cancer and Leukemia Group B, Radiation Therapy Oncology Group, and North Central Cancer Treatment Group Study Groups. J. Clin. Oncol. 2008, 26, 5043–5051. [Google Scholar] [CrossRef]
- Butts, C.A.; Ding, K.; Seymour, L.; Twumasi-Ankrah, P.; Graham, B.; Gandara, D.; Johnson, D.H.; Kesler, K.A.; Green, M.; Vincent, M.; et al. Randomized phase III trial of vinorelbine plus cisplatin compared with observation in completely resected stage IB and II non-small-cell lung cancer: Updated survival analysis of JBR-10. J. Clin. Oncol. 2010, 28, 29–34. [Google Scholar] [CrossRef] [PubMed]
- Pignon, J.P.; Tribodet, H.; Scagliotti, G.V.; Douillard, J.Y.; Shepherd, F.A.; Stephens, R.J.; Dunant, A.; Torri, V.; Rosell, R.; Seymour, L.; et al. Lung adjuvant cisplatin evaluation: A pooled analysis by the LACE Collaborative Group. J. Clin. Oncol. 2008, 26, 3552–3559. [Google Scholar] [CrossRef] [PubMed]
- Wu, Y.L.; Tsuboi, M.; He, J.; John, T.; Grohe, C.; Majem, M.; Goldman, J.W.; Laktionov, K.; Kim, S.W.; Kato, T.; et al. Osimertinib in Resected EGFR-Mutated Non-Small-Cell Lung Cancer. N. Engl. J. Med. 2020, 383, 1711–1723. [Google Scholar] [CrossRef]
- Ahn, J.S.; Ahn, Y.C.; Kim, J.H.; Lee, C.G.; Cho, E.K.; Lee, K.C.; Chen, M.; Kim, D.W.; Kim, H.K.; Min, Y.J.; et al. Multinational Randomized Phase III Trial with or Without Consolidation Chemotherapy Using Docetaxel and Cisplatin After Concurrent Chemoradiation in Inoperable Stage III Non-Small-Cell Lung Cancer: KCSG-LU05-04. J. Clin. Oncol. 2015, 33, 2660–2666. [Google Scholar] [CrossRef]
- Atagi, S.; Kawahara, M.; Yokoyama, A.; Okamoto, H.; Yamamoto, N.; Ohe, Y.; Sawa, T.; Ishikura, S.; Shibata, T.; Fukuda, H.; et al. Thoracic radiotherapy with or without daily low-dose carboplatin in elderly patients with non-small-cell lung cancer: A randomised, controlled, phase 3 trial by the Japan Clinical Oncology Group (JCOG0301). Lancet Oncol. 2012, 13, 671–678. [Google Scholar] [CrossRef]
- Bradley, J.D.; Hu, C.; Komaki, R.R.; Masters, G.A.; Blumenschein, G.R.; Schild, S.E.; Bogart, J.A.; Forster, K.M.; Magliocco, A.M.; Kavadi, V.S.; et al. Long-Term Results of NRG Oncology RTOG 0617: Standard- Versus High-Dose Chemoradiotherapy With or Without Cetuximab for Unresectable Stage III Non-Small-Cell Lung Cancer. J. Clin. Oncol. 2020, 38, 706–714. [Google Scholar] [CrossRef]
- Butts, C.; Socinski, M.A.; Mitchell, P.L.; Thatcher, N.; Havel, L.; Krzakowski, M.; Nawrocki, S.; Ciuleanu, T.E.; Bosquee, L.; Trigo, J.M.; et al. Tecemotide (L-BLP25) versus placebo after chemoradiotherapy for stage III non-small-cell lung cancer (START): A randomised, double-blind, phase 3 trial. Lancet Oncol. 2014, 15, 59–68. [Google Scholar] [CrossRef]
- Carter, D.L.; Garfield, D.; Hathorn, J.; Mundis, R.; Boehm, K.A.; Ilegbodu, D.; Asmar, L.; Reynolds, C. A randomized phase III trial of combined paclitaxel, carboplatin, and radiation therapy followed by weekly paclitaxel or observation for patients with locally advanced inoperable non-small-cell lung cancer. Clin. Lung Cancer 2012, 13, 205–213. [Google Scholar] [CrossRef]
- Chang, J.Y.; Verma, V.; Li, M.; Zhang, W.; Komaki, R.; Lu, C.; Allen, P.K.; Liao, Z.; Welsh, J.; Lin, S.H.; et al. Proton Beam Radiotherapy and Concurrent Chemotherapy for Unresectable Stage III Non-Small Cell Lung Cancer: Final Results of a Phase 2 Study. JAMA Oncol. 2017, 3, e172032. [Google Scholar] [CrossRef]
- Choy, H.; Schwartzberg, L.S.; Dakhil, S.R.; Garon, E.B.; Gerber, D.E.; Choksi, J.K.; Govindan, R.; Peng, G.; Koustenis, A.; Treat, J.; et al. Phase 2 study of pemetrexed plus carboplatin, or pemetrexed plus cisplatin with concurrent radiation therapy followed by pemetrexed consolidation in patients with favorable-prognosis inoperable stage IIIA/B non-small-cell lung cancer. J. Thorac. Oncol. 2013, 8, 1308–1316. [Google Scholar] [CrossRef]
- Faivre-Finn, C.; Vicente, D.; Kurata, T.; Planchard, D.; Paz-Ares, L.; Vansteenkiste, J.F.; Spigel, D.R.; Garassino, M.C.; Reck, M.; Senan, S.; et al. Four-Year Survival with Durvalumab After Chemoradiotherapy in Stage III NSCLC-an Update from the PACIFIC Trial. J. Thorac. Oncol. 2021, 16, 860–867. [Google Scholar] [CrossRef]
- Fenwick, J.D.; Landau, D.B.; Baker, A.T.; Bates, A.T.; Eswar, C.; Garcia-Alonso, A.; Harden, S.V.; Illsley, M.C.; Laurence, V.; Malik, Z.; et al. Long-Term Results from the IDEAL-CRT Phase 1/2 Trial of Isotoxically Dose-Escalated Radiation Therapy and Concurrent Chemotherapy for Stage II/III Non-small Cell Lung Cancer. Int. J. Radiat. Oncol. Biol. Phys. 2020, 106, 733–742. [Google Scholar] [CrossRef]
- Flentje, M.; Huber, R.M.; Engel-Riedel, W.; Andreas, S.; Kollmeier, J.; Staar, S.; Dickgreber, N.; Vaissiere, N.; De Almeida, C.; Edlich, B.; et al. GILT—A randomised phase III study of oral vinorelbine and cisplatin with concomitant radiotherapy followed by either consolidation therapy with oral vinorelbine and cisplatin or best supportive care alone in stage III non-small cell lung cancer. Strahlenther. Onkol. 2016, 192, 216–222. [Google Scholar] [CrossRef]
- Fournel, P.; Vergnenegre, A.; Robinet, G.; Lena, H.; Gervais, R.; Le Caer, H.; Souquet, P.J.; Chavaillon, J.M.; Bozonnat, M.C.; Daures, J.P.; et al. Induction or consolidation chemotherapy for unresectable stage III non-small-cell lung cancer patients treated with concurrent chemoradiation: A randomised phase II trial GFPC-IFCT 02-01. Eur. J. Cancer 2016, 52, 181–187. [Google Scholar] [CrossRef] [PubMed]
- Garrido, P.; Engel-Riedel, W.; Serke, M.; Giraud, P.; Ricardi, U.; Vallejo, C.; Visseren-Grul, C.; Ameryckx, S.; Soldatenkova, V.; Chouaki, N.; et al. Final results from a Phase II study of pemetrexed and cisplatin with concurrent thoracic radiation after Pem-Cis induction in patients with unresectable locally advanced non-squamous non-small cell lung cancer (NSCLC). Lung Cancer 2015, 88, 160–166. [Google Scholar] [CrossRef] [PubMed]
- Govindan, R.; Bogart, J.; Stinchcombe, T.; Wang, X.; Hodgson, L.; Kratzke, R.; Garst, J.; Brotherton, T.; Vokes, E.E. Randomized phase II study of pemetrexed, carboplatin, and thoracic radiation with or without cetuximab in patients with locally advanced unresectable non-small-cell lung cancer: Cancer and Leukemia Group B trial 30407. J. Clin. Oncol. 2011, 29, 3120–3125. [Google Scholar] [CrossRef] [PubMed]
- Hoang, T.; Dahlberg, S.E.; Schiller, J.H.; Mehta, M.P.; Fitzgerald, T.J.; Belinsky, S.A.; Johnson, D.H. Randomized phase III study of thoracic radiation in combination with paclitaxel and carboplatin with or without thalidomide in patients with stage III non-small-cell lung cancer: The ECOG 3598 study. J Clin Oncol 2012, 30, 616–622. [Google Scholar] [CrossRef] [PubMed]
- Horinouchi, H.; Sekine, I.; Sumi, M.; Noda, K.; Goto, K.; Mori, K.; Tamura, T. Long-term results of concurrent chemoradiotherapy using cisplatin and vinorelbine for stage III non-small-cell lung cancer. Cancer Sci. 2013, 104, 93–97. [Google Scholar] [CrossRef] [PubMed]
- Imamura, F.; Konishi, K.; Uchida, J.; Nishino, K.; Okuyama, T.; Kumagai, T.; Kawaguchi, Y.; Nishiyama, K. Novel chemoradiotherapy with concomitant boost thoracic radiation and concurrent cisplatin and vinorelbine for stage IIIA and IIIB non-small-cell lung cancer. Clin. Lung Cancer 2014, 15, 281–286. [Google Scholar] [CrossRef] [PubMed]
- Isla, D.; De Las Penas, R.; Insa, A.; Marse, R.; Martinez-Banaclocha, N.; Mut, P.; Moran, T.; Sala, M.A.; Massuti, B.; Ortega, A.L.; et al. Oral vinorelbine versus etoposide with cisplatin and chemo-radiation as treatment in patients with stage III non-small cell lung cancer: A randomized phase II (RENO study). Lung Cancer 2019, 135, 161–168. [Google Scholar] [CrossRef] [PubMed]
- Kawaguchi, T.; Takada, M.; Ando, M.; Okishio, K.; Atagi, S.; Fujita, Y.; Tomizawa, Y.; Hayashihara, K.; Okano, Y.; Takahashi, F.; et al. A multi-institutional phase II trial of consolidation S-1 after concurrent chemoradiotherapy with cisplatin and vinorelbine for locally advanced non-small cell lung cancer. Eur. J. Cancer 2012, 48, 672–677. [Google Scholar] [CrossRef]
- Kerner, G.S.; van Dullemen, L.F.; Wiegman, E.M.; Widder, J.; Blokzijl, E.; Driever, E.M.; van Putten, J.W.; Liesker, J.J.; Renkema, T.E.; Pieterman, R.M.; et al. Concurrent gemcitabine and 3D radiotherapy in patients with stage III unresectable non-small cell lung cancer. Radiat. Oncol. 2014, 9, 190. [Google Scholar] [CrossRef] [PubMed]
- Lawrence, Y.R.; Paulus, R.; Langer, C.; Werner-Wasik, M.; Buyyounouski, M.K.; Komaki, R.; Machtay, M.; Smith, C.; Axelrod, R.S.; Wasserman, T.; et al. The addition of amifostine to carboplatin and paclitaxel based chemoradiation in locally advanced non-small cell lung cancer: Long-term follow-up of Radiation Therapy Oncology Group (RTOG) randomized trial 9801. Lung Cancer 2013, 80, 298–305. [Google Scholar] [CrossRef]
- Lerouge, D.; Riviere, A.; Dansin, E.; Chouaid, C.; Dujon, C.; Schott, R.; Lavole, A.; Le Pennec, V.; Fabre, E.; Crequit, J.; et al. A phase II study of cisplatin with intravenous and oral vinorelbine as induction chemotherapy followed by concomitant chemoradiotherapy with oral vinorelbine and cisplatin for locally advanced non-small cell lung cancer. BMC Cancer 2014, 14, 231. [Google Scholar] [CrossRef]
- Liang, J.; Bi, N.; Wu, S.; Chen, M.; Lv, C.; Zhao, L.; Shi, A.; Jiang, W.; Xu, Y.; Zhou, Z.; et al. Etoposide and cisplatin versus paclitaxel and carboplatin with concurrent thoracic radiotherapy in unresectable stage III non-small cell lung cancer: A multicenter randomized phase III trial. Ann. Oncol. 2017, 28, 777–783. [Google Scholar] [CrossRef]
- Lu, C.; Lee, J.J.; Komaki, R.; Herbst, R.S.; Feng, L.; Evans, W.K.; Choy, H.; Desjardins, P.; Esparaz, B.T.; Truong, M.T.; et al. Chemoradiotherapy with or without AE-941 in stage III non-small cell lung cancer: A randomized phase III trial. J. Natl. Cancer Inst. 2010, 102, 859–865. [Google Scholar] [CrossRef] [PubMed]
- Niho, S.; Yoshida, T.; Akimoto, T.; Sakamaki, K.; Ono, A.; Seto, T.; Nishio, M.; Yamamoto, N.; Hida, T.; Okamoto, H.; et al. Randomized phase II study of chemoradiotherapy with cisplatin + S-1 versus cisplatin + pemetrexed for locally advanced non-squamous non-small cell lung cancer: SPECTRA study. Lung Cancer 2020, 141, 64–71. [Google Scholar] [CrossRef] [PubMed]
- Park, S.E.; Noh, J.M.; Kim, Y.J.; Lee, H.S.; Cho, J.H.; Lim, S.W.; Ahn, Y.C.; Pyo, H.; Choi, Y.L.; Han, J.; et al. EGFR Mutation Is Associated with Short Progression-Free Survival in Patients with Stage III Non-squamous Cell Lung Cancer Treated with Concurrent Chemoradiotherapy. Cancer Res. Treat. 2019, 51, 493–501. [Google Scholar] [CrossRef] [PubMed]
- Price, A.; Yellowlees, A.; Keerie, C.; Russell, S.; Faivre-Finn, C.; Gilligan, D.; Snee, M.; Skailes, G.; Hatton, M.; Erridge, S.; et al. Radical radiotherapy with or without gemcitabine in patients with early stage medically inoperable non-small cell lung cancer. Lung Cancer 2012, 77, 532–536. [Google Scholar] [CrossRef] [PubMed]
- Provencio, M.; Majem, M.; Guirado, M.; Massuti, B.; de Las Penas, R.; Ortega, A.L.; Domine, M.; Marse, R.; Sala, M.A.; Paredes, A.; et al. Phase II clinical trial with metronomic oral vinorelbine and tri-weekly cisplatin as induction therapy, subsequently concomitant with radiotherapy (RT) in patients with locally advanced, unresectable, non-small cell lung cancer (NSCLC). Analysis of survival and value of ctDNA for patient selection. Lung Cancer 2021, 153, 25–34. [Google Scholar] [PubMed]
- Sasaki, T.; Seto, T.; Yamanaka, T.; Kunitake, N.; Shimizu, J.; Kodaira, T.; Nishio, M.; Kozuka, T.; Takahashi, T.; Harada, H.; et al. A randomised phase II trial of S-1 plus cisplatin versus vinorelbine plus cisplatin with concurrent thoracic radiotherapy for unresectable, locally advanced non-small cell lung cancer: WJOG5008L. Br. J. Cancer 2018, 119, 675–682. [Google Scholar] [CrossRef]
- Senan, S.; Brade, A.; Wang, L.H.; Vansteenkiste, J.; Dakhil, S.; Biesma, B.; Martinez Aguillo, M.; Aerts, J.; Govindan, R.; Rubio-Viqueira, B.; et al. PROCLAIM: Randomized Phase III Trial of Pemetrexed-Cisplatin or Etoposide-Cisplatin Plus Thoracic Radiation Therapy Followed by Consolidation Chemotherapy in Locally Advanced Nonsquamous Non-Small-Cell Lung Cancer. J. Clin. Oncol. 2016, 34, 953–962. [Google Scholar] [CrossRef] [PubMed]
- Shimokawa, T.; Yamada, K.; Tanaka, H.; Kubota, K.; Takiguchi, Y.; Kishi, K.; Saito, H.; Hosomi, Y.; Kato, T.; Harada, D.; et al. Randomized phase II trial of S-1 plus cisplatin or docetaxel plus cisplatin with concurrent thoracic radiotherapy for inoperable stage III non-small cell lung cancer. Cancer Med. 2021, 10, 626–633. [Google Scholar] [CrossRef] [PubMed]
- van Baardwijk, A.; Reymen, B.; Wanders, S.; Borger, J.; Ollers, M.; Dingemans, A.M.; Bootsma, G.; Geraedts, W.; Pitz, C.; Lunde, R.; et al. Mature results of a phase II trial on individualised accelerated radiotherapy based on normal tissue constraints in concurrent chemo-radiation for stage III non-small cell lung cancer. Eur. J. Cancer 2012, 48, 2339–2346. [Google Scholar] [CrossRef]
- Vera, P.; Mihailescu, S.D.; Lequesne, J.; Modzelewski, R.; Bohn, P.; Hapdey, S.; Pepin, L.F.; Dubray, B.; Chaumet-Riffaud, P.; Decazes, P.; et al. Radiotherapy boost in patients with hypoxic lesions identified by (18)F-FMISO PET/CT in non-small-cell lung carcinoma: Can we expect a better survival outcome without toxicity? [RTEP5 long-term follow-up]. Eur. J. Nucl. Med. Mol. Imaging 2019, 46, 1448–1456. [Google Scholar] [CrossRef]
- Wada, K.; Kishi, N.; Kanayama, N.; Hirata, T.; Morimoto, M.; Konishi, K.; Imamura, F.; Teshima, T.; Ogawa, K. Radiation Dose Escalation in Accelerated Hyperfractionated Radiotherapy for Stage III Non-small-cell Lung Cancer. Anticancer. Res. 2018, 38, 5951–5958. [Google Scholar] [CrossRef]
- Yamamoto, N.; Nakagawa, K.; Nishimura, Y.; Tsujino, K.; Satouchi, M.; Kudo, S.; Hida, T.; Kawahara, M.; Takeda, K.; Katakami, N.; et al. Phase III study comparing second- and third-generation regimens with concurrent thoracic radiotherapy in patients with unresectable stage III non-small-cell lung cancer: West Japan Thoracic Oncology Group WJTOG0105. J. Clin. Oncol. 2010, 28, 3739–3745. [Google Scholar] [CrossRef]
- Glinski, K.; Socha, J.; Wasilewska-Tesluk, E.; Komosinska, K.; Kepka, L. Accelerated hypofractionated radiotherapy with concurrent full dose chemotherapy for locally advanced non-small cell lung cancer: A phase I/II study. Radiother. Oncol. 2020, 148, 174–180. [Google Scholar] [CrossRef] [PubMed]
- Arriagada, R.; Le Chevalier, T.; Ruffie, P.; Chomy, P.; de Cremoux, H. Alternating radiotherapy and chemotherapy in limited small cell lung cancer: The IGR protocols. French FNCLCC Lung Cancer Study Group. Lung Cancer 1994, 10 (Suppl. S1), S289–S298. [Google Scholar] [CrossRef] [PubMed]
- Arriagada, R.; le Chevalier, T.; Ruffie, P.; Baldeyrou, P.; De Cremoux, H.; Martin, M.; Chomy, P.; Cerrina, M.L.; Pellae-Cosset, B.; Tarayre, M.; et al. Alternating radiotherapy and chemotherapy in 173 consecutive patients with limited small cell lung carcinoma. GROP and the French Cancer Center’s Lung Group. Int. J. Radiat. Oncol. Biol. Phys. 1990, 19, 1135–1138. [Google Scholar] [CrossRef]
- Beith, J.M.; Clarke, S.J.; Woods, R.L.; Bell, D.R.; Levi, J.A. Long-term follow-up of a randomised trial of combined chemoradiotherapy induction treatment, with and without maintenance chemotherapy in patients with small cell carcinoma of the lung. Eur. J. Cancer 1996, 32A, 438–443. [Google Scholar] [CrossRef]
- Blackstock, A.W.; Bogart, J.A.; Matthews, C.; Lovato, J.F.; McCoy, T.; Livengood, K.; Ho, C.; White, D.; Atkins, J.N.; Miller, A.A. Split-course versus continuous thoracic radiation therapy for limited-stage small-cell lung cancer: Final report of a randomized phase III trial. Clin. Lung Cancer 2005, 6, 287–292. [Google Scholar] [CrossRef]
- Bogart, J.A.; Herndon, J.E.; Lyss, A.P., 2nd; Watson, D.; Miller, A.A.; Lee, M.E.; Turrisi, A.T.; Green, M.R. 70 Gy thoracic radiotherapy is feasible concurrent with chemotherapy for limited-stage small-cell lung cancer: Analysis of Cancer and Leukemia Group B study 39808. Int. J. Radiat. Oncol. Biol. Phys. 2004, 59, 460–468. [Google Scholar] [CrossRef]
- Bonner, J.A.; Sloan, J.A.; Shanahan, T.G.; Brooks, B.J.; Marks, R.S.; Krook, J.E.; Gerstner, J.B.; Maksymiuk, A.; Levitt, R.; Mailliard, J.A.; et al. Phase III comparison of twice-daily split-course irradiation versus once-daily irradiation for patients with limited stage small-cell lung carcinoma. J. Clin. Oncol. 1999, 17, 2681–2691. [Google Scholar] [CrossRef] [PubMed]
- Edelman, M.J.; Chansky, K.; Gaspar, L.E.; Leigh, B.; Weiss, G.R.; Taylor, S.A.; Crowley, J.; Livingston, R.; Gandara, D.R. Phase II trial of cisplatin/etoposide and concurrent radiotherapy followed by paclitaxel/carboplatin consolidation for limited small-cell lung cancer: Southwest Oncology Group 9713. J. Clin. Oncol. 2004, 22, 127–132. [Google Scholar] [CrossRef]
- Ettinger, D.S.; Berkey, B.A.; Abrams, R.A.; Fontanesi, J.; Machtay, M.; Duncan, P.J.; Curran, W.J., Jr.; Movsas, B.; Byhardt, R.W.; Radiation Therapy Oncology Group 9609. Study of paclitaxel, etoposide, and cisplatin chemotherapy combined with twice-daily thoracic radiotherapy for patients with limited-stage small-cell lung cancer: A Radiation Therapy Oncology Group 9609 phase II study. J. Clin. Oncol. 2005, 23, 4991–4998. [Google Scholar] [CrossRef]
- Glisson, B.; Scott, C.; Komaki, R.; Movsas, B.; Wagner, H. Cisplatin, ifosfamide, oral etoposide, and concurrent accelerated hyperfractionated thoracic radiation for patients with limited small-cell lung carcinoma: Results of radiation therapy oncology group trial 93-12. J. Clin. Oncol. 2000, 18, 2990–2995. [Google Scholar] [CrossRef]
- Goodman, G.E.; Crowley, J.J.; Blasko, J.C.; Livingston, R.B.; Beck, T.M.; Demattia, M.D.; Bukowski, R.M. Treatment of limited small-cell lung cancer with etoposide and cisplatin alternating with vincristine, doxorubicin, and cyclophosphamide versus concurrent etoposide, vincristine, doxorubicin, and cyclophosphamide and chest radiotherapy: A Southwest Oncology Group Study. J. Clin. Oncol. 1990, 8, 39–47. [Google Scholar] [PubMed]
- Gregor, A.; Drings, P.; Burghouts, J.; Postmus, P.E.; Morgan, D.; Sahmoud, T.; Kirkpatrick, A.; Dalesio, O.; Giaccone, G. Randomized trial of alternating versus sequential radiotherapy/chemotherapy in limited-disease patients with small-cell lung cancer: A European Organization for Research and Treatment of Cancer Lung Cancer Cooperative Group Study. J. Clin. Oncol. 1997, 15, 2840–2849. [Google Scholar] [CrossRef] [PubMed]
- Gronberg, B.H.; Killingberg, K.T.; Flotten, O.; Brustugun, O.T.; Hornslien, K.; Madebo, T.; Langer, S.W.; Schytte, T.; Nyman, J.; Risum, S.; et al. High-dose versus standard-dose twice-daily thoracic radiotherapy for patients with limited stage small-cell lung cancer: An open-label, randomised, phase 2 trial. Lancet Oncol. 2021, 22, 321–331. [Google Scholar] [CrossRef] [PubMed]
- Halvorsen, T.O.; Sundstrom, S.; Flotten, O.; Brustugun, O.T.; Brunsvig, P.; Aasebo, U.; Bremnes, R.M.; Kaasa, S.; Gronberg, B.H. Comorbidity and outcomes of concurrent chemo- and radiotherapy in limited disease small cell lung cancer. Acta Oncol. 2016, 55, 1349–1354. [Google Scholar] [CrossRef]
- Horn, L.; Bernardo, P.; Sandler, A.; Wagner, H.; Levitan, N.; Levitt, M.L.; Johnson, D.H. A phase II study of paclitaxel + etoposide + cisplatin + concurrent radiation therapy for previously untreated limited stage small cell lung cancer (E2596): A trial of the Eastern Cooperative Oncology Group. J. Thorac. Oncol. 2009, 4, 527–533. [Google Scholar] [CrossRef]
- Hugli, A.; Moro, D.; Mermillod, B.; Bolla, M.; Alberto, P.; Bonnefoi, H.; Miralbell, R. Phase II trial of up-front accelerated thoracic radiotherapy combined with chemotherapy and optional up-front prophylactic cranial irradiation in limited small-cell lung cancer. Groupe d’Oncologie Thoracique des Regions Alpines. J. Clin. Oncol. 2000, 18, 1662–1667. [Google Scholar] [CrossRef] [PubMed]
- Jett, J.R.; Everson, L.; Therneau, T.M.; Krook, J.E.; Dalton, R.J.; Marschke, R.F., Jr.; Veeder, M.H.; Brunk, S.F.; Mailliard, J.A.; Twito, D.I.; et al. Treatment of limited-stage small-cell lung cancer with cyclophosphamide, doxorubicin, and vincristine with or without etoposide: A randomized trial of the North Central Cancer Treatment Group. J. Clin. Oncol. 1990, 8, 33–38. [Google Scholar] [CrossRef]
- Kelley, M.J.; Bogart, J.A.; Hodgson, L.D.; Ansari, R.H.; Atkins, J.N.; Pang, H.; Green, M.R.; Vokes, E.E. Phase II study of induction cisplatin and irinotecan followed by concurrent carboplatin, etoposide, and thoracic radiotherapy for limited-stage small-cell lung cancer, CALGB 30206. J. Thorac. Oncol. 2013, 8, 102–108. [Google Scholar] [CrossRef]
- Komaki, R.; Paulus, R.; Ettinger, D.S.; Videtic, G.M.; Bradley, J.D.; Glisson, B.S.; Langer, C.J.; Sause, W.T.; Curran, W.J., Jr.; Choy, H. Phase II study of accelerated high-dose radiotherapy with concurrent chemotherapy for patients with limited small-cell lung cancer: Radiation Therapy Oncology Group protocol 0239. Int. J. Radiat. Oncol. Biol. Phys. 2012, 83, e531–e536. [Google Scholar] [CrossRef]
- Kubota, K.; Hida, T.; Ishikura, S.; Mizusawa, J.; Nishio, M.; Kawahara, M.; Yokoyama, A.; Imamura, F.; Takeda, K.; Negoro, S.; et al. Etoposide and cisplatin versus irinotecan and cisplatin in patients with limited-stage small-cell lung cancer treated with etoposide and cisplatin plus concurrent accelerated hyperfractionated thoracic radiotherapy (JCOG0202): A randomised phase 3 study. Lancet Oncol. 2014, 15, 106–113. [Google Scholar] [CrossRef] [PubMed]
- Le, Q.T.; Moon, J.; Redman, M.; Williamson, S.K.; Lara, P.N., Jr.; Goldberg, Z.; Gaspar, L.E.; Crowley, J.J.; Moore, D.F., Jr.; Gandara, D.R. Phase II study of tirapazamine, cisplatin, and etoposide and concurrent thoracic radiotherapy for limited-stage small-cell lung cancer: SWOG 0222. J. Clin. Oncol. 2009, 27, 3014–3019. [Google Scholar] [CrossRef] [PubMed]
- Laack, E.; Thom, I.; Krull, A.; Engel-Riedel, W.; Muller, T.; Meissner, C.; Durk, H.; Fischer, J.; Gutz, S.; Kortsik, C.; et al. A phase II study of irinotecan (CPT-11) and carboplatin in patients with limited disease small cell lung cancer (SCLC). Lung Cancer 2007, 57, 181–186. [Google Scholar] [CrossRef] [PubMed]
- Manoharan, P.; Salem, A.; Mistry, H.; Gornall, M.; Harden, S.; Julyan, P.; Locke, I.; McAleese, J.; McMenemin, R.; Mohammed, N.; et al. (18)F-Fludeoxyglucose PET/CT in SCLC: Analysis of the CONVERT Randomized Controlled Trial. J. Thorac. Oncol. 2019, 14, 1296–1305. [Google Scholar] [CrossRef] [PubMed]
- Maurer, L.H.; Herndon, J.E., 2nd; Hollis, D.R.; Aisner, J.; Carey, R.W.; Skarin, A.T.; Perry, M.C.; Eaton, W.L.; Zacharski, L.L.; Hammond, S.; et al. Randomized trial of chemotherapy and radiation therapy with or without warfarin for limited-stage small-cell lung cancer: A Cancer and Leukemia Group B study. J. Clin. Oncol. 1997, 15, 3378–3387. [Google Scholar] [CrossRef]
- McClay, E.F.; Bogart, J.; Herndon, J.E., 2nd; Watson, D.; Evans, L.; Seagren, S.L.; Green, M.R.; Cancer and Leukemia Group B Study (9235). A phase III trial evaluating the combination of cisplatin, etoposide, and radiation therapy with or without tamoxifen in patients with limited-stage small cell lung cancer: Cancer and Leukemia Group B Study (9235). Am. J. Clin. Oncol. 2005, 28, 81–90. [Google Scholar] [CrossRef]
- Miller, A.A.; Wang, X.F.; Bogart, J.A.; Hodgson, L.D.; Rocha Lima, C.M.; Radford, J.E.; Vokes, E.E.; Green, M.R.; Cancer and Leukemia Group B (CALGB). Phase II trial of paclitaxel-topotecan-etoposide followed by consolidation chemoradiotherapy for limited-stage small cell lung cancer: CALGB 30002. J. Thorac. Oncol. 2007, 2, 645–651. [Google Scholar] [CrossRef]
- Murray, N.; Coy, P.; Pater, J.L.; Hodson, I.; Arnold, A.; Zee, B.C.; Payne, D.; Kostashuk, E.C.; Evans, W.K.; Dixon, P.; et al. Importance of timing for thoracic irradiation in the combined modality treatment of limited-stage small-cell lung cancer. The National Cancer Institute of Canada Clinical Trials Group. J. Clin. Oncol. 1993, 11, 336–344. [Google Scholar] [CrossRef]
- Perry, M.C.; Herndon, J.E., 3rd; Eaton, W.L.; Green, M.R. Thoracic radiation therapy added to chemotherapy for small-cell lung cancer: An update of Cancer and Leukemia Group B Study 8083. J. Clin. Oncol. 1998, 16, 2466–2467. [Google Scholar] [CrossRef]
- Qiu, B.; Li, Q.; Liu, J.; Huang, Y.; Pang, Q.; Zhu, Z.; Yang, X.; Wang, B.; Chen, L.; Fang, J.; et al. Moderately Hypofractionated Once-Daily Compared with Twice-Daily Thoracic Radiation Therapy Concurrently with Etoposide and Cisplatin in Limited-Stage Small Cell Lung Cancer: A Multicenter, Phase II, Randomized Trial. Int. J. Radiat. Oncol. Biol. Phys. 2021, 111, 424–435. [Google Scholar] [CrossRef]
- Salama, J.K.; Hodgson, L.; Pang, H.; Urbanic, J.J.; Blackstock, A.W.; Schild, S.E.; Crawford, J.; Bogart, J.A.; Vokes, E.E.; Cancer and Leukemia Group, B. A pooled analysis of limited-stage small-cell lung cancer patients treated with induction chemotherapy followed by concurrent platinum-based chemotherapy and 70 Gy daily radiotherapy: CALGB 30904. J. Thorac. Oncol. 2013, 8, 1043–1049. [Google Scholar] [CrossRef]
- Schild, S.E.; Bonner, J.A.; Shanahan, T.G.; Brooks, B.J.; Marks, R.S.; Geyer, S.M.; Hillman, S.L.; Farr, G.H., Jr.; Tazelaar, H.D.; Krook, J.E.; et al. Long-term results of a phase III trial comparing once-daily radiotherapy with twice-daily radiotherapy in limited-stage small-cell lung cancer. Int. J. Radiat. Oncol. Biol. Phys. 2004, 59, 943–951. [Google Scholar] [CrossRef]
- Spiro, S.G.; James, L.E.; Rudd, R.M.; Trask, C.W.; Tobias, J.S.; Snee, M.; Gilligan, D.; Murray, P.A.; Ruiz de Elvira, M.C.; O’Donnell, K.M.; et al. Early compared with late radiotherapy in combined modality treatment for limited disease small-cell lung cancer: A London Lung Cancer Group multicenter randomized clinical trial and meta-analysis. J. Clin. Oncol. 2006, 24, 3823–3830. [Google Scholar] [CrossRef]
- Takada, M.; Fukuoka, M.; Kawahara, M.; Sugiura, T.; Yokoyama, A.; Yokota, S.; Nishiwaki, Y.; Watanabe, K.; Noda, K.; Tamura, T.; et al. Phase III study of concurrent versus sequential thoracic radiotherapy in combination with cisplatin and etoposide for limited-stage small-cell lung cancer: Results of the Japan Clinical Oncology Group Study 9104. J. Clin. Oncol. 2002, 20, 3054–3060. [Google Scholar] [CrossRef]
- Thomas, C.R.; Jr Giroux, D.J.; Stelzer, K.J.; Craig, J.B.; Laufman, L.R.; Taylor, S.A.; Goodwin, J.W.; Crowley, J.J.; Livingston, R.B. Concurrent cisplatin, prolonged oral etoposide, and vincristine plus chest and brain irradiation for limited small cell lung cancer: A phase II study of the Southwest Oncology Group (SWOG-9229). Int. J. Radiat. Oncol. Biol. Phys. 1998, 40, 1039–1047. [Google Scholar] [CrossRef] [PubMed]
- Thomas, C.R., Jr.; Giroux, D.J.; Janaki, L.M.; Turrisi, A.T., 3rd; Crowley, J.J.; Taylor, S.A.; McCracken, J.D.; Shankir Giri, P.G.; Gordon, W., Jr.; Livingston, R.B.; et al. Ten-year follow-up of Southwest Oncology Group 8269: A phase II trial of concomitant cisplatin-etoposide and daily thoracic radiotherapy in limited small-cell lung cancer. Lung Cancer 2001, 33, 213–219. [Google Scholar] [CrossRef] [PubMed]
- Xia, B.; Hong, L.Z.; Cai, X.W.; Zhu, Z.F.; Liu, Q.; Zhao, K.L.; Fan, M.; Mao, J.F.; Yang, H.J.; Wu, K.L.; et al. Phase 2 study of accelerated hypofractionated thoracic radiation therapy and concurrent chemotherapy in patients with limited-stage small-cell lung cancer. Int. J. Radiat. Oncol. Biol. Phys. 2015, 91, 517–523. [Google Scholar] [CrossRef]
- Tsuchiya-Kawano, Y.; Sasaki, T.; Yamaguchi, H.; Hirano, K.; Horiike, A.; Satouchi, M.; Hosokawa, S.; Morinaga, R.; Komiya, K.; Inoue, K.; et al. Updated Survival Data for a Phase I/II Study of Carboplatin plus Nab-Paclitaxel and Concurrent Radiotherapy in Patients with Locally Advanced Non-Small Cell Lung Cancer. Oncologist 2020, 25, 475–e891. [Google Scholar] [CrossRef]
- Puig, P.E.; Guilly, M.N.; Bouchot, A.; Droin, N.; Cathelin, D.; Bouyer, F.; Favier, L.; Ghiringhelli, F.; Kroemer, G.; Solary, E.; et al. Tumor cells can escape DNA-damaging cisplatin through DNA endoreduplication and reversible polyploidy. Cell Biol. Int. 2008, 32, 1031–1043. [Google Scholar] [CrossRef] [PubMed]
- Ying, M.; Liu, J.; Zhou, W.; Weng, K.; Long, B.; Wang, Y. The Role of Additional Chemotherapy in Combination with Concurrent Chemoradiotherapy for Locally Advanced Inoperable Non-Small Cell Lung Cancer, a Systematic Review and Meta-Analysis of 12 Randomized Trials. Cancer Investig. 2019, 37, 376–386. [Google Scholar] [CrossRef] [PubMed]
- Liu, T.; He, Z.; Dang, J.; Li, G. Comparative efficacy and safety for different chemotherapy regimens used concurrently with thoracic radiation for locally advanced non-small cell lung cancer: A systematic review and network meta-analysis. Radiat. Oncol. 2019, 14, 55. [Google Scholar] [CrossRef] [PubMed]
- Sheiner, L.B.; Beal, S.L. Evaluation of methods for estimating population pharmacokinetic parameters, I.I. Biexponential model and experimental pharmacokinetic data. J. Pharmacokinet. Biopharm. 1981, 9, 635–651. [Google Scholar] [CrossRef] [PubMed]


| Variable | Adjuvant NSCLC Controls Group a | Adjuvant NSCLC Chemotherapy Group a | ADAURA NSCLC EGFR-Mutant Control Group | ADAURA NSCLC EGFR- Mutant Adjuvant Osimertinib Group | Locally Advanced NSCLC Chemoradiation b | Limited SCLC c |
|---|---|---|---|---|---|---|
| No. curves | 4 | 4 | 1 | 1 | 57 | 55 |
| Overall PFS half-life (months) | 50.0 (35.0–64.8) | 61.1 (46.2–100.0) | 25.0 | 109.1 | 13.9 (7.2–40.3) | 16.2 (7.7–30.0) |
| Onset of late curve convexity (months) | 3.3 (3.0–4.3) | 6.1 (4.3–7.7) | 2.9 | 30.0 g | 4.6 (1.5–13.1) h | 6.2 (3.1–19.0) |
| % short PFS d | 59 (50–94) | 42 (40–60) | 83 | No fit for 2-phase decay model | 85 (4–95) h | 88 (67–97) i |
| Fast t1/2 (months) e | 11.9 (10.0–55.4) | 17.4 (9.9–29.5) | 24.4 | 9.3 (4.0–15.7) h | 10.7 (5.4–15.6) i | |
| Slow t1/2 (months) f | 1.1 × 10¹⁴ (207.9–4.1 × 10¹⁵) | 396.2 (114.2–3.8 × 10¹⁵) | 1.2 × 10¹² | 3.3 × 10¹⁵ (21.8–6.1 × 10¹⁵) h | 3.7 × 10¹⁵ (59.5–6.1 × 10¹⁵) i |
| Characteristic | Hit Constraint | Did Not Hit Constraint | p |
|---|---|---|---|
| No. curves | 62 | 49 | |
| Maximum curve length (median, months) | 64.8 | 85.6 | 0.03 |
| Proportion of population progression-free at last follow-up (median, %) | 17.4 | 15.4 | 0.29 |
| Proportion in potentially cured subpopulation (median, %) | 12 | 19 | 0.006 |
| Upper boundary 95% CI could be calculated (% of curves) a | 95 | 94 | 0.99 |
| Lower boundary 95% CI could be calculated (% of curves) a | 97 | 98 | 0.99 |
| PFS half-life for the relapsing subpopulation (median, months) | 10.3 | 9.9 | 0.09 |
| Upper boundary 95% CI could be calculated (% of curves) a | 27 | 73 | <0.0001 |
| Lower boundary 95% CI could be calculated (% of curves) a | 97 | 100 | 0.50 |
| PFS half-life for the potentially cured subpopulation (median, months) | 4.3 × 10¹⁵ | 370.5 | <0.0001 |
| Upper boundary 95% CI could be calculated (% of curves) a | 0 | 37 | <0.0001 |
| Lower boundary 95% CI could be calculated (% of curves) a | 2 | 94 | <0.0001 |
| Onset PFS curve convexity (median, months) | 4.6 | 4.4 | 0.29 |
| 2-phase decay model R2 (median) | 0.96 | 0.98 | <0.0001 |
| Time a | % of Relapsing Subpopulation Who Remain Progression-Free e | % of Long PFS Adjuvant c Patients Alive and Progression-Free f | % of All Remaining Patients Destined to Eventually Relapse g | % of Those Remaining Progression-Free Who May Be Cured i | |||||||||
|---|---|---|---|---|---|---|---|---|---|---|---|---|---|
| Adjuvant Controls b | Adjuvant c | NSCLC Chemoradiation d | SCLC | Adjuvant Controls b | Adjuvant c,h | NSCLC Chemoradiation d | SCLC | Adjuvant Controls b | Adjuvant c,h | NSCLC Chemoradiation d | SCLC | ||
| 0 | 100 | 100 | 100 | 100 | 100 | 59 | ≥42 | 86 | 88 | 41 | ≤58 | 14 | 12 |
| 2 | 89 | 92 | 86 | 88 | 99.7 | 56 | ≥40 | 83 | 87 | 44 | ≤60 | 17 | 13 |
| 3 | 84 | 89 | 80 | 82 | 99.5 | 55 | ≥39 | 82 | 86 | 45 | ≤61 | 18 | 14 |
| 4 | 79 | 85 | 74 | 77 | 99.3 | 53 | ≥38 | 81 | 85 | 47 | ≤62 | 19 | 15 |
| 6 | 71 | 79 | 64 | 68 | 99 | 50 | ≥37 | 78 | 83 | 50 | ≤63 | 22 | 17 |
| 8 | 63 | 73 | 55 | 60 | 98.6 | 47 | ≥35 | 74 | 81 | 53 | ≤65 | 24 | 19 |
| 9 | 59 | 70 | 51 | 56 | 98.4 | 46 | ≥34 | 73 | 80 | 54 | ≤66 | 26 | 20 |
| 12 | 50 | 62 | 41 | 46 | 98 | 42 | ≥31 | 70 | 77 | 58 | ≤69 | 30 | 23 |
| 18 | 35 | 49 | 26 | 31 | 97 | 34 | ≥27 | 60 | 70 | 66 | ≥73 | 40 | 30 |
| 24 | 25 | 38 | 17 | 21 | 96 | 26 | ≥23 | 49 | 61 | 74 | ≤77 | 51 | 39 |
| 36 | 12 | 24 | 7 | 10 | 94 | 15 | ≥16 | 28 | 42 | 85 | ≤84 | 72 | 58 |
| 48 | 6 | 15 | 3 | 4 | 92 | 8 | ≥10 | 14 | 25 | 92 | ≤90 | 86 | 75 |
| 60 | 3 | 9 | 1 | 2 | 90 | 4 | ≥7 | 6 | 13 | 96 | ≤93 | 94 | 87 |
| 120 | 0.1 | 0.1 | 0.01 | 0.04 | 81 | 0.1 | ≥0.7 | 0.1 | 0.3 | 99.9 | ≤99.3 | 99.9 | 99.7 |
| Months between Scans | 2 | 4 | 6 | 12 | 2 | 4 | 6 | 12 | 2 | 4 | 6 | 12 | 2 | 4 | 6 | 12 | 2 | 4 | 6 | 12 |
|---|---|---|---|---|---|---|---|---|---|---|---|---|---|---|---|---|---|---|---|---|
| Interval start (months from therapy initiation) | For patients remaining progression-free at interval start, % who would progress by the next scan for scans performed after 2, 4, 6, or 12 months a | |||||||||||||||||||
| Adjuvant controls | Adjuvant chemotherapy | ADAURA control | Chemoradiation | SCLC b | ||||||||||||||||
| 0 | 6 | 12 | 17 | 30 | 3 | 6 | 9 | 16 | 5 | 9 | 13 | 24 | 12 | 22 | 31 | 50 | 11 | 20 | 28 | 48 |
| 2 | 6 | 12 | 16 | 28 | 3 | 6 | 8 | 15 | 5 | 9 | 13 | 24 | 12 | 22 | 30 | 49 | 10 | 20 | 28 | 47 |
| 4 | 6 | 11 | 15 | 27 | 3 | 6 | 8 | 15 | 5 | 9 | 13 | 24 | 11 | 21 | 29 | 48 | 10 | 20 | 27 | 46 |
| 6 | 6 | 11 | 15 | 25 | 3 | 5 | 8 | 14 | 5 | 9 | 13 | 23 | 11 | 20 | 28 | 46 | 10 | 19 | 27 | 45 |
| 8 | 5 | 10 | 14 | 24 | 3 | 5 | 7 | 13 | 5 | 9 | 13 | 23 | 11 | 20 | 27 | 45 | 10 | 19 | 26 | 44 |
| 12 | 5 | 9 | 12 | 21 | 3 | 5 | 7 | 12 | 5 | 9 | 12 | 23 | 10 | 18 | 25 | 41 | 9 | 18 | 25 | 42 |
| 18 | 4 | 7 | 10 | 17 | 2 | 4 | 6 | 10 | 4 | 8 | 12 | 22 | 8 | 16 | 21 | 35 | 8 | 16 | 22 | 38 |
| 24 | 3 | 6 | 8 | 13 | 2 | 3 | 5 | 9 | 4 | 8 | 11 | 21 | 7 | 13 | 18 | 29 | 7 | 14 | 19 | 33 |
| 36 | 2 | 3 | 4 | 8 | 1 | 2 | 3 | 6 | 4 | 7 | 10 | 18 | 4 | 7 | 10 | 16 | 5 | 10 | 13 | 22 |
| 48 | 1 | 2 | 2 | 4 | 1 | 2 | 2 | 4 | 3 | 6 | 9 | 16 | 2 | 4 | 5 | 8 | 3 | 6 | 8 | 13 |
| 60 | <1 | 1 | 1 | 2 | <1 | 1 | 1 | 3 | 3 | 5 | 8 | 14 | 1 | 2 | 2 | 4 | 2 | 3 | 4 | 7 |
| 120 | <1 | <1 | <1 | <1 | <1 | <1 | <1 | <1 | 1 | 2 | 2 | 4 | <1 | <1 | <1 | <1 | <1 | <1 | <1 | <1 |
| Therapy a | No. Studies | PFS Overall t1/2 (Months) | % Potentially Cured | ||||
|---|---|---|---|---|---|---|---|
| Median | 95% Cis e | Median | 95% Cis e | ||||
| Low | High | Low | High | ||||
| Platinum used | |||||||
| Cisplatin | 28 | 13.7 | 13.0 | 16.7 | 12.5 | 12 | 18 |
| Carboplatin b | 13 | 11.4 | 10.0 | 13.7 | 11 | 9 | 14 |
| Agent combined with a platinum | |||||||
| Taxane c | 14 | 11.5 | 10.1 | 13.4 | 10.5 | 9 | 14 |
| + Carboplatin | 10 | 11.8 | 9.9 | 14.5 | 11.5 | 9 | 16 |
| + Cisplatin | 4 | 10.9 | 8.7 | 12.8 | 9.5 | 5 | 13 |
| Topoisomerase inhibitor d | 4 | 11.9 | 7.3 | 17.4 | 12.5 | 7 | 17 |
| Pemetrexed | 5 | 14.1 | 12.9 | 16.3 | 11 | 7 | 15 |
| Vinca alkaloid | 11 | 13.6 | 10.6 | 17.6 | 13 | 11 | 22 |
| S-1 | 3 | 16.4 | 8.5 | 26.1 | 21 | 0 | 43 |
| Induction or Consolidation chemotherapy before or after concurrent chemoradiotherapy | |||||||
| Induction | 14 | 14.9 | 12.8 | 18.3 | 13.5 | 11 | 22 |
| Consolidation | 8 | 13.2 | 10.4 | 17.3 | 12.5 | 9 | 18.5 |
| Neither | 27 | 13.7 | 12.2 | 16.2 | 13 | 13 | 25 |
Disclaimer/Publisher’s Note: The statements, opinions and data contained in all publications are solely those of the individual author(s) and contributor(s) and not of MDPI and/or the editor(s). MDPI and/or the editor(s) disclaim responsibility for any injury to people or property resulting from any ideas, methods, instructions or products referred to in the content. |
© 2024 by the authors. Licensee MDPI, Basel, Switzerland. This article is an open access article distributed under the terms and conditions of the Creative Commons Attribution (CC BY) license (https://creativecommons.org/licenses/by/4.0/).
Share and Cite
Stewart, D.J.; Cole, K.; Bosse, D.; Brule, S.; Fergusson, D.; Ramsay, T. Population Survival Kinetics Derived from Clinical Trials of Potentially Curable Lung Cancers. Curr. Oncol. 2024, 31, 1600-1617. https://doi.org/10.3390/curroncol31030122
Stewart DJ, Cole K, Bosse D, Brule S, Fergusson D, Ramsay T. Population Survival Kinetics Derived from Clinical Trials of Potentially Curable Lung Cancers. Current Oncology. 2024; 31(3):1600-1617. https://doi.org/10.3390/curroncol31030122
Chicago/Turabian StyleStewart, David J., Katherine Cole, Dominick Bosse, Stephanie Brule, Dean Fergusson, and Tim Ramsay. 2024. "Population Survival Kinetics Derived from Clinical Trials of Potentially Curable Lung Cancers" Current Oncology 31, no. 3: 1600-1617. https://doi.org/10.3390/curroncol31030122