Spectral Computed Tomography-Derived Iodine Content and Tumor Response in the Follow-Up of Neuroendocrine Tumors—A Single-Center Experience

 , ,
, ,
Abstract
:
1. Introduction
2. Materials and Methods
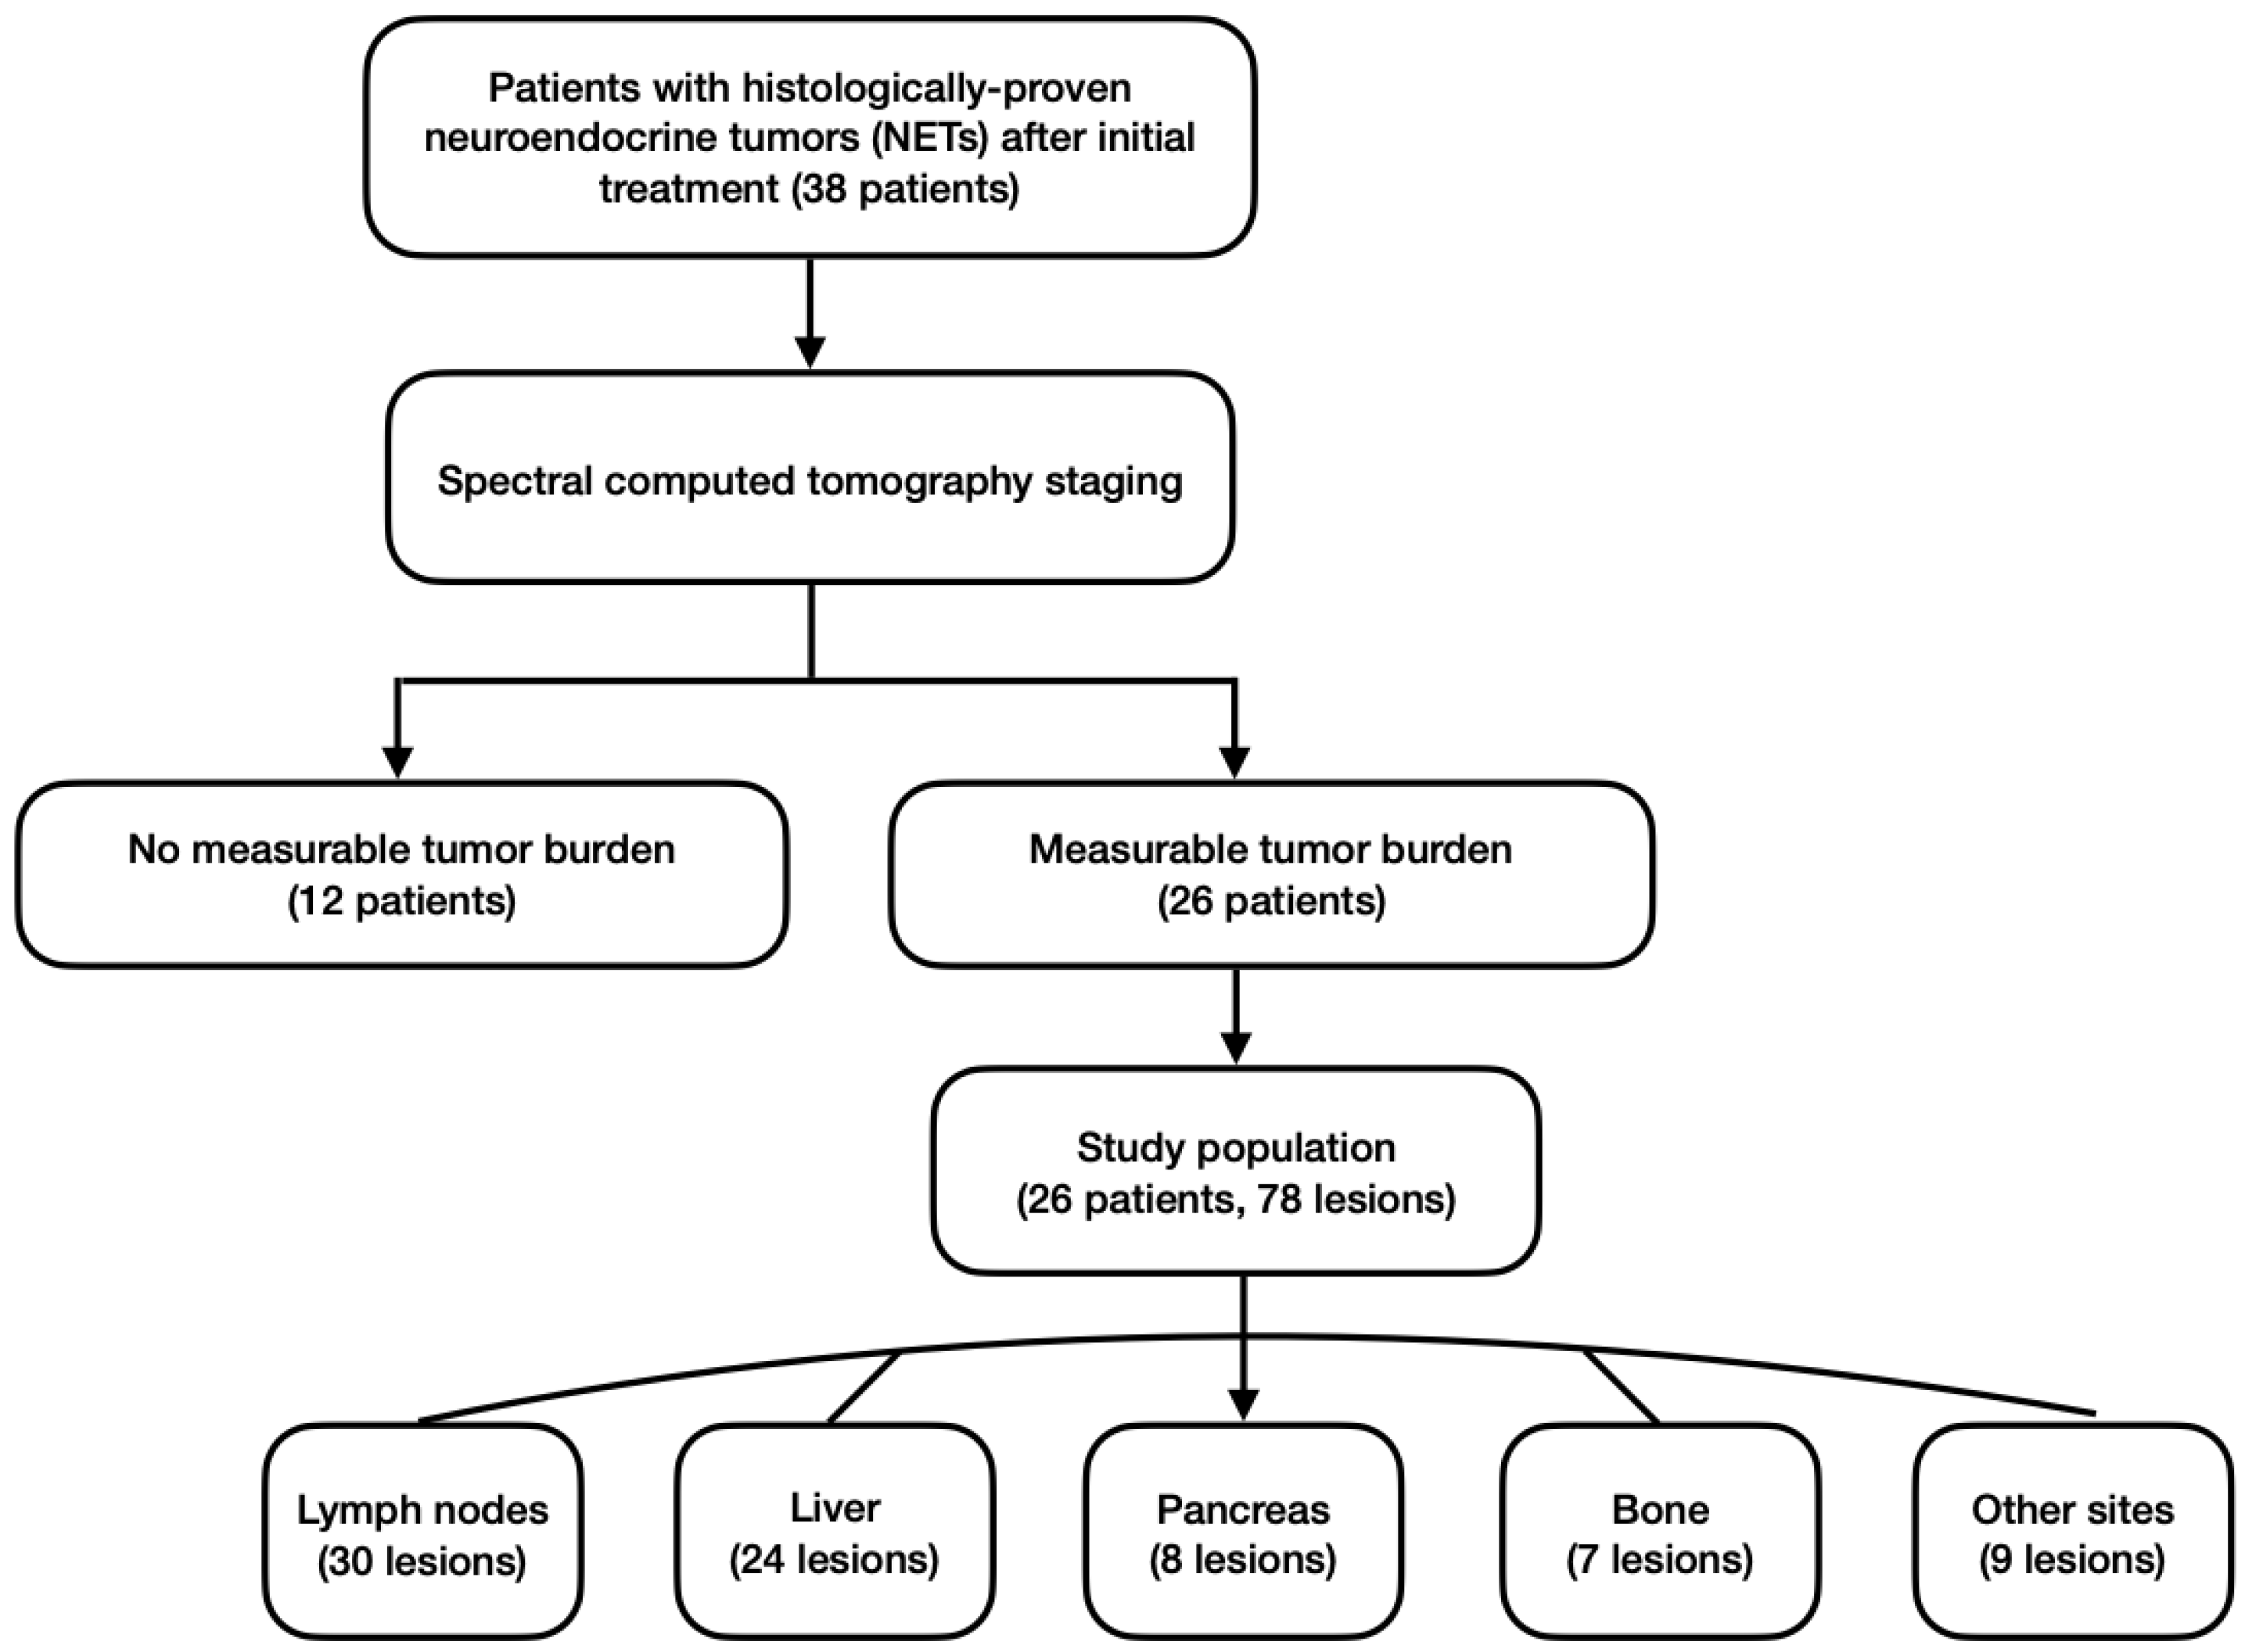
2.1. Study Population and Study Design
2.2. Scan Protocol
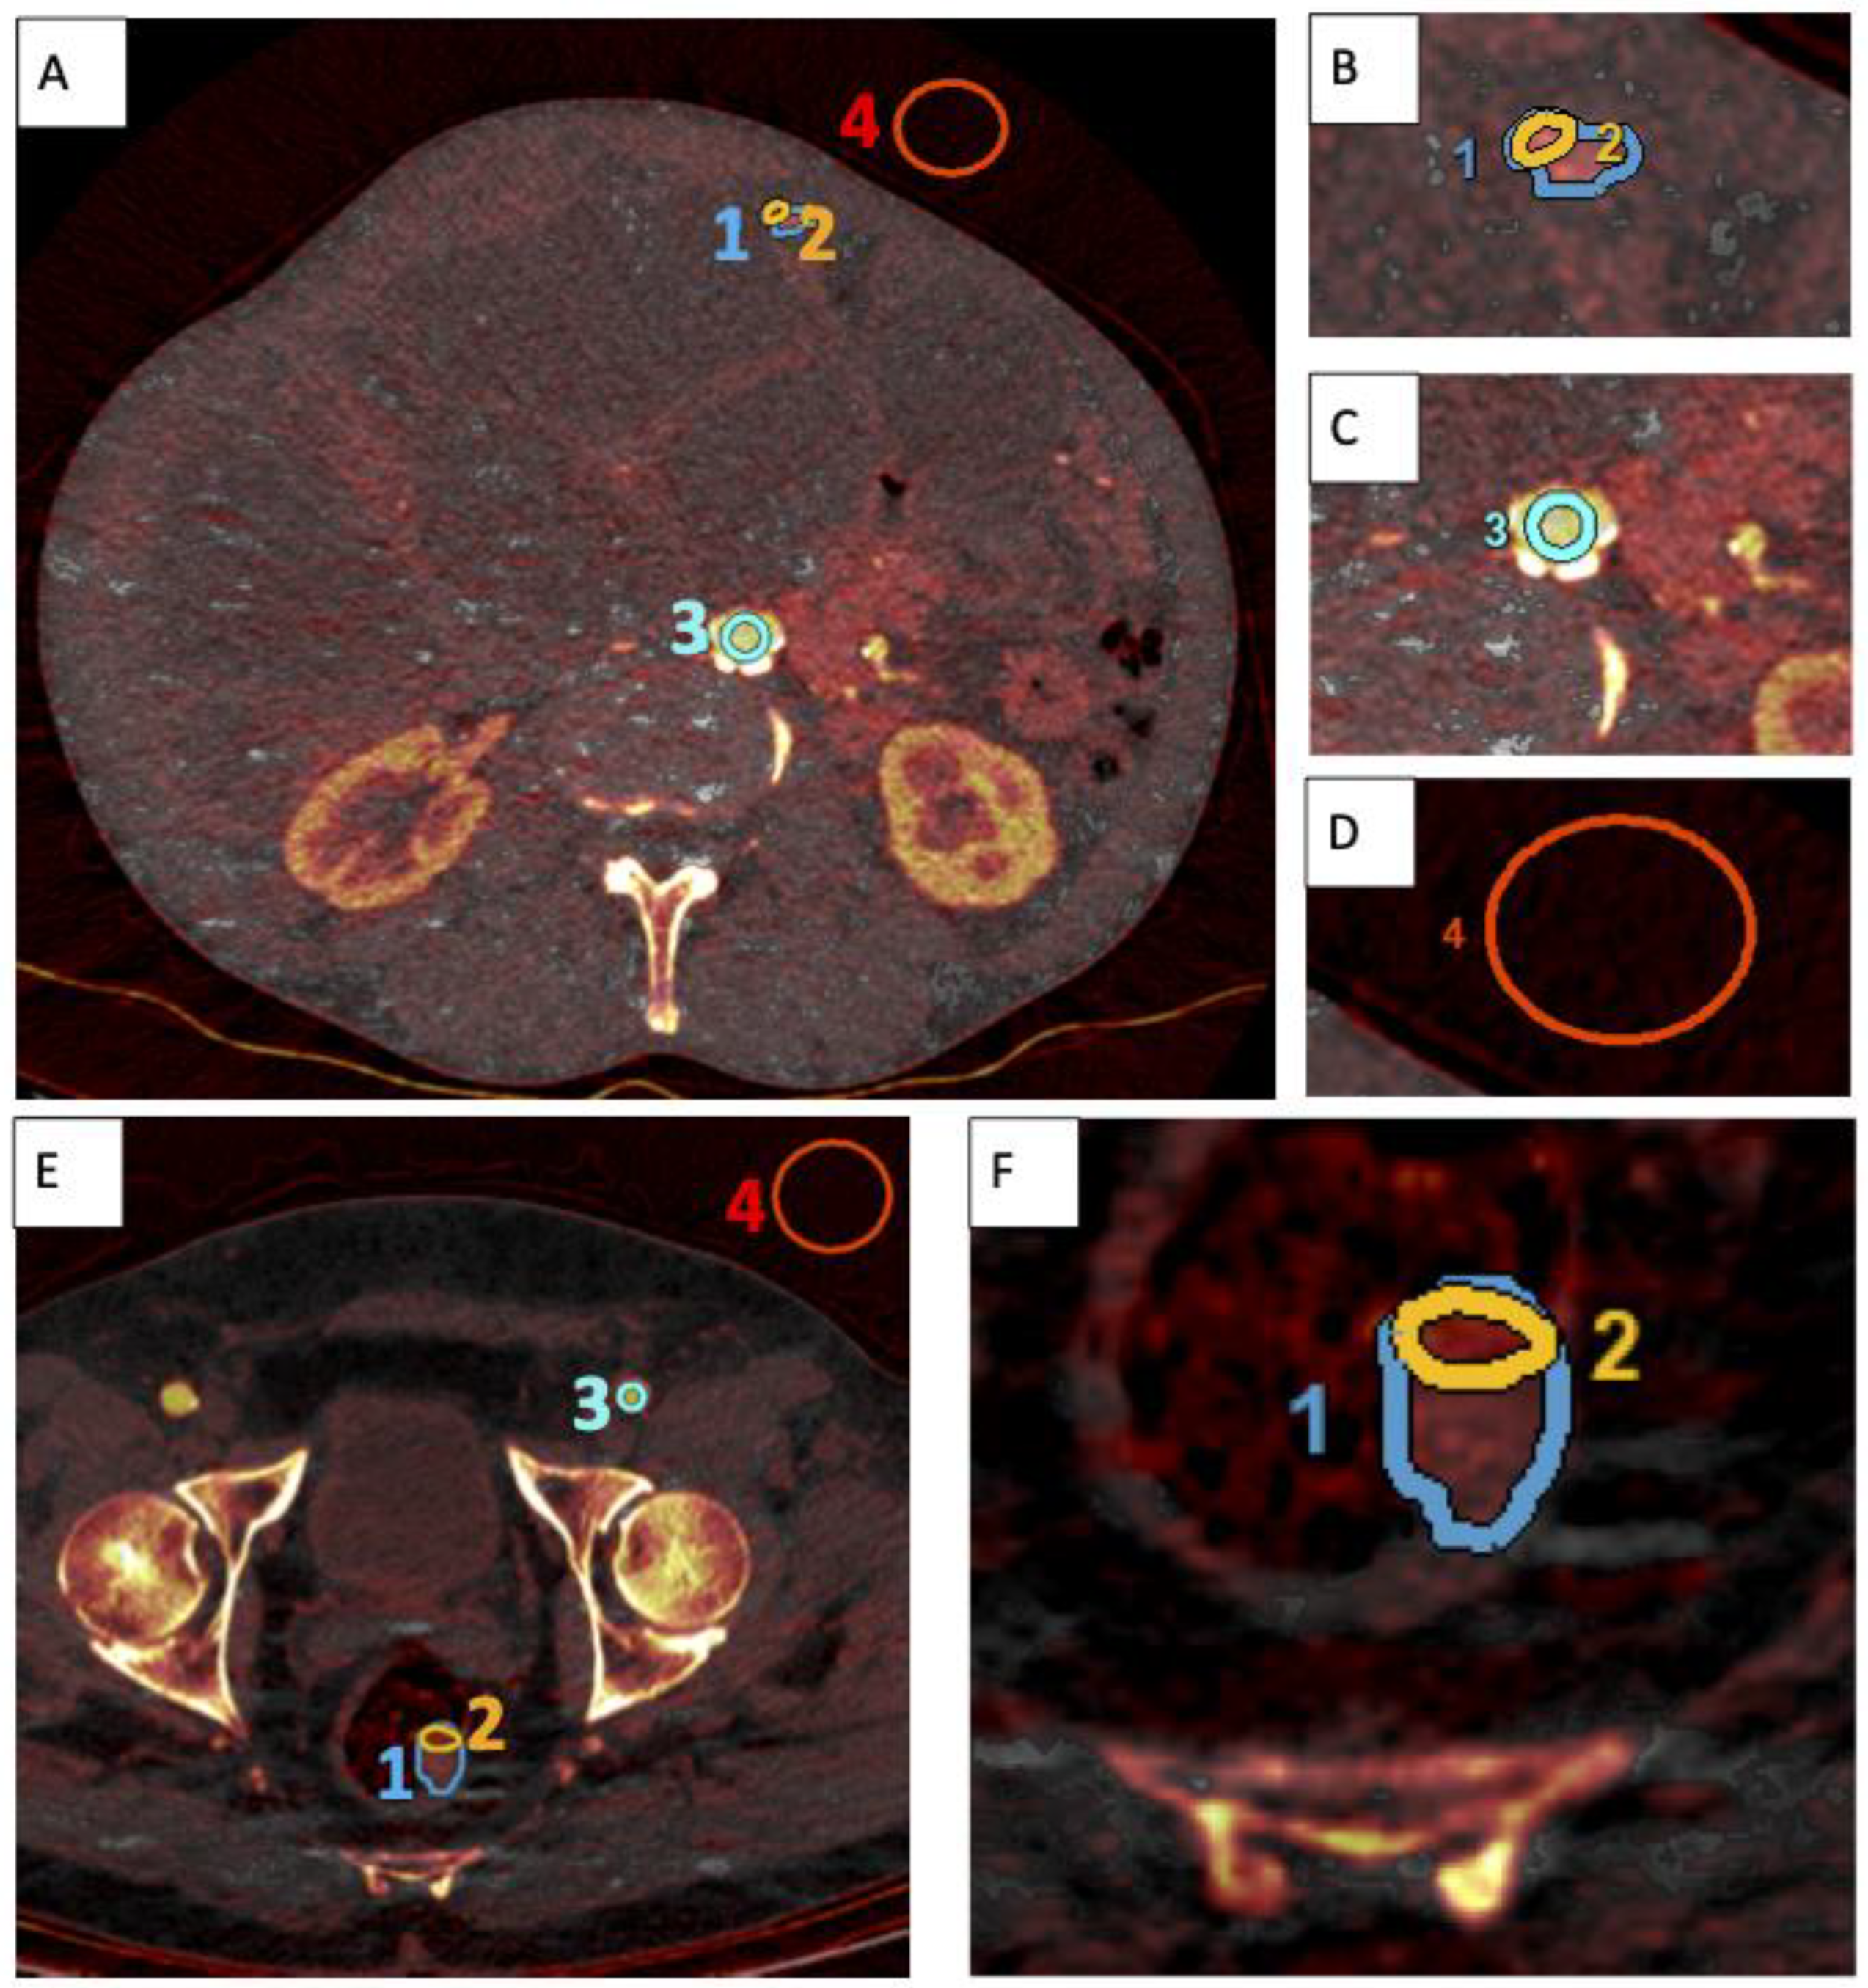
2.3. Image Analysis
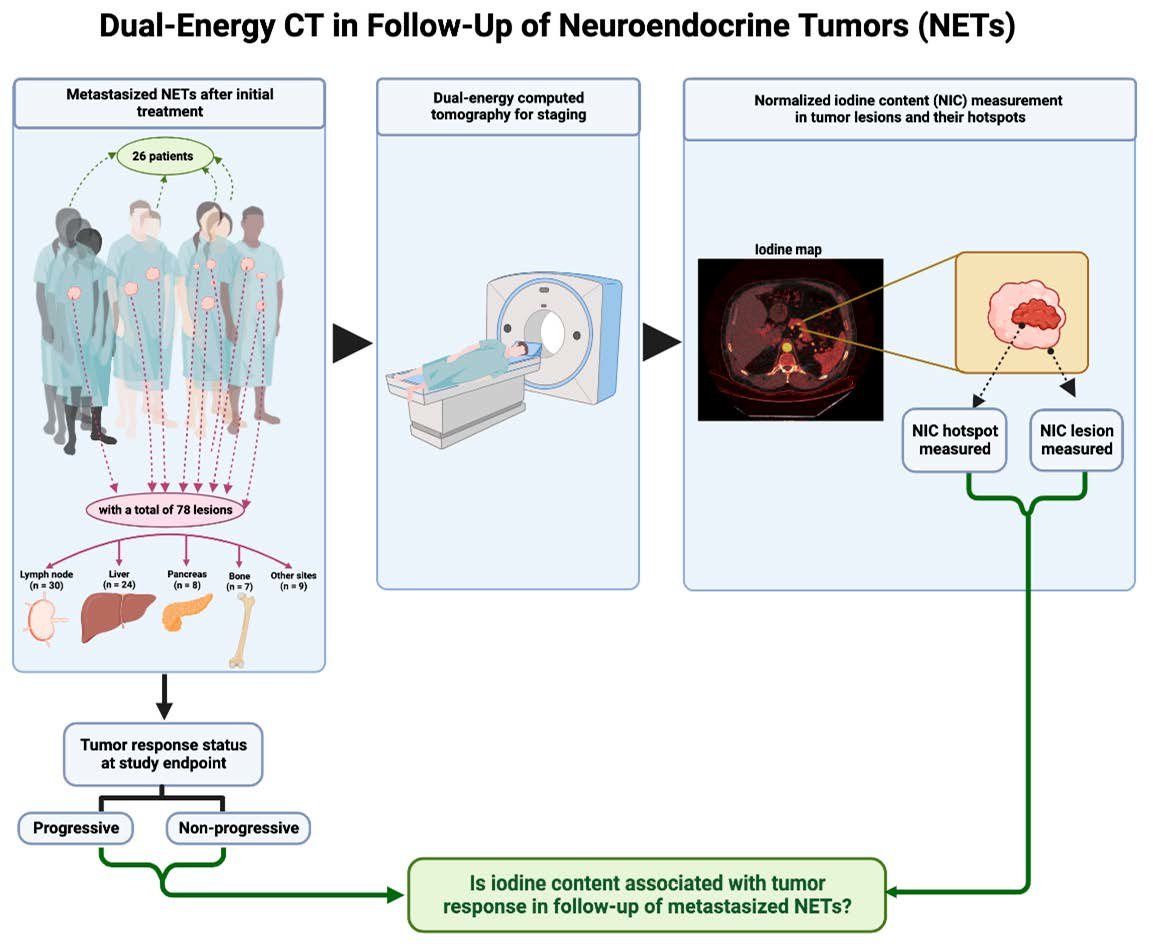
2.4. Statistical Analysis and Graphical Abstract
3. Results
3.1. Characteristics of Study Population
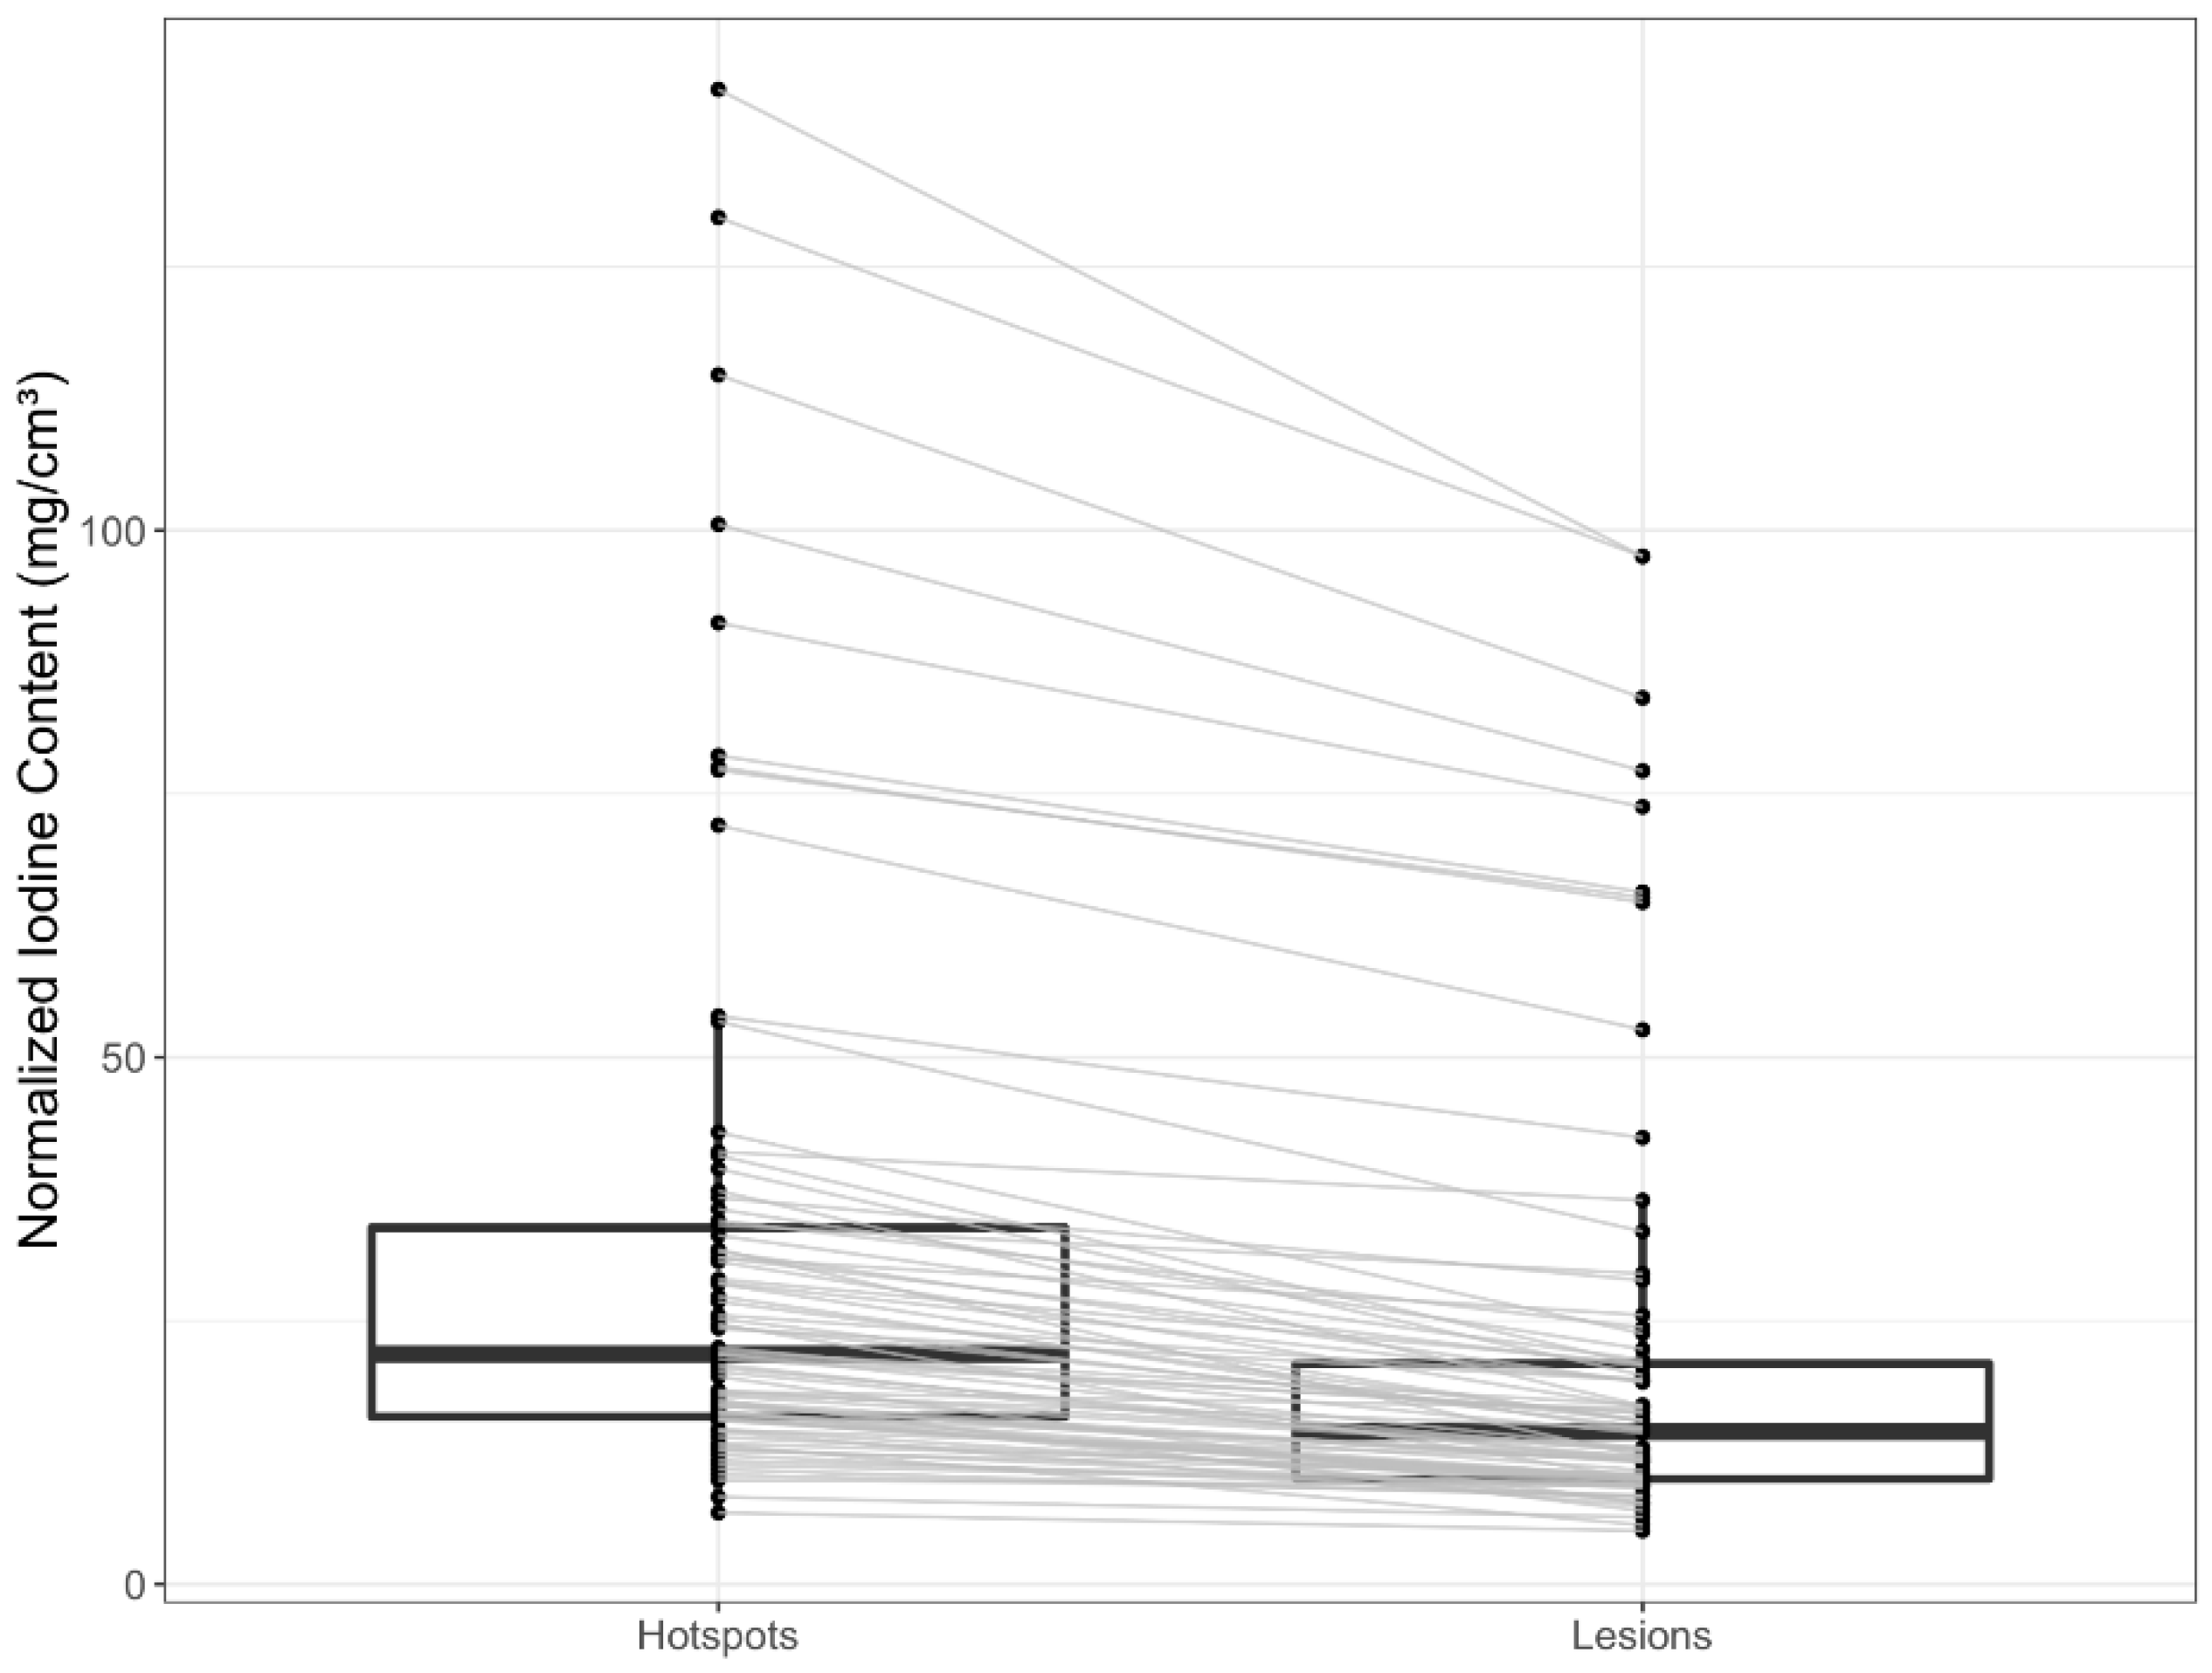
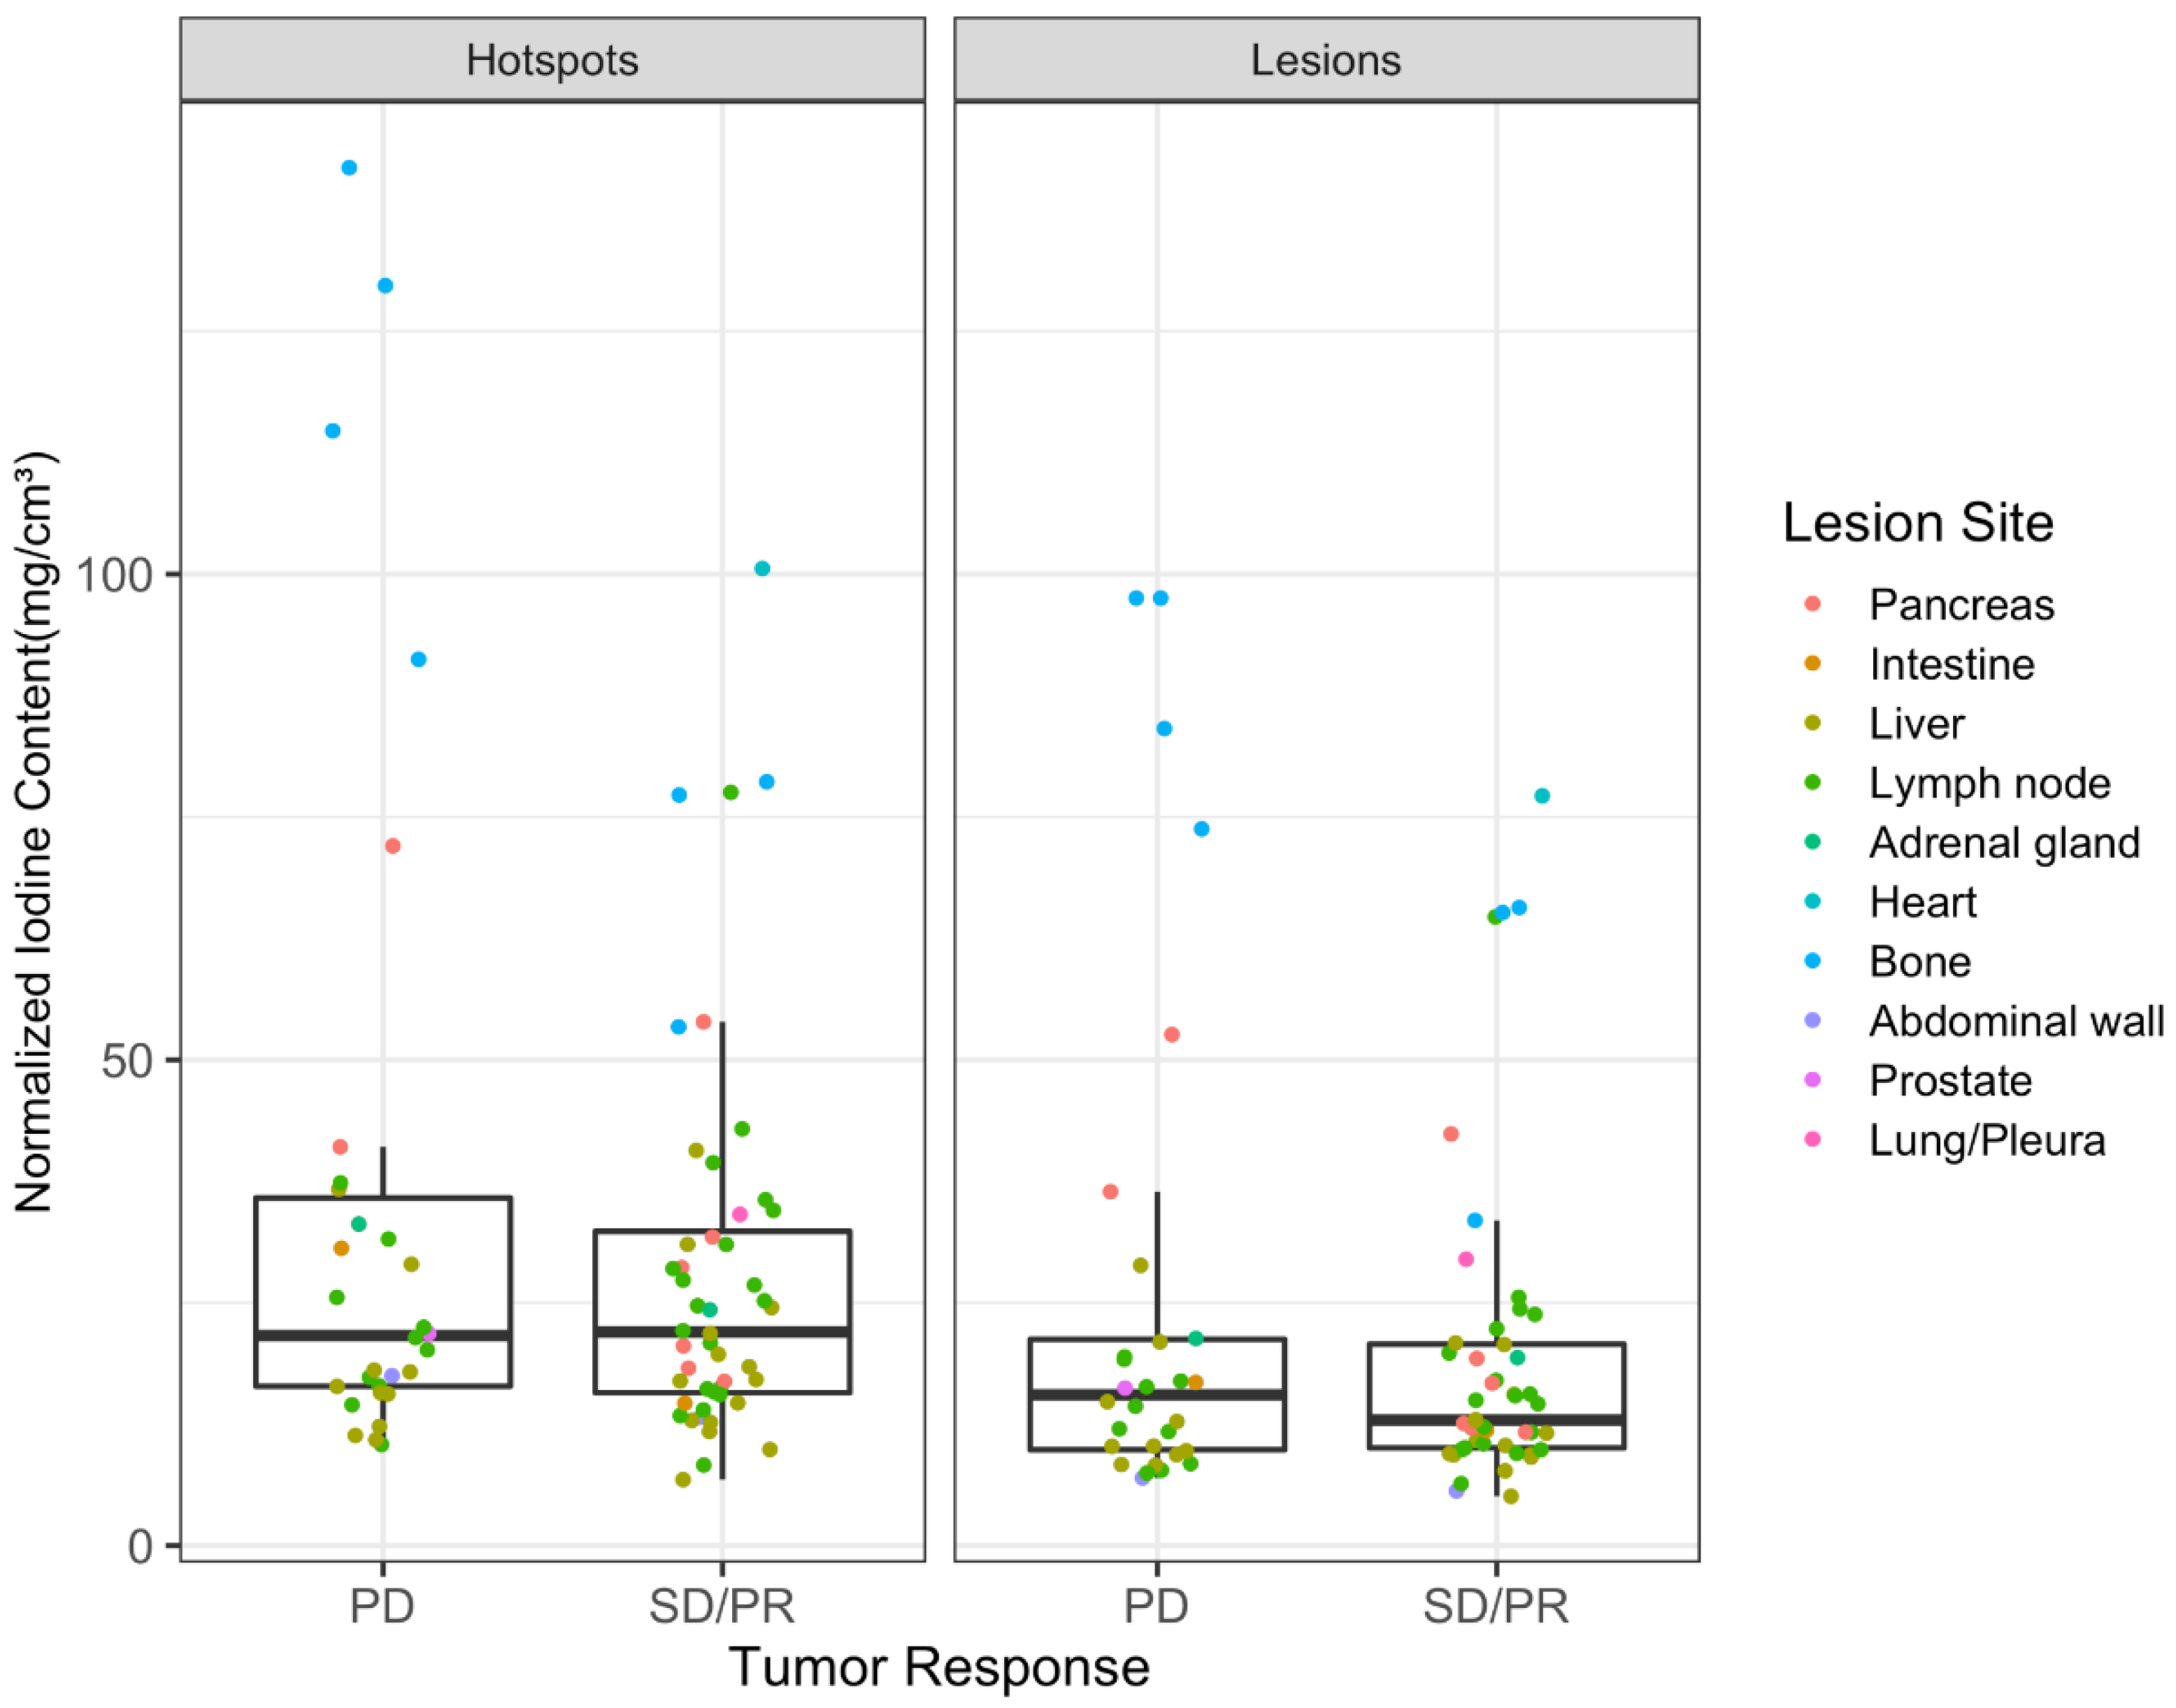
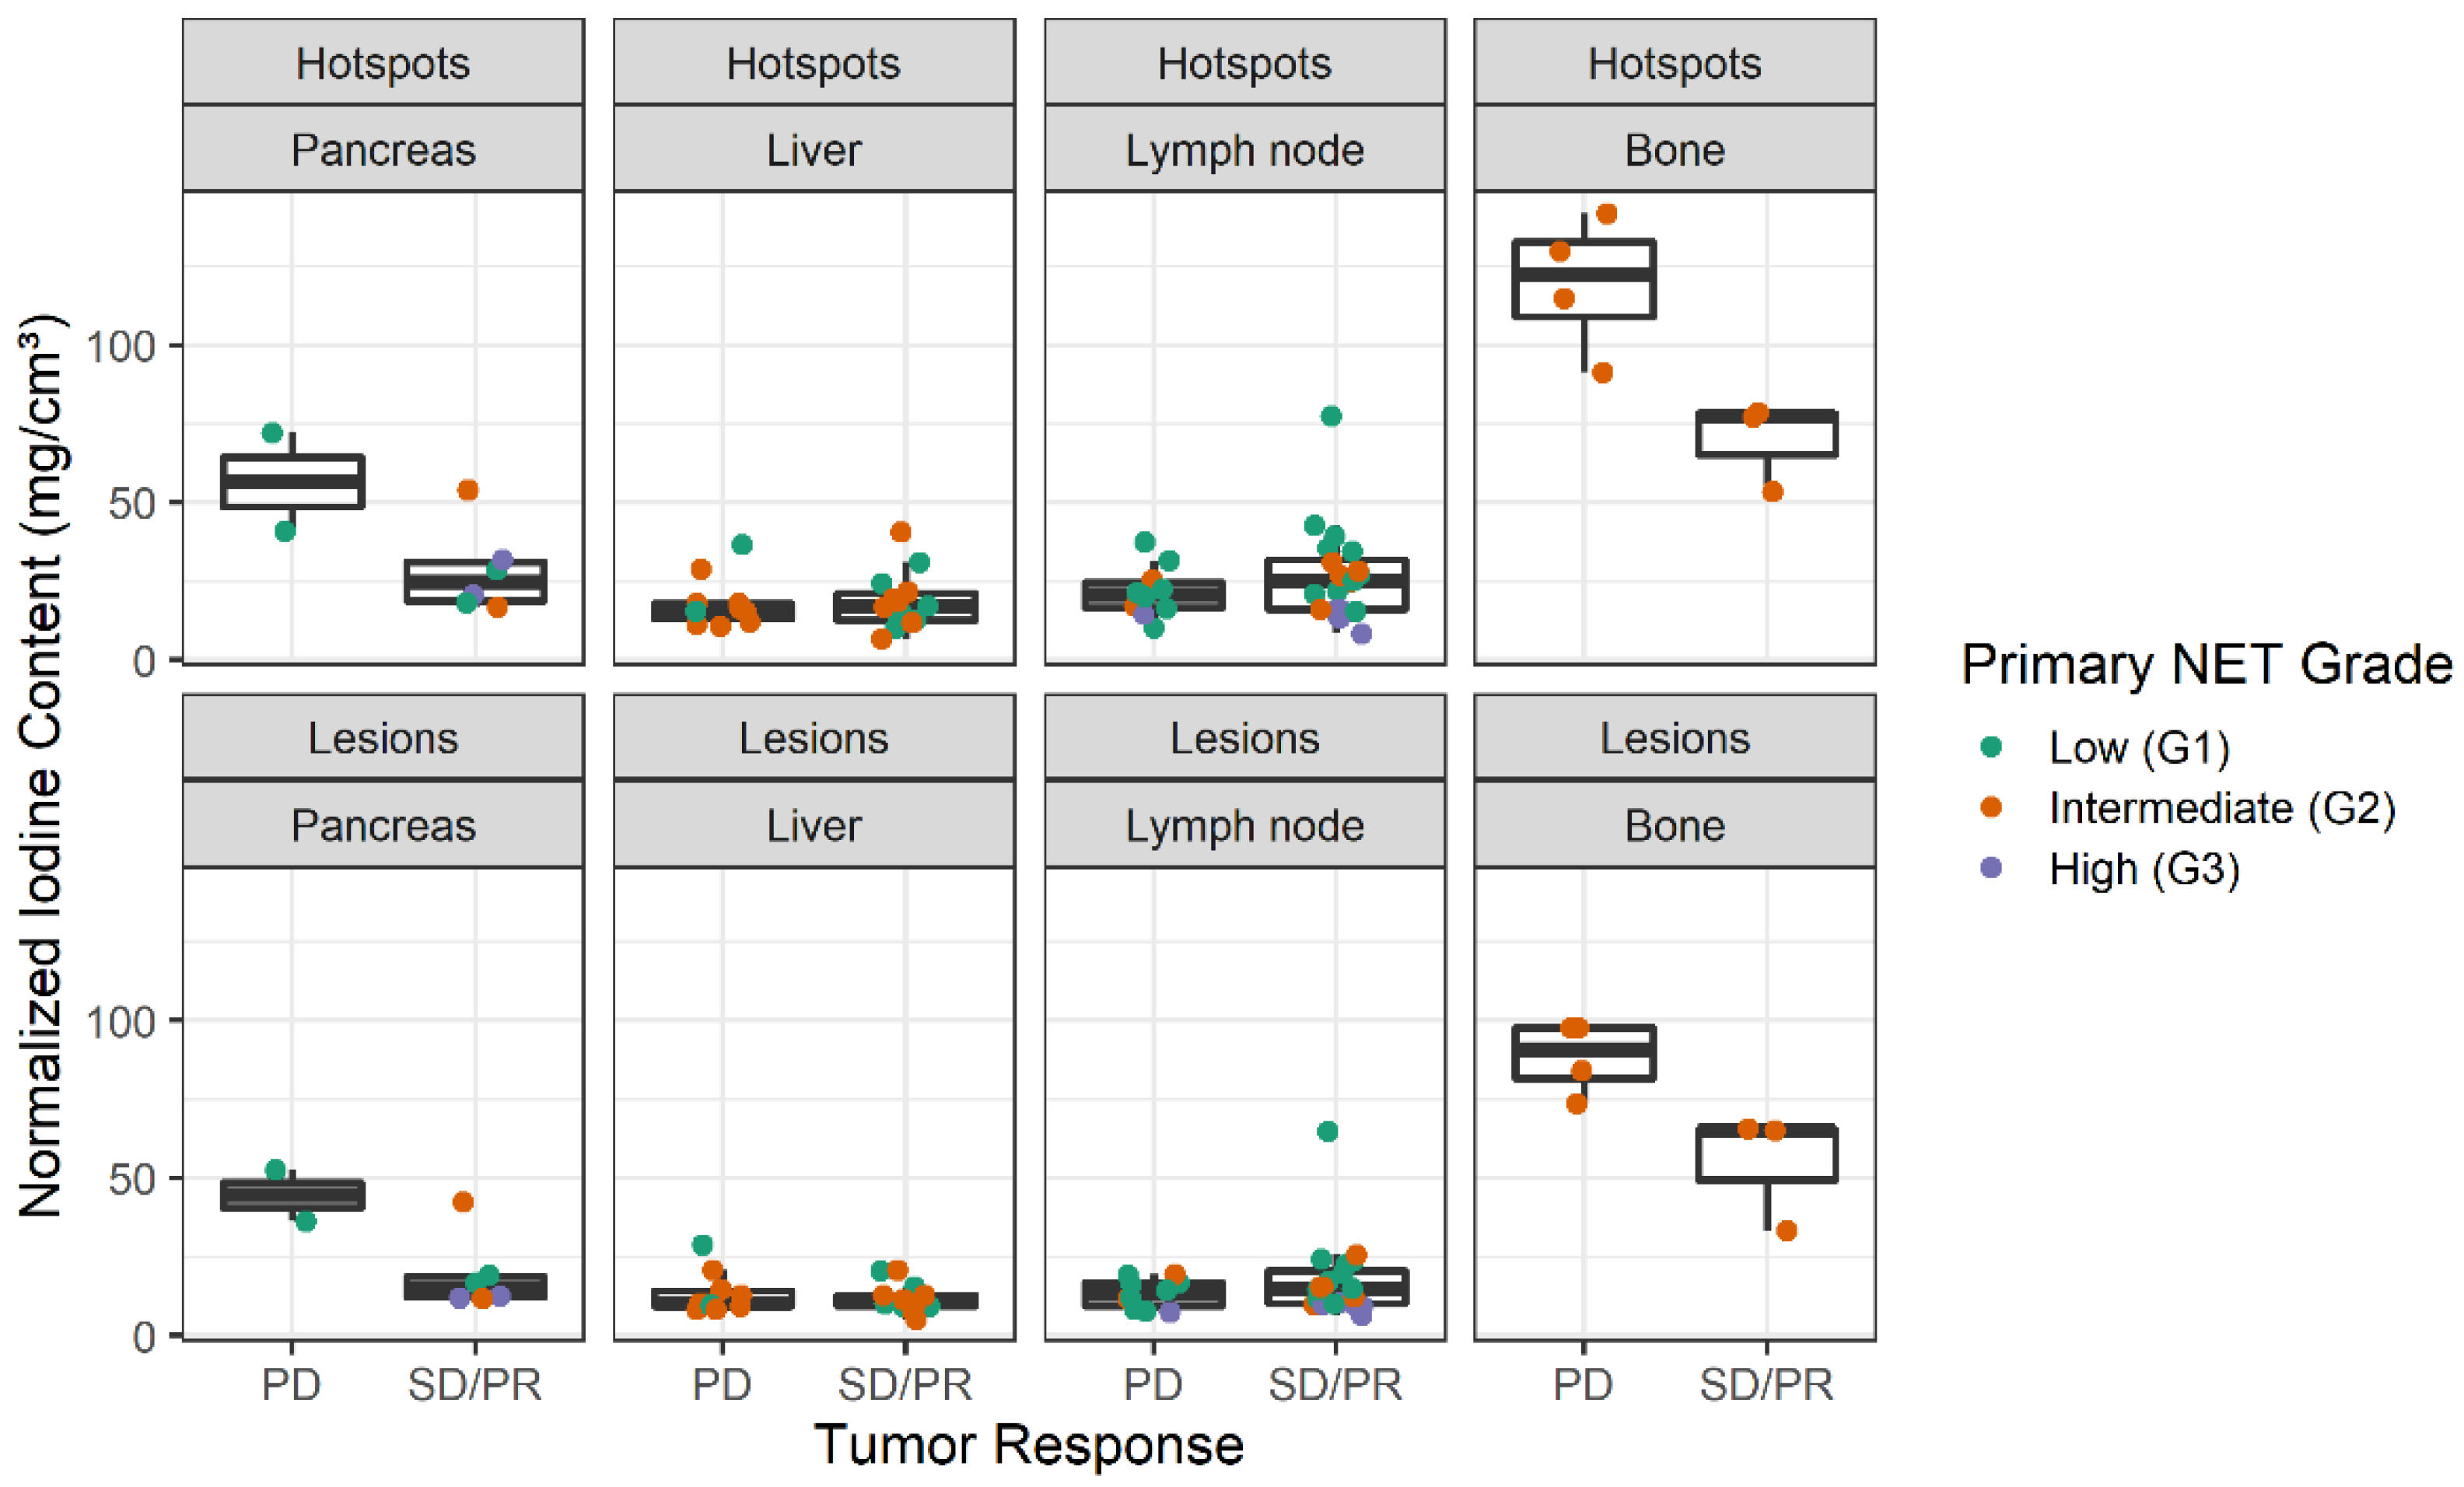
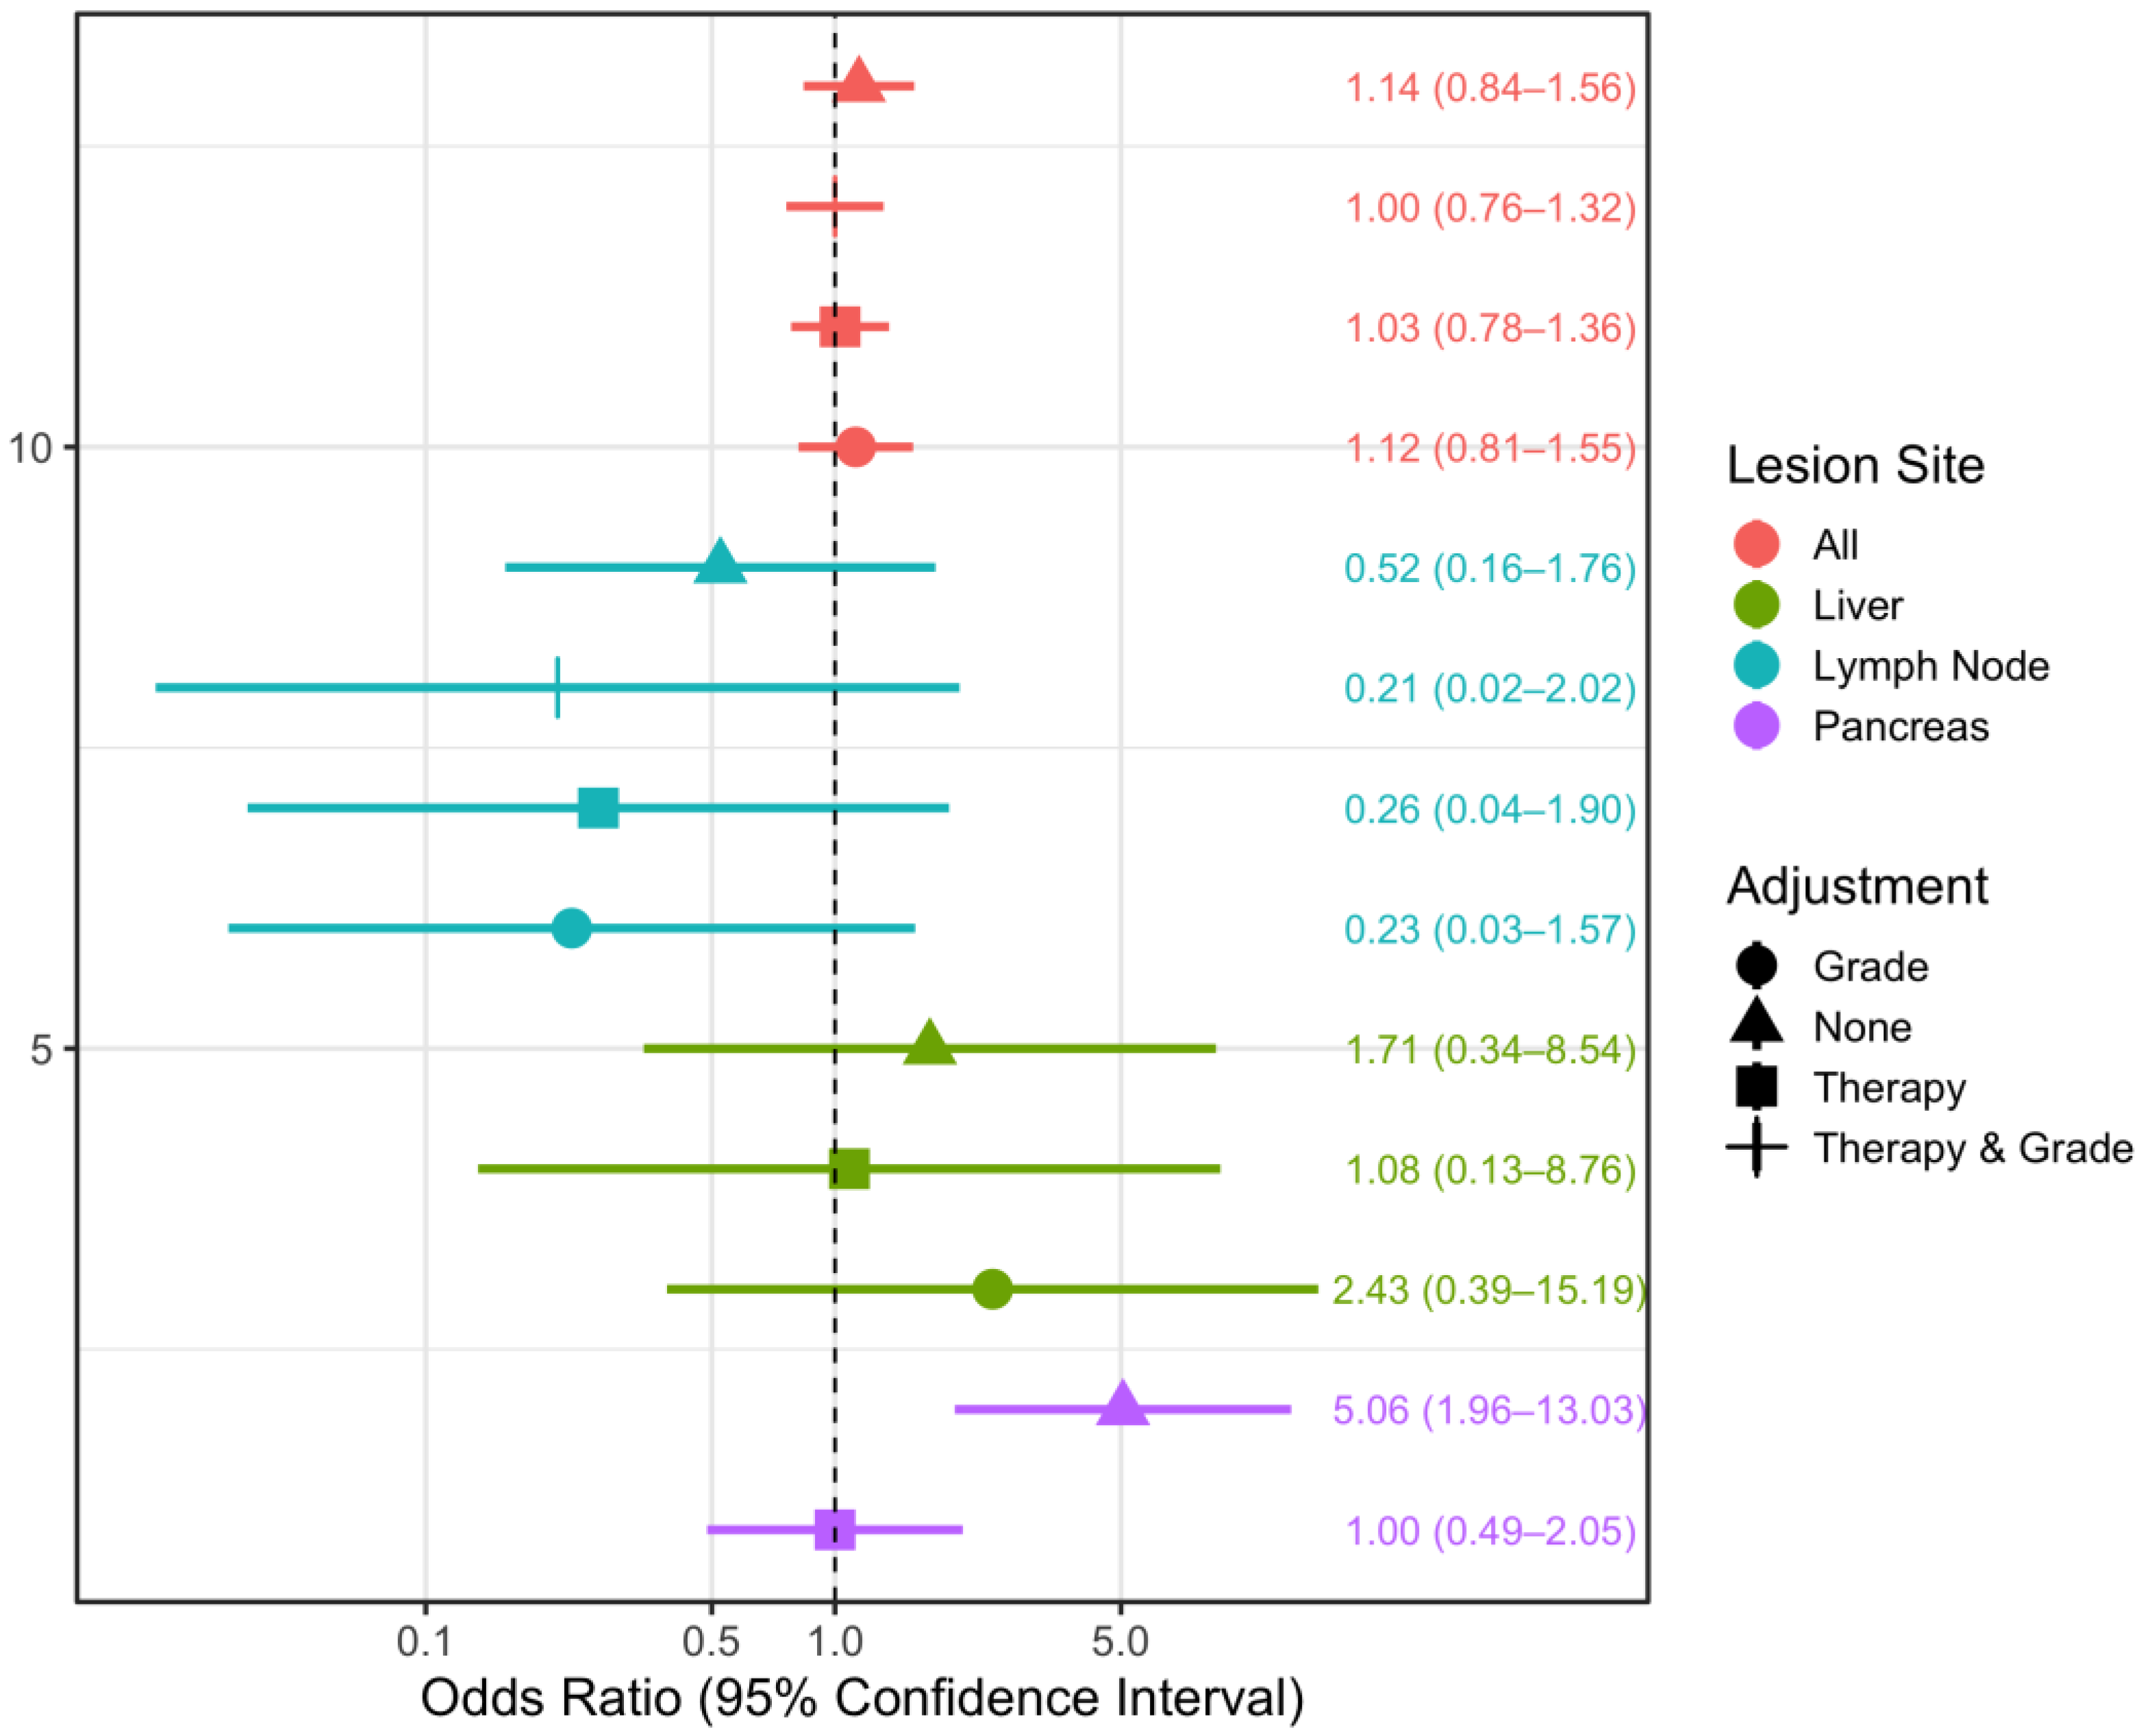
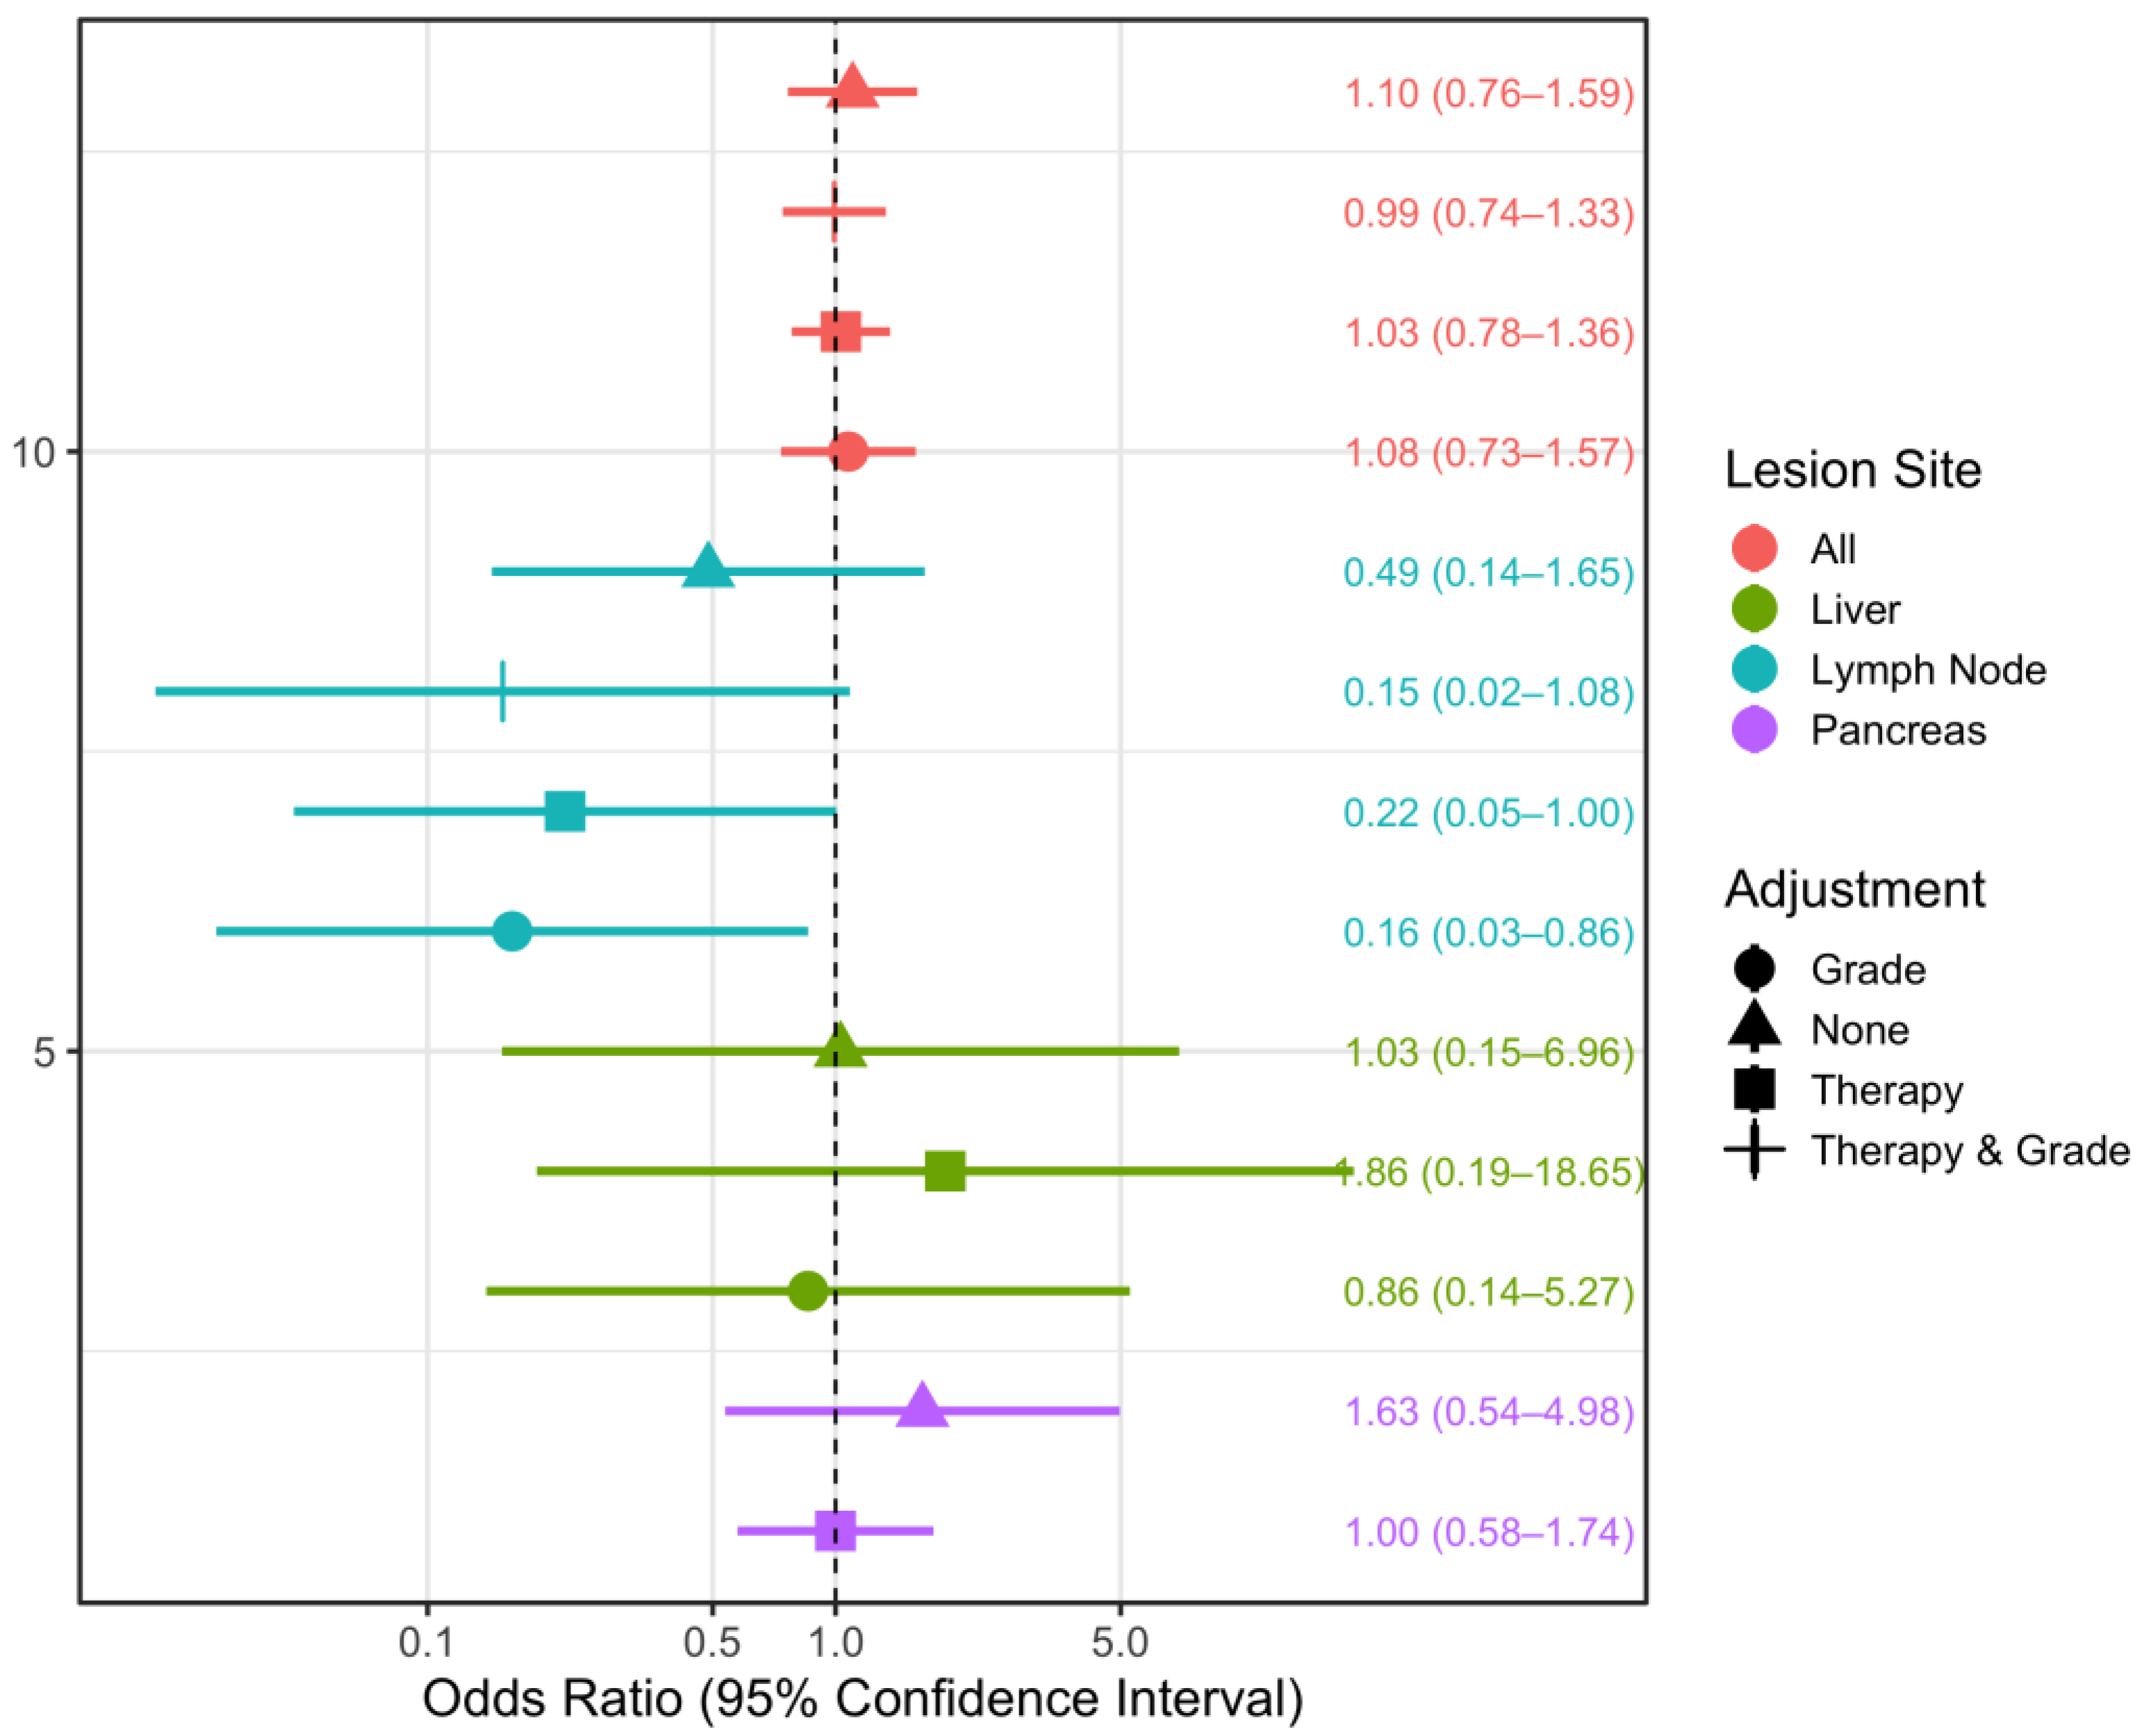
3.2. Spectral CT Parameters
4. Discussion
4.1. Therapy
4.2. Tumor Grade
4.3. Lesion Sites
4.4. Spectral Imaging
4.5. Limitations
5. Conclusions
Supplementary Materials
Author Contributions
Funding
Institutional Review Board Statement
Informed Consent Statement
Data Availability Statement
Acknowledgments
Conflicts of Interest
References
- Boning, G.; Feldhaus, F.; Adelt, S.; Kahn, J.; Fehrenbach, U.; Streitparth, F. Clinical routine use of virtual monochromatic datasets based on spectral CT in patients with hypervascularized abdominal tumors-evaluation of effectiveness and efficiency. Acta Radiol. 2019, 60, 425–432. [Google Scholar] [CrossRef] [PubMed]
- Yu, R.; Wachsman, A. Imaging of Neuroendocrine Tumors: Indications, Interpretations, Limits, and Pitfalls. Endocrinol. Metab. Clin. N. Am. 2017, 46, 795–814. [Google Scholar] [CrossRef] [PubMed]
- Gonzales-Yovera, J.G.; Roseboom, P.J.; Concepcion-Zavaleta, M.; Gutierrez-Cordova, I.; Plasencia-Duenas, E.; Quispe-Flores, M.; Ramos-Yataco, A.; Alcalde-Loyola, C.; Massucco-Revoredo, F.; Paz-Ibarra, J.; et al. Diagnosis and management of small bowel neuroendocrine tumors: A state-of-the-art. World J. Methodol. 2022, 12, 381–391. [Google Scholar] [CrossRef] [PubMed]
- Boning, G.; Adelt, S.; Feldhaus, F.; Fehrenbach, U.; Kahn, J.; Hamm, B.; Streitparth, F. Spectral CT in clinical routine imaging of neuroendocrine neoplasms. Clin. Radiol. 2021, 76, 348–357. [Google Scholar] [CrossRef] [PubMed]
- Schwartz, L.H.; Litiere, S.; de Vries, E.; Ford, R.; Gwyther, S.; Mandrekar, S.; Shankar, L.; Bogaerts, J.; Chen, A.; Dancey, J.; et al. RECIST 1.1-Update and clarification: From the RECIST committee. Eur. J. Cancer 2016, 62, 132–137. [Google Scholar] [CrossRef] [Green Version]
- R Core Team. A Language and Environment for Statistical Computing. R Foundation for Statistical Computing, Vienna, Austria. 2021. Available online: https://www.R-project.org/ (accessed on 5 January 2023).
- RStudio Team. RStudio: Integrated Development Environment for R; RStudio, PBC: Boston, MA, USA, 2022; Available online: http://www.rstudio.com/ (accessed on 21 January 2023).
- Bates, D.; Maechler, M.; Bolker, B.; Walker, S. Fitting Linear Mixed-Effects Models Using lme4. J. Stat. Softw. 2015, 67, 1–48. [Google Scholar] [CrossRef]
- Højsgaard, S.; Halekoh, U.; Yan, J. The R Package geepack for Generalized Estimating Equations. J. Stat. Softw. 2006, 15, 1–11. [Google Scholar]
- Kuznetsova, A.; Brockhoff, P.B.; Christensen, R.H.B. LmerTest package: Tests in linear mixed effects models. J. Stat. Softw. 2017, 82. [Google Scholar] [CrossRef] [Green Version]
- Wickham, H.; Averick, M.; Bryan, J.; Chang, W.; McGowan, L.; François, R.; Grolemund, G.; Hayes, A.; Henry, L.; Hester, J.; et al. Welcome to the tidyverse. J. Open Source Softw. 2019, 4, 1686. [Google Scholar] [CrossRef] [Green Version]
- Yan, J. geepack: Yet Another Package for Generalized Estimating Equations. R-News 2002, 2, 12–14. [Google Scholar]
- Yan, J.; Fine, J.P. Estimating Equations for Association Structures. Stat. Med. 2004, 23, 859–880. [Google Scholar]
- Dorffel, Y.; Wermke, W. Neuroendocrine tumors: Characterization with contrast-enhanced ultrasonography. Ultraschall Med. 2008, 29, 506–514. [Google Scholar] [CrossRef] [PubMed]
- Yang, L.; Luo, D.; Yi, J.; Li, L.; Zhao, Y.; Lin, M.; Guo, W.; Hu, L.; Zhou, C. Therapy Effects of Advanced Hypopharyngeal and Laryngeal Squamous Cell Carcinoma: Evaluated using Dual-Energy CT Quantitative Parameters. Sci. Rep. 2018, 8, 9064. [Google Scholar] [CrossRef] [PubMed]
- Fehrenbach, U.; Feldhaus, F.; Kahn, J.; Boning, G.; Maurer, M.H.; Renz, D.; Frost, N.; Streitparth, F. Tumour response in non-small-cell lung cancer patients treated with chemoradiotherapy—Can spectral CT predict recurrence? J. Med. Imaging Radiat. Oncol. 2019, 63, 641–649. [Google Scholar] [CrossRef] [PubMed]
- Guo, C.G.; Ren, S.; Chen, X.; Wang, Q.D.; Xiao, W.B.; Zhang, J.F.; Duan, S.F.; Wang, Z.Q. Pancreatic neuroendocrine tumor: Prediction of the tumor grade using magnetic resonance imaging findings and texture analysis with 3-T magnetic resonance. Cancer Manag. Res. 2019, 11, 1933–1944. [Google Scholar] [CrossRef] [Green Version]
- Lotfalizadeh, E.; Ronot, M.; Wagner, M.; Cros, J.; Couvelard, A.; Vullierme, M.P.; Allaham, W.; Hentic, O.; Ruzniewski, P.; Vilgrain, V. Prediction of pancreatic neuroendocrine tumour grade with MR imaging features: Added value of diffusion-weighted imaging. Eur. Radiol. 2017, 27, 1748–1759. [Google Scholar] [CrossRef]
- Humphrey, P.E.; Alessandrino, F.; Bellizzi, A.M.; Mortele, K.J. Non-hyperfunctioning pancreatic endocrine tumors: Multimodality imaging features with histopathological correlation. Abdom. Imaging 2015, 40, 2398–2410. [Google Scholar] [CrossRef]
- Manfredi, R.; Bonatti, M.; Mantovani, W.; Graziani, R.; Segala, D.; Capelli, P.; Butturini, G.; Mucelli, R.P. Non-hyperfunctioning neuroendocrine tumours of the pancreas: MR imaging appearance and correlation with their biological behaviour. Eur. Radiol. 2013, 23, 3029–3039. [Google Scholar] [CrossRef]
- Li, W.X.; Miao, F.; Xu, X.Q.; Zhang, J.; Wu, Z.Y.; Chen, K.M.; Yan, F.H.; Lin, X.Z. Pancreatic Neuroendocrine Neoplasms: CT Spectral Imaging in Grading. Acad. Radiol. 2021, 28, 208–216. [Google Scholar] [CrossRef]
- Majidpoor, J.; Mortezaee, K. Steps in metastasis: An updated review. Med. Oncol. 2021, 38, 3. [Google Scholar] [CrossRef]
- Ying, M.; Ahuja, A.; Brook, F.; Metreweli, C. Vascularity and grey-scale sonographic features of normal cervical lymph nodes: Variations with nodal size. Clin. Radiol. 2001, 56, 416–419. [Google Scholar] [CrossRef] [PubMed]
- Lv, P.; Lin, X.Z.; Li, J.; Li, W.; Chen, K. Differentiation of small hepatic hemangioma from small hepatocellular carcinoma: Recently introduced spectral CT method. Radiology 2011, 259, 720–729. [Google Scholar] [CrossRef] [PubMed] [Green Version]
- Albrecht, M.H.; Vogl, T.J.; Martin, S.S.; Nance, J.W.; Duguay, T.M.; Wichmann, J.L.; De Cecco, C.N.; Varga-Szemes, A.; van Assen, M.; Tesche, C.; et al. Review of Clinical Applications for Virtual Monoenergetic Dual-Energy CT. Radiology 2019, 293, 260–271. [Google Scholar] [CrossRef]
- Auer, T.A.; Feldhaus, F.W.; Buttner, L.; Jonczyk, M.; Fehrenbach, U.; Geisel, D.; Boning, G. Spectral CT Hybrid Images in the Diagnostic Evaluation of Hypervascular Abdominal Tumors-Potential Advantages in Clinical Routine. Diagnostics 2021, 11. [Google Scholar] [CrossRef] [PubMed]
- Kreisler, B. Photon counting Detectors: Concept, technical Challenges, and clinical outlook. Eur. J. Radiol. 2022, 149, 110229. [Google Scholar] [CrossRef] [PubMed]
- Sandstedt, M.; Marsh, J., Jr.; Rajendran, K.; Gong, H.; Tao, S.; Persson, A.; Leng, S.; McCollough, C. Improved coronary calcification quantification using photon-counting-detector CT: An ex vivo study in cadaveric specimens. Eur. Radiol. 2021, 31, 6621–6630. [Google Scholar] [CrossRef]
- Rajendran, K.; Petersilka, M.; Henning, A.; Shanblatt, E.; Marsh, J., Jr.; Thorne, J.; Schmidt, B.; Flohr, T.; Fletcher, J.; McCollough, C.; et al. Full field-of-view, high-resolution, photon-counting detector CT: Technical assessment and initial patient experience. Phys. Med. Biol. 2021, 66. [Google Scholar] [CrossRef]
- Jungblut, L.; Abel, F.; Nakhostin, D.; Mergen, V.; Sartoretti, T.; Euler, A.; Frauenfelder, T.; Martini, K. Impact of photon-counting-detector-CT derived virtual-monoenergetic-images and iodine-maps on the diagnosis of pleural empyema. Diagn Interv Imaging 2022. [Google Scholar] [CrossRef]
- Graafen, D.; Muller, L.; Halfmann, M.; Duber, C.; Hahn, F.; Yang, Y.; Emrich, T.; Kloeckner, R. Photon-counting detector CT improves quality of arterial phase abdominal scans: A head-to-head comparison with energy-integrating CT. Eur. J. Radiol. 2022, 156, 110514. [Google Scholar] [CrossRef]


| Scan Phase | Arterial | Portal Venous and Venous | |
|---|---|---|---|
| Voltage | Dual-energy spectral mode (80/140 kVp) | Mono-energy mode (120 kVp) | |
| Postprocessing datasets | Iodine map and virtual monochromatic images (40 to 140 keV|10 keV increments) | Polychromatic images | |
| Adaptive statistical iterative reconstruction level | 70% | ||
| Noise index | 21 | ||
| Pitch | 1.375 | ||
| Collimation | 64 × 0.625 mm | ||
| Rotation time | 0.7 s | ||
| Tube current | Average 260–640 mA | Min/max: 100/500 mA | |
| Smart mA | On | ||
| Auto mA | Off (not available from vendor) | On | |
| Reconstruction mode | Slice (axial) | ||
| Reconstructed slice thickness | 0.625 mm | ||
| Reconstructed slice interval | 0.625 mm | ||
| FOV | Display FOV: patient-dependent Scanning FOV: 50 cm | ||
| Age | Min/Max | 51.0/85.0 |
| Med [IQR] | 70.0 [64.0; 74.0] | |
| Gender | Female | 14 (53.85%) |
| Male | 12 (46.15%) | |
| Total | 26 (100.00%) | |
| Location of NET primaries | Pancreas | 20 (25.64%) |
| Intestine | 43 (55.13%) | |
| Prostate | 1 (1.28%) | |
| Lung | 6 (7.69%) | |
| Unclear primary | 8 (10.26%) | |
| Total lesions | 78 (100.00%) | |
| Interval between SCT and study endpoint (weeks) | Min/Max | 5.0/260.0 |
| Med [IQR] | 64.0 [24.0; 103.0] |
| Progressive Disease (n = 30) | Nonprogressive Disease (n = 48) | Total (n = 78) | |
|---|---|---|---|
| Tumor response | |||
| | Stable disease (0) | 0 (0.0%) | 36 (100.0%) | 36 (100.0%) |
| | Progressive disease (1) | 30 (100.0%) | 0 (0.0%) | 30 (100.0%) |
| | Partial response (2) | 0 (0.0%) | 12 (100.0%) | 12 (100.0%) |
| Normalized iodine content (mg/cm3) | |||
| | Median (IQR) | 15.50 (9.86, 21.22) | 12.92 (10.05, 20.73) | 14.46 (9.99, 20.93) |
| Attenuation slope | |||
| | Median (IQR) | 1.45 (0.98, 2.20) | 1.41 (1.04, 2.06) | 1.41 (1.01, 2.09) |
| Therapy | |||
| | Temozolomide and capecitabine (Tem./Cap.) | 0 (0.0%) | 6 (100.0%) | 6 (100.0%) |
| | Everolimus | 2 (33.3%) | 4 (66.7%) | 6 (100.0%) |
| | Somatostatin analogue (SSA) | 5 (20.8%) | 19 (79.2%) | 24 (100.0%) |
| | Streptozocin and 5-fluorouracil | 0 (0.0%) | 3 (100.0%) | 3 (100.0%) |
| | Tem./Cap., SSA, telotristat ethyl | 0 (0.0%) | 5 (100.0%) | 5 (100.0%) |
| | Watch and wait (none) | 23 (67.6%) | 11 (32.4%) | 34 (100.0%) |
| Therapy (binary) | |||
| | Any | 7 (15.9%) | 37 (84.1%) | 44 (100.0%) |
| | None (watch-and-wait) | 23 (67.6%) | 11 (32.4%) | 34 (100.0%) |
| Primary tumor grade | |||
| | Low-grade (G1) | 12 (37.5%) | 20 (62.5%) | 32 (100.0%) |
| | Intermediate-grade (G2) | 15 (42.9%) | 20 (57.1%) | 35 (100.0%) |
| | High-grade (G3) | 3 (27.3%) | 8 (72.7%) | 11 (100.0%) |
| Lesion site | |||
| | Pancreas | 2 (25.0%) | 6 (75.0%) | 8 (100.0%) |
| | Intestine | 1 (50.0%) | 1 (50.0%) | 2 (100.0%) |
| | Liver | 10 (41.7%) | 14 (58.3%) | 24 (100.0%) |
| | Lymph node | 10 (33.3%) | 20 (66.7%) | 30 (100.0%) |
| | Adrenal gland | 1 (50.0%) | 1 (50.0%) | 2 (100.0%) |
| | Heart | 0 (0.0%) | 1 (100.0%) | 1 (100.0%) |
| | Bone | 4 (57.1%) | 3 (42.9%) | 7 (100.0%) |
| | Abdominal wall | 1 (50.0%) | 1 (50.0%) | 2 (100.0%) |
| | Prostate | 1 (100.0%) | 0 (0.0%) | 1 (100.0%) |
| | Lung/Pleura | 0 (0.0%) | 1 (100.0%) | 1 (100.0%) |
| Primary NET Site | Therapy | Total | |||||
|---|---|---|---|---|---|---|---|
| Chemotherapy | Everolimus | SSA | Tem/Cap, SSA, Xermelo® | Watch and Wait | |||
| Tem./Cap. | STZ/5FU | ||||||
| Pancreas | 6 (30.00%) | 3 (15.00%) | 4 (20.00%) | 3 (15.00%) | 0 (0%) | 4 (20.00%) | 20 (25.64%) |
| Intestine | 0 (0%) | 0 (0%) | 2 (4.65%) | 13 (30.23%) | 0 (0%) | 28 (65.12%) | 43 (55.13%) |
| Prostate | 0 (0%) | 0 (0%) | 0 (0%) | 0 (0%) | 0 (0%) | 1 (100.00%) | 1 (1.28%) |
| Lung | 0 (0%) | 0 (0%) | 0 (0%) | 1 (16.67%) | 5 (83.33%) | 0 (0%) | 6 (7.69%) |
| Unclear | 0 (0%) | 0 (0%) | 0 (0%) | 7 (87.5%) | 0 (0%) | 1 (12.5%) | 8 (10.26%) |
| Total | 6 (7.69%) | 3 (3.85%) | 6 (7.69%) | 24 (30.77%) | 5 (6.41%) | 34 (43.59%) | 78 (100.00%) |
| Therapy | Total | |||
|---|---|---|---|---|
| Any | None (Watch and Wait) | |||
| Lesion NIC | Min/Max | 5.1/77.2 | 7.7/97.5 | 5.1/97.5 |
| Med [IQR] | 12.2 [9.4; 19.3] | 16.9 [11.7; 27.6] | 14.5 [10.0; 20.9] | |
| n | 44 | 34 | 78 | |
| Hotspot NIC | Min/Max | 6.8 / 100.6 | 10.9/141.8 | 6.8/141.8 |
| Med [IQR] | 18.0 [14.3; 29.2] | 27.1 [20.3; 38.9] | 21.8 [15.9; 33.8] | |
| n | 44 | 34 | 78 | |
| Primary NET Site | Pancreas | 16 (80.00%) | 4 (20.00%) | 20 (25.64%) |
| Intestine | 15 (34.88%) | 28 (65.12%) | 43 (55.13%) | |
| Prostate | 0 (0%) | 1 (100.00%) | 1 (1.28%) | |
| Lung | 6 (100.00%) | 0 (0%) | 6 (7.69%) | |
| Unclear | 7 (87.5%) | 1 (12.5%) | 8 (10.26%) | |
| n | 44 (56.41%) | 34 (43.59%) | 78 (100.00%) | |
| Primary NET Grade | G1 | 14 (43.75%) | 18 (56.25%) | 32 (41.03%) |
| G2 | 20 (57.14%) | 15 (42.86%) | 35 (44.87%) | |
| G3 | 10 (90.91%) | 1 (9.09%) | 11 (14.10%) | |
| n | 44 (56.41%) | 34 (43.59%) | 78 (100.00%) | |
Disclaimer/Publisher’s Note: The statements, opinions and data contained in all publications are solely those of the individual author(s) and contributor(s) and not of MDPI and/or the editor(s). MDPI and/or the editor(s) disclaim responsibility for any injury to people or property resulting from any ideas, methods, instructions or products referred to in the content. |
© 2023 by the authors. Licensee MDPI, Basel, Switzerland. This article is an open access article distributed under the terms and conditions of the Creative Commons Attribution (CC BY) license (https://creativecommons.org/licenses/by/4.0/).
Share and Cite
Lim, W.; Sodemann, E.B.; Büttner, L.; Jonczyk, M.; Lüdemann, W.M.; Kahn, J.; Geisel, D.; Jann, H.; Aigner, A.; Böning, G. Spectral Computed Tomography-Derived Iodine Content and Tumor Response in the Follow-Up of Neuroendocrine Tumors—A Single-Center Experience. Curr. Oncol. 2023, 30, 1502-1515. https://doi.org/10.3390/curroncol30020115
Lim W, Sodemann EB, Büttner L, Jonczyk M, Lüdemann WM, Kahn J, Geisel D, Jann H, Aigner A, Böning G. Spectral Computed Tomography-Derived Iodine Content and Tumor Response in the Follow-Up of Neuroendocrine Tumors—A Single-Center Experience. Current Oncology. 2023; 30(2):1502-1515. https://doi.org/10.3390/curroncol30020115
Chicago/Turabian StyleLim, Winna, Elisa Birgit Sodemann, Laura Büttner, Martin Jonczyk, Willie Magnus Lüdemann, Johannes Kahn, Dominik Geisel, Henning Jann, Annette Aigner, and Georg Böning. 2023. "Spectral Computed Tomography-Derived Iodine Content and Tumor Response in the Follow-Up of Neuroendocrine Tumors—A Single-Center Experience" Current Oncology 30, no. 2: 1502-1515. https://doi.org/10.3390/curroncol30020115