Direct Targeting of the Raf-MEK-ERK Signaling Cascade Inhibits Neuroblastoma Growth


Abstract
: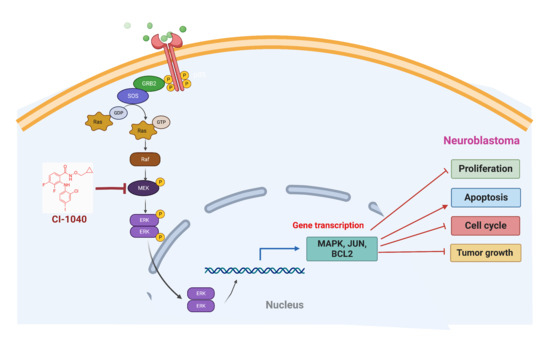
1. Introduction
2. Materials and Methods
2.1. Cell Culture and Reagents
2.2. Clinical Patient Dataset
2.3. Cell Viability and Clonogenic Assay
2.4. Apoptosis and Cell Cycle Assay
2.5. Spheroidal Tumor Assays
2.6. RNA Extraction and Quantitative Real-Time RT-PCR
2.7. Immunoblotting Assays
2.8. Statistical Analysis
3. Results
3.1. MAP2K2 and RAF1 Expression Strongly Correlate with Poor NB Prognosis
3.2. CI-1040 Inhibits NB Cell Proliferation and Colony Formation
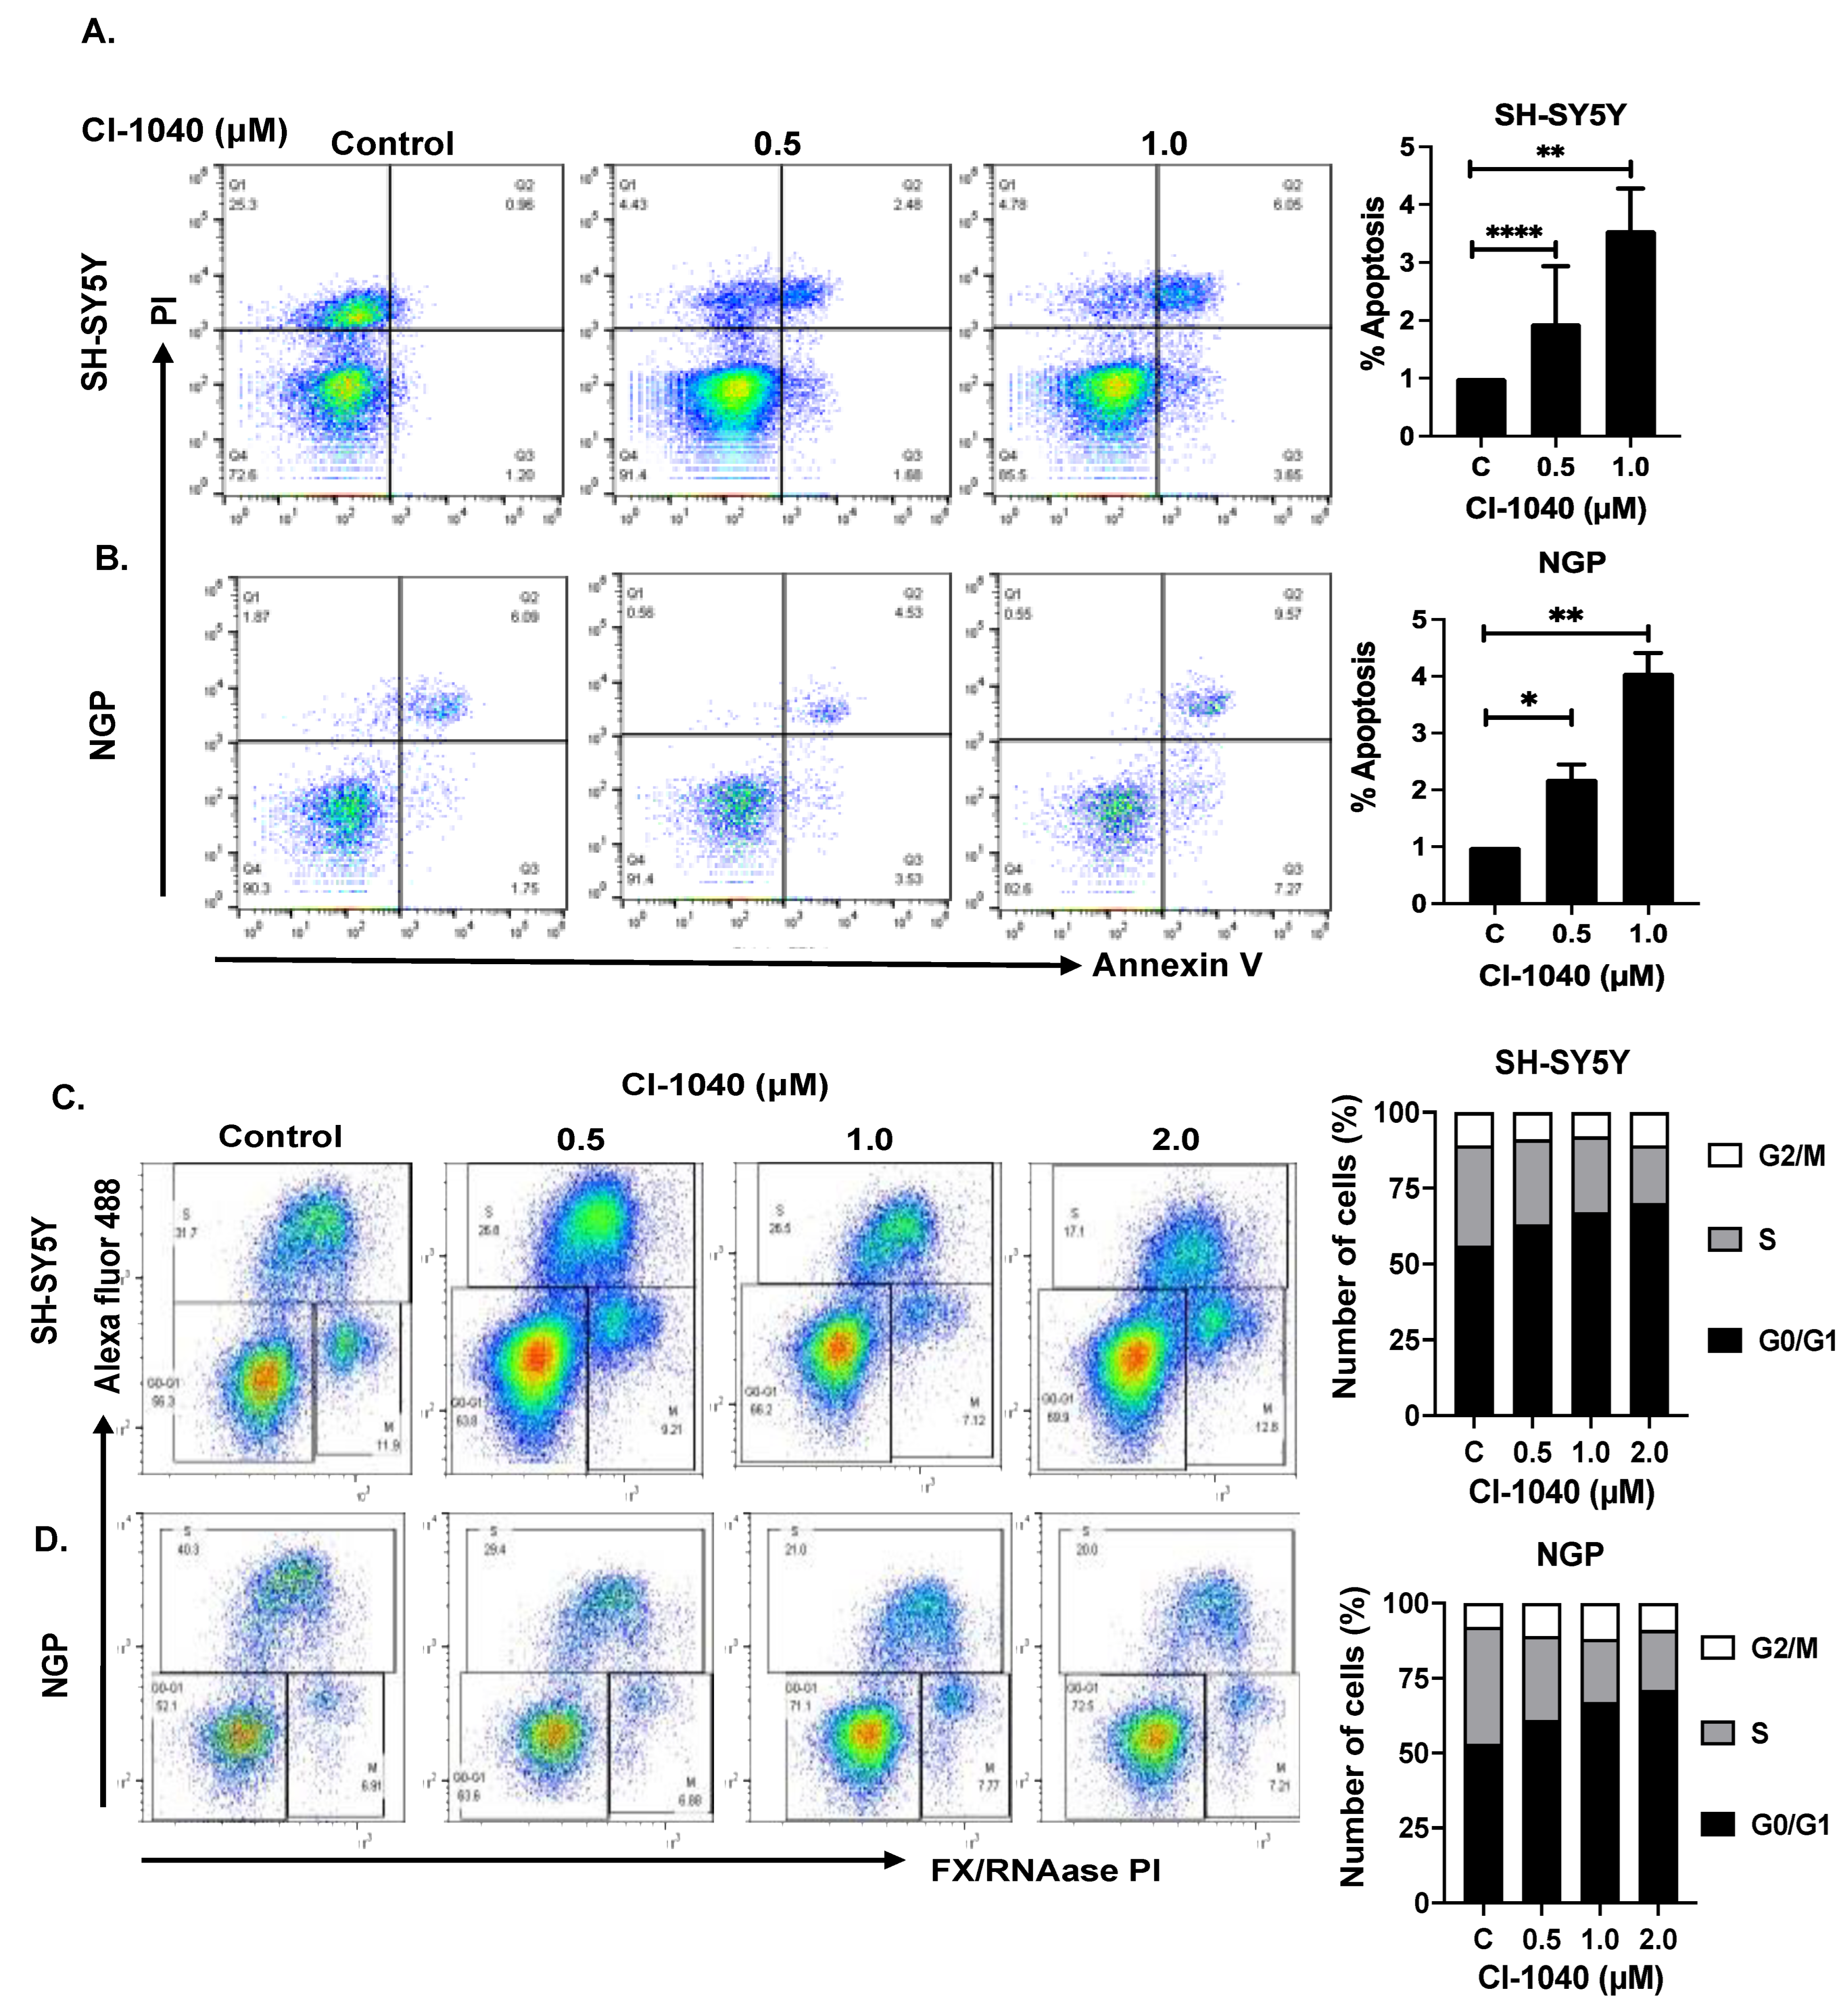
3.3. CI-1040 Induces Apoptosis and Blocks Cell Cycle Progression in NB Cells
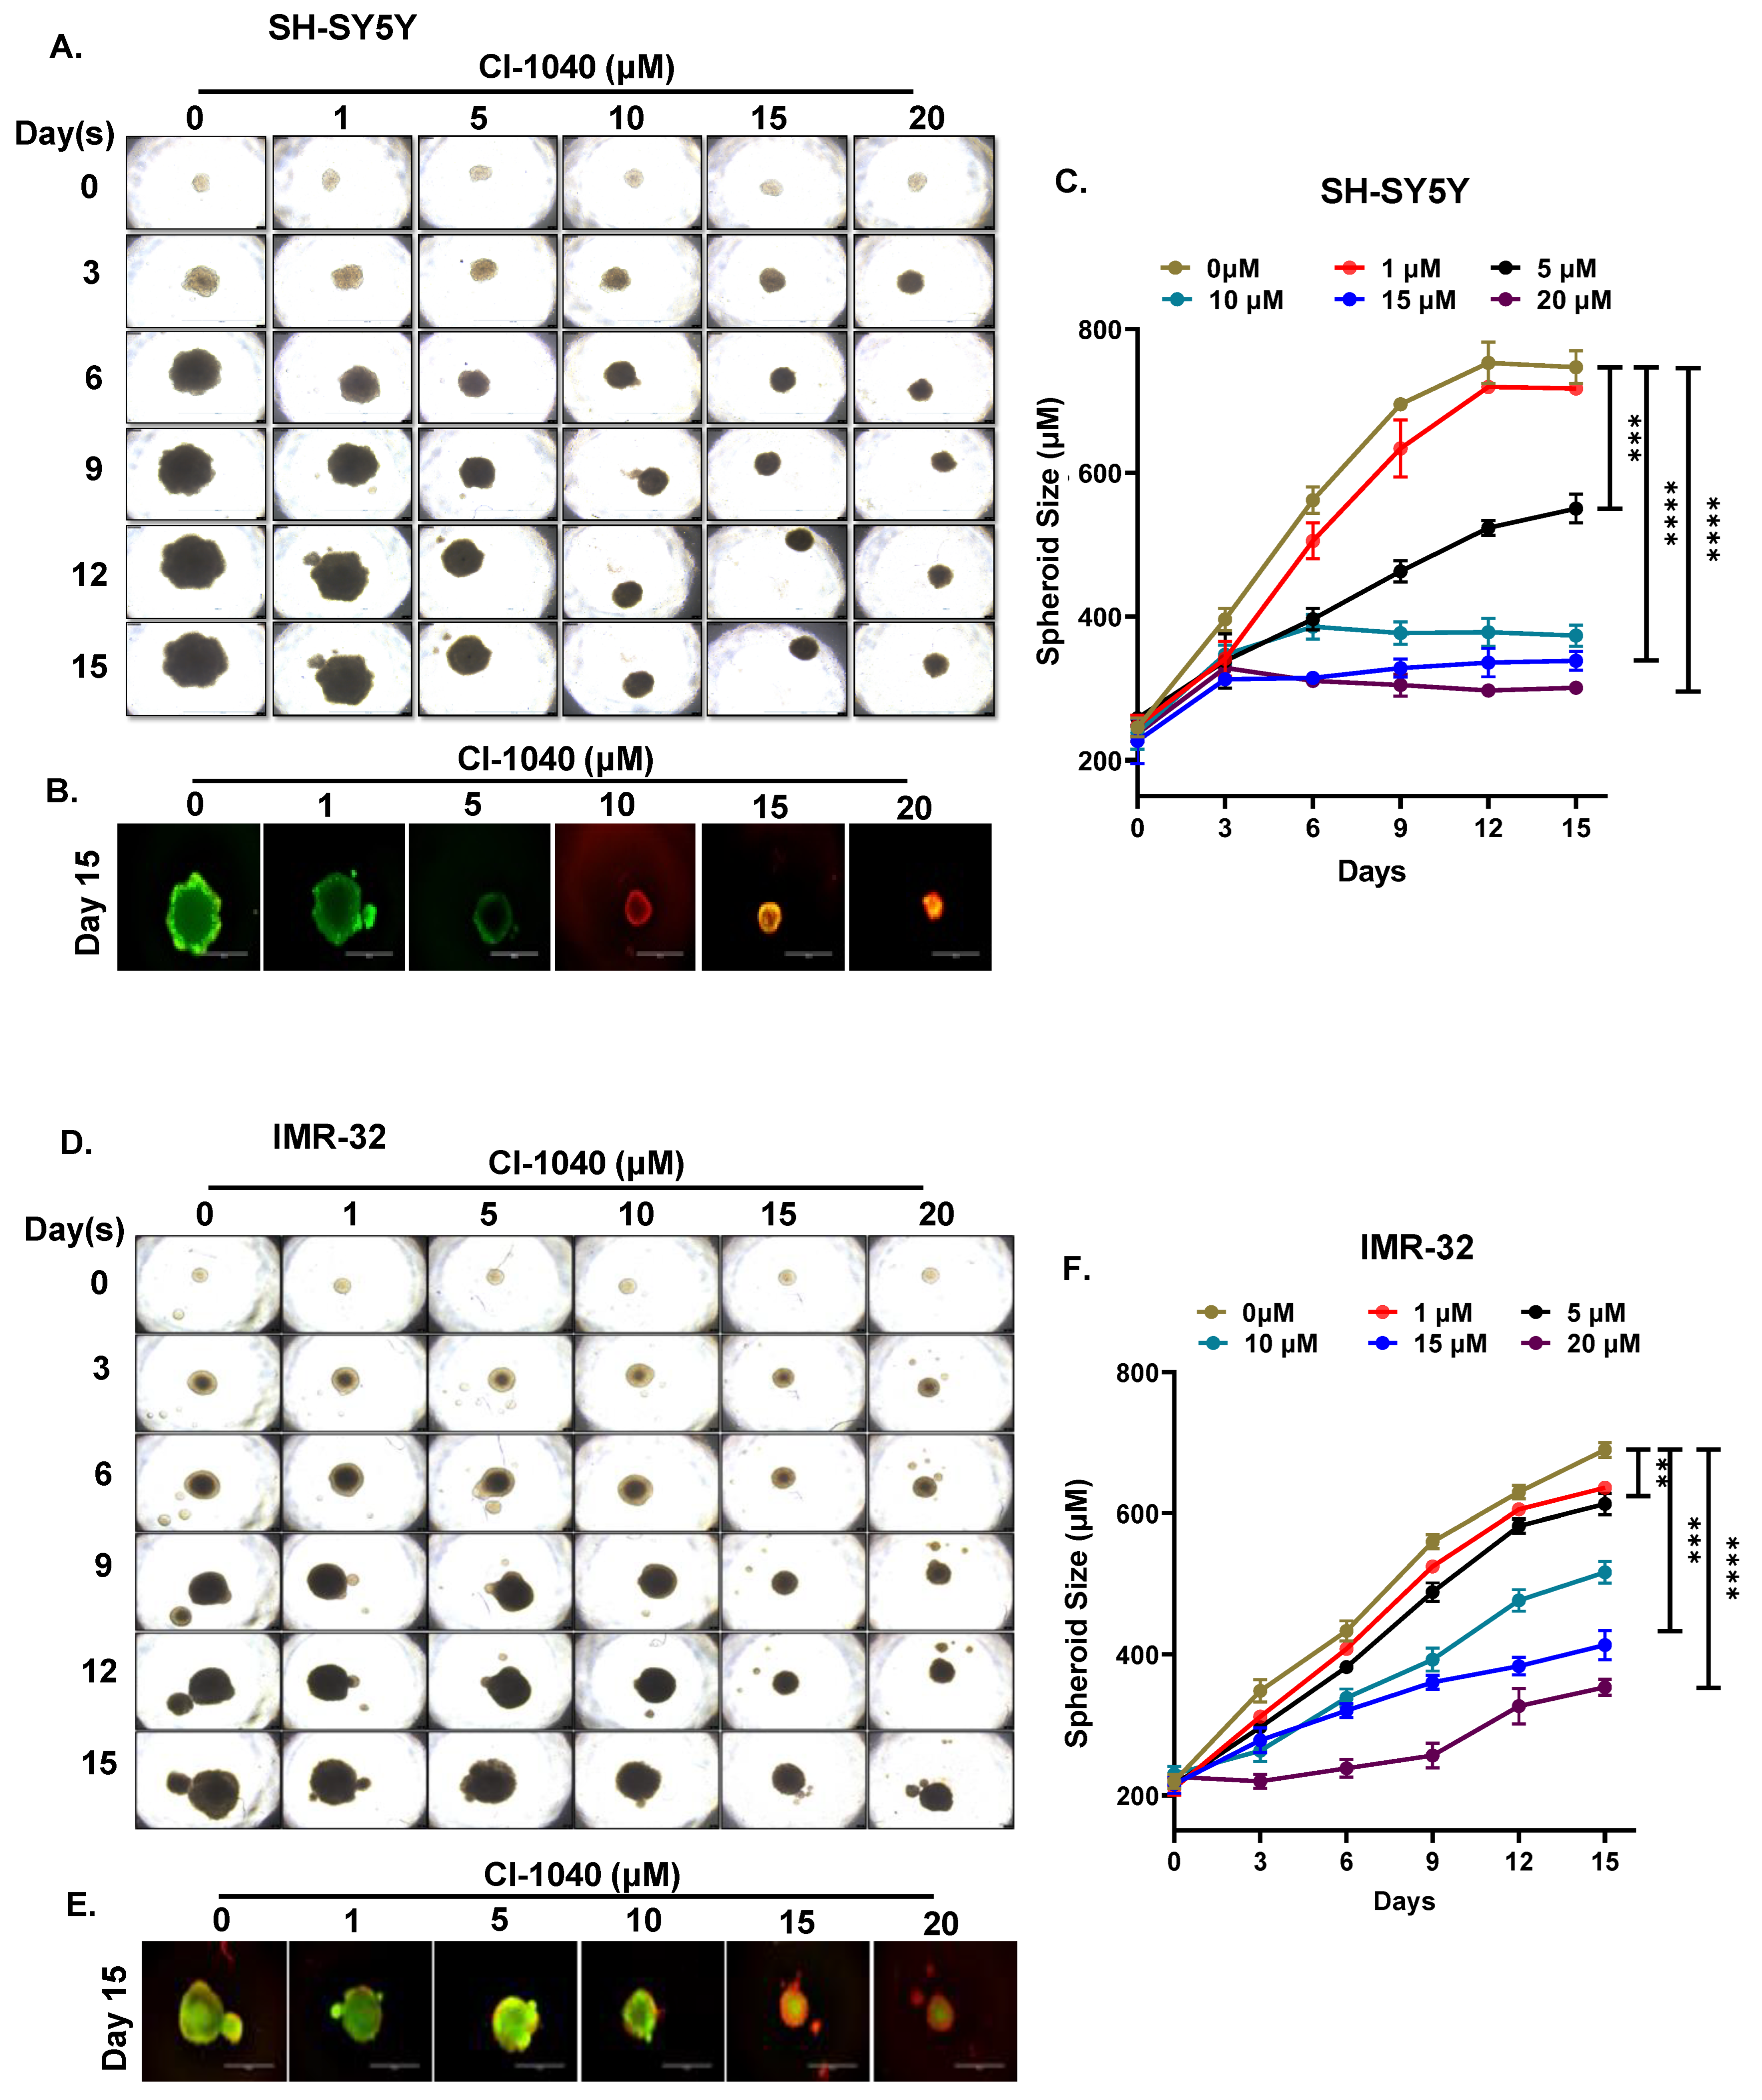
3.4. CI-1040 Inhibits NB Spheroid Tumor Growth
3.5. CI-1040 Inhibits the MAPK Pathway in NB Cells
4. Discussion
5. Conclusions
Supplementary Materials
Author Contributions
Funding
Institutional Review Board Statement
Informed Consent Statement
Data Availability Statement
Acknowledgments
Conflicts of Interest
References
- Eleveld, T.F.; Oldridge, D.A.; Bernard, V.; Koster, J.; Colmet Daage, L.; Diskin, S.J.; Schild, L.; Bentahar, N.B.; Bellini, A.; Chicard, M.; et al. Relapsed neuroblastomas show frequent RAS-MAPK pathway mutations. Nat. Genet. 2015, 47, 864–871. [Google Scholar] [CrossRef] [PubMed]
- Ritenour, L.E.; Randall, M.P.; Bosse, K.R.; Diskin, S.J. Genetic susceptibility to neuroblastoma: Current knowledge and future directions. Cell Tissue Res. 2018, 372, 287–307. [Google Scholar] [CrossRef] [PubMed]
- Anderson, J.; Majzner, R.G.; Sondel, P.M. Immunotherapy of Neuroblastoma: Facts and Hopes. Clin. Cancer Res. 2022, 28, 3196–3206. [Google Scholar] [CrossRef] [PubMed]
- Kholodenko, I.V.; Kalinovsky, D.V.; Doronin, I.I.; Deyev, S.M.; Kholodenko, R.V. Neuroblastoma Origin and Therapeutic Targets for Immunotherapy. J. Immunol. Res. 2018, 2018, 7394268. [Google Scholar] [CrossRef] [PubMed]
- Heinly, B.E.; Grant, C.N. Cell Adhesion Molecules in Neuroblastoma: Complex Roles, Therapeutic Potential. Front. Oncol. 2022, 12, 782186. [Google Scholar] [CrossRef]
- Zafar, A.; Wang, W.; Liu, G.; Wang, X.; Xian, W.; McKeon, F.; Foster, J.; Zhou, J.; Zhang, R. Molecular targeting therapies for neuroblastoma: Progress and challenges. Med. Res. Rev. 2021, 41, 961–1021. [Google Scholar] [CrossRef] [PubMed]
- Han, J.; Liu, Y.; Yang, S.; Wu, X.; Li, H.; Wang, Q. MEK inhibitors for the treatment of non-small cell lung cancer. J. Hematol. Oncol. 2021, 14, 1. [Google Scholar] [CrossRef]
- Franklin, D.A.; Sharick, J.T.; Ericsson-Gonzalez, P.I.; Sanchez, V.; Dean, P.T.; Opalenik, S.R.; Cairo, S.; Judde, J.G.; Lewis, M.T.; Chang, J.C.; et al. MEK activation modulates glycolysis and supports suppressive myeloid cells in TNBC. JCI Insight 2020, 5, e134290. [Google Scholar] [CrossRef]
- Bu, R.; Siraj, A.K.; Masoodi, T.; Parvathareddy, S.K.; Iqbal, K.; Al-Rasheed, M.; Haqawi, W.; Diaz, M.; Victoria, I.G.; Aldughaither, S.M.; et al. Recurrent Somatic MAP2K1 Mutations in Papillary Thyroid Cancer and Colorectal Cancer. Front. Oncol. 2021, 11, 670423. [Google Scholar] [CrossRef]
- Greengard, E.G. Molecularly Targeted Therapy for Neuroblastoma. Children 2018, 5, 142. [Google Scholar] [CrossRef] [Green Version]
- Braicu, C.; Buse, M.; Busuioc, C.; Drula, R.; Gulei, D.; Raduly, L.; Rusu, A.; Irimie, A.; Atanasov, A.G.; Slaby, O.; et al. A Comprehensive Review on MAPK: A Promising Therapeutic Target in Cancer. Cancers 2019, 11, 1618. [Google Scholar] [CrossRef] [PubMed]
- Moon, H.; Ro, S.W. MAPK/ERK Signaling Pathway in Hepatocellular Carcinoma. Cancers 2021, 13, 3026. [Google Scholar] [CrossRef]
- Guo, Y.J.; Pan, W.W.; Liu, S.B.; Shen, Z.F.; Xu, Y.; Hu, L.L. ERK/MAPK signalling pathway and tumorigenesis. Exp. Ther. Med. 2020, 19, 1997–2007. [Google Scholar] [CrossRef] [PubMed]
- Muta, Y.; Matsuda, M.; Imajo, M. Divergent Dynamics and Functions of ERK MAP Kinase Signaling in Development, Homeostasis and Cancer: Lessons from Fluorescent Bioimaging. Cancers 2019, 11, 513. [Google Scholar] [CrossRef] [PubMed]
- Eblen, S.T. Extracellular-Regulated Kinases: Signaling From Ras to ERK Substrates to Control Biological Outcomes. Adv. Cancer Res. 2018, 138, 99–142. [Google Scholar] [CrossRef] [PubMed]
- Eleveld, T.F.; Schild, L.; Koster, J.; Zwijnenburg, D.A.; Alles, L.K.; Ebus, M.E.; Volckmann, R.; Tijtgat, G.A.; van Sluis, P.; Versteeg, R.; et al. RAS-MAPK Pathway-Driven Tumor Progression Is Associated with Loss of CIC and Other Genomic Aberrations in Neuroblastoma. Cancer Res. 2018, 78, 6297–6307. [Google Scholar] [CrossRef]
- Woodfield, S.E.; Zhang, L.; Scorsone, K.A.; Liu, Y.; Zage, P.E. Binimetinib inhibits MEK and is effective against neuroblastoma tumor cells with low NF1 expression. BMC Cancer 2016, 16, 172. [Google Scholar] [CrossRef]
- Subramonian, D.; Phanhthilath, N.; Rinehardt, H.; Flynn, S.; Huo, Y.; Zhang, J.; Messer, K.; Mo, Q.; Huang, S.; Lesperance, J.; et al. Regorafenib is effective against neuroblastoma in vitro and in vivo and inhibits the RAS/MAPK, PI3K/Akt/mTOR and Fos/Jun pathways. Br. J. Cancer 2020, 123, 568–579. [Google Scholar] [CrossRef]
- Sugiura, R.; Satoh, R.; Takasaki, T. ERK: A Double-Edged Sword in Cancer. ERK-Dependent Apoptosis as a Potential Therapeutic Strategy for Cancer. Cells 2021, 10, 2509. [Google Scholar] [CrossRef]
- Dorel, M.; Klinger, B.; Mari, T.; Toedling, J.; Blanc, E.; Messerschmidt, C.; Nadler-Holly, M.; Ziehm, M.; Sieber, A.; Hertwig, F.; et al. Neuroblastoma signalling models unveil combination therapies targeting feedback-mediated resistance. PLoS Comput. Biol. 2021, 17, e1009515. [Google Scholar] [CrossRef]
- Takeuchi, Y.; Tanaka, T.; Higashi, M.; Fumino, S.; Iehara, T.; Hosoi, H.; Sakai, T.; Tajiri, T. In vivo effects of short- and long-term MAPK pathway inhibition against neuroblastoma. J. Pediatr. Surg. 2018, 53, 2454–2459. [Google Scholar] [CrossRef] [PubMed]
- Cheng, Y.; Tian, H. Current Development Status of MEK Inhibitors. Molecules 2017, 22, 1551. [Google Scholar] [CrossRef] [PubMed]
- Liu, F.; Yang, X.; Geng, M.; Huang, M. Targeting ERK, an Achilles’ Heel of the MAPK pathway, in cancer therapy. Acta Pharm. Sin. B 2018, 8, 552–562. [Google Scholar] [CrossRef] [PubMed]
- Allen, L.F.; Sebolt-Leopold, J.; Meyer, M.B. CI-1040 (PD184352), a targeted signal transduction inhibitor of MEK (MAPKK). Semin. Oncol. 2003, 30, 105–116. [Google Scholar] [CrossRef] [PubMed]
- Henderson, Y.C.; Ahn, S.H.; Clayman, G.L. Inhibition of the growth of papillary thyroid carcinoma cells by CI-1040. Arch. Otolaryngol. Head Neck Surg. 2009, 135, 347–354. [Google Scholar] [CrossRef]
- Ding, G.; Feng, C.; Jiang, H.; Ding, Q.; Zhang, L.; Na, R.; Xu, H.; Liu, J. Combination of rapamycin, CI-1040, and 17-AAG inhibits metastatic capacity of prostate cancer via Slug inhibition. PLoS ONE 2013, 8, e77400. [Google Scholar] [CrossRef]
- Li, Q.; Chow, A.B.; Mattingly, R.R. Three-dimensional overlay culture models of human breast cancer reveal a critical sensitivity to mitogen-activated protein kinase kinase inhibitors. J. Pharmacol. Exp. Ther. 2010, 332, 821–828. [Google Scholar] [CrossRef]
- Rinehart, J.; Adjei, A.A.; Lorusso, P.M.; Waterhouse, D.; Hecht, J.R.; Natale, R.B.; Hamid, O.; Varterasian, M.; Asbury, P.; Kaldjian, E.P.; et al. Multicenter phase II study of the oral MEK inhibitor, CI-1040, in patients with advanced non-small-cell lung, breast, colon, and pancreatic cancer. J. Clin. Oncol. 2004, 22, 4456–4462. [Google Scholar] [CrossRef]
- Lorusso, P.M.; Adjei, A.A.; Varterasian, M.; Gadgeel, S.; Reid, J.; Mitchell, D.Y.; Hanson, L.; DeLuca, P.; Bruzek, L.; Piens, J.; et al. Phase I and pharmacodynamic study of the oral MEK inhibitor CI-1040 in patients with advanced malignancies. J. Clin. Oncol. 2005, 23, 5281–5293. [Google Scholar] [CrossRef]
- Chilamakuri, R.; Rouse, D.C.; Yu, Y.; Kabir, A.S.; Muth, A.; Yang, J.; Lipton, J.M.; Agarwal, S. BX-795 inhibits neuroblastoma growth and enhances sensitivity towards chemotherapy. Transl. Oncol. 2022, 15, 101272. [Google Scholar] [CrossRef]
- Chilamakuri, R.; Agarwal, S. Dual Targeting of PI3K and HDAC by CUDC-907 Inhibits Pediatric Neuroblastoma Growth. Cancers 2022, 14, 1067. [Google Scholar] [CrossRef] [PubMed]
- Keshet, Y.; Seger, R. The MAP kinase signaling cascades: A system of hundreds of components regulates a diverse array of physiological functions. Methods Mol. Biol. 2010, 661, 3–38. [Google Scholar] [CrossRef] [PubMed]
- Healy, J.R.; Hart, L.S.; Shazad, A.L.; Gagliardi, M.E.; Tsang, M.; Elias, J.; Ruden, J.; Farrel, A.; Rokita, J.L.; Li, Y.; et al. Limited antitumor activity of combined BET and MEK inhibition in neuroblastoma. Pediatr. Blood Cancer 2020, 67, e28267. [Google Scholar] [CrossRef] [PubMed]
- Jin, X.F.; Spottl, G.; Maurer, J.; Nolting, S.; Auernhammer, C.J. Antitumoral Activity of the MEK Inhibitor Trametinib (TMT212) Alone and in Combination with the CDK4/6 Inhibitor Ribociclib (LEE011) in Neuroendocrine Tumor Cells In Vitro. Cancers 2021, 13, 1485. [Google Scholar] [CrossRef]
- Paramanantham, A.; Jung, E.J.; Go, S.I.; Jeong, B.K.; Jung, J.M.; Hong, S.C.; Kim, G.S.; Lee, W.S. Activated ERK Signaling Is One of the Major Hub Signals Related to the Acquisition of Radiotherapy-Resistant MDA-MB-231 Breast Cancer Cells. Int. J. Mol. Sci. 2021, 22, 4940. [Google Scholar] [CrossRef]
- Okuda, K.S.; Keyser, M.S.; Gurevich, D.B.; Sturtzel, C.; Mason, E.A.; Paterson, S.; Chen, H.; Scott, M.; Condon, N.D.; Martin, P.; et al. Live-imaging of endothelial Erk activity reveals dynamic and sequential signaling events during regenerative angiogenesis. Elife 2021, 10, e62196. [Google Scholar] [CrossRef]
- Leng, Y.; Chen, Z.; Ding, H.; Zhao, X.; Qin, L.; Pan, Y. Overexpression of microRNA-29b inhibits epithelial-mesenchymal transition and angiogenesis of colorectal cancer through the ETV4/ERK/EGFR axis. Cancer Cell Int. 2021, 21, 17. [Google Scholar] [CrossRef]
- Zhong, L.; Li, Y.; Xiong, L.; Wang, W.; Wu, M.; Yuan, T.; Yang, W.; Tian, C.; Miao, Z.; Wang, T.; et al. Small molecules in targeted cancer therapy: Advances, challenges, and future perspectives. Signal Transduct. Target. Ther. 2021, 6, 201. [Google Scholar] [CrossRef]
- Lake, D.; Correa, S.A.; Muller, J. Negative feedback regulation of the ERK1/2 MAPK pathway. Cell Mol. Life Sci. 2016, 73, 4397–4413. [Google Scholar] [CrossRef]
- Pudewell, S.; Wittich, C.; Kazemein Jasemi, N.S.; Bazgir, F.; Ahmadian, M.R. Accessory proteins of the RAS-MAPK pathway: Moving from the side line to the front line. Commun. Biol. 2021, 4, 696. [Google Scholar] [CrossRef]
- Caunt, C.J.; Sale, M.J.; Smith, P.D.; Cook, S.J. MEK1 and MEK2 inhibitors and cancer therapy: The long and winding road. Nat. Rev. Cancer 2015, 15, 577–592. [Google Scholar] [CrossRef] [PubMed]
- Wu, P.K.; Park, J.I. MEK1/2 Inhibitors: Molecular Activity and Resistance Mechanisms. Semin. Oncol. 2015, 42, 849–862. [Google Scholar] [CrossRef] [PubMed]
- Barrett, S.D.; Bridges, A.J.; Dudley, D.T.; Saltiel, A.R.; Fergus, J.H.; Flamme, C.M.; Delaney, A.M.; Kaufman, M.; LePage, S.; Leopold, W.R.; et al. The discovery of the benzhydroxamate MEK inhibitors CI-1040 and PD 0325901. Bioorg. Med. Chem. Lett. 2008, 18, 6501–6504. [Google Scholar] [CrossRef]
- Liu, D.; Liu, Z.; Jiang, D.; Dackiw, A.P.; Xing, M. Inhibitory effects of the mitogen-activated protein kinase kinase inhibitor CI-1040 on the proliferation and tumor growth of thyroid cancer cells with BRAF or RAS mutations. J. Clin. Endocrinol. Metab. 2007, 92, 4686–4695. [Google Scholar] [CrossRef] [PubMed]
- Bruchhagen, C.; Jarick, M.; Mewis, C.; Hertlein, T.; Niemann, S.; Ohlsen, K.; Peters, G.; Planz, O.; Ludwig, S.; Ehrhardt, C. Metabolic conversion of CI-1040 turns a cellular MEK-inhibitor into an antibacterial compound. Sci. Rep. 2018, 8, 9114. [Google Scholar] [CrossRef]
- VanBrocklin, M.W.; Verhaegen, M.; Soengas, M.S.; Holmen, S.L. Mitogen-activated protein kinase inhibition induces translocation of Bmf to promote apoptosis in melanoma. Cancer Res. 2009, 69, 1985–1994. [Google Scholar] [CrossRef]
- Rambal, A.A.; Panaguiton, Z.L.; Kramer, L.; Grant, S.; Harada, H. MEK inhibitors potentiate dexamethasone lethality in acute lymphoblastic leukemia cells through the pro-apoptotic molecule BIM. Leukemia 2009, 23, 1744–1754. [Google Scholar] [CrossRef]
- Mahoney, C.L.; Choudhury, B.; Davies, H.; Edkins, S.; Greenman, C.; Haaften, G.; Mironenko, T.; Santarius, T.; Stevens, C.; Stratton, M.R.; et al. LKB1/KRAS mutant lung cancers constitute a genetic subset of NSCLC with increased sensitivity to MAPK and mTOR signalling inhibition. Br. J. Cancer 2009, 100, 370–375. [Google Scholar] [CrossRef] [Green Version]


| Gene | Forward Primer (5′-3′) | Reverse Primer (5′-3′) |
|---|---|---|
| MAPK1 | TACACCAACCTCTCGTACATCG | CATGTCTGAAGCGCAGTAAGATT |
| MAPK2 | GGCAGCTACCTCAGGAATGAC | CCAGTGGCATGGTAAATCTCC |
| ERK2 | ACGGCATGGTTTGCTCTGCTTATG | TCATTTGCTCAATGGTTGGTGCCC |
| c-Myc | TACACTAACATCCCACGCTCTG | CGCATCCTTGTCCTGTGAGT |
| c-JUN | CCCCAAGATCCTGAAACAGA | CCGTTGCTGGACTGGATTAT |
| BCL-2 | GTGGATGACTGAGTACCTGAAC | GAGACAGCCAGGAGAAATCAA |
| GAPDH | CACCATCTTCCAGGAGCGAG | TGATGACCCTTTTGGCTCCC |
Publisher’s Note: MDPI stays neutral with regard to jurisdictional claims in published maps and institutional affiliations. |
© 2022 by the authors. Licensee MDPI, Basel, Switzerland. This article is an open access article distributed under the terms and conditions of the Creative Commons Attribution (CC BY) license (https://creativecommons.org/licenses/by/4.0/).
Share and Cite
Chilamakuri, R.; Agarwal, S. Direct Targeting of the Raf-MEK-ERK Signaling Cascade Inhibits Neuroblastoma Growth. Curr. Oncol. 2022, 29, 6508-6522. https://doi.org/10.3390/curroncol29090512
Chilamakuri R, Agarwal S. Direct Targeting of the Raf-MEK-ERK Signaling Cascade Inhibits Neuroblastoma Growth. Current Oncology. 2022; 29(9):6508-6522. https://doi.org/10.3390/curroncol29090512
Chicago/Turabian StyleChilamakuri, Rameswari, and Saurabh Agarwal. 2022. "Direct Targeting of the Raf-MEK-ERK Signaling Cascade Inhibits Neuroblastoma Growth" Current Oncology 29, no. 9: 6508-6522. https://doi.org/10.3390/curroncol29090512