The Diagnostic Value of PI-RADS v2.1 in Patients with a History of Transurethral Resection of the Prostate (TURP)


Abstract
:1. Introduction
2. Materials and Methods
2.1. Patients
2.2. MRI and Reporting Protocol
2.3. Biopsy Protocol
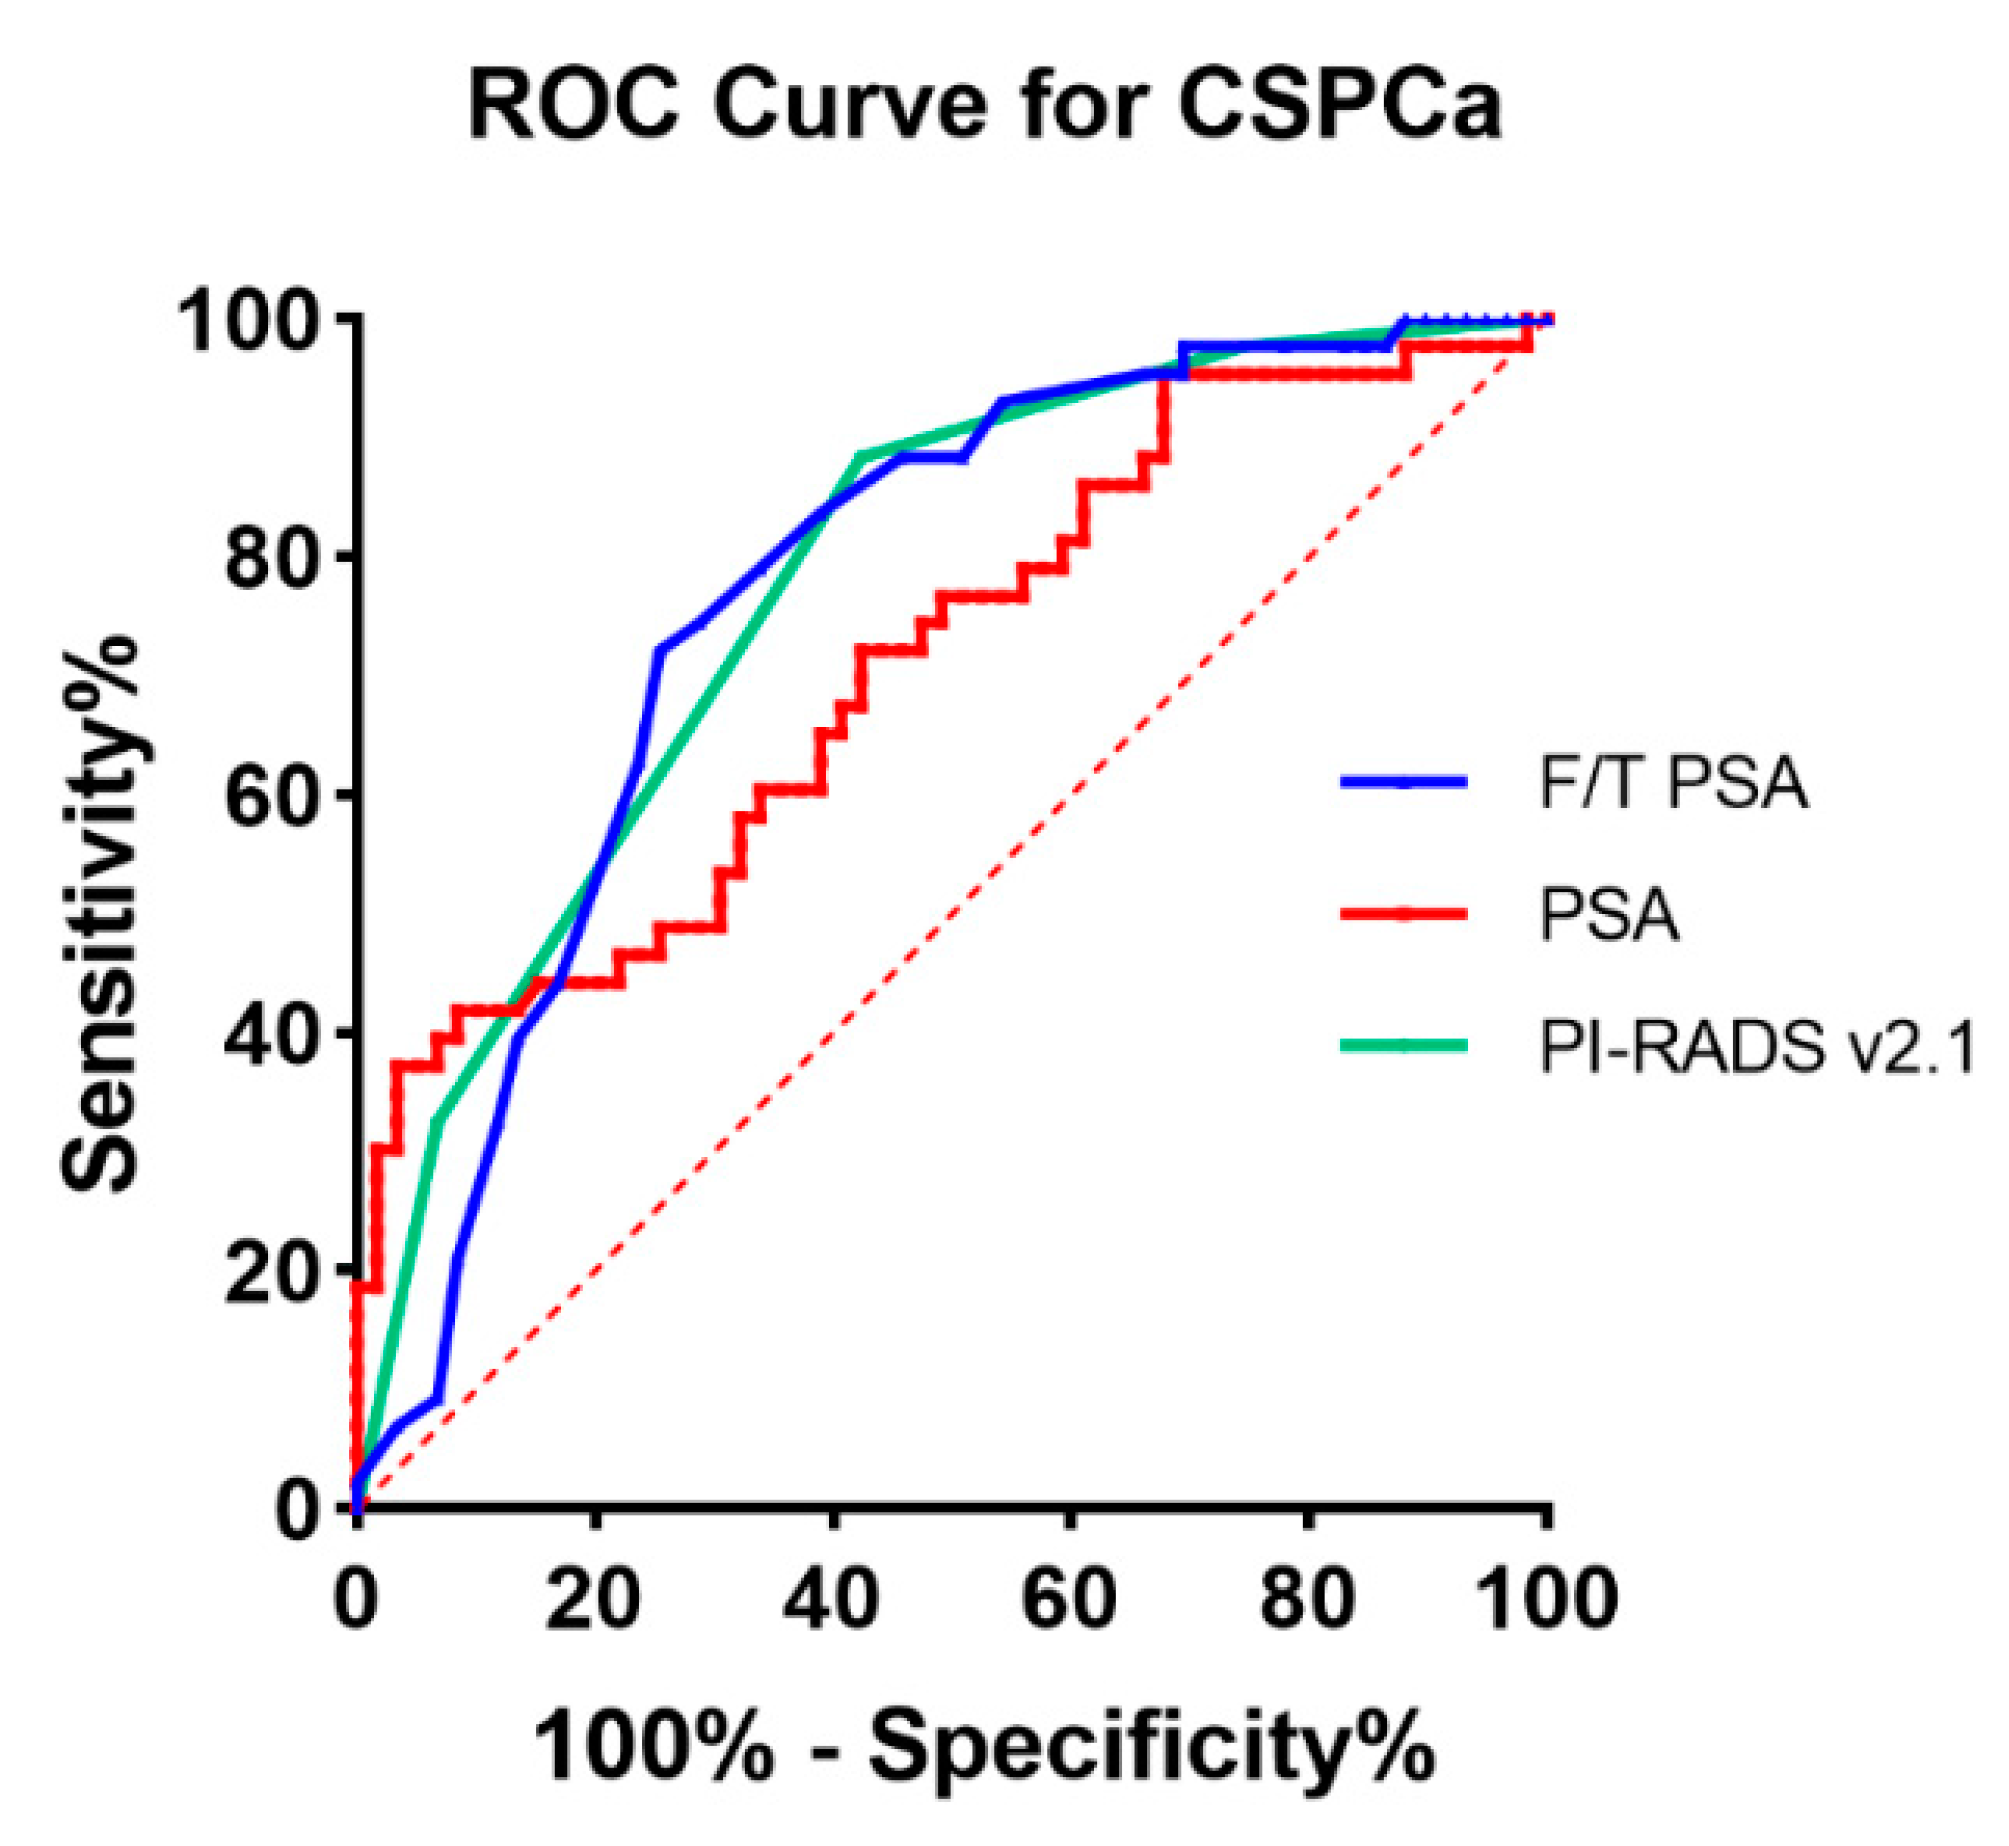
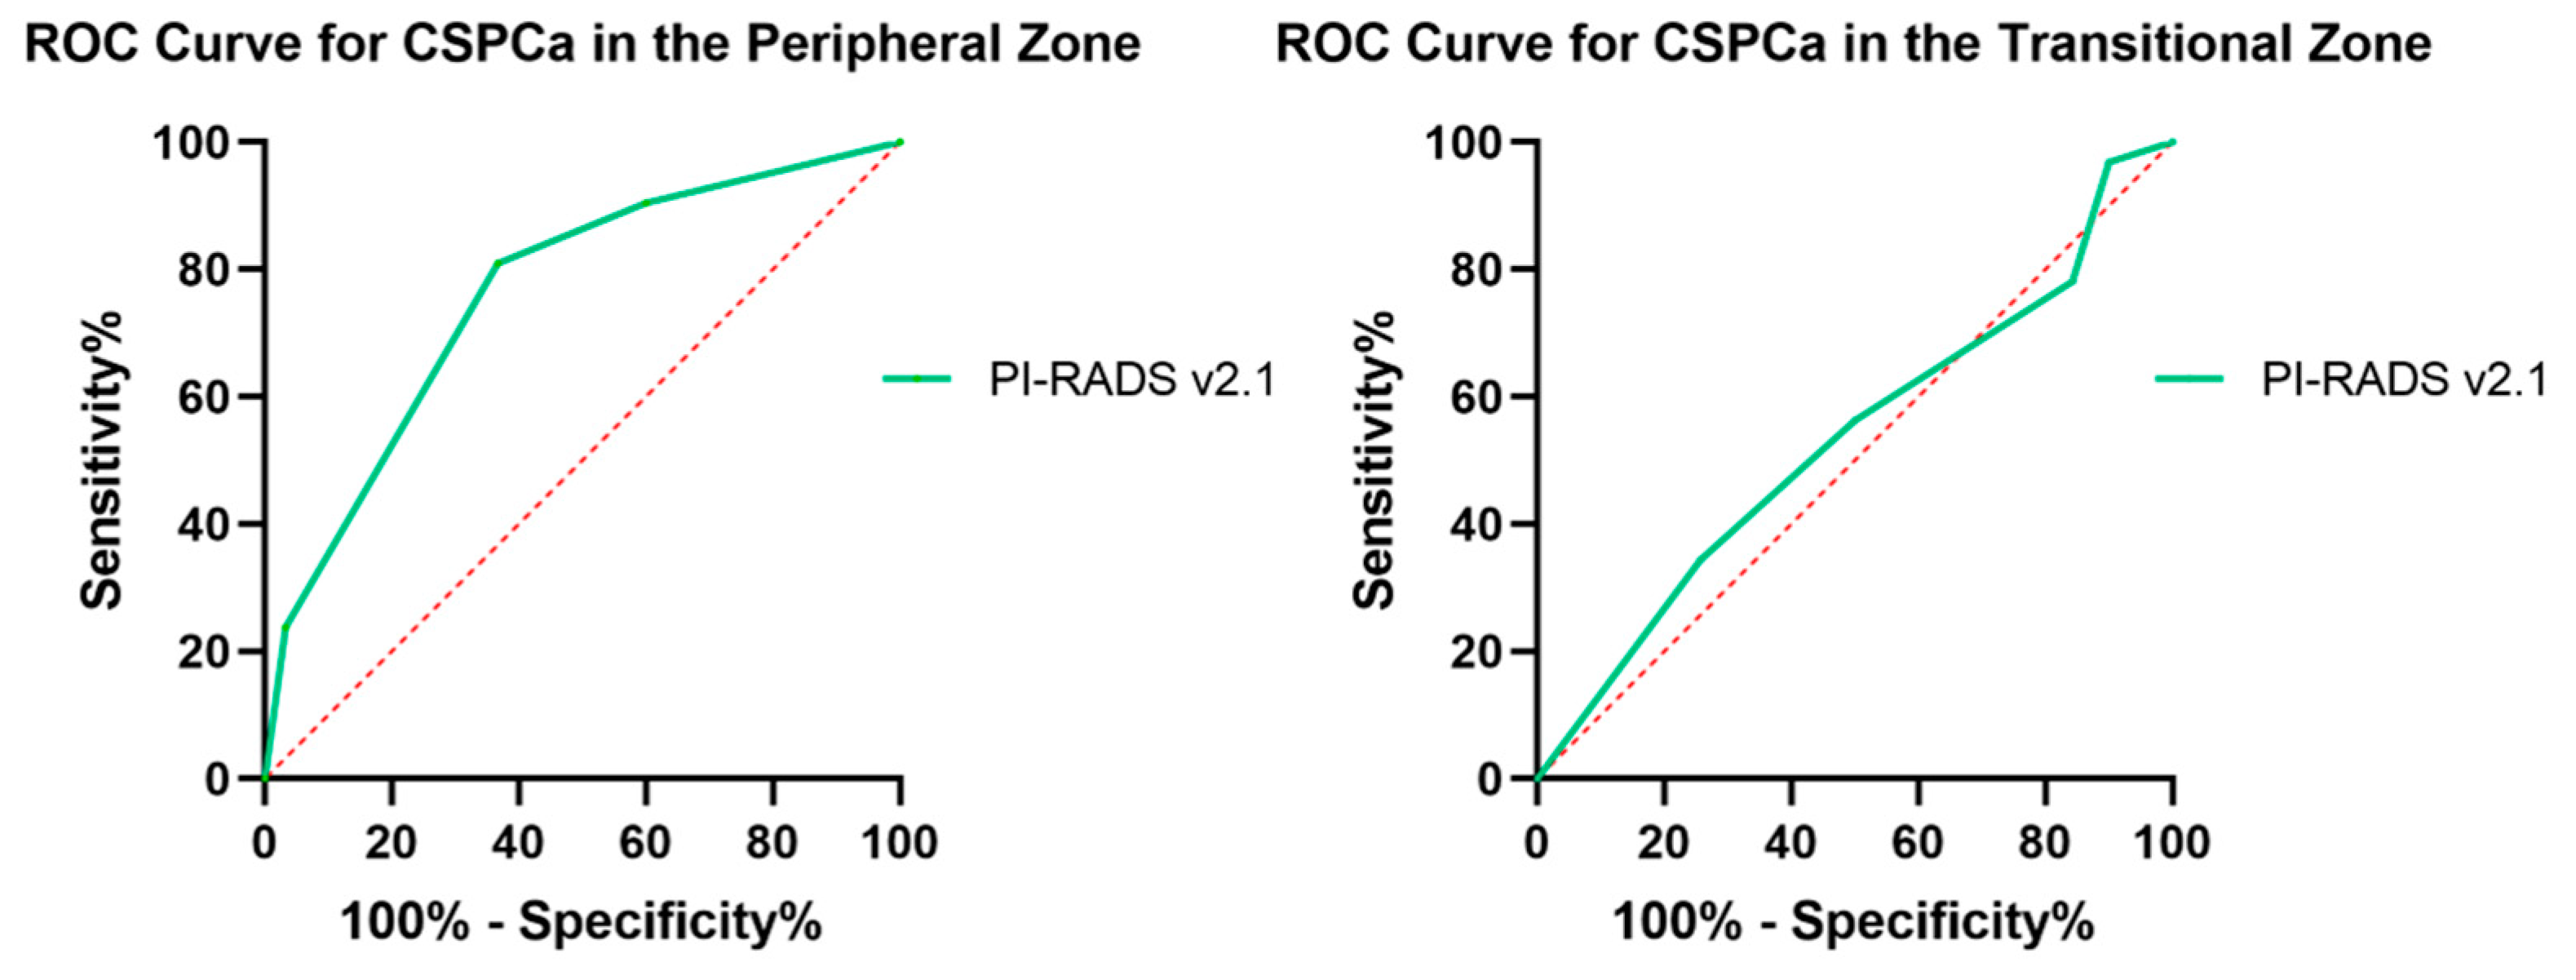
2.4. Statistical Analysis
3. Results
4. Discussion
5. Conclusions
Supplementary Materials
Author Contributions
Funding
Institutional Review Board Statement
Informed Consent Statement
Data Availability Statement
Conflicts of Interest
References
- Chen, R.; Ren, S.; Chinese Prostate Cancer, C.; Yiu, M.K.; Fai, N.C.; Cheng, W.S.; Ian, L.H.; Naito, S.; Matsuda, T.; Kehinde, E.; et al. Prostate cancer in Asia: A collaborative report. Asian J. Urol. 2014, 1, 15–29. [Google Scholar] [CrossRef] [PubMed]
- Siegel, R.L.; Miller, K.D.; Jemal, A. Cancer statistics, 2020. CA Cancer J. Clin. 2020, 70, 7–30. [Google Scholar] [CrossRef] [PubMed]
- Etzioni, R.; Penson, D.F.; Legler, J.M.; di Tommaso, D.; Boer, R.; Gann, P.H.; Feuer, E.J. Overdiagnosis due to prostate-specific antigen screening: Lessons from U.S. prostate cancer incidence trends. J. Natl. Cancer Inst. 2002, 94, 981–990. [Google Scholar] [CrossRef] [PubMed]
- Huang, Y.; Li, Z.Z.; Huang, Y.L.; Song, H.J.; Wang, Y.J. Value of free/total prostate-specific antigen (f/t PSA) ratios for prostate cancer detection in patients with total serum prostate-specific antigen between 4 and 10 ng/mL: A meta-analysis. Medicine 2018, 97, e0249. [Google Scholar] [CrossRef]
- Catalona, W.J.; Partin, A.W.; Slawin, K.M.; Brawer, M.K.; Flanigan, R.C.; Patel, A.; Richie, J.P.; deKernion, J.B.; Walsh, P.C.; Scardino, P.T.; et al. Use of the Percentage of Free Prostate-Specific Antigen to Enhance Differentiation of Prostate Cancer from Benign Prostatic DiseaseA Prospective Multicenter Clinical Trial. JAMA 1998, 279, 1542–1547. [Google Scholar] [CrossRef]
- Bratan, F.; Niaf, E.; Melodelima, C.; Chesnais, A.L.; Souchon, R.; Mège-Lechevallier, F.; Colombel, M.; Rouvière, O. Influence of imaging and histological factors on prostate cancer detection and localisation on multiparametric MRI: A prospective study. Eur. Radiol. 2013, 23, 2019–2029. [Google Scholar] [CrossRef]
- Turkbey, B.; Rosenkrantz, A.B.; Haider, M.A.; Padhani, A.R.; Villeirs, G.; Macura, K.J.; Tempany, C.M.; Choyke, P.L.; Cornud, F.; Margolis, D.J.; et al. Prostate Imaging Reporting and Data System Version 2.1: 2019 Update of Prostate Imaging Reporting and Data System Version 2. Eur. Urol. 2019, 76, 340–351. [Google Scholar] [CrossRef]
- Weinreb, J.C.; Barentsz, J.O.; Choyke, P.L.; Cornud, F.; Haider, M.A.; Macura, K.J.; Margolis, D.; Schnall, M.D.; Shtern, F.; Tempany, C.M.; et al. PI-RADS Prostate Imaging—Reporting and Data System: 2015, Version 2. Eur. Urol. 2016, 69, 16–40. [Google Scholar] [CrossRef]
- Thakur, V.; Singh, P.P.; Talwar, M.; Mukherjee, U. Utility of free/total prostate specific antigen (f/t PSA) ratio in diagnosis of prostate carcinoma. Dis. Markers 2003, 19, 287–292. [Google Scholar] [CrossRef]
- Roobol, M.J.; Steyerberg, E.W.; Kranse, R.; Wolters, T.; van den Bergh, R.C.; Bangma, C.H.; Schröder, F.H. A risk-based strategy improves prostate-specific antigen-driven detection of prostate cancer. Eur. Urol. 2010, 57, 79–85. [Google Scholar] [CrossRef]
- Wang, R.; Wang, H.; Zhao, C.; Hu, J.; Jiang, Y.; Tong, Y.; Liu, T.; Huang, R.; Wang, X. Evaluation of Multiparametric Magnetic Resonance Imaging in Detection and Prediction of Prostate Cancer. PLoS ONE 2015, 10, e0130207. [Google Scholar] [CrossRef] [PubMed]
- Marks, L.S.; Dorey, F.J.; Rhodes, T.; Shery, E.D.; Rittenhouse, H.; Partin, A.W.; deKernion, J.B. Serum prostate specific antigen levels after transurethral resection of prostate: A longitudinal characterization in men with benign prostatic hyperplasia. J. Urol. 1996, 156, 1035–1039. [Google Scholar] [CrossRef]
- Aus, G.; Bergdahl, S.; Frösing, R.; Lodding, P.; Pileblad, E.; Hugosson, J. Reference range of prostate-specific antigen after transurethral resection of the prostate. Urology 1996, 47, 529–531. [Google Scholar] [CrossRef]
- Koopman, A.; Jenniskens, S.F.M.; Fütterer, J.J. Magnetic Resonance Imaging Assessment After Therapy in Prostate Cancer. Top. Magn. Reson. Imaging 2020, 29, 47–58. [Google Scholar] [CrossRef] [PubMed]
- Potretzke, T.A.; Froemming, A.T.; Gupta, R.T. Post-treatment prostate MRI. Abdom. Radiol. 2020, 45, 2184–2197. [Google Scholar] [CrossRef]
- Egan, K.B. The Epidemiology of Benign Prostatic Hyperplasia Associated with Lower Urinary Tract Symptoms: Prevalence and Incident Rates. Urol. Clin. N. Am. 2016, 43, 289–297. [Google Scholar] [CrossRef] [PubMed]
- Madersbacher, S.; Lackner, J.; Brössner, C.; Röhlich, M.; Stancik, I.; Willinger, M.; Schatzl, G. Reoperation, myocardial infarction and mortality after transurethral and open prostatectomy: A nation-wide, long-term analysis of 23,123 cases. Eur. Urol. 2005, 47, 499–504. [Google Scholar] [CrossRef]
- Furuya, Y.; Akakura, K.; Tobe, T.; Ichikawa, T.; Igarashi, T.; Ito, H. Changes in serum prostate-specific antigen following prostatectomy in patients with benign prostate hyperplasia. Int. J. Urol. 2000, 7, 447–451. [Google Scholar] [CrossRef] [PubMed]
- Mikolajczyk, S.D.; Marks, L.S.; Partin, A.W.; Rittenhouse, H.G. Free prostate-specific antigen in serum is becoming more complex. Urology 2002, 59, 797–802. [Google Scholar] [CrossRef]
- Recker, F.; Kwiatkowski, M.K.; Pettersson, K.; Piironen, T.; Lümmen, G.; Huber, A.; Tscholl, R. Enhanced expression of prostate-specific antigen in the transition zone of the prostate. A characterization following prostatectomy for benign hyperplasia. Eur. Urol. 1998, 33, 549–555. [Google Scholar] [CrossRef]
- Rudolph, M.M.; Baur, A.D.J.; Cash, H.; Haas, M.; Mahjoub, S.; Hartenstein, A.; Hamm, C.A.; Beetz, N.L.; Konietschke, F.; Hamm, B.; et al. Diagnostic performance of PI-RADS version 2.1 compared to version 2.0 for detection of peripheral and transition zone prostate cancer. Sci. Rep. 2020, 10, 15982. [Google Scholar] [CrossRef] [PubMed]
- Ahmed, H.U.; El-Shater Bosaily, A.; Brown, L.C.; Gabe, R.; Kaplan, R.; Parmar, M.K.; Collaco-Moraes, Y.; Ward, K.; Hindley, R.G.; Freeman, A.; et al. Diagnostic accuracy of multi-parametric MRI and TRUS biopsy in prostate cancer (PROMIS): A paired validating confirmatory study. Lancet 2017, 389, 815–822. [Google Scholar] [CrossRef]
- Rouvière, O.; Puech, P.; Renard-Penna, R.; Claudon, M.; Roy, C.; Mège-Lechevallier, F.; Decaussin-Petrucci, M.; Dubreuil-Chambardel, M.; Magaud, L.; Remontet, L.; et al. Use of prostate systematic and targeted biopsy on the basis of multiparametric MRI in biopsy-naive patients (MRI-FIRST): A prospective, multicentre, paired diagnostic study. Lancet Oncol. 2019, 20, 100–109. [Google Scholar] [CrossRef]
- Gross, M.D.; Marks, L.S.; Sonn, G.A.; Green, D.A.; Wang, G.J.; Shoag, J.E.; Cabezon, E.; Margolis, D.J.; Robinson, B.D.; Hu, J.C. Variation in Magnetic Resonance Imaging-Ultrasound Fusion Targeted Biopsy Outcomes in Asian American Men: A Multicenter Study. J. Urol. 2020, 203, 530–536. [Google Scholar] [CrossRef] [PubMed]
- Alberts, A.R.; Roobol, M.J.; Verbeek, J.F.M.; Schoots, I.G.; Chiu, P.K.; Osses, D.F.; Tijsterman, J.D.; Beerlage, H.P.; Mannaerts, C.K.; Schimmöller, L.; et al. Prediction of High-grade Prostate Cancer Following Multiparametric Magnetic Resonance Imaging: Improving the Rotterdam European Randomized Study of Screening for Prostate Cancer Risk Calculators. Eur. Urol. 2019, 75, 310–318. [Google Scholar] [CrossRef]
- Washino, S.; Okochi, T.; Saito, K.; Konishi, T.; Hirai, M.; Kobayashi, Y.; Miyagawa, T. Combination of prostate imaging reporting and data system (PI-RADS) score and prostate-specific antigen (PSA) density predicts biopsy outcome in prostate biopsy naïve patients. BJU Int. 2017, 119, 225–233. [Google Scholar] [CrossRef]
- Sheu, M.H.; Chiang, H.; Wang, J.H.; Chang, Y.H.; Chang, C.Y. Transurethral resection of the prostate-related changes in the prostate gland: Correlation of MRI and histopathology. J. Comput. Assist. Tomogr. 2000, 24, 596–599. [Google Scholar] [CrossRef]
- Wolff, J.M.; Boekels, O.; Borchers, H.; Jakse, G.; Rohde, D. Altered prostate specific antigen reference range after transurethral resection of the prostate. Anticancer Res. 2000, 20, 4977–4980. [Google Scholar]
- Helfand, B.T.; Anderson, C.B.; Fought, A.; Kim, D.Y.; Vyas, A.; McVary, K.T. Postoperative PSA and PSA Velocity Identify Presence of Prostate Cancer After Various Surgical Interventions for Benign Prostatic Hyperplasia. Urology 2009, 74, 177–183. [Google Scholar] [CrossRef]
- Deniffel, D.; Healy, G.M.; Dong, X.; Ghai, S.; Salinas-Miranda, E.; Fleshner, N.; Hamilton, R.; Kulkarni, G.; Toi, A.; van der Kwast, T.; et al. Avoiding Unnecessary Biopsy: MRI-based Risk Models versus a PI-RADS and PSA Density Strategy for Clinically Significant Prostate Cancer. Radiology 2021, 300, 369–379. [Google Scholar] [CrossRef]
- Martorana, E.; Aisa, M.C.; Grisanti, R.; Santini, N.; Pirola, G.M.; Datti, A.; Gerli, S.; Bonora, A.; Burani, A.; Scalera, G.B.; et al. Lesion Volume in a Bi- or Multivariate Prediction Model for the Management of PI-RADS v2.1 Score 3 Category Lesions. Turk. J. Urol. 2022, 48, 268–277. [Google Scholar] [CrossRef] [PubMed]
- Martorana, E.; Pirola, G.M.; Scialpi, M.; Micali, S.; Iseppi, A.; Bonetti, L.R.; Kaleci, S.; Torricelli, P.; Bianchi, G. Lesion volume predicts prostate cancer risk and aggressiveness: Validation of its value alone and matched with prostate imaging reporting and data system score. BJU Int. 2017, 120, 92–103. [Google Scholar] [CrossRef] [PubMed]


| CSPCa | Non-CSPCa or Negative Biopsy | p-Value | |
|---|---|---|---|
| Age (yrs), median (IQR) | 77 (72–80) | 70 (66–75) | 0.000 |
| Time after TURP (yrs), median (IQR) | 6 (3–12) | 8 (5–10) | 0.557 |
| PSA (ng/mL), median (IQR) | 14.73 (10.97–36.00) | 10.91 (6.19–15.89) | 0.000 |
| F/T PSA, median (IQR) | 0.12 (0.09–0.15) | 0.18 (0.13–0.23) | 0.000 |
| PI-RADS V2.1 n (%) | |||
| 2 | 1 (2.3) | 15 (25.4) | 0.000 |
| 3 | 4 (9.3) | 19 (32.2) | |
| 4 | 24 (55.8) | 21 (35.6) | |
| 5 | 14 (32.6) | 4 (6.8) |
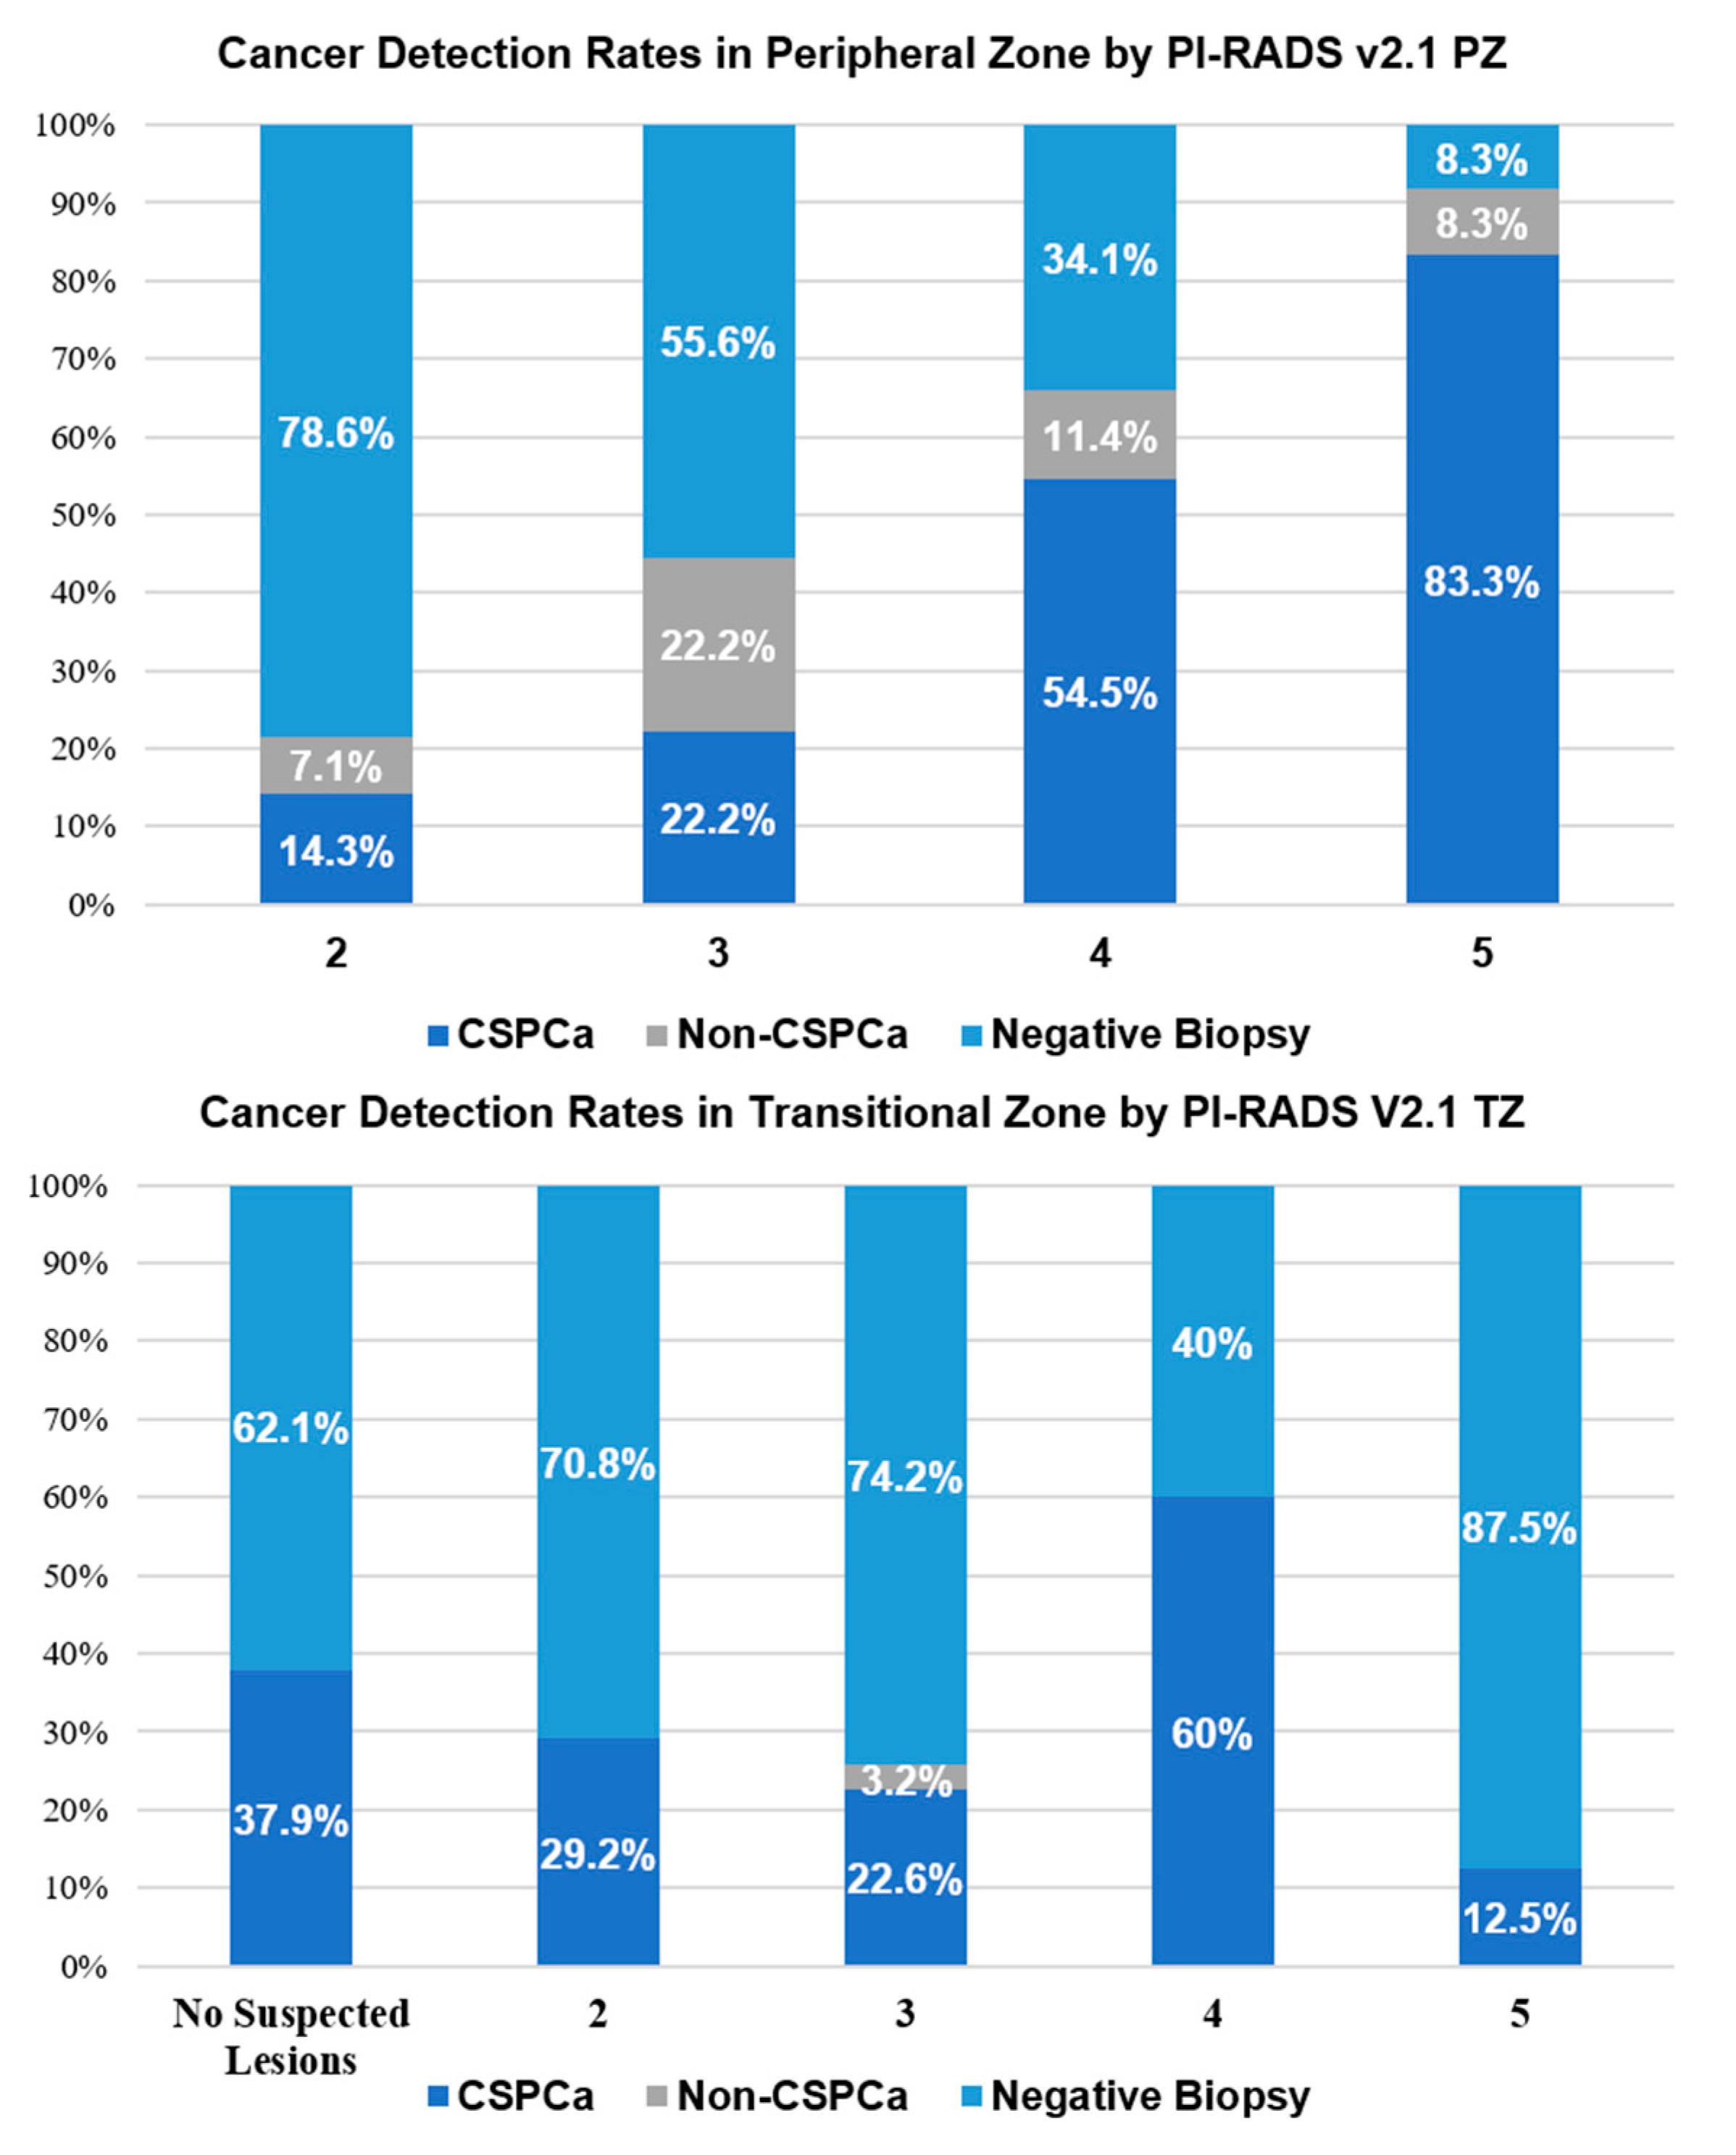
| CSPCa | Non-CSPCa/Negative Biopsy | p-Value | |
|---|---|---|---|
| PI-RADS v2.1 PZ n (%) | |||
| 2 | 4 (9.5%) | 24 (40.0%) | 0.000 |
| 3 | 4 (9.5%) | 14 (23.3%) | |
| 4 | 24 (57.1%) | 20 (33.3%) | |
| 5 | 10 (23.8%) | 2 (3.3%) | |
| PI-RADS v2.1 TZ n (%) | |||
| No Suspected Lesions | 11 (34.4%) | 18 (25.7%) | 0.167 |
| 2 | 7 (21.9%) | 17 (24.3%) | |
| 3 | 7 (21.9%) | 24 (34.3%) | |
| 4 | 6 (18.8%) | 4 (5.7%) | |
| 5 | 1 (3.1%) | 7 (10.0%) | |
Publisher’s Note: MDPI stays neutral with regard to jurisdictional claims in published maps and institutional affiliations. |
© 2022 by the authors. Licensee MDPI, Basel, Switzerland. This article is an open access article distributed under the terms and conditions of the Creative Commons Attribution (CC BY) license (https://creativecommons.org/licenses/by/4.0/).
Share and Cite
Liu, J.; Pan, S.; Dong, L.; Wu, G.; Wang, J.; Wang, Y.; Qian, H.; Dong, B.; Pan, J.; Zhu, Y.; et al. The Diagnostic Value of PI-RADS v2.1 in Patients with a History of Transurethral Resection of the Prostate (TURP). Curr. Oncol. 2022, 29, 6373-6382. https://doi.org/10.3390/curroncol29090502
Liu J, Pan S, Dong L, Wu G, Wang J, Wang Y, Qian H, Dong B, Pan J, Zhu Y, et al. The Diagnostic Value of PI-RADS v2.1 in Patients with a History of Transurethral Resection of the Prostate (TURP). Current Oncology. 2022; 29(9):6373-6382. https://doi.org/10.3390/curroncol29090502
Chicago/Turabian StyleLiu, Jiazhou, Shihang Pan, Liang Dong, Guangyu Wu, Jiayi Wang, Yan Wang, Hongyang Qian, Baijun Dong, Jiahua Pan, Yinjie Zhu, and et al. 2022. "The Diagnostic Value of PI-RADS v2.1 in Patients with a History of Transurethral Resection of the Prostate (TURP)" Current Oncology 29, no. 9: 6373-6382. https://doi.org/10.3390/curroncol29090502