Comparative Prospective and Longitudinal Analysis on the Platelet-to-Lymphocyte, Neutrophil-to-Lymphocyte, and Albumin-to-Globulin Ratio in Patients with Non-Metastatic and Metastatic Prostate Cancer

 , , , ,
  , , ,
, , ,
Abstract
:1. Introduction
Aim and Objectives
2. Materials and Methods
2.1. Study Design
2.2. Population
2.3. Methods
2.3.1. Treatment Choice in Prostate Cancer Cases
2.3.2. Pathologic Evaluation
2.3.3. Neutrophil-to-Lymphocyte, Platelet-to-Lymphocyte, and Albumin-to-Globulin Ratio Determination
2.4. Statistical Analysis
3. Results
3.1. Comparative Analysis among the Different Groups
3.1.1. Benign Prostatic Hyperplasia versus Prostate Cancer Cases
3.1.2. Non-Metastatic versus Metastatic Prostate Cancer Cases
3.2. Results on the Basis of Neutrophil-to-Lymphocyte, Platelet-to-Lymphocyte, and Albumin-to-Globulin Ratio Stratification (Low versus High)
3.2.1. Benign Prostatic Hyperplasia versus Prostate Cancer Diagnosis (Group A versus B)
Neutrophil-to-Lymphocyte Ratio
Platelet-to-Lymphocyte RATIO
Albumin-to-Globulin Ratio
3.2.2. Non-Metastatic Prostate Cancer (Group B2)
Neutrophil-to-Lymphocyte Ratio
Platelet-to-Lymphocyte Ratio
Albumin-to-Globulin Ratio
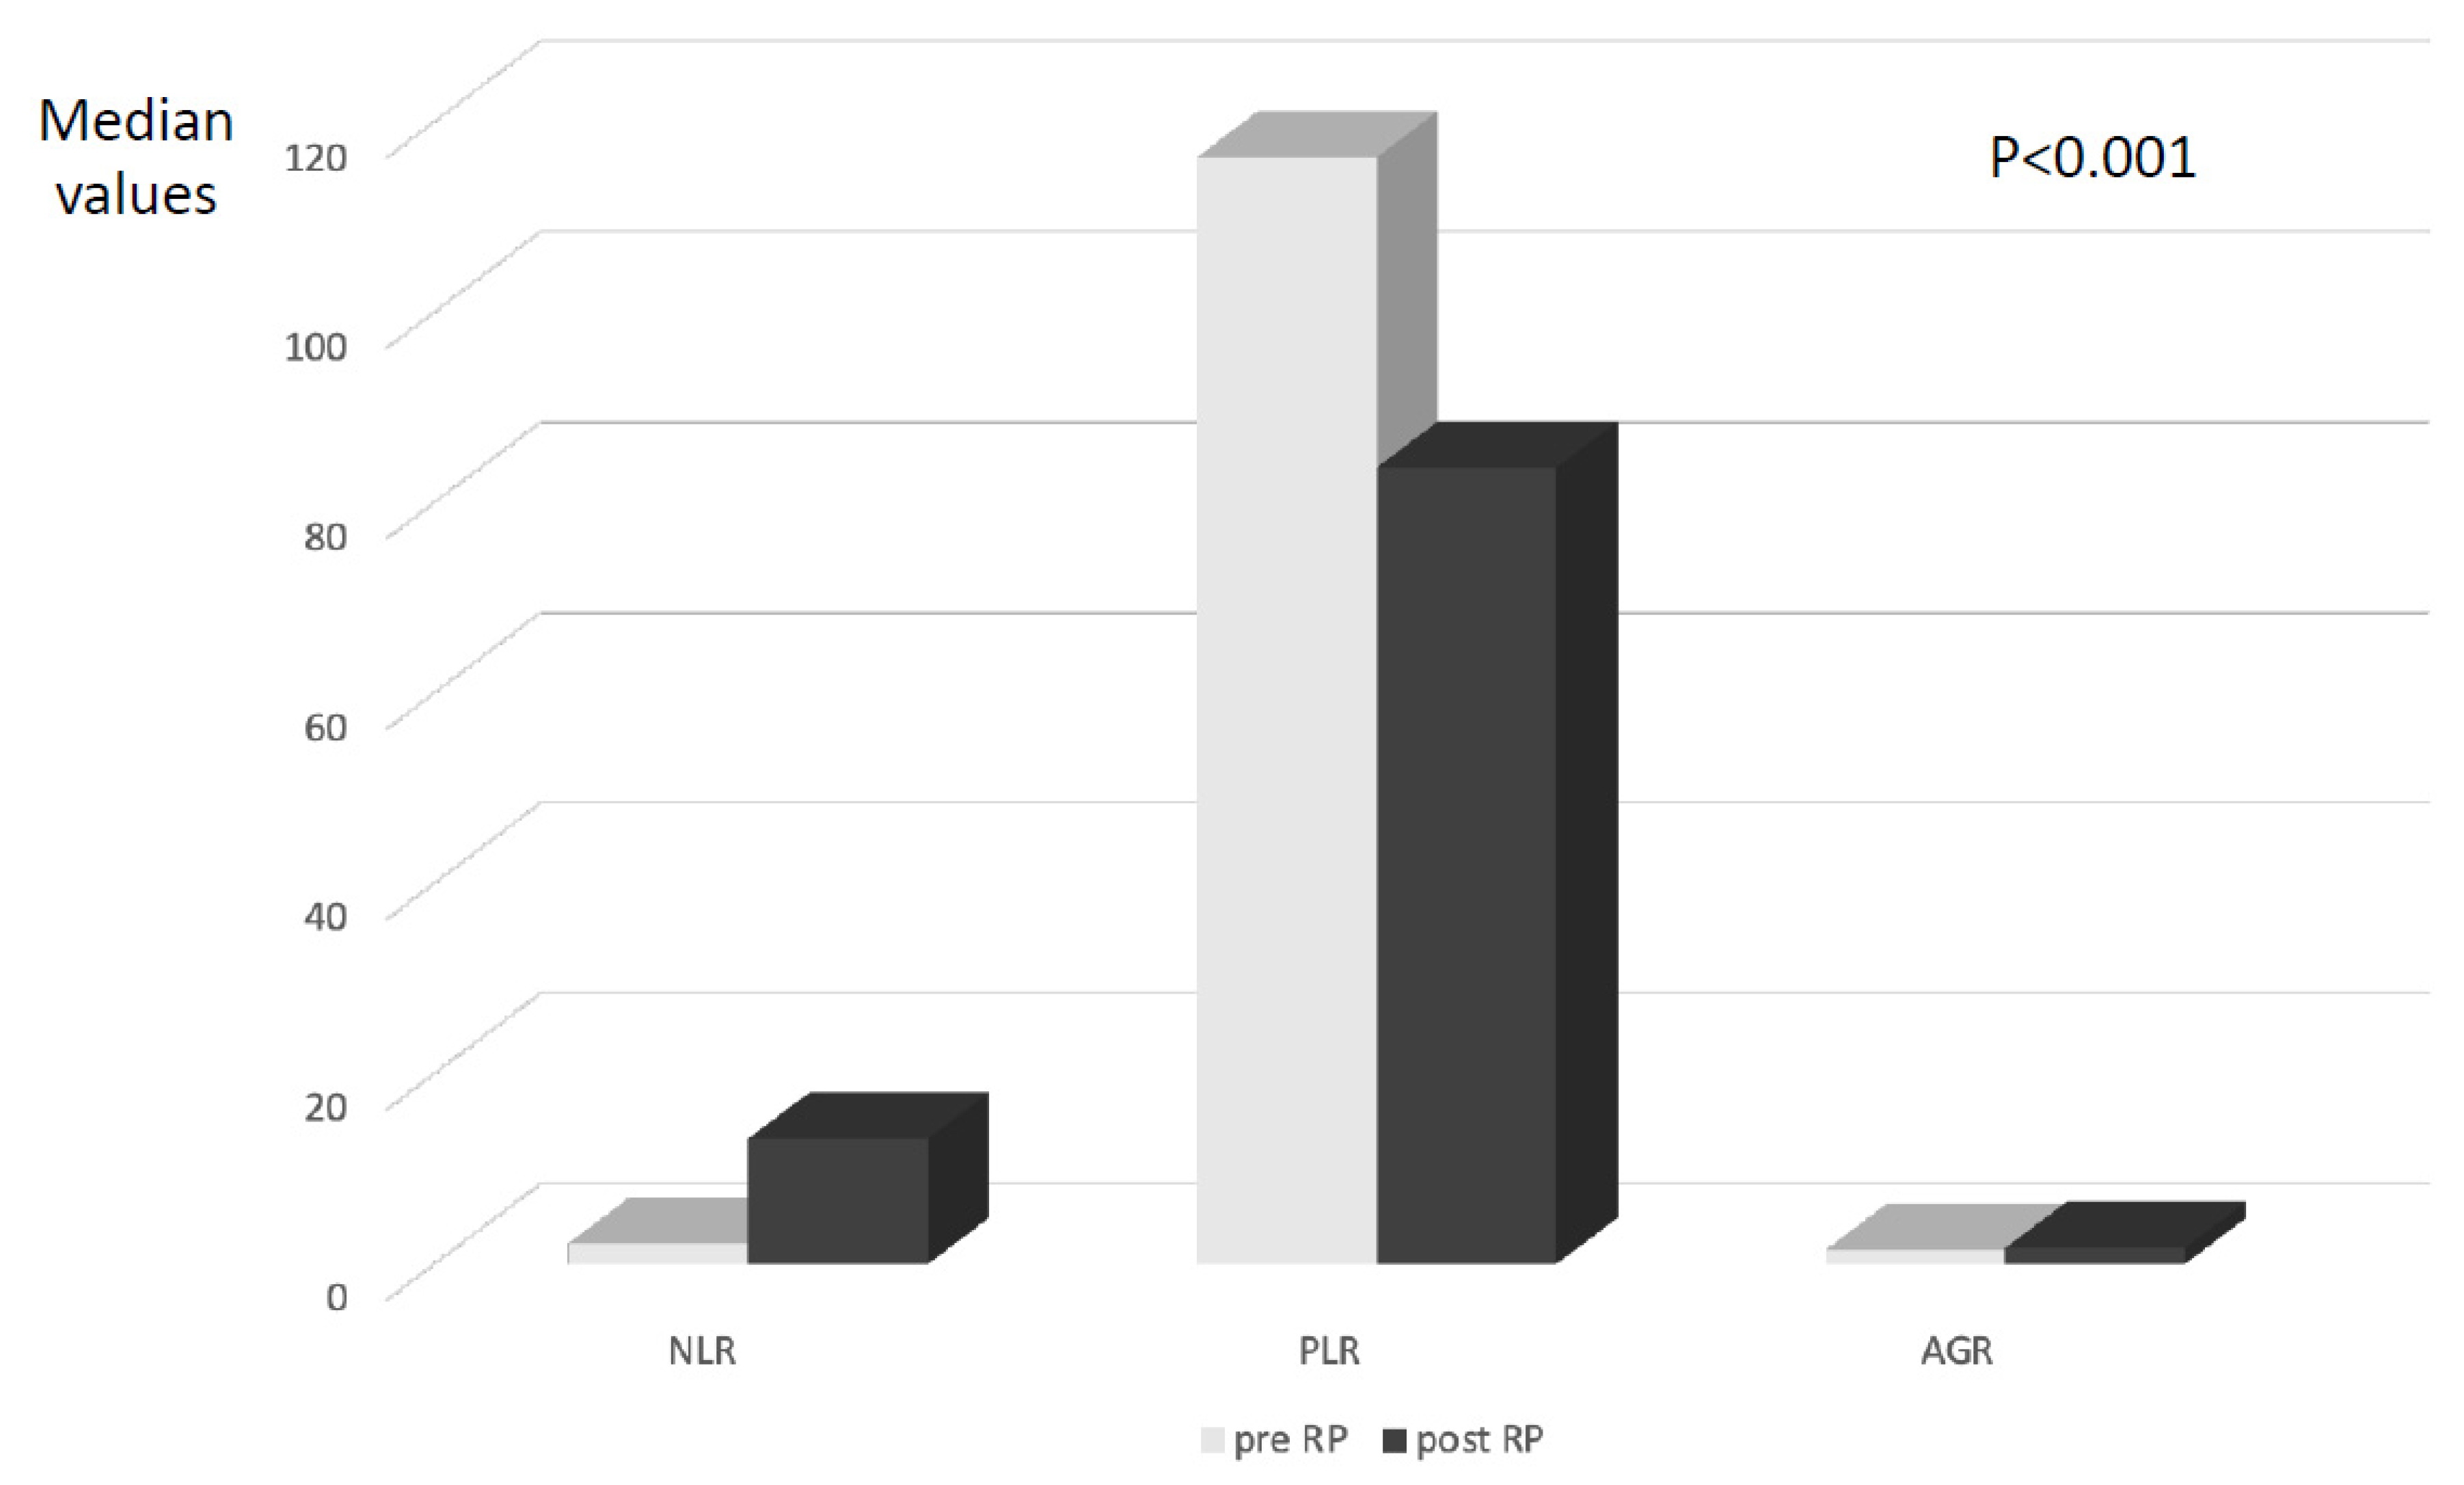
3.3. Variation in Neutrophil-to-Lymphocyte, Platelet-to-Lymphocyte, and Albumin-to-Globulin Ratio According to Radical Prostatectomy Procedure
3.4. Correlation among Neutrophil-to-Lymphocyte, Platelet-to-Lymphocyte, Albumin-to-Globulin Ratio, and Other Clinical and Pathological Variables
3.5. Sensitivity, Specificity, Positive Predictive Value, Negative Predictive Value, and Area under the Curve Results in Predicting Pathologic Features
3.5.1. Initial Diagnosis of Clinically Significant Prostate Cancer
3.5.2. Metastatic Disease (M+)
3.5.3. Extraprostatic Disease (T3)
3.5.4. Aggressive Disease (ISUP 3–5)
3.5.5. Biochemical Progression
3.6. Logistic Regression Analysis
4. Discussion
5. Conclusions
Author Contributions
Funding
Institutional Review Board Statement
Informed Consent Statement
Data Availability Statement
Conflicts of Interest
Abbreviations
| RP | Radical prostatectomy |
| PC | Prostate cancer |
| NLR | Neutrophil-to-lymphocyte ratio |
| PLR | Platelet-to-lymphocyte ratio |
| AGR | Albumin-to-globulin ratio |
| EAU | European Association of Urology |
| CI | Confidence interval |
| OR | Odds ratio |
| HR | Hazard ratio |
| BCP | Biochemical progression |
| CSS | Cancer-specific survival |
| OS | Overall survival |
References
- Mottet, N.; van den Bergh, R.C.N. Prostate Cancer: European Association of Urology (EAU) Guidelines 2022. Available online: https://uroweb.org/guideline/prostate-cancer/ (accessed on 1 October 2022).
- Shariat, S.F. Critical review of prostate cancer predictive tools. Future Oncol. 2009, 10, 1555–1584. [Google Scholar] [CrossRef] [PubMed] [Green Version]
- Briganti, A.; Larcher, A.; Abdollah, F.; Capitanio, U.; Gallina, A.; Suardi, N.; Bianchi, M.; Sun, M.; Freschi, M.; Salonia, A.; et al. Updated nomogram predicting lymph node invasion in patients with prostate cancer undergoing extended pelvic lymph node dissection: The essential importance of percentage of positive cores. Eur. Urol. 2012, 61, 480. [Google Scholar] [CrossRef] [PubMed]
- Gandaglia, G.; Fossati, N.; Zaffuto, E.; Bandini, M.; Dell’Oglio, P.; Bravi, C.A.; Fallara, G.; Pellegrino, F.; Nocera, L.; Karakiewicz, P.I.; et al. Development and Internal Validation of a Novel Model to Identify the Candidates for Extended Pelvic Lymph Node Dissection in Prostate Cancer. Eur. Urol. 2017, 72, 632. [Google Scholar] [CrossRef] [PubMed]
- Sciarra, A.; Gentilucci, A.; Salciccia, S.; Pierella, F.; Del Bianco, F.; Gentile, V.; Silvestri, I.; Cattarino, S. Prognostic value of inflammation in prostate cancer progression and response to therapeutic: A critical review. J. Inflamm. (Lond) 2016, 13, 35. [Google Scholar] [CrossRef] [PubMed] [Green Version]
- Guo, J.; Fang, J.; Huang, X.; Liu, Y.; Yuan, Y.; Zhang, X.; Zou, C.; Xiao, K.; Wang, J. Prognostic role of neutrophil to lymphocyte ratio and platelet to lymphocyte ratio in prostate cancer: A meta-analysis of results from multivariate analysis. Int. J. Surg. 2018, 60, 216–223. [Google Scholar] [CrossRef] [PubMed]
- Zanaty, M.; Ajib, K.; Alnazari, M.; El Rassy, E.; Aoun, F.; Zorn, K.C.; El-Hakim, A. Prognostic utility of neutrophil-to-lymphocyte and platelets-to-lymphocyte ratio in predicting biochemical recurrence post robotic prostatectomy. Biomark. Med. 2018, 12, 841–848. [Google Scholar] [CrossRef] [PubMed]
- Salciccia, S.; Frisenda, M.; Bevilacqua, G.; Viscuso, P.; Casale, P.; De Berardinis, E.; Di Pierro, G.B.; Cattarino, S.; Giorgino, G.; Rosati, D.; et al. Prognostic Value of Albumin to Globulin Ratio in Non-Metastatic and Metastatic Prostate Cancer Patients: A Meta-Analysis and Systematic Review. Int. J. Mol. Sci. 2022, 23, 11501. [Google Scholar] [CrossRef] [PubMed]
- Gupta, D.; Lis, C.G. Pretreatment serum albumin as a predictor of cancer survival: A systematic review of the epidemiological literature. Nutr. J. 2010, 9, 69. [Google Scholar] [CrossRef] [PubMed] [Green Version]
- Meyer, E.J.; Nenke, M.A.; Rankin, W.; Lewis, J.G.; Torpy, D.J. Corticosteroid-Binding Globulin: A Review of Basic and Clinical Advances. Horm. Metab. Res. 2016, 48, 359–371. [Google Scholar] [CrossRef] [PubMed]
- Guan, Y.; Xiong, H.; Feng, Y.; Liao, G.; Tong, T.; Pang, J. Revealing the prognostic landscape of neutrophil-to-lymphocyte ratio and platelet-to-lymphocyte ratio in metastatic castration-resistant prostate cancer patients treated with abiraterone or enzalutamide: A meta-analysis. Prostate Cancer Prostatic Dis. 2020, 23, 220–231. [Google Scholar] [CrossRef] [PubMed]
- Aydh, A.; Mori, K.; D’Andrea, D.; Motlagh, R.S.; Abufaraj, M.; Pradere, B.; Mostafaei, H.; Laukhtina, E.; Quhal, F.; Karakiewicz, P.I.; et al. Prognostic value of the pre-operative serum albumin to globulin ratio in patients with non-metastatic prostate cancer undergoing radical prostatectomy. Int. J. Clin. Oncol. 2021, 26, 1729–1735. [Google Scholar] [CrossRef] [PubMed]
- Lv, G.Y.; An, L.; Sun, X.D.; Hu, Y.L.; Sun, D.W. Pretreatment albumin to globulin ratio can serve as a prognostic marker in human cancers: A meta-analysis. Clin. Chim. Acta 2018, 476, 81–91. [Google Scholar] [CrossRef] [PubMed]
- Soeters, P.B.; Wolfe, R.R.; Shenkin, A. Hypoalbuminemia: Pathogenesis and Clinical Significance. J. Parenter. Enter. Nutr. 2019, 43, 181–193. [Google Scholar] [CrossRef] [PubMed] [Green Version]
- Claps, F.; Rai, S.; Mir, M.C.; van Rhijn, B.W.G.; Mazzon, G.; Davis, L.E.; Valadon, C.L.; Silvestri, T.; Rizzo, M.; Ankem, M.; et al. Prognostic value of preoperative albumin-to-fibrinogen ratio (AFR) in patients with bladder cancer treated with radical cystectomy. Urol. Oncol. Semin. Orig. Investig. 2021, 39, 835.e9–835.e17. [Google Scholar] [CrossRef] [PubMed]
- Azab, B.N.; Bhatt, V.R.; Vonfrolio, S.; Bachir, R.; Rubinshteyn, V.; Alkaied, H.; Habeshy, A.; Patel, J.; Picon, A.I.; Bloom, S.W. Value of the pretreatment albumin to globulin ratio in predicting long-term mortality in breast cancer patients. Am. J. Surg. 2013, 206, 764–770. [Google Scholar] [CrossRef] [PubMed]
- Salciccia, S.; Frisenda, M.; Bevilacqua, G.; Viscuso, P.; Casale, P.; De Berardinis, E.; Di Pierro, G.B.; Cattarino, S.; Giorgino, G.; Rosati, D.; et al. Prognostic role of platelet-to-lymphocyte ratio and neutrophil-to-lymphocyte ratio in patients with non-metastatic and metastatic prostate cancer: A meta-analysis and systematic review. Asian J. Urol. ahead of print.
- Sun, Z.; Ju, Y.; Han, F.; Sun, X.; Wang, F. Clinical implications of pretreatment inflammatory biomarkers as independent prognostic indicators in prostate cancer. J. Clin. Lab. Anal. 2018, 32, e22277. [Google Scholar] [CrossRef] [PubMed] [Green Version]
- Nkengurutse, G.; Tian, F.; Jiang, S.; Wang, Q.; Wang, Y.; Sun, W. Preoperative Predictors of Biochemical Recurrence-Free Survival in High-Risk Prostate Cancer Following Radical Prostatectomy. Front. Oncol. 2020, 10, 1761–1769. [Google Scholar] [CrossRef] [PubMed]
- Adhyatma, K.P.; Prapiska, F.F.; Siregar, G.P.; Warli, S.M. Systemic Inflammatory Response in Predicting Prostate Cancer: The Diagnostic Value of Neutrophil-to-Lymphocyte Ratio. Open Access Maced. J. Med. Sci. 2019, 7, 1628–1630. [Google Scholar] [CrossRef] [PubMed] [Green Version]
- Chung, J.W.; Ha, Y.S.; Kim, S.W.; Park, S.C.; Kang, T.W.; Jeong, Y.B.; Park, S.W.; Park, J.; Yoo, E.S.; Kwon, T.G.; et al. The prognostic value of the pretreatment serum albumin to globulin ratio for predicting adverse pathology in patients under-going radical prostatectomy for prostate cancer. Investig. Clin. Urol. 2021, 62, 545–552. [Google Scholar] [CrossRef] [PubMed]


| Parameter | Group A (BPH) | Group B (all PC) | Group B1 (Clinically Significant PC) | Group B2 (nmPC) | Group B3 (mPC) | p Value 1 = A vs. B 2 = A vs. B1 3 = A vs. B2 4 = A vs. B3 5 = B2 vs. B3 |
|---|---|---|---|---|---|---|
| Number of cases | 494 | 525 | 426 | 416 | 109 | \ |
| Age (years) | 66.3 ± 9.2; 68.0: (23–87) | 66.6 ± 8.5; 67.0: (40–89) | 65.1 ± 8.5; 67.0 (44–84) | 65.3 ± 8.4; 67.0 (40–87) | 71.2 ± 8.4; 67.0 (52–89) | 1. 0.591 2. 0.044 3. 0.086 4. <0.0001 5. <0.0001 |
| BMI | 25.2 ± 8.7; 25.0: (16.9–45.6) | 26.0 ± 3.3; 25.3 (16.9–39.4) | 27.1 ± 7.6; 25.4 (20.4–39.4) | 26.1 ± 3.3; 25.4 (16.9–39.4) | 25.4 ± 3.3; 25.3 (22.7–29.7) | 1. 0.0504 2. 0.0007 3. 0.0367 4. 0.8301 5. 0.0259 |
| Metabolic syndrome % | 1. <0.0001 2. <0.0001 3. <0.0001 4. <0.0001 5. <0.0001 | |||||
| 0 (absent) | 83.6% | 64.8% | 66% | 63.9% | 65.1% | |
| 1 (mild) | 8.7% | 17.3% | 16.7% | 19.6% | 10.7% | |
| 2 (complete) | 7.7% | 17.9% | 17.3% | 16.5% | 24.2% | |
| Baseline NLR | 2.2 ± 1.2; 2.1: (0.5–17.8) | 2.5 ± 1.1; 2.2: (0.1–9.6) | 2.4 ± 1.1; 2.2: (0.1–8) | 2.5 ± 1.1; 2.2: (0.1–9.6) | 2.6 ± 1.5; 2.2 (0.6–4.6) | 1. 0.0005 2. 0.0053 3. 0.0038 4. 0.0019 5. 0.1528 |
| (data on 459 cases) | (data on 455 cases) | (data on 371 cases) | (data on 355 cases) | (data on 100 cases) | ||
| Low (2.5) | 327 (71.2%) | 259 (56.9%) | 205 (55.2%) | 220 (61.6%) | 39 (40.7%) | |
| High (2.5) | 132 (28.8%) | 196 (43.1%) | 166 (44.8%) | 135 (38.4%) | 61 (59.3%) | |
| Baseline PLR | 117.3 ± 51.3; 113.0: (28.3–369.5) | 132.8 ± 49.3; 116.0: (1.92–439.0) | 129.2 ± 49.3; 116.3: (1.92–439.0) | 127.8 ± 49.3; 116.3: (1.9–439.0) | 149.6 ± 49.5; 116.3 (58.8–255.4) | 1. <0.0001 2. <0.0001 3. <0.0001 4. <0.0001 5. <0.0001 |
| (data on 456 cases) | (data on 455 cases) | (data on 297 cases) | (data on 355 cases) | (data on 100 cases) | ||
| Low (<120.0) | 289 (63.3%) | 193 (42.4%) | 149 (50.1%) | 173 (49.1%) | 20 (19.4%) | |
| High (120.0) | 167 (36.7%) | 262 (57.6%) | 148 (49.9%) | 182 (50.9%) | 80 (80.6%) | |
| Baseline AGR | 1.5 ± 0.3; 1.5: (0.7–2.1) | 1.5 ± 0.3; 1.5: (0.8–5.6) | 1.5 ± 0.3; 1.5: (0.9–5.6) | 1.5 ± 0.3; 1.5: (0.9–5.6) | 1.5 ± 0.3; 1.5 (0.8–1.9) | 1. 0.1923 2. 0.4036 3. 0.2164 4. 0.2499 5. 0.7587 |
| (data on 239 cases) | (data on 420 cases) | (data on 344 cases) | (data on 327 cases) | (data on 93 cases) | ||
| Low (≤1.4) | 52 (21.7%) | 149 (35.4%) | 127 (36.9%) | 129 (39.8%) | 20 (20.8%) | |
| High (>1.4) | 187 (78.3%) | 271 (64.6%) | 217 (63.1%) | 198 (60.2%) | 73 (79.2%) | |
| Prostate volume (cc) | 51.5 ± 18.9; 46.0: (25–200) | 46.0 ± 18.7; 45.0: (14–104) | 42.8 ± 20.3; 45.0 (14–86) | 45.1 ± 20.2; 45.0 (14–104) | 50.0 ± 20.3; 45.0 (32–90) | 1. <0.0001 2. <0.0001 3. <0.0001 4. 0.4669 5. 0.0217 |
| total PSA (ng/mL) | 3.2 ± 12.5; 3.2: (0.2–7.3) | 13.3 ± 11.7; 4.6: (1.7–106.0) | 14.7 ± 11.8; 4.7 (1.7–86.0) | 9.3 ± 11.8; 4.7 (1.7–86.0) | 26.5 ± 11.9; 4.5 (0.2–106.0) | 1. <0.0001 2. <0.0001 3. <0.0001 4. <0.0001 5. <0.0001 |
| PSAD | 0.05 ± 0.03; 0.04: (0.004–0.09) | 0.36 ± 0.24; 0.08: (0.0025–2.2) | 0.34 ± 0.24; 0.08 (0.01–1.56) | 0.22 ± 0.24; 0.08 (0.01–1.56) | 0.54 ± 0.24; 0.08 (0.01–2.20) | 1. <0.0001 2. <0.0001 3. <0.0001 4. <0.0001 5. <0.0001 |
| mMR PIRADS score | \ | (data on 257) | (data on 194) | (data on 252) | 1. \ 2. \ 3. \ 4. \ 5. \ | |
| PIRADS 2 | 12 (4.5%) | 9 (4.7%) | 12 (4.8%) | - | ||
| PIRADS 3 | 36 (14.3%) | 24 (12.3%) | 35 (13.9%) | - | ||
| PIRADS 4 | 153 (59.0%) | 115 (59.3%) | 151 (59.9%) | - | ||
| PIRADS 5 | 56 (22.2%) | 46 (23.7%) | 54 (21.4%) | - | ||
| Prostate tumor size (mm) at MR | \ | 12.3 ± 4.8; 12.0: (4–35) | 12.7 ± 4.9; 12.0 (4–52) | 12.2 ± 4.9; 12.0 (4–35) | 15.8 ± 5.0; 12.0 (18–25) | 1. \ 2. \ 3. \ 4. \ 5. <0.0001 |
| Clinical T staging | \ | 1. \ 2. \ 3. \ 4. \ 5. <0.0001 | ||||
| T2 | 454 (86.5%) | 356 (83.6%) | 365 (88.1%) | 89 (80%) | ||
| T3a | 62 (11.8%) | 62 (14.6%) | 42 (9.9%) | 20 (20%) | ||
| T3b | 9 (12.7%) | 8 (1.8%) | 9 (2%) | 0 (0%) | ||
| Clinical N staging | \ | 1. \ 2. \ 3. \ 4. \ 5. <0.0001 | ||||
| N0 | 447 (85.1%) | 350 (82.1%) | 390 (94.2%) | 57 (51.7%) | ||
| N1 | 78 (14.9%) | 76 (17.9%) | 26 (5.8%) | 52 (48.3%) | ||
| M staging | \ | 1. \ 2. \ 3. \ 4. \ 5. <0.0001 | ||||
| M0 | 413 (78.6%) | 314 (73.7%) | 416 (100%) | 0 (0%) | ||
| M1 oligometastatic (<4) | 106 (20.2%) | 106 (24.8%) | 0 (0%) | 103 (94.6%) | ||
| M1 polimetastatic (≥4) | 6 (1.2%) | 6 (1.5%) | 0 (0%) | 6 (5.4%) | ||
| Biopsy outcomes | \ | 1. \ 2. \ 3. \ 4. \ 5. 0.0097 | ||||
| % positive samples PC | 35.4 ± 26.2; 28.0: (4.0–100.0) | 40.2 ± 26.3; 28.0: (4.0–100.0) | 34.4 ± 26.3; 28.0 (4.0–100.0) | 41.7 ± 26.3; 28.0 (50.0–100.0) | ||
| Max% PC tissue per core | 40.2 ± 25.8; 35.0: (2.0–94.0) | 43.9 ± 25.9; 35.0: (4.0–94.0) | 35.0 ± 25.9; 35.0: (2.0–94.0) | 63.2 ± 26.1; 35.0 (32.0–94.0) | ||
| ISUP grading at biopsy | \ | 1. \ 2. \ 3. \ 4. \ 5. 0.08 | ||||
| 1 | 98 (18.6%) | 0 (0%) | 98 (23.7%) | 0 (0%) | ||
| 2 | 171 (32.6%) | 170 (39.9%) | 170 (40.9%) | 1 (1.8%) | ||
| 3 | 107 (20.4%) | 107 (25.1%) | 77 (18.7%) | 30 (26.8%) | ||
| 4 | 113 (21.5%) | 113 (26.6%) | 46 (10.7%) | 67 (61.6%) | ||
| 5 | 36 (6.9%) | 36 (8.4%) | 25 (6%) | 11 (9.8%) | ||
| Risk Class (D’Amico) | \ | \ | ||||
| Low risk | 104 (19.8%) | 17 (3.9%) | 104 (25.2%) | - | ||
| Intermediate risk | 219 (41.8%) | 210 (49.3%) | 219 (52.8%) | - | ||
| High risk | 202 (38.4%) | 199 (46.8%) | 93 (22%) | - | ||
| Radical prostatectomy | \ | (Data on 371) | (Data on 281) | (Data on 371) | \ | \ |
| Laparoscopic | 223 (60.1%) | 166 (59%) | 223 (60.1%) | |||
| Robotic-assisted | 148 (39.9%) | 115 (41%) | 148 (39.9%) | |||
| Pathological stage (T) | \ | (Data on 371) | (Data on 281) | (Data on 371) | \ | \ |
| pT2 | 190 (51.2%) | 112 (39.9%) | 190 (51.2%) | |||
| pT3a | 141 (38%) | 130 (46.3%) | 141 (38%) | |||
| pT3b | 40 (10.8%) | 39 (13.8%) | 40 (10.8%) | |||
| pT4 | 0 (0%) | 0 (0%) | 0 (0%) | |||
| Pathological stage (N) | \ | \ | \ | |||
| N0 | 284 (94%) | 213 (92.2%) | 284 (94%) | |||
| N+ | 18 (6%) | 18 (1.8%) | 18 (6%) | |||
| ISUP grading at surgery | \ | (data on 371) | (data on 281) | (data on 371) | \ | \ |
| 1 | 64 (17.4%) | 4 (1.4%) | 64 (17.3%) | |||
| 2 | 163 (43.9%) | 140 (49.8%) | 163 (43.9%) | |||
| 3 | 85 (23%) | 79 (28.2%) | 85 (23%) | |||
| 4 | 23 (6.2%) | 23 (8.1%) | 23 (6.3%) | |||
| 5 | 36 (9.5%) | 35 (12.4%) | 36 (9.5%). | |||
| Surgical margin (R) | \ | \ | \ | |||
| Negative | 280 (78.2%) | 209 (74.3%) | 280 (78.2%) | |||
| Positive | 91 (21.8%) | 72 (25.7%) | 91 (21.8%) | |||
| PNI at surgery | \ | \ | \ | |||
| Positive | 258 (62.2%) | 213 (75.8%) | 258 (62.2%) | |||
| Negative | 113 (37.8%) | 68 (24.2%) | 113 (37.8%) | |||
| Cribriform/IDC at surgery | \ | \ | \ | |||
| Positive | 68 (16.4%) | 57 (20.2%) | 68 (16.5%) | |||
| Negative | 303 (83.6%) | 224 (79.8%) | 303 (83.5%) | |||
| Postoperative total PSA (ng/mL) | \ | 0.2 ± 0.9; 0.02: (0.01–10) | 0.2 ± 0.9; 0.02: (0.01–10) | 0.2 ± 0.9; 0.02: (0.01–10) | \ | \ |
| Biochemical progression (number of cases and %) | \ | 46 (12.3%) | 41 (14.5%) | 46 (12.3%) | \ | \ |
| Parameter | Low NLR (<2.5) | High NLR (≥2.5) | Low PLR (<120.0) | High PLR (≥120.0) | Low AGR (<1.4) | High AGR (≥1.4) | p Value 1. NLR 2. PLR 3. AGR |
|---|---|---|---|---|---|---|---|
| Number of cases | 586 | 328 | 482 | 429 | 201 | 458 | / |
| Age (years) | 66.1 ± 8.7 66.0 (40–89) | 66.8 ± 7.9 68.0 (44–85) | 66.2 ± 8.7 67.0 (40–89) | 66.4 ± 8.3 67.5 (23–85) | 67.9 ± 6.9 68.4 (48.84) | 65.7 ± 8.4 67.3 (23–87) | 1. 0.2347 2. 0.7246 3. 0.0856 |
| BMI | 25.7 ± 3.4 26.4 (16.9–45.6) | 25.5 ± 2.9 25.4 (16.9–41.5) | 25.9 ± 3.6 25.5 (17.0–45.6) | 25.3 ± 2.8 25.2 (16.9–41.5) | 26.2 ± 3.7 25.6 (18.5–41.5) | 25.8 ± 3.0 25.5 (16.9–36.3) | 1. 0.3099 2. 0.0044 3. 0.1263 |
| Metabolic syndrome | 1. 0.522 2. 0.890 3. 0.350 | ||||||
| 0 (absent) | 432 (73.72%) | 237 (72.26%) | 346 (71.78%) | 320 (74.59%) | 127 (63.18%) | 326 (71.18%) | |
| 1 (mild) | 77 (13.14%) | 44 (13.41%) | 64 (13.28%) | 57 (13.29%) | 37 (18.41%) | 60 (13.10%) | |
| 2 (complete) | 77 (13.14%) | 47 (14.33%) | 72 (14.94%) | 52 (12.12%) | 37 (18.41%) | 72 (15.72%) | |
| Prostate volume (cc) | 50.0 ± 22.0 46 (14–274) | 47.9 ± 17.5 45 (14–165) | 50.5 ± 23.3 45 (14–274) | 47.8 ± 16.8 45 (14–165) | 49.9 ± 21.2 45 (15–165) | 50.0 ± 22.3 47 (14–274) | 1. 0.1304 2. 0.0515 3. 0.9228 |
| Total PSA (ng/mL) | 7.6 ± 11.3 4.2 (0.05–106.0) | 10.4 ± 12.8 5.8 (0.06–97.0) | 6.9 ± 10.7 3.9 (0.05–105.0) | 10.4 ± 12.9 6.0 (0.06–106.0) | 10.3 ± 10.9 6.8 (0.4–81.0) | 10.4 ± 13.7 6.0 (0.04–106.0) | 1. 0.0009 2.<0.0001 3. 0.8766 |
| PSAD | 0.15 ± 0.22 0.07 (0.001–2.21) | 0.23 ± 0.28 0.12 (0.001–2.06) | 0.14 ± 0.20 0.07 (0.001–1.69) | 0.24 ± 0.29 0.13 (0.001–2.21) | 0.23 ± 0.25 0.14 (0.01–1.69) | 0.22 ± 0.28 0.1 (0.001–2.21) | 1.<0.0001 2.<0.0001 3. 0.6631 |
| mMR PIRADS score | (data on 149) | (data on 88) | (data on 113) | (data on 124) | (data on 71) | (data on 129) | 1. 0.447 2. 0.891 3. 0.393 |
| PIRADS 2 | 9 (6.05%) | 4 (4.54%) | 5 (4.43%) | 8 (6.45%) | 2 (2.82%) | 7 (5.43%) | |
| PIRADS 3 | 23 (15.44%) | 11 (12.5%) | 20 (17.70%) | 14 (11.29%) | 10 (14.08%) | 19 (14.73%) | |
| PIRADS 4 | 84 (56.36%) | 56 (63.64%) | 61 (53.98%) | 79 (63.70%) | 45 (63.38%) | 72 (55.81%) | |
| PIRADS 5 | 33 (22.15%) | 17 (19.32%) | 27 (23.89%) | 23 (18.55%) | 14 (19.72%) | 31 (24.03%) | |
| Diagnosis | 1. 0.021 2. 0.034 3. 0.045 | ||||||
| BPH | 327 (55.8%) | 132 (40.2%) | 289 (59.9%) | 167 (38.9%) | 52 (25.8%) | 187 (40.8%) | |
| All PC | 259 (44.2%) | 196 (59.7%) | 193 (40%) | 262 (61.%) | 149 (74.1%) | 271 (59.1%) | |
| Clinical significant PC | 205 (34.9%) | 166 (50.6%) | 149 (30.9%) | 148 (34.5%) | 127 (63.1%) | 217 (47.3%) | |
| nmPC | 220 (37%) | 135 (41.1%) | 173 (35.8%) | 182 (41.7%) | 129 (61.1%) | 198 (42.5%) | |
| mPC | 39 (7.1%) | 61 (18.5%) | 20 (4.1%) | 80 (19.3%) | 20 (9.9%) | 73 (16.5%) |
| Parameter | Low NLR (<2.5) | High NLR (≥2.5) | Low PLR (<120.0) | High PLR (≥120.0) | Low AGR (<1.4) | High AGR (≥1.4) | p Value 1. NLR 2. PLR 3. AGR |
|---|---|---|---|---|---|---|---|
| Number of cases with available ratios | 220 (62.0%) | 135 (38.0%) | 173 (67.8%) | 182 (32.2%) | 129 (39.4%) | 198 (61.6%) | / |
| Age (years) | 64.7 ± 8.7; 66.0: (40–87) | 64.9 ± 6.6 66.0: (44–78) | 65.9 ± 6.7 66.0: (47–87) | 64.0 ± 6.9 65.0: (40–78) | 66.2 ± 6.2 67.0: (48–84) | 64.4 ± 6.7 65.0: (47–81) | 1. 0.836 2. 0.010 3. 0.014 |
| Total PSA (ng/mL) | 10.1 ± 9.1; 4.3: (1.7–86.0) | 8.1 ± 4.7 7.0:(0.06–30.0) | 10.4 ± 10.3 7.4: (0.05–86.0) | 8.5 ± 6.3 7.0: (0.06–58.0) | 9.3 ± 6.7 7.7: (1.7–48.0) | 10.0 ± 10.5 7.1: (0.04–86.0) | 1. 0.022 2. 0.031 3. 0.471 |
| PSAD | 0.23 ± 0.18; 0.07: (0.02–1.56) | 0.22 ± 0.19 0.16: (0.01–1.48) | 0.23 ± 0.24 0.08: (0.01–1.56) | 0.35 ± 0.24 0.08: (0.01–2.20) | 0.24 ± 0.20 0.08: (0.04–1.48) | 0.23 ± 0.24 0.08: (0.01–1.56) | 1. 0.619 2.<0.0001 3. 0.694 |
| mMR PIRADS score | Data on 141 cases | Data on 85 cases | Data on 107 cases | Data on 111 cases | Data on 69 cases | Data on 129 cases | 1. 0.787 2. 0.256 3. 0.394 |
| PIRADS 2 | 7 (5%) | 3 (3%) | 3 (3%) | 6 (5%) | 1 (1%) | 7 (5%) | |
| PIRADS 3 | 20 (14%) | 11 (13%) | 18 (17%) | 11 (10%) | 10(15%) | 19 (15%) | |
| PIRADS 4 | 82 (58%) | 55 (65%) | 60 (56%) | 72 (65%) | 45(65%) | 72 (56%) | |
| PIRADS 5 | 32 (23%) | 16 (19%) | 26 (24%) | 22 (20%) | 13(19%) | 31 (24%) | |
| Prostate tumor size (mm) at mMR | 12.6 ± 5.0; 12.0: (5.0–26.0) | 12.8 ± 5.6 12: (4.0–35.0) | 13.52 ± 6.12 12: (4.0–38.0) | 13.22 ± 5.95 12: (4.0–47.0) | 12.06 ± 5.0 12: (4.0–38.0) | 13.64 ± 6.10 12.0: (4.0–47.0) | 1. 0.727 2. 0.639 3. 0.214 |
| Clinical T staging | 1. 0.871 2. 0.477 3. 0.349 | ||||||
| T2 | 196 (89%) | 118 (87%) | 153 (88%) | 161 (88%) | 116 (90%) | 171 (86%) | |
| T3a | 19 (9%) | 13 (10%) | 14 (8%) | 18 (10%) | 12 (9%) | 21 (11%) | |
| T3b | 5 (2%) | 4 (3%) | 6 (4%) | 3 (2%) | 1 (1%) | 6 (3%) | |
| Clinical N staging | 1. 0.357 2. 0.916 3. 0.600 | ||||||
| N0 | 205 (93%) | 129 (96%) | 163 (94%) | 171 (94%) | 120 (93%) | 187 (94%) | |
| N1 | 15 (7%) | 6 (4%) | 10 (6%) | 11 (6%) | 9 (7%) | 11 (6%) | |
| Biopsy outcomes | |||||||
| % positive samples PC | 39.7 ± 25.9; 28.0: (12.0–100.0) | 30.4 ± 23.9; 28.0: (4.0–87.0) | 30.1 ± 19.2; 25: (12.0–100.0) | 41.4 ± 30.7; 32.5: (4.0–100.0) | 30.2 ± 23.2; 25.0: (4.0–95.0) | 35.3 ± 24.8; 32.0 (4.0–100.0) | 1. 0.0008 2.<0.0001 3. 0.062 |
| Max% PC tissue per core | 36.9 ± 24.3; 32.0: (2.0–94.0) | 34.8 ± 24.0; 30.0: (4.0–90.0) | 36.3 ± 20.2; 33.0; (4.0–83.0) | 35.8 ± 25.4; 32.0: (2.0–94.0) | 31.5 ± 20.2; 25.2: (4.0–77.0) | 38.8 ± 23.5; 35.0: (4.0–94.0) | 1. 0.427 2. 0.809 3. 0.004 |
| ISUP grading at biopsy | 1. 0.621 2. 0.549 3. 0.140 | ||||||
| 1 | 54 (24%) | 29 (22%) | 44 (25%) | 39 (21%) | 21 (16%) | 54 (27%) | |
| 2 | 95 (43%) | 53 (39%) | 75 (43%) | 73 (40%) | 59 (46%) | 72 (36%) | |
| 3 | 37 (17%) | 31 (23%) | 31 (18%) | 37 (20%) | 26 (20%) | 38 (19%) | |
| 4 | 24 (11%) | 14 (10%) | 17 (10%) | 21 (12%) | 14 (11%) | 25 (13%) | |
| 5 | 10 (5%) | 8 (6%) | 6 (4%) | 12 (7%) | 9 (7%) | 9 (5%) | |
| Risk Class (D’Amico) | 1. 0.980 2. 0.917 3. 0.354 | ||||||
| Low risk | 54 (24%) | 32 (24%) | 42 (24%) | 44 (24%) | 24 (19%) | 50 (25%) | |
| Intermediate risk | 120 (55%) | 74 (55%) | 96 (56%) | 98 (54%) | 75 (58%) | 103 (52%) | |
| High risk | 46 (21%) | 29 (21%) | 35 (20%) | 40 (22%) | 30 (23%) | 45 (23%) | |
| Radical prostatectomy | Data on 203 cases | Data on 124 cases | Data on 154 cases | Data on 173 cases | Data on 120 cases | Data on 187 cases | 1. 0.696 2. 0.875 3. 0.0001 |
| Laparoscopic | 120 (59%) | 76 (61%) | 93 (60%) | 103 (60%) | 91 (76%) | 101 (54%) | |
| Robotic-assisted | 83 (41%) | 48 (39%) | 61 (40%) | 70 (40%) | 29 (24%) | 86 (46%) | |
| Pathological stage (T) | 1. 0.690 2. 0.532 3. 0.417 | ||||||
| pT2 | 101 (50%) | 59 (48%) | 75 (49%) | 85 (49%) | 54 (45%) | 95 (51%) | |
| pT3a | 82 (40%) | 49 (39%) | 59 (38%) | 72 (42%) | 54 (45%) | 70 (37%) | |
| pT3b | 20 (10%) | 16 (13%) | 20 (13%) | 16 (9%) | 12 (10%) | 22 (12%) | |
| Pathological stage (N) | 1. 0.457 2. 0.997 3. 0.985 | ||||||
| N0 | 191 (94%) | 119 (96%) | 146 (95%) | 164 (95%) | 113 (94%) | 176 (94%) | |
| N+ | 12 (6%) | 5 (4%) | 8 (5%) | 9 (5%) | 7 (6%) | 11 (6%) | |
| ISUP grading at surgery | 1. 0.103 2. 0.916 3. 0.186 | ||||||
| 1 | 37 (18%) | 19 (15%) | 29 (19%) | 27 (16%) | 16 (13%) | 37 (20%) | |
| 2 | 95 (47%) | 50 (40%) | 69 (45%) | 76 (44%) | 56 (47%) | 77 (41%) | |
| 3 | 39 (19%) | 37 (30%) | 33 (21%) | 43 (25%) | 26 (22%) | 43 (23%) | |
| 4 | 10 (5%) | 10 (8%) | 9 (6%) | 11 (6%) | 6 (5%) | 16 (9%) | |
| 5 | 22 (11%) | 8 (7%) | 14 (9%) | 16 (9%) | 16 (13%) | 14 (7%) | |
| Surgical margin (R) | 1. 0.841 2. 0.131 3. 0.890 | ||||||
| Negative | 151 (74%) | 91 (73%) | 108 (70%) | 134 (77%) | 89 (74%) | 140 (75%) | |
| Positive | 52 (26%) | 33 (27%) | 46 (30%) | 39 (23%) | 31 (26%) | 47 (25%) | |
| PNI at surgery | 1. 0.012 2. 0.365 3. 0.049 | ||||||
| Positive | 136 (67%) | 99 (80%) | 107 (69%) | 128 (74%) | 91 (76%) | 122 (65%) | |
| Negative | 67 (33%) | 25 (20%) | 47 (31%) | 45 (26%) | 29 (24%) | 65 (35%) | |
| Cribriform/IDC at surgery | 1. 0.740 2. 0.836 3. 0.445 | ||||||
| Positive | 39 (19%) | 22 (18%) | 28 (18%) | 33 (19%) | 24 (20%) | 31 (17%) | |
| Negative | 164 (81%) | 102 (82%) | 126 (82%) | 140 (81%) | 96 (80%) | 156 (83%) | |
| Postoperative total PSA (ng/mL) | 0.21 ± 0.96; 0.02: (0.01–10) | 0.25 ± 0.87 0.03: (0.01–7) | 0.28 ± 1.22 0.02: (0.01–10) | 0.17 ± 0.47 0.03: (0.01–2.9) | 0.13 ± 0.34 0.03: (0.01–2.34) | 0.29 ± 1.20 0.02: (0.01–10.0) | 1. 0.705 2. 0.273 3. 0.155 |
| Biochemical progression (number of cases and %) | 22 (11%) | 18 (15%) | 20 (13%) | 20 (12%) | 18 (15%) | 19 (10%) | 1. 0.247 2. 0.645 3. 0.172 |
| PC Cases Submitted to RP | NLR Pre-RP | NLR Ratio Post-RP | PLR Pre-RP | PLR Post-RP | AGR Pre-RP | AGR Post-RP | p Value 1. NLR 2. PLR 3. AGR |
|---|---|---|---|---|---|---|---|
| All cases (371) | 2.47 ± 1.15; 2.18: (0.09–9.60) | 10.77 ± 6.93; 13.19: (1.08–26.90) | 128.04 ± 49.29; 116.31: (1.92–439.09) | 107.75 ± 62.07; 83.7: (33.13–330.0) | 1.50 ± 0.28; 1.50: (0.92–5.60) | 1.65 ± 0.20; 1.70: (1.13–2.10) | 1. <0.0001 2. <0.0001 3. <0.0001 |
| pT2 (190) | 2.52 ± 1.15; 2.18: (1.07–9.60) | 11.82 ± 6.98; 13.47: (1.08–26.95) | 128.81 ± 49.32; 116.31: (53.68–300.0) | 102.61 ± 61.83; 83.70: (46.90–261.90) | 1.49 ± 0.28; 1.50: (0.92–2.11) | 1.59 ± 0.20; 1.70: (1.16–2.0) | 1. <0.0001 2. <0.0001 3. 0.0001 |
| pT3 (181) | 2.41 ± 1.15; 2.18: (30.09–6.11) | 9.0 ± 6.93; 13.19: (1.50–22.0) | 126.77 ± 49.26; 116.31: (1.92–439.09) | 113.20 ± 62.07; 83.76: (33.13–330.0) | 1.50 ± 0.28; 1.50: (0.98–5.60) | 1.63 ± 0.20; 1.7: (1.13–2.10) | 1. <0.0001 2. 0.0218 3. <0.0001 |
| ISUP 1–2 (227) | 2.48 ± 1.15; 2.18: (0.90–9.60) | 12.09 ± 6.98; 13.47: (1.08–26.90) | 126.79 ± 49.32; 116.31: (40.95–439.09) | 98.68 ± 61.83; 83.78: (46.90–261.90) | 1.49 ± 0.28; 1.50: (0.92–5.60) | 1.62 ± 0.18; 1.7: (1.50–2.0) | 1. <0.0001 2. <0.0001 3. <0.0001 |
| ISUP 3–5 (144) | 2.43 ± 1.15; 2.18: (0.09–5.78) | 8.69 ± 6.97; 13.16: (1.50–22.03) | 129.31 ± 49.26; 116.31: (33.13–330.0) | 118.82 ± 62.07; 83.74: (33.13–330.0) | 1.50 ± 0.28; 1.50: (0.98–2.19) | 1.60 ± 0.20; 1.7: (1.13–2.10) | 1. <0.0001 2. 0.1133 3. 0.0006 |
| Low risk (90) | 2.73 ± 1.15; 2.18: (1.24–9.60) | 11.25 ± 6.95; 13.47: (1.47–26.95) | 128.21 ± 49.36; 116.31: (71.15–300.0) | 92.12 ± 62.90; 82.85: (33.13–228.86) | 1.46 ± 0.28; 1.50: (0.92–2.04) | 1.62 ± 0.20; 1.70: (1.60–2.10) | 1. <0.0001 2. <0.0001 3. <0.0001 |
| Intermediate risk (197) | 2.39 ± 1.17; 2.12: (0.77–7.45) | 10.03 ± 7.02; 13.19: (1.08–23.24) | 126.37 ± 49.68; 115: (40.95–439.09) | 117.10 ± 61.83; 83.78: (46.94–330.0) | 1.50 ± 0.28; 1.50: (0.98–5.60) | 1.54 ± 0.20; 1.70: (1.50–1.80) | 1. <0.0001 2. 0.1017 3. 0.1036 |
| High risk (84) | 2.32 ± 1.22; 2.09: (0.09–5.78) | 10.91 ± 7.04; 13.77: (1. 78–22.03) | 129.38 ± 50.16; 112.20: (1.92–371.0) | 100.20 ± 55.73; 82.85: (58.86–209.0) | 1.50 ± 0.29; 1.50: (0.98–2.19) | 1.56 ± 0.20; 1.70: (1.13–2.0) | 1. <0.0001 2. 0.0005 3. 0.1204 |
| Correlation | Coefficient | p Value |
|---|---|---|
| NLR–PLR | 0.590765385 | <0.0001 |
| NLR–AGR | −0.056808466 | 0.233 |
| PLR–AGR | −0.032381744 | 0.495 |
| NLR–age | −0.003393898 | 0.949 |
| NLR BMI | −0.043542716 | 0.360 |
| NLR metabolic syndrome | −0.011263298 | 0.814 |
| NLR–prostate volume | 0.012090362 | 0.798 |
| NLR–risk class | −0.031727259 | 0.509 |
| NLR–preoperative PSA | 0.060700932 | 0.196 |
| NLR–PSAD | 0.084847705 | 0.070 |
| NLR–PIRADS score | −0.019247647 | 0.686 |
| NLR–diagnosis PC | 0.119796458 | 0.000324 |
| NLR–prostate tumor size | −0.057921656 | 0.224 |
| NLR–percentage positive core at biopsy | −0.117607299 | 0.012 |
| NLR–T stage | −0.0530888 | 0.259 |
| NLR–N stage | −0.045416757 | 0.338 |
| NLR–M stage | 0.089695182 | 0.056 |
| NLR–ISUP grading | 0.022020966 | 0.639 |
| NLR–surgical margins | −0.013402868 | 0.782 |
| NLR–PNI | 0.065605296 | 0.162 |
| NLR–cribriform/IDC | −0.041355254 | 0.382 |
| NLR–postoperative PSA | 0.00894501 | 0.849 |
| NLR–biochemical progression | −0.009564575 | 0.848 |
| PLR–age | −0.041847787 | 0.388 |
| PLR–BMI | −0.095185293 | 0.045 |
| PLR–metabolic syndrome | −0.045276738 | 0.344 |
| PLR–prostate volume | −0.0306643 | 0.528 |
| PLR–risk class | 0.12076586 | 0.010 |
| PLR–preoperative PSA | 0.112118686 | 0.018 |
| PLR–PSAD | 0.138732191 | 0.003 |
| PLR–PIRADS score | −0.006489868 | 0.899 |
| PLR–diagnosis PC | 0.16085218 | <0.0001 |
| PLR–prostate tumor size | −0.055344287 | 0.247 |
| PLR–percentage positive core at biopsy | 0.153215834 | 0.0012 |
| PLR–T stage | −0.0143615 | 0.768 |
| PLR–N stage | −0.022325927 | 0.643 |
| PLR–M stage | 0.186703018 | 0.000076 |
| PLR–ISUP grading | 0.00920659 | 0.846 |
| PLR–surgical margins | −0.031205866 | 0.514 |
| PLR–PNI | 0.078362099 | 0.099 |
| PLR–cribriform/IDC | −0.018649791 | 0.705 |
| PLR–postoperative PSA | −0.004990327 | 0.933 |
| PLR–biochemical progression | −0.001641053 | 0.983 |
| AGR–age | −0.189983803 | 0.000096 |
| AGR–BMI | −0.039096382 | 0.424 |
| AGR–metabolic syndrome | −0.054469657 | 0.268 |
| AGR–prostate volume | −0.031335926 | 0.525 |
| AGR–risk class | 0.025717996 | 0.599 |
| AGR–preoperative PSA | −0.039384808 | 0.424 |
| AGR–PSAD | −0.046284517 | 0.346 |
| AGR–PIRADS score | 0.001454159 | 0.977 |
| AGR–diagnosis PC | −0.051833904 | 0.195 |
| AGR–prostate tumor size | 0.070965303 | 0.146 |
| AGR–percentage positive core at biopsy | −0.117692213 | 0.016 |
| AGR–T stage | 0.041302814 | 0.397 |
| AGR–N stage | 0.026190226 | 0.593 |
| AGR–M stage | −0.023100814 | 0.637 |
| AGR–ISUP grading | 0.013429298 | 0.783 |
| AGR–Risk classes | 0.025717996 | 0.599 |
| AGR–surgical margins | −0.027616388 | 0.580 |
| AGR–PNI | −0.056143388 | 0.251 |
| AGR–cribriform/IDC | −0.050339474 | 0.306 |
| AGR–postoperative PSA | 0.05732158 | 0.240 |
| AGR–biochemical progression | −0.020713105 | 0.682 |
| Sensitivity (CI 95% Range) | Specificity (CI 95% Range) | PPV (CI 95% Range) | NPV (CI 95% Range) | Accuracy | AUC (CI 95% Range) | |
|---|---|---|---|---|---|---|
| A | ||||||
| NLR ≥ 2.5 | 0.000 (0.000–0.033) | 1.000 (0.891–1.000) | 0.000 | 0.220 | 0.220 | 0.402 (0.307–0.497) |
| PLR ≥ 120.0 | 0.848 (0.777–0.899) | 0.256 (0.145–0.413) | 0.801 | 0.323 | 0.718 | 0.493 (0.388–0.599) |
| AGR ≤ 1.4 | 0.087 (0.061–0.122) | 0.974 (0.902–0.998) | 0.938 | 0.190 | 0.247 | 0.458 (0.388–0.528) |
| B | ||||||
| NLR ≥ 2.5 | 0.500 (0.217–0.783) | 0.922 (0.896–0.942) | 0.085 | 0.992 | 0.916 | 0.616 (0.332–0.900) |
| PLR ≥ 120.0 | 0.625 (0.304–0.862) | 0.815 (0.781–0.846) | 0.047 | 0.993 | 0.813 | 0.669 (0.429–0.908) |
| AGR ≤ 1.4 | 0.785 (0.690–0.857) | 0.321 (0.284–0.361) | 0.159 | 0.901 | 0.386 | 0.492 (0.436–0.548) |
| C | ||||||
| NLR ≥ 2.5 | 0.574 (0.455–0.684) | 0.581 (0.467–0.687) | 0.557 | 0.597 | 0.577 | 0.483 (0.386–0.580) |
| PLR ≥ 120.0 | 0.471 (0.357–0.588) | 0.622 (0.507–0.723) | 0.533 | 0.561 | 0.549 | 0.493 (0.397–0.589) |
| AGR ≤ 1.4 | 0.201 (0.146–0.271) | 0.880 (0.817–0.923) | 0.640 | 0.510 | 0.531 | 0.485 (0.420–0.549) |
| D | ||||||
| NLR ≥ 2.5 | 0.574 (0.455–0.684) | 0.581 (0.467–0.687) | 0.557 | 0.597 | 0.577 | 0.483 (0.386–0.580) |
| PLR ≥ 120.0 | 0.471 (0.357–0.588) | 0.622 (0.507–0.723) | 0.533 | 0.561 | 0.549 | 0.493 (0.397–0.589) |
| AGR ≤ 1.4 | 0.199 (0.144–0.268) | 0.881 (0.818–0.924) | 0.640 | 0.508 | 0.529 | 0.485 (0.421–0.549) |
| E | ||||||
| NLR ≥ 2.5 | 0.727 (0.428–0.905) | 0.539 (0.463–0.614) | 0.095 | 0.967 | 0.551 | 0.620 (0.447–0.792) |
| PLR ≥ 120.0 | 0.455 (0.214–0.719) | 0.873 (0.812–0.916) | 0.192 | 0.960 | 0.847 | 0.604 (0.395–0.814) |
| AGR ≤ 1.4 | 0.231 (0.125–0.386) | 0.869 (0.832–0.900) | 0.153 | 0.917 | 0.810 | 0.479 (0.373–0.584) |
| A | |||||||||
| Univariable | |||||||||
| OR | 95% CI_Lower | 95% CI_Upper | p-Value | ||||||
| Preoperative PSA (ng/mL) | <4 | Ref | - | - | - | ||||
| >4 | 0.808 | 0.367 | 1.782 | 0.598 | |||||
| PIRADS score | 1–3 | Ref | - | - | - | ||||
| 4–5 | 1.458 | 0.722 | 2.942 | 0.293 | |||||
| NLR | <2.5 | Ref | - | - | - | ||||
| ≥2.5 | 1.545 | 0.943 | 2.532 | 0.084 | |||||
| PLR | <120 | Ref | - | - | - | ||||
| ≥120.0 | 1.646 | 1.023 | 2.649 | 0.040 | |||||
| AGR | >1.4 | Ref | - | - | - | ||||
| ≤1.4 variabile categorica | 1.466 | 0.853 | 2.519 | 0.166 | |||||
| B | |||||||||
| Univariable | Multivariable | ||||||||
| OR | 95% CI_Lower | 95% CI_Upper | p-Value | OR | 95% CI_Lower | 95% CI_Upper | p-Value | ||
| Preoperative PSA (ng/mL) | <4 | Ref | _ | _ | _ | ||||
| >4 | 1.411 | 0.642 | 3.102 | 0.391 | 1.135 | 1.097 | 1.174 | <0.0001 | |
| PIRADS score | 1–3 | Ref | _ | _ | _ | ||||
| 4–5 | 1.712 | 0.085 | 34.589 | 0.726 | |||||
| NLR | <2.5 | Ref | _ | _ | _ | ||||
| ≥2.5 | 3.204 | 2.089 | 4.914 | <0.0001 | 2.241 | 0.946 | 5.311 | 0.067 | |
| PLR | <120 | Ref | _ | _ | _ | ||||
| ≥120.0 | 5.295 | 3.182 | 8.812 | <0.0001 | 2.717 | 1.010 | 7.307 | 0.048 | |
| AGR | >1.4 | Ref | _ | _ | _ | ||||
| ≤1.4 | 0.575 | 0.340 | 0.972 | 0.039 | 0.414 | 0.190 | 0.901 | 0.026 | |
| T stage | T1–2 | Ref | _ | _ | _ | ||||
| T3 | 1.613 | 0.915 | 2.842 | 0.098 | |||||
| ISUP grading | 1–2 | Ref | _ | _ | _ | ||||
| 3–5 | 68.416 | 4.155 | 1126.443 | 0.003 | 3.339 | 2.222 | 5.017 | <0.0001 | |
| C | |||||||||
| Univariable | |||||||||
| OR | 95% CI_Lower | 95% CI_Upper | p-Value | ||||||
| Preoperative PSA (ng/mL) | <4 | Ref | _ | _ | _ | ||||
| >4 | 1.574 | 0.741 | 3.343 | 0.238 | |||||
| PIRADS score | 1–3 | Ref | _ | _ | _ | ||||
| 4–5 variabile categorica | - | - | - | - | |||||
| NLR | <2.5 | Ref | _ | _ | _ | ||||
| ≥2.5 | 1.062 | 0.680 | 1.659 | 0.790 | |||||
| PLR | <120 | Ref | _ | _ | _ | ||||
| ≥120.0 | 0.959 | 0.622 | 1.479 | 0.851 | |||||
| AGR | >1.4 | Ref | _ | _ | _ | ||||
| ≤1.4 | 1.209 | 0.767 | 1.906 | 0.414 | |||||
| T stage | T1–2 | Ref | _ | _ | _ | ||||
| T3 variabile categorica | - | - | - | - | |||||
| ISUP grading | 1–2 | Ref | _ | _ | _ | ||||
| 3–5 | 9.836 | 5.122 | 18.890 | <0.0001 | |||||
| D | |||||||||
| Univariable | |||||||||
| OR | 95% CI_Lower | 95% CI_Upper | p-Value | ||||||
| Preoperative PSA (ng/mL) | <4 | Ref | _ | _ | _ | ||||
| >4 | 0.810 | 0.390 | 1.683 | 0.572 | |||||
| PIRADS score | 1–3 | Ref | _ | _ | _ | ||||
| 4–5 variabile categorica | 1.225 | 0.605 | 2.478 | 0.573 | |||||
| NLR | <2.5 | Ref | _ | _ | _ | ||||
| ≥2.5 | 1.482 | 0.938 | 2.340 | 0.092 | |||||
| PLR | <120 | Ref | _ | _ | _ | ||||
| ≥120.0 | 1.189 | 0.760 | 1.860 | 0.447 | |||||
| AGR | >1.4 | Ref | _ | _ | _ | ||||
| ≤1.4 | 0.977 | 0.613 | 1.557 | 0.923 | |||||
| T stage | T1–2 | Ref | _ | _ | _ | ||||
| T3 | 8.599 | 5.278 | 14.009 | <0.0001 | |||||
| ISUP grading | 1–2 | Ref | _ | _ | _ | ||||
| 3–5 | - | - | - | - | |||||
| E | |||||||||
| Univariable | |||||||||
| OR | 95% CI_Lower | 95% CI_Upper | p-Value | ||||||
| Preoperative PSA (ng/mL) | <4 | Ref | _ | _ | _ | ||||
| >4 | 1.276 | 0.371 | 4.384 | 0.699 | |||||
| PIRADS score | 1–3 | Ref | _ | _ | _ | ||||
| 4–5 | 0.958 | 0.306 | 3.002 | 0.942 | |||||
| NLR | <2.5 | Ref | _ | _ | _ | ||||
| ≥2.5 | 1.156 | 0.607 | 2.202 | 0.658 | |||||
| PLR | <120 | Ref | _ | _ | _ | ||||
| ≥120.0 | 0.754 | 0.396 | 1.433 | 0.389 | |||||
| AGR | >1.4 | Ref | _ | _ | _ | ||||
| ≤1.4 | 1.611 | 0.830 | 3.129 | 0.159 | |||||
| T stage | T1–2 | Ref | _ | _ | _ | ||||
| T3 | 3.709 | 1.817 | 7.571 | 0.0001 | |||||
| ISUP grading | 1–2 | Ref | _ | _ | _ | ||||
| 3–5 | 1.851 | 1.431 | 2.394 | < 0.0001 | |||||
Publisher’s Note: MDPI stays neutral with regard to jurisdictional claims in published maps and institutional affiliations. |
© 2022 by the authors. Licensee MDPI, Basel, Switzerland. This article is an open access article distributed under the terms and conditions of the Creative Commons Attribution (CC BY) license (https://creativecommons.org/licenses/by/4.0/).
Share and Cite
Salciccia, S.; Frisenda, M.; Bevilacqua, G.; Viscuso, P.; Casale, P.; De Berardinis, E.; Di Pierro, G.B.; Cattarino, S.; Giorgino, G.; Rosati, D.; et al. Comparative Prospective and Longitudinal Analysis on the Platelet-to-Lymphocyte, Neutrophil-to-Lymphocyte, and Albumin-to-Globulin Ratio in Patients with Non-Metastatic and Metastatic Prostate Cancer. Curr. Oncol. 2022, 29, 9474-9500. https://doi.org/10.3390/curroncol29120745
Salciccia S, Frisenda M, Bevilacqua G, Viscuso P, Casale P, De Berardinis E, Di Pierro GB, Cattarino S, Giorgino G, Rosati D, et al. Comparative Prospective and Longitudinal Analysis on the Platelet-to-Lymphocyte, Neutrophil-to-Lymphocyte, and Albumin-to-Globulin Ratio in Patients with Non-Metastatic and Metastatic Prostate Cancer. Current Oncology. 2022; 29(12):9474-9500. https://doi.org/10.3390/curroncol29120745
Chicago/Turabian StyleSalciccia, Stefano, Marco Frisenda, Giulio Bevilacqua, Pietro Viscuso, Paolo Casale, Ettore De Berardinis, Giovanni Battista Di Pierro, Susanna Cattarino, Gloria Giorgino, Davide Rosati, and et al. 2022. "Comparative Prospective and Longitudinal Analysis on the Platelet-to-Lymphocyte, Neutrophil-to-Lymphocyte, and Albumin-to-Globulin Ratio in Patients with Non-Metastatic and Metastatic Prostate Cancer" Current Oncology 29, no. 12: 9474-9500. https://doi.org/10.3390/curroncol29120745