Article

Dietary Alaska Pollack Protein Induces Acute Skeletal Muscle Hypertrophy in Rats, Regardless of Specific Amino Acid and Amino Acid Balance of Diet

1
Food and Health Sciences Research Centre, Graduate School of Agriculture, Ehime University, Matsuyama 890-8577, Japan
2
Food Function R&D Center, Nissui Corporation, Tokyo 105-8676, Japan
3
Laboratory of Nutrition Science, Division of Applied Bioscience, Graduate School of Agriculture, Ehime University, Matsuyama 890-8577, Japan
4
Department of Applied Biological Chemistry, School of Agriculture, Utsunomiya University, 350 Minemachi, Utsunomiya, Tochigi 321-8585, Japan
5
Laboratory of Food Chemistry, Yokohama University of Pharmacy, Yokohama 245-0066, Japan
6
Graduate School of Agricultural and Life Sciences, The University of Tokyo, Tokyo 113-8656, Japan
*
Author to whom correspondence should be addressed.
These authors contributed equally to this work.
Nutraceuticals 2023, 3(4), 513-528; https://doi.org/10.3390/nutraceuticals3040037
Submission received: 4 August 2023 / Revised: 14 September 2023 / Accepted: 18 September 2023 / Published: 20 October 2023

Abstract

:
In previous studies, Alaska pollack protein intake induced acute and sustainable skeletal muscle hypertrophy in rats. The present study used 5-week-old male Sprague–Dawley rats to investigate whether a specific amino acid or amino acid composition is related to Alaska pollack protein-induced skeletal muscle hypertrophy. The results suggest that dietary Alaska pollack protein increases the gastrocnemius muscle mass, regardless of specific amino acids including arginine and leucine, which are suggested to increase skeletal muscle mass and amino acid balance in the diet. The oral administration of 333 mg/kg/day Alaska pollack protein significantly increased gastrocnemius muscle weight compared with the oral administration of casein. In this case, the amino acid intake was expected to be almost the same as in the casein group because Alaska pollack protein made up approximately 1/60 of the protein consumed per day. The specific protein or the specific hydrolyzed peptides from Alaska pollack protein or other minor components in Alaska pollack protein may be responsible for gastrocnemius muscle weight hypertrophy.

Graphical Abstract

1. Introduction

Skeletal muscle is the most abundant tissue in the human body, accounting for 30–40% of adult body weight. It performs a wide variety of physiological functions; thus, maintaining skeletal muscle mass throughout the lifespan is critical for the preservation of independent locomotion and metabolic health [1,2]. Any increase in mechanical loading induces skeletal muscle hypertrophy, whereas unloading induces atrophy [3]. Therefore, resistance exercise is the preferred stimulus for maintaining muscle mass. Furthermore, improving mechanical loading and food components can be beneficial for skeletal muscle mass [4,5,6,7,8,9]. In recent studies, fish has attracted attention as a food that contains various ingredients (such as omega-3 polyunsaturated fatty acids, proteins, vitamin D, magnesium, and carnitine) useful for muscle hypertrophy [10]. The present study is about the functionality of fish proteins.
Fish proteins are consumed worldwide. Fillets of Alaska pollack (Theragra chalcogramma) are popular in fish, fish and chips, and fish sandwich meals. Additionally, the surimi of Alaska pollack is utilized in processed seafoods such as imitation crab, kamaboko (Japanese fish cakes), and fish sausage. In some parts of Japan and South Korea, dried Alaska pollack is used as a hot-pot ingredient. Given the widespread use of fish proteins, the elucidation of the nutritional characteristics of Alaska pollack is important. In our previous studies, dietary Alaska pollack protein (APP) enhanced skeletal muscle hypertrophy in rats fed a high-fat diet and a normal diet after 2 days and 7 days, and 56 days of feeding [11,12,13].
After immobilization, dietary APP enhanced skeletal muscle recovery in immobilized limbs, but also hypertrophy in non-immobilized limbs after 21 days of feeding in rats fed a high-fat diet [14]. Dietary APP increased the fast-twitch and slow-twitch skeletal muscle fiber diameter in the gastrocnemius muscle of rats [15]. In the gastrocnemius muscle, the lateral head gastrocnemius muscle of the surface, composed of fast-twitch skeletal muscle only, increased 1.4-fold and the lateral head of the deep gastrocnemius muscle, which was composed of fast and slow-twitch skeletal muscle fibers, increased 1.2-fold. Therefore, dietary APP increases both types of skeletal muscle fibers and especially increases fast-twitch skeletal muscle fibers. In addition, our previous study showed that the gene expressions of Fbxo32/atrogin-1, Trim63/MuRF1, and Mstn/Myostatin, which are responsible for protein degradation by the ubiquitin proteasome system, were suppressed in the gastrocnemius muscle by dietary APP [13].
However, the ingredients involved in muscle hypertrophy in APP have not yet been investigated. Arginine is a conditionally essential amino acid that is required in the diet of rats for maximal growth rate. Arginine activates the mammalian target of rapamycin complex 1 (mTORC1) [16]. Dietary arginine supplementation shifts nutrient partitioning to promote muscle gain over fat gain in rats [17]. Although arginine is synthesized by the liver and kidney, this amino acid, in a manner similar to dietary essential amino acids, shows a decreased concentration in plasma or blood if omitted from the diet of rats [18]. APP contains a high level of arginine, twice that of casein (Cas-cont) [12]. Branched-chain amino acids (BCAAs), especially leucine, may promote skeletal muscle hypertrophy [19]. Leucine content is higher in whey protein, which is the key anabolic driver and induces skeletal muscle hypertrophy when combined with exercise in older men [20,21]. Leucine has been suggested to play an important role in stimulating postprandial muscle protein synthesis in rats [4,22]. Although APP contains similar or lower levels of leucine and other BCAA [12], the effect of dietary APP on serum BCAA concentrations and the relationship between serum BCAA concentrations and dietary-APP-induced skeletal muscle hypertrophy has not been examined. In the present study, we investigated whether specific amino acids and the balance of amino acids in APP are related to muscle hypertrophy. To clarify whether high levels of arginine in APP are responsible for gastrocnemius muscle hypertrophy, we compared the effect of casein, APP and casein supplemented with 0.44% arginine (Cas-Arg) on gastrocnemius muscle weight in Experiment (Exp.) 1. To clarify whether the amino acid composition of APP is responsible for gastrocnemius muscle hypertrophy, we investigated the effect of casein, APP, and an amino acid mixture, which had the same composition as APP (A-APP), on the gastrocnemius muscle weight and serum concentrations of amino acids in Exp. 2 and 3. The time lag in absorption between free and protein-derived amino acids may result in differences in metabolism and physiological utilization. To address this concern, we investigated the dose-dependent effects of APP on gastrocnemius muscle weight and serum concentrations of amino acids in Exp. 4. Because the results suggested the possibility that low serum proline concentration could be involved in gastrocnemius muscle hypertrophy, we investigated whether whey, soy protein isolate (SPI), and egg white protein (EWP), which contain proline at lower levels than Cas-cont but similar to APP, could induce gastrocnemius hypertrophy in Exp. 5. Furthermore, we investigated whether the oral administration of APP under a Cas-cont diet intake could be effective for gastrocnemius muscle hypertrophy in Exp. 6.

2. Materials and Methods

2.1. Protein Sources

APP was made from washed, freeze-dried, and ground Alaska pollack fillets (Nissui corporation, Tokyo, Japan). Amino acid mixture powder of A-APP was a mixture of 18 amino acids (FUJIFILM Wako Chemicals Co., Tokyo, Japan), similar to the composition of APP. Whey (lactcrystal, Nippon Shinyaku Co., Kyoto, Japan), SPI (Fujipro F, Fuji Oil Co., Osaka, Japan), and EWP (Daiichi Kasei Co., Kyoto, Japan) were purchased. Table 1 showed the crude protein, crude fat contents, and amino acid composition of each protein source. Cas-cont was chosen as the source of protein for the AIN-93G diet because its amino acid composition is reasonably adequate and formulated for the growth of experimental rodents as dietary standards for nutritional studies by the American Institute of Nutrition. Therefore, we used the AIN-93G diets based on casein as the control [23,24].

2.2. Animals and Experimental Design

Five-week-old male Sprague Dawley rats (SLC, Shizuoka, Japan) were used. The rats were housed in individual stainless wire mesh cages in a room under a 12 h light–dark cycle (dark phase: 15:00–3:00) at a constant temperature (22 ± 1 °C). The animals were housed separately for acclimatization to the environment for 5 days. During acclimatization, the rats were fed regular tap water and a Cas-cont diet ad libitum. The body weight and amount of food consumed were recorded every morning for each animal, and the food was replenished during the acclimatization and experimental periods. Table 2 presents the components of the AIN-93-based experimental diets after acclimatization in all Exp. Rats were anesthetized with isoflurane and decapitated following the experimental period, corresponding to a non-fasting state. Gastrocnemius muscles were collected. Blood samples were collected from necks. The sera were stored at −80 °C and −50 °C until analysis.
Exp. 1: After acclimatization, each group was fed the casein diet (Cas-cont group), the same diet in which the protein source was replaced with APP (APP group), or the same diet in which arginine was included at a ratio of 4.4 g/kg diet, replacing α-corn starch (Cas-Arg group) for 7 days. Each group included 10 rats.
Exp. 2: After acclimatization, each group was fed a casein diet or the same diet in which the protein source was replaced with APP or A-APP (Cas-cont, APP, and A-APP group) for 7 days. Each group included 10 rats.
Exp. 3: After acclimatization, each group was fed a casein diet or the same diet in which the protein source was replaced with APP or A-APP (Cas-cont, APP, and A-APP group) for 7 days. Each group included 10 rats.
Exp. 4: After acclimatization, each group was fed the casein diet or the same diet in which all protein, one-third or one-ninth sources were replaced with APP (Cas-cont, APP, 1/3 APP and 1/9 APP group, respectively), containing the same amount of crude protein, for 7 days. Each group included 10 rats.
Exp. 5: After acclimatization, each group was fed the Cas-cont diet or the same diet in which the protein source was replaced with APP, whey, SPI, or EWP diets, containing the same amount of crude protein, for 7 days. Each group included 10 rats.
Exp. 6: After acclimatization, all groups were fed a Cas-cont diet. Each group was orally administered 333 mg/kg Cas-cont (Cas 333 group), 333 mg/kg APP (APP 333 group), or saline once a day for 2 days. Each group included 10 rats.
The present study was conducted in March 2019 in accordance with the ethical guidelines of the Ehime University Animal Experimentation Committee (permit number 08A92 (2014–2018)) and in compliance with the National Institutes of Health Guide for the Care and Use of Laboratory Animals. All efforts were made to minimize the number of animals used and limit experimentation to what was necessary to produce reliable scientific information. In all Exp., no rat mortality was observed.

2.3. Amino Acids Analysis in the Rat Serum

The serum and homogenized gastrocnemius muscles were mixed with an equal amount of 6% 5-sulfosalicylic acid. The mixtures were cooled on ice for 15 min and centrifuged at 16,000× g for 15 min to remove proteins. The supernatant was filtered through a 0.45 μm membrane filter and then through a 0.20 μm membrane filter (Dismic; Advantec, Japan). The free amino acid compositions of the fractions were measured using an automatic amino acid analyzer (Hitachi L-8900BF, Hitachi, Tokyo, Japan), following the manufacturer’s instructions.

2.4. Statistical Analysis
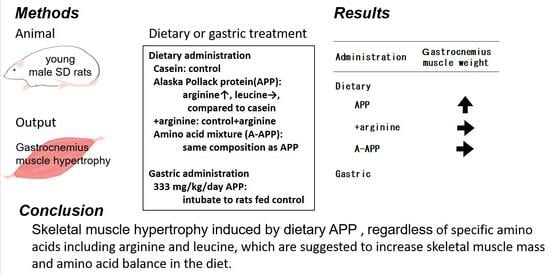
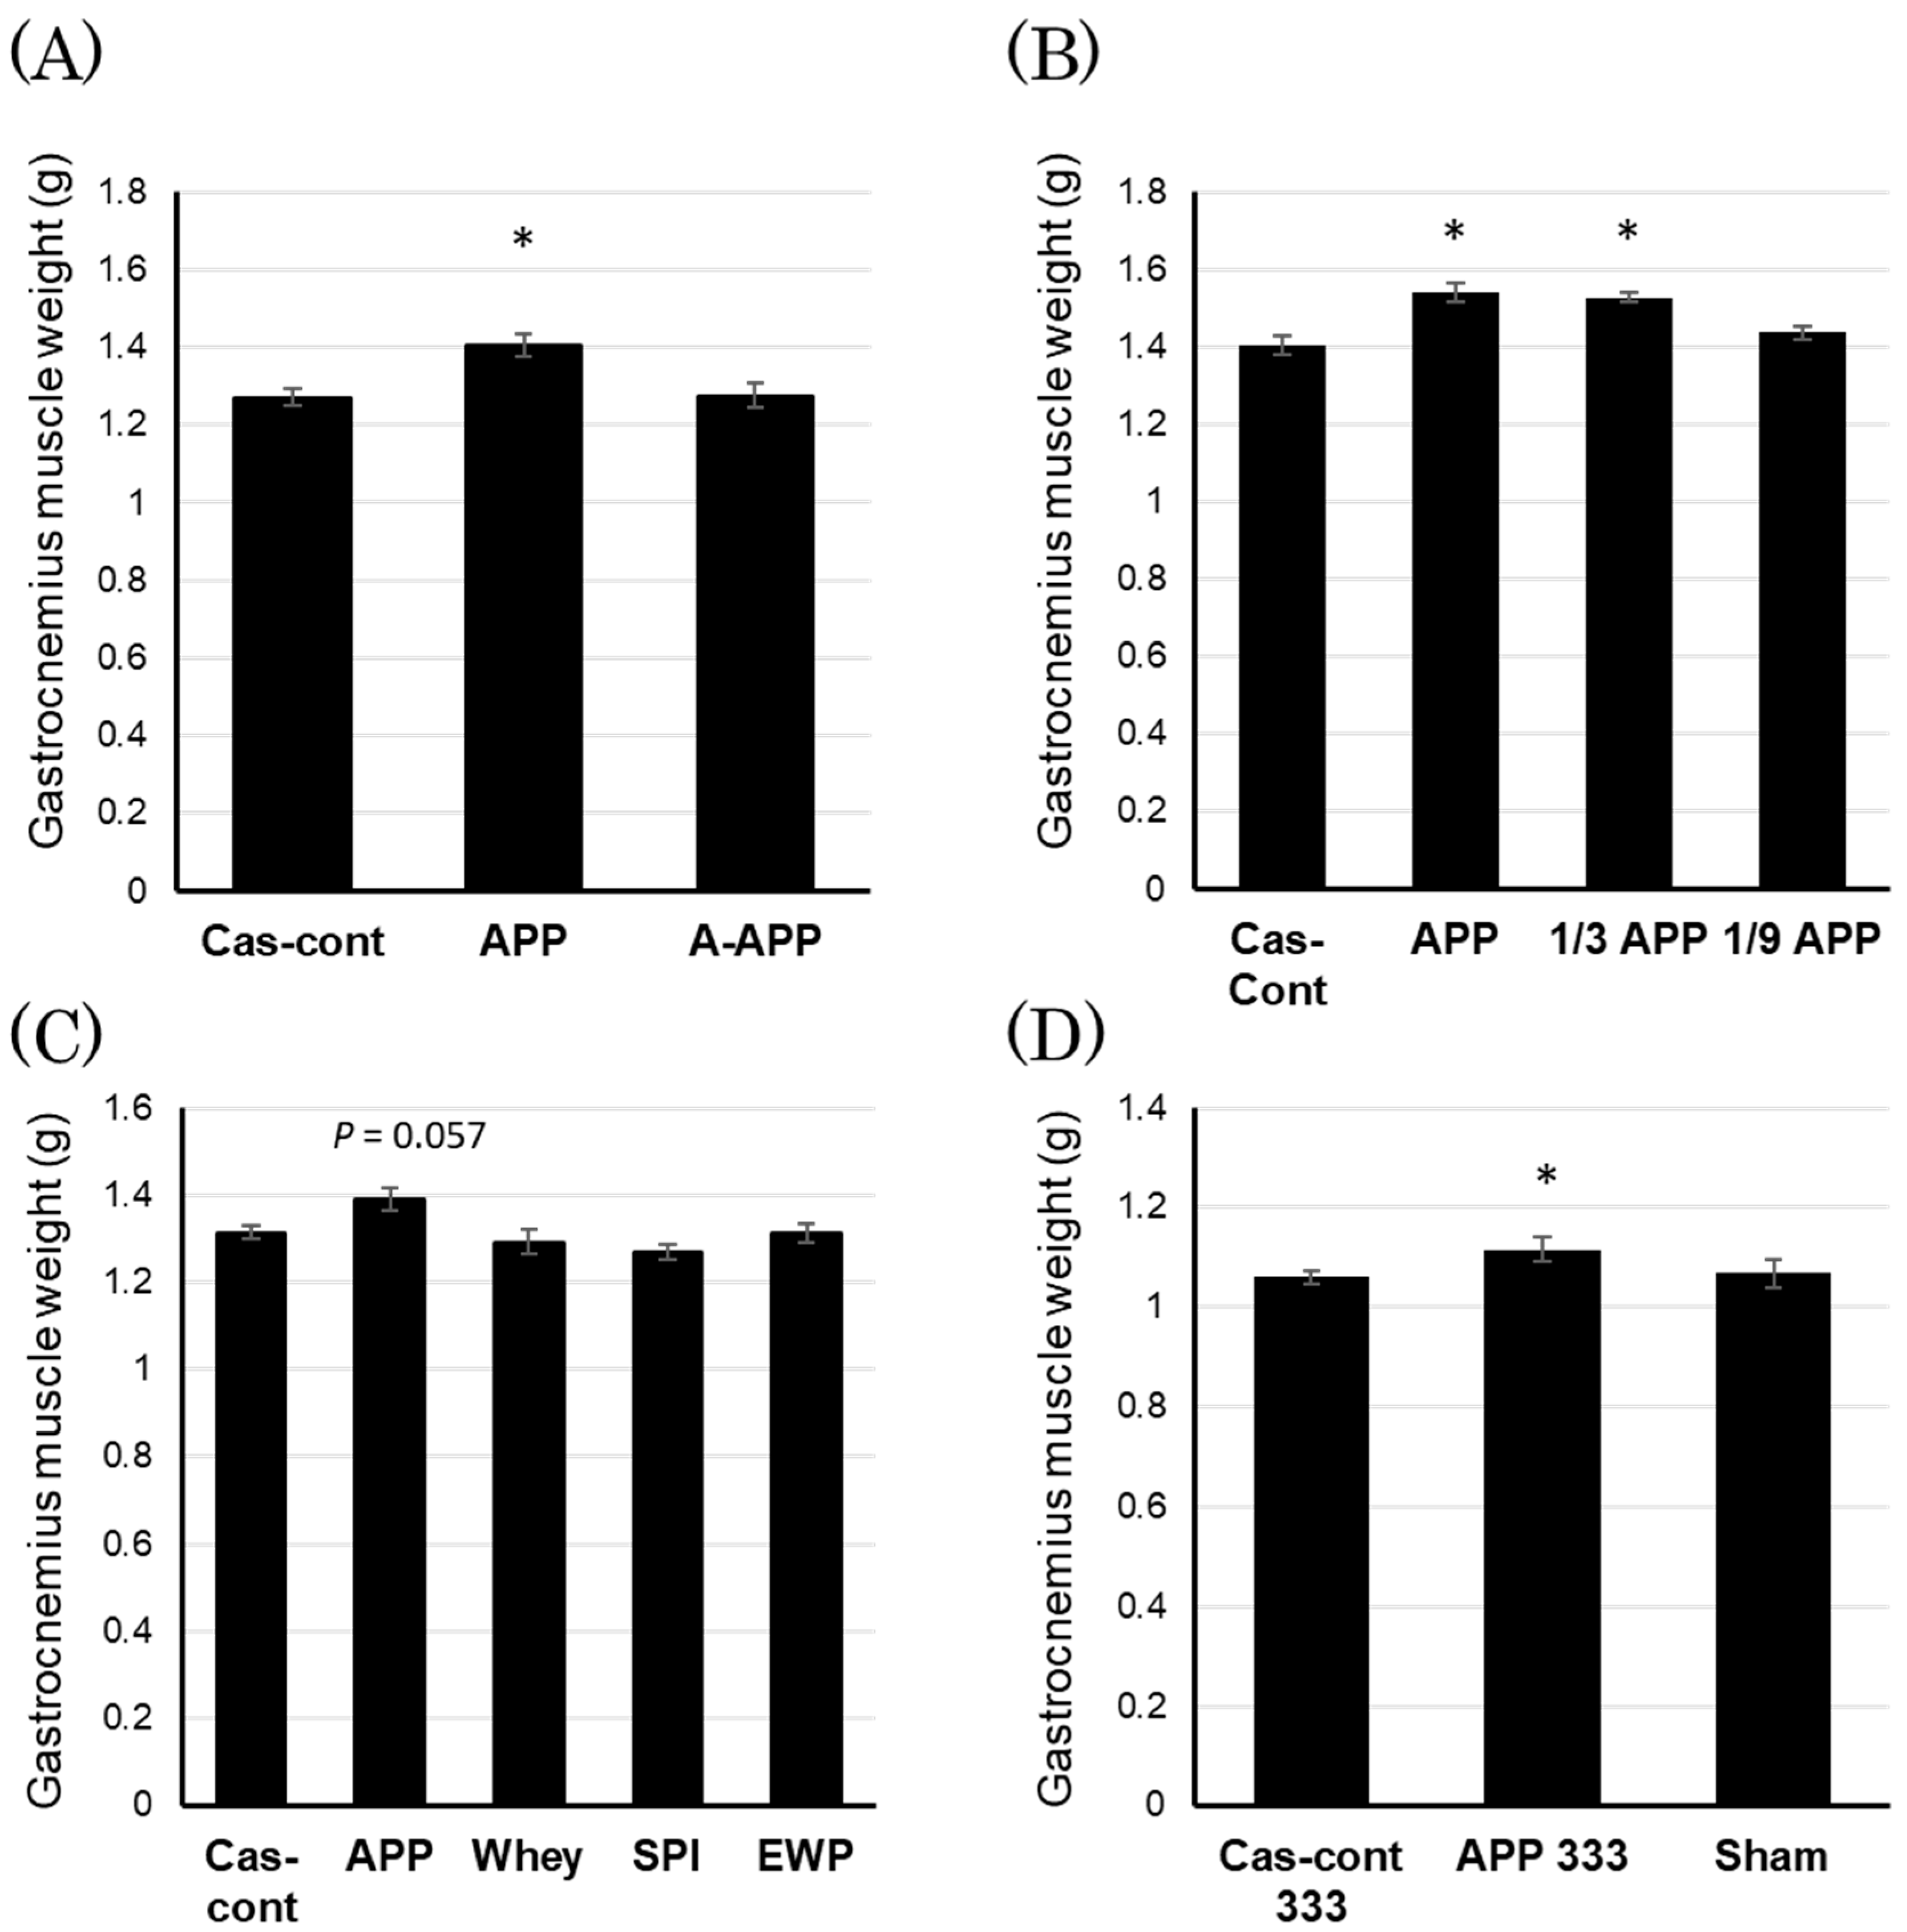
Data are expressed as the mean ± standard error of the mean (SEM). Data from final body weight, body weight gain, total food intake, and gastrocnemius were analyzed using one-way analysis of variance (ANOVA) and Dunnett’s method. When there were significant differences in the ANVOA method, these data were analyzed using the Dunnett’s method. The data from serum amino acids were analyzed using the Tukey–Kramer method. The regression line was analyzed using the f statistic. Statistical significance was defined as p < 0.05. All statistical tests were performed using IBM SPSS Statistics software (IBM Corp., Armonk, NY, USA).

3. Results

3.1. Effects on Final Body Weight, Body Weight Gain, and Total Food Intake (Table 3)

Effects on final body weight, body weight gain and total food intake are shown in Table 3. There were no significant differences in final body weight, body weight gain, and total food intake between the Cas-cont, APP, and Cas-Arg groups in Exp. 1. In Exp. 2, body weight gain in the APP group was higher than that in the Cas-cont group, while the final body weight and total food intake did not differ between the Cas-cont and APP groups. These growth parameters did not differ between the Cas-cont and A-APP groups. In Exp. 4, the final body weight and body weight gain of the APP group were higher than those of the Cas-cont group, and the body weight gain of the 1/3 APP group was higher than that of the Cas-cont group. In Exp. 5, the whey and SPI groups significantly reduced body weight gain, but not APP and EWP, while the final body weight and total food intake did not differ between the four groups. In Exp. 6, these growth parameters did not differ between the Cas-cont 333, APP 333, and saline groups.

3.2. Effects of Gastrocnemius Muscle Weight

Dietary APP, but not Cas-Arg, significantly increased the gastrocnemius muscle weight in Exp. 1 (Figure 1). Dietary APP, but not A-APP, increased by 5.8% the mean of the gastrocnemius muscle weight in Exp. 2 and significantly increased the gastrocnemius muscle weight in Exp. 3 (Figure 2A). In Exp. 4, the gastrocnemius muscle weight of the APP and 1/3 APP groups was higher than that of the Cas-cont group; however, this was not the case for the 1/9 APP group (Figure 2B). In Exp. 5, dietary APP tended to increase gastrocnemius muscle weight while whey, SPI, and EWP did not increase significantly (Figure 2C). In Exp. 6, the oral administration of 333 mg/kg/day APP significantly increased gastrocnemius muscle weight compared with the oral administration of 333 mg/kg/day Cas-cont, while saline did not increase muscle weight significantly (Figure 2D).

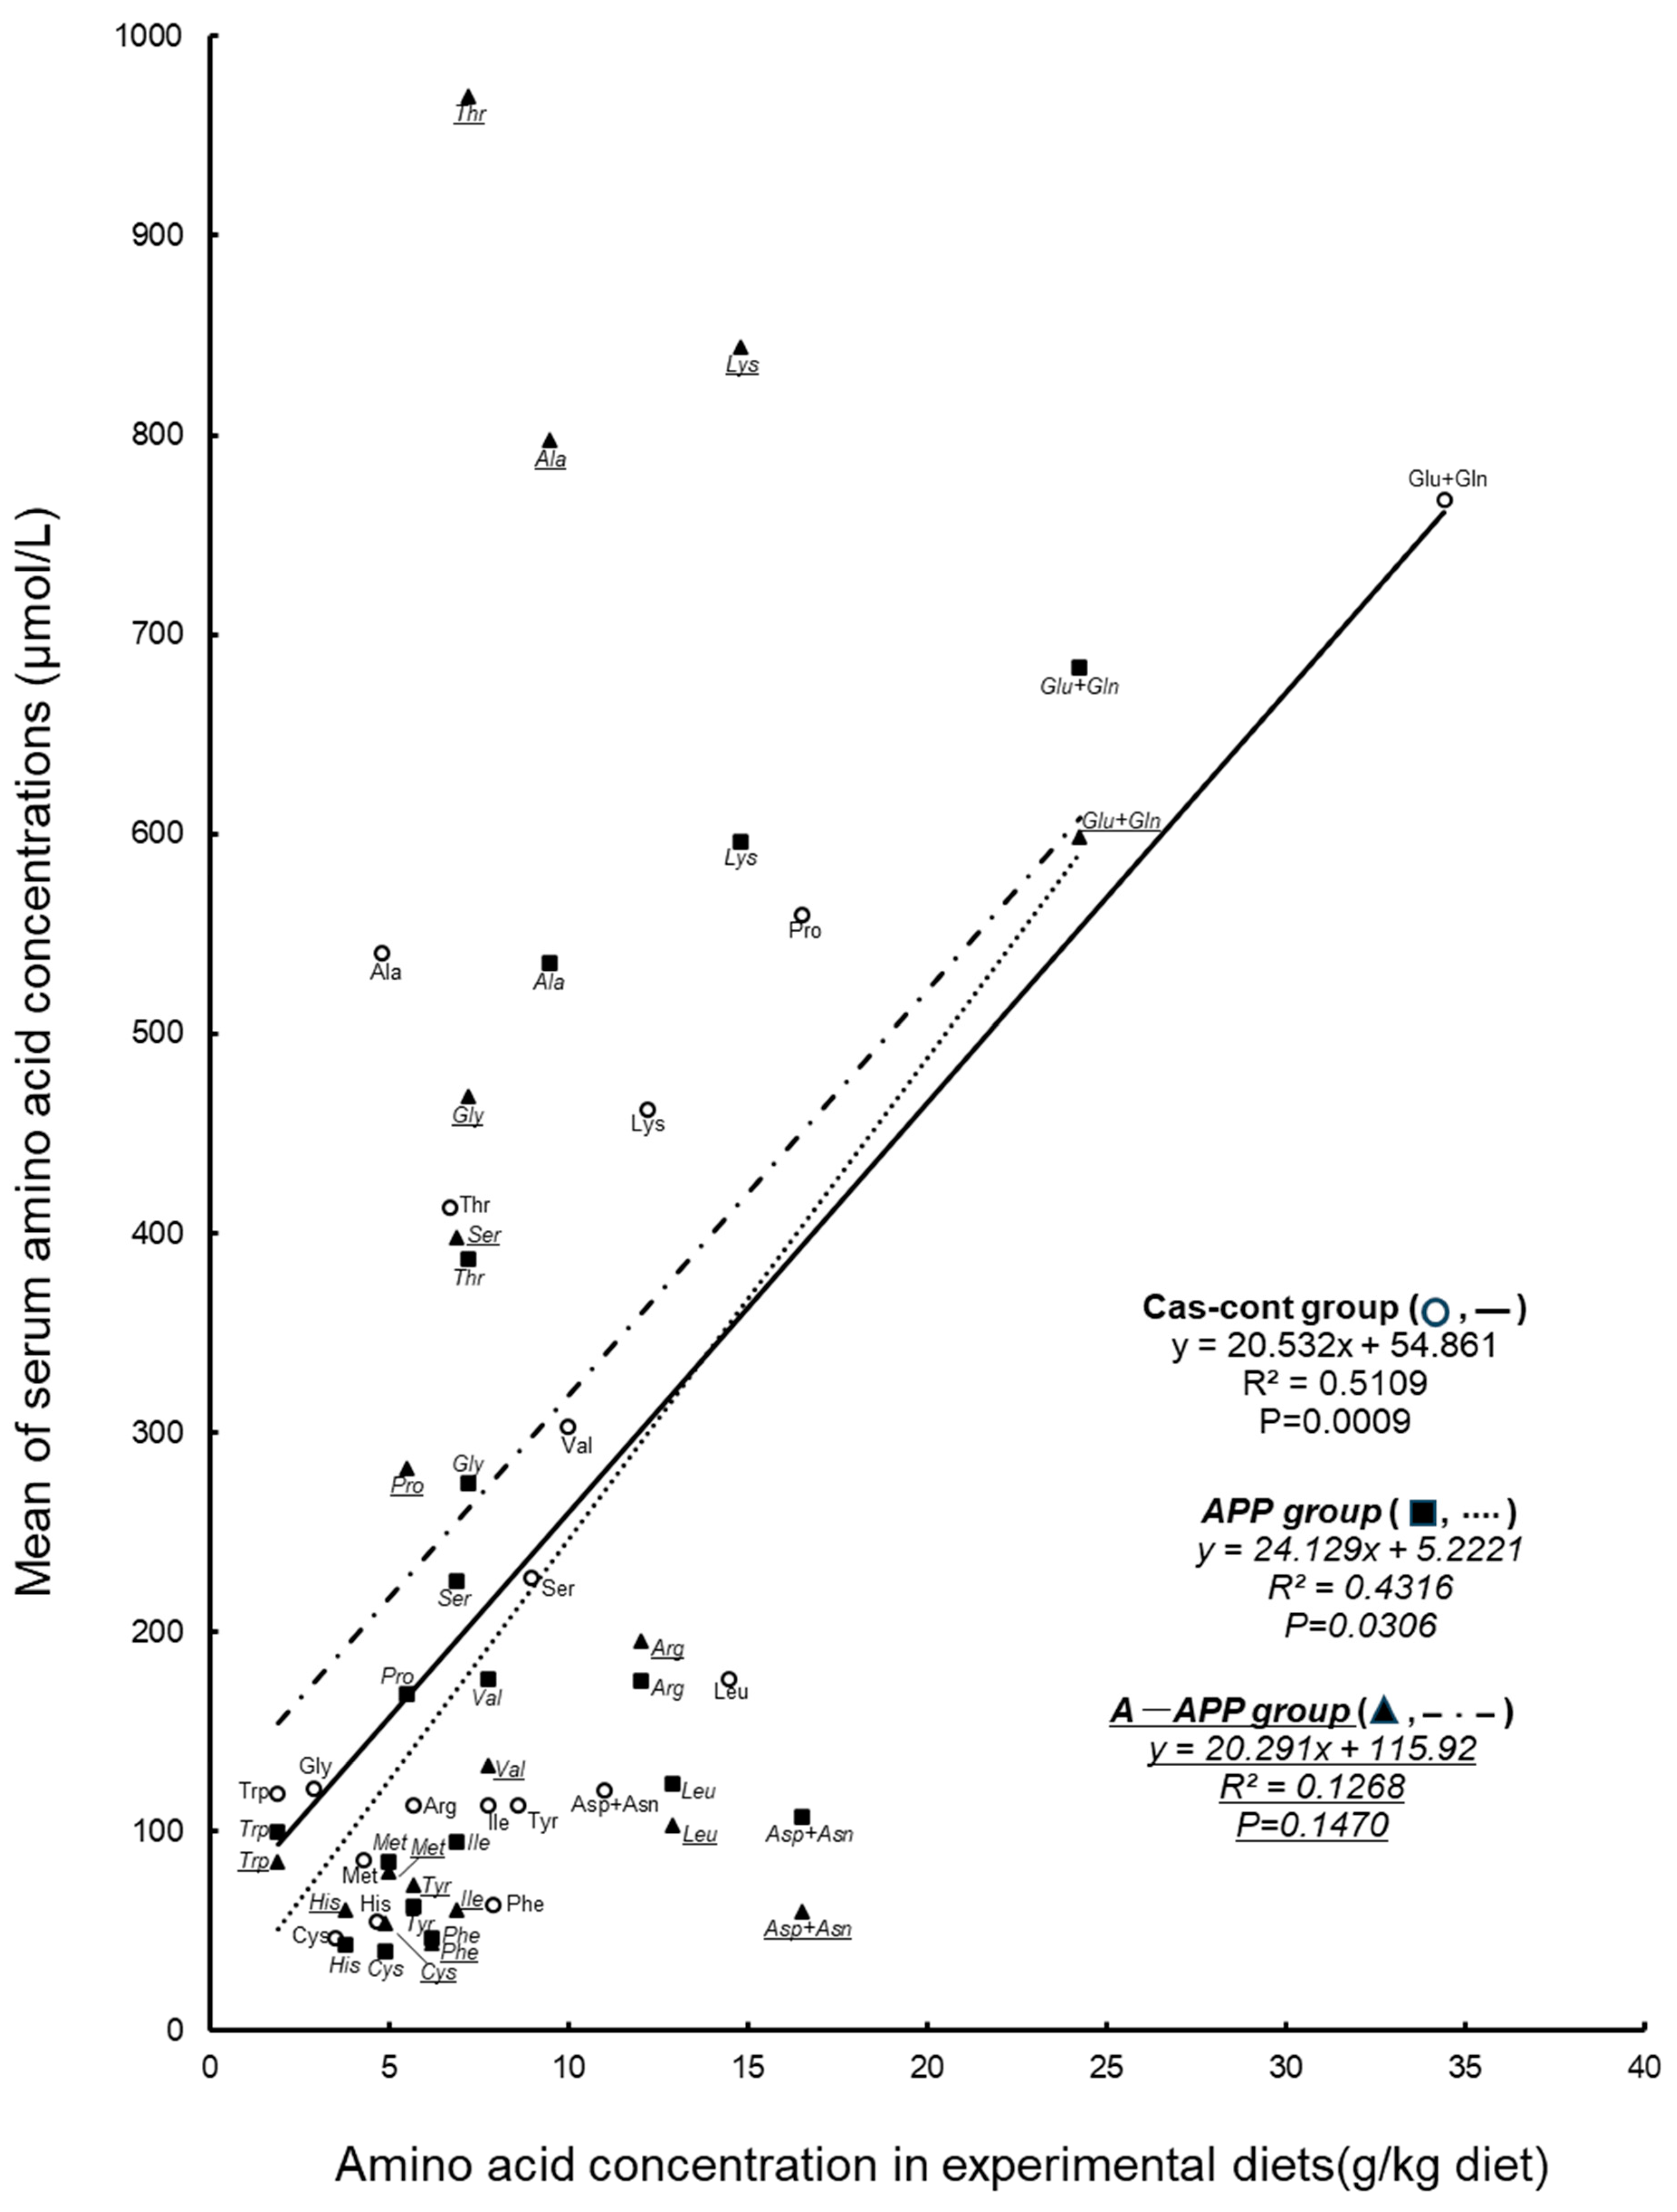
3.3. Effects on the Concentration of Free Amino Acids in Serum and Muscle

In Exp. 1, serum valine, proline, tyrosine, and histidine concentrations were lower in the APP group than in the Cas-cont and Cas-Arg groups (Table 4). Serum tyrosine and histidine concentrations were lower in the Cas-Arg group than in the Cas-cont group. Serum arginine and glycine concentrations were higher in the APP group than in the Cas-cont and Cas-Arg groups. Serum lysine and methionine concentrations were higher in the APP group than in the Cas-Arg group. Serum asparagine, glutamine, and tryptophan concentrations were lower in the APP group than in the Cas-cont group. Valine, proline, serine, asparagine, glutamine, alanine, tyrosine, phenylalanine, tryptophan, and histidine concentrations of free amino acids in muscle were lower in the APP group than in the Cas-cont and Cas-Arg groups (Table 5). Valine, asparagine, alanine, tyrosine, and histidine concentrations of free amino acids in muscle were lower in the Cas-Arg group than in the Cas-cont group. Arginine, glycine, and lysine concentrations of free amino acids in muscle were higher in the APP group than in the Cas-cont and Cas-Arg groups. Arginine concentrations of free amino acids in muscle were lower in the Cas-Arg group than in the Cas-cont group. The concentration of amino acids in serum was significantly correlated with free amino acids in gastrocnemius muscle in Cas-cont, APP, and Cas-Arg groups (Cas-cont: y = 6.4605 x − 492.52, R = 0.8429, p < 0.0001, APP: y = 5.6009 x − 337.26, R = 0.8012, p = 0.0044 Cas-Arg: y = 6.234x − 433.42, R = 0.8373, p = 0.0007).
In Exp. 3, serum valine, leucine, glutamine, tyrosine, and phenylalanine levels were lower in the APP group than in the Cas-cont group, while they did not differ between the APP and A-APP groups (Table 6). Serum isoleucine concentration was higher in the APP group than in the A-APP group, while it did not differ between the Cas-cont and APP groups. Serum arginine concentration was higher in the APP and A-APP groups than in the Cas-cont group. Serum glycine concentration in the APP group was higher than that in the Cas-cont group and lower than that in the A-APP group. Serum proline concentration was lower in the APP group than in the Cas-cont and A-APP groups and was lower in the A-APP group than in the Cas-cont group. Serum lysine, threonine, serine, alanine, and cysteine concentrations were higher in the A-APP group than in the Cas-cont and APP groups, and there was no significant difference between the Cas-cont and APP groups. Serum asparagine concentration in the APP group was lower than that in the Cas-cont group and higher than that in the A-APP group. Serum tryptophan concentration was lower in the A-APP group than in the Cas-cont group, while it did not differ between the APP and A-APP groups. In Exp. 4, APP decreased serum valine concentration in a dose-dependent manner, and serum valine concentration was significantly lower in the APP, 1/3 APP, and 1/9 APP groups than in the Cas-cont group, and it was significantly lower in the APP group than in the 1/9 APP group (Table 7). Serum leucine, isoleucine, asparagine, alanine, tyrosine, and histidine concentrations were significantly lower in the APP, 1/3 APP, and 1/9 APP groups than in the Cas-cont group. Serum arginine concentration was higher in the APP group than in the Cas-cont, 1/3 APP, and 1/9 APP groups. Serum glycine concentration was higher in the APP and 1/3 APP groups than in the Cas-cont group. APP decreased serum proline concentration in a dose-dependent manner, and serum proline concentration was lower in the APP and 1/3 APP groups than in the 1/9 APP and Cas-cont groups. Serum lysine and methionine concentrations were higher in the APP group than in the 1/9 APP group, but not in the Cas-cont group. APP decreased serum glutamine concentration in a dose-dependent manner, and it was lower in the APP and 1/3 APP groups than in the Cas-cont group. Table 7 showed the correlation between the amino acid concentration in experimental diets and the mean of serum amino acid concentrations in dietary groups. We found a strong positive correlation between the amino acid concentration and mean of serum amino acid concentrations in the Cas-cont group and APP group but not the A-APP group.

4. Discussion

The specific amino acid content and amino acid balance of the diet did not affect gastrocnemius skeletal muscle increase (Figure 1 and Figure 2). Furthermore, a once-daily oral administration of APP (333 mg/kg body weight) also increased the gastrocnemius skeletal muscle weight (Figure 2D). It is speculated that proteins or peptides may be the active ingredients in APP responsible for gastrocnemius muscle weight hypertrophy.
APP contains 0.5% taurine (Table 1). The experimental diets contained 17.2% protein (Table 2) and 0.8% taurine. It was reported that taurine was effective in preventing muscle damage after exercise [25]. But the present study did not intervene in the exercise. Furthermore, the APP diet had an effect of muscle hypertrophy (Figure 1), but the concentration of taurine in the muscle in APP diet was the same as in the Cas-cont diet (Table 5). It was suggested that the effect of the muscle hypertrophy in APP might not be related to taurine.
To clarify whether high levels of arginine in APP are responsible for gastrocnemius muscle hypertrophy, we compared the effect on the gastrocnemius muscle weight among casein, APP, and Cas-Arg groups. The gastrocnemius muscle weight of the APP group, but not the Cas-Arg group, was significantly higher than that of Cas-cont (Figure 1), suggesting that high levels of arginine in the APP diet are not responsible for gastrocnemius muscle hypertrophy. However, serum arginine concentration in the APP group was significantly higher than that in the Cas-cont group, whereas there were no significant differences between the Cas-cont and Cas-Arg groups (Table 4). Since a concentration of serum arginine in the Cas-Arg group did not increase, the free amino acid composition in gastrocnemius muscle was also examined for Exp. 1. There was a significantly higher correlation between free amino acids concentrations in muscle and serum. The concentration of free arginine in the gastrocnemius muscle of the Cas-Arg group was significantly higher than that of the Cas-cont group (Table 5), but the gastrocnemius muscle was not increased (Figure 1). These data suggest that arginine did not have an effect on muscle hypertrophy. Although there was a limit to the present study, the reason for the increment in serum arginine concentration would be as follows. Arginine uptake by transporters and arginase activity in the intestine is competitively and non-competitively inhibited by amino acids [26,27]. We speculated that the amino acid composition of APP may increase the serum arginine concentration. Therefore, we investigated the effect of casein, APP, and A-APP on the gastrocnemius muscle weight and serum concentrations of amino acids in Exp. 2 and 3. Dietary APP, but not A-APP, significantly increased gastrocnemius muscle weight (Figure 2A). On the other hand, serum arginine concentration in the A-APP group was significantly higher than that in the Cas-cont group and was comparable to that in the APP group (Table 6). Furthermore, the 1/3 APP group had muscle hypertrophy (Figure 2B), even though the serum arginine concentration was similar to that of the Cas-cont group (Table 7) in Exp. 4. These results suggest that elevated serum arginine concentration due to APP intake is not responsible for gastrocnemius muscle hypertrophy.
Serum leucine and isoleucine concentrations did not differ significantly between the Cas-cont and APP groups, and valine concentration in the APP group was significantly lower than that in the Cas-cont group in Exp. 1 (Table 4). Serum leucine and valine concentrations in the APP group were significantly lower than those in the Cas-cont group in Exp. 2 (Table 6). Serum leucine, isoleucine, and valine concentrations in the 1/9 APP, 1/3 APP, and APP groups were lower than those in the Cas-cont group in Exp. 4 (Table 7). However, APP increased gastrocnemius muscle weight in a dose-dependent manner (Figure 2B). These results suggest that BCAAs are not involved in dietary APP-induced gastrocnemius muscle hypertrophy. In addition, although whey had a higher leucine content (Table 1), dietary whey did not induce skeletal muscle hypertrophy in Exp. 5 (Figure 2C). Leucine may induce skeletal muscle hypertrophy [18] by activating the mammalian target of rapamycin complex 1 (mTORC1) kinase and increasing protein synthesis [28]. Leucine induces skeletal muscle hypertrophy when combined with exercise in older men [20,21]. Lim et al. suggested that leucine intake accompanied by regular exercise training may increase satellite cell activation in the skeletal muscles of rats [5]. Leucine supplementation has been reported to improve skeletal muscle recovery after immobilization atrophy and lesions in rats [29,30,31]. However, leucine supplementation alone did not induce skeletal muscle hypertrophy or satellite cell activity in rats [5]. Therefore, the skeletal muscle hypertrophic effect of APP may not be attributed to the leucine-induced stimulation of protein synthesis.
The gastrocnemius muscle weights in the APP and 1/3 APP groups were significantly higher than those in the Cas-cont group, but not in the 1/9 APP group (Figure 2B). Serum proline concentration was lower in the 1/3 APP and APP groups than in the 1/9 APP and Cas-cont groups (Table 6). Low serum proline concentrations could be involved in gastrocnemius muscle hypertrophy. To address this possibility, we investigated whether whey, SPI, and EWP, which contain proline at lower levels than Cas-cont but similar to APP, could induce gastrocnemius hypertrophy in Exp. 5. Compared with Cas-cont, whey, SPI, and EWP did not affect gastrocnemius muscle weight (Figure 2C). It is speculated that there may be a positive correlation between the amino acid concentration and mean serum amino acid concentrations in the whey, SPI, and EWP groups in Exp. 5, as observed in the Cas-cont and APP groups in Exp. 2, although the serum proline concentration was not measured in the Exp. 5. These results suggest that skeletal muscle hypertrophy induced by dietary APP may not be attributable to the effect of low proline concentrations.
In these results, the muscle hypertrophy effect of APP was not due to the effects of arginine, BCAA, and proline, which were reported to associate with promoting muscle synthesis (Exp. 1, 5). In addition, an effect of muscle hypertrophy remained with the intake of 1/3 APP, in which the amino acid composition of APP was changed to 2/3 casein in Exp. 4, and did not remain in multiple other protein sources in Exp. 5. These results showed that dietary APP induced acute skeletal muscle hypertrophy in rats, regardless of specific amino acid and amino acid balances in diet. Unfortunately, although the A-APP diet provided the same amount of total amino acids as the APP diet, the amino acid dynamics of the A-APP group were different from those of the APP group (Figure 3). This difference predicted that the absorption rate of amino acids was the difference in the protein, and there were limits in the present study. However, there was only a decrease in isoleucine, which was reported to be associated with promoting muscle synthesis in Table 6. So, the results of Exp. 2 and 3 also supported this conclusion.
We investigated whether the oral administration of APP was effective for gastrocnemius muscle hypertrophy. In the pre-study, the oral administration of 1000 mg/kg/day or 333 mg/kg/day APP a day tended to be effective for gastrocnemius muscle hypertrophy (Table S1). The gastrocnemius muscle was significantly higher in the APP 333 group than in the Cas-cont 333 group or saline group in Exp. 6 (Figure 2D). The oral administration of 333 mg/kg/day APP was approximately 0.066 g APP on a single administration. Since only about 1/60 of the protein consumed per day was taken as APP, the amino acid balance in the diet was expected to be almost the same as that in the Cas-cont group. When the dose of 333 mg/kg/day in rats is calculated as the human equivalent dose, the APP dose of general human adults (body weight 60 kg) would be approximately 3.0 g/day. Some clinical studies started with the administration of APP 4.5 g/day (1.5 as the human equivalent dose). In the near future, we will report on these clinical studies.
These results suggested that skeletal muscle hypertrophy induced by dietary APP was not related to specific amino acids or amino acid balance in the diet. It is speculated that the effective ingredient was a specific protein in APP, a specific hydrolyzed peptide from APP, or other minor components in APP. Overall, for the effective ingredient, further studies are needed. This investigation makes it possible to investigate the muscle hypertrophy mechanism of APP without considering the muscle hypertrophic effect of intracellular amino acid concentrations. We believe that a major contribution may be the elucidation of the upstream factors of the ubiquitin proteasome decrease by dietary APP, which is an issue in research on the muscle hypertrophy mechanism of APP.

Supplementary Materials

The following supporting information can be downloaded at: https://www.mdpi.com/article/10.3390/nutraceuticals3040037/s1, Table S1: Effects of Alaska pollack protein administration for gastrocnemius muscle weight in pre-experiment 6.

Author Contributions

K.U., M.F., T.M., K.H., Y.H., M.S., S.U., R.U., S.O. and T.K. conceived and designed experiments; K.U., Y.H., M.S., S.U. and R.U. performed experiments; K.U., M.F., Y.H., M.S., S.U. and R.U. analyzed data; K.U. and M.F. prepared figures and tables and wrote the manuscript; T.M., K.H., S.O. and T.K. contributed to the analysis and interpretation of data; T.K. assisted in the preparation of the manuscript; T.K. reviewed the paper. All authors have read and agreed to the published version of the manuscript.

Funding

This work was supported by the Japanese Council for Science, Technology, and Innovation (CSTI), Cross-Ministerial Strategic Innovation Promotion Program (SIP Project ID 14533567) (to SO and TK). The present study was funded by the Nissui Corporation.

Institutional Review Board Statement

The present study was conducted in March 2019 in accordance with the ethical guidelines of the Ehime University Animal Experimentation Committee (permit number 08A92 (2014–2018)) and in compliance with the National Institutes of Health Guide for the Care and Use of Laboratory Animals. All efforts were made to minimize the number of animals used and limit experimentation to what was necessary to produce reliable scientific information.

Data Availability Statement

The data underlying this article will be shared upon reasonable request to the corresponding author.

Acknowledgments

The determination of amino acid contents was performed with an amino acid analyzer (Hitachi L-8900) at the Division of Genetic Research, the Advanced Research Support Center (ADRES), Ehime University.

Conflicts of Interest

The present study was funded by the Nissui corporation. Kohsuke Hayamizu is a former employee of the Nissui corporation, and Kenji Uchida is a current employee of the Nissui corporation. SO and TK are funded by the Japanese Council for Science, Technology, and Innovation (CSTI), Cross-Ministerial Strategic Innovation Promotion Program (SIP Project ID 14533567). MF, TM, SO, and TK were funded by the Nissui corporation. KH is a former employee of the Nissui corporation and KU is a current employee of the Nissui corporation. KU, YH, MS, and RU: no conflicts of interest.

Abbreviations

APP, Alaska pollack protein; Cas-cont, casein; Cas-Arg, casein supplemented with 0.44% arginine; A-APP, amino acid mixture with the same composition as APP; 1/3 APP, a diet containing one-third of protein from APP; MHC, myosin heavy chain; IGF1, insulin-like growth factor 1; AKT, protein kinase B; mTOR, mechanistic target of rapamycin; Fbxo32, F-box protein 32; atrogin-1, atrophy gene-1; Trim63, tripartite motif-containing 63; MuRF1, muscle-specific RING finger protein-1.

References

  1. Wolfe, R.R. The underappreciated role of muscle in health and disease. Am. J. Clin. Nutr. 2006, 84, 475–482. [Google Scholar] [CrossRef]
  2. Koopman, R.; Ly, C.H.; Ryall, J.G. A metabolic link to skeletal muscle wasting and regeneration. Front. Physiol. 2014, 5, 32. [Google Scholar] [CrossRef]
  3. Chen, H.-C.; Lim, L.-M.; Chang, J.-M.; Misra, M. Save life and improve quality: Report from the 5th Congress of International Society for Hemodialysis. Hemodial. Int. 2014, 18, 163–171. [Google Scholar] [CrossRef]
  4. Anthony, J.C.; Anthony, T.G.; Layman, D.K. Leucine supplementation enhances skeletal muscle recovery in rats following exercise. J. Nutr. 1999, 129, 1102–1106. [Google Scholar] [CrossRef]
  5. Lim, C.H.; Gil, J.H.; Quan, H.; Viet, D.H.; Kim, C.K. Effect of 8-week leucine supplementation and resistance exercise training on muscle hypertrophy and satellite cell activation in rats. Physiol. Rep. 2018, 6, e13725. [Google Scholar] [CrossRef]
  6. Kitakaze, T.; Harada, N.; Imagita, H.; Yamaji, R. β-carotene increases muscle mass and hypertrophy in the soleus muscle in mice. J. Nutr. Sci. Vitaminol. 2015, 61, 481–487. [Google Scholar] [CrossRef]
  7. Hashimoto, R.; Sakai, A.; Murayama, M.; Ochi, A.; Abe, T.; Hirasaka, K.; Ohno, A.; Teshima-Kondo, S.; Yanagawa, H.; Yasui, N.; et al. Effects of dietary soy protein on skeletal muscle volume and strength in humans with various physical activities. J. Med. Investig. 2015, 62, 177–183. [Google Scholar] [CrossRef]
  8. Liu, S.-H.; Chiu, C.-Y.; Wang, L.-P.; Chiang, M.-T. Omega-3 Fatty Acids-Enriched Fish Oil Activates AMPK/PGC-1α Signaling and Prevents Obesity-Related Skeletal Muscle Wasting. Mar. Drugs 2019, 17, 380. [Google Scholar] [CrossRef]
  9. Le, N.H.; Kim, C.-S.; Park, T.; Park, J.H.Y.; Sung, M.-K.; Lee, D.G.; Hong, S.-M.; Choe, S.-Y.; Goto, T.; Kawada, T.; et al. Quercetin Protects against Obesity-Induced Skeletal Muscle Inflammation and Atrophy. Mediat. Inflamm. 2014, 2014, 834294. [Google Scholar] [CrossRef]
  10. Rondanelli, M.; Rigon, C.; Perna, S.; Gasparri, C.; Iannello, G.; Akber, R.; Alalwan, T.A.; Freije, A.M. Novel Insights on Intake of Fish and Prevention of Sarcopenia: All Reasons for an Adequate Consumption. Nutrients 2020, 12, 307. [Google Scholar] [CrossRef]
  11. Mizushige, T.; Kawabata, F.; Uozumi, K.; Tsuji, T.; Kishida, T.; Ebihara, K. Fast-twitch muscle hypertrophy partly induces lipid accumulation inhibition with Alaska pollack protein intake in rats. Biomed. Res. 2010, 31, 347–352. [Google Scholar] [CrossRef] [PubMed]
  12. Kawabata, F.; Mizushige, T.; Uozumi, K.; Hayamizu, K.; Han, L.; Tsuji, T.; Kishida, T. Fish protein intake induces fast-muscle hypertrophy and reduces liver lipids and serum glucose levels in rats. Biosci. Biotechnol. Biochem. 2015, 79, 109–116. [Google Scholar] [CrossRef]
  13. Uchida, K.; Fujitani, M.; Mizushige, T.; Kawabata, F.; Hayamizu, K.; Uozumi, K.; Hara, Y.; Sawai, M.; Uehigashi, R.; Okada, S.; et al. Dietary Alaska pollack Protein Induces Acute and Sustainable Skeletal Muscle Hypertrophy in Rats. Nutrients 2022, 14, 547. [Google Scholar] [CrossRef] [PubMed]
  14. Fujitani, M.; Mizushige, T.; Kawabata, F.; Uozumi, K.; Yasui, M.; Hayamizu, K.; Uchida, K.; Okada, S.; Keshab, B.; Kishida, T. Dietary Alaska pollack protein improves skeletal muscle weight recovery after immobilization-induced atrophy in rats. PLoS ONE 2019, 14, e0217917. [Google Scholar] [CrossRef] [PubMed]
  15. Morisasa, M.; Goto-Inoue, N.; Sato, T.; Machida, K.; Fujitani, M.; Kishida, T.; Uchida, K.; Mori, T. Investigation of the Lipid Changes That Occur in Hypertrophic Muscle Due to Fish Protein-Feeding Using Mass Spectrometry Imaging. J. Oleo Sci. 2019, 68, 141–148. [Google Scholar] [CrossRef] [PubMed]
  16. Wolfson, R.L.; Sabatini, D.M. The Dawn of the Age of Amino Acid Sensors for the mTORC1 Pathway. Cell Metab. 2017, 26, 301–309. [Google Scholar] [CrossRef]
  17. Jobgen, W.; Meininger, C.J.; Jobgen, S.C.; Li, P.; Lee, M.-J.; Smith, S.B.; Spencer, T.E.; Fried, S.K.; Wu, G. Dietary L-Arginine Supplementation Reduces White Fat Gain and Enhances Skeletal Muscle and Brown Fat Masses in Diet-Induced Obese Rats. J. Nutr. 2009, 139, 230–237. [Google Scholar] [CrossRef]
  18. Gross, K.L.; Hartman, W.J.; Ronnenberg, A.; Prior, R.L. Arginine-Deficient Diets Alter Plasma and Tissue Amino Acids in Young and Aged Rats. J. Nutr. 1991, 121, 1591–1599. [Google Scholar] [CrossRef]
  19. Landi, F.; Calvani, R.; Tosato, M.; Martone, A.M.; Ortolani, E.; Savera, G.; D’angelo, E.; Sisto, A.; Marzetti, E. Protein Intake and Muscle Health in Old Age: From Biological Plausibility to Clinical Evidence. Nutrients 2016, 8, 295. [Google Scholar] [CrossRef]
  20. Burd, N.A.; Yang, Y.; Moore, D.R.; Tang, J.E.; Tarnopolsky, M.A.; Phillips, S.M. Greater stimulation of myofibrillar protein synthesis with ingestion of whey protein isolate v. micellar casein at rest and after resistance exercise in elderly men. Br. J. Nutr. 2012, 108, 958–962. [Google Scholar] [CrossRef]
  21. Pennings, B.; Boirie, Y.; Senden, J.M.; Gijsen, A.P.; Kuipers, H.; van Loon, L.J. Whey protein stimulates postprandial muscle protein accretion more effectively than do casein and casein hydrolysate in older men. Am. J. Clin. Nutr. 2011, 93, 997–1005. [Google Scholar] [CrossRef] [PubMed]
  22. Anthony, J.C.; Anthony, T.G.; Kimball, S.R.; Vary, T.C.; Jefferson, L.S. Orally Administered Leucine Stimulates Protein Synthesis in Skeletal Muscle of Postabsorptive Rats in Association with Increased eIF4F Formation. J. Nutr. 2000, 130, 139–145. [Google Scholar] [CrossRef] [PubMed]
  23. Reeves, P.G.; Nielsen, F.H.; Fahey, G.C., Jr. AIN-93 Purified Diets for Laboratory Rodents: Final Report of the American Institute of Nutrition Ad Hoc Writing Committee on the Reformulation of the AIN-76A Rodent Diet. J. Nutr. 1993, 123, 1939–1951. [Google Scholar] [CrossRef] [PubMed]
  24. Diet, C.B.; Diet, U.; Diet, N.P. Report of the American Institute of Nutrition Ad Hoc Committee on Standards for Nutritional Studies. J. Nutr. 1977, 107, 1340–1348. [Google Scholar]
  25. Kurtz, J.A.; VanDusseldorp, T.A.; Doyle, J.A.; Otis, J.S. Taurine in sports and exercise. J. Int. Soc. Sports Nutr. 2021, 18, 1–20. [Google Scholar] [CrossRef]
  26. Arancibia-Garavilla, Y.; Toledo, F.; Casanello, P.; Sobrevia, L. Nitric Oxide Synthesis Requires Activity of the Cationic and Neutral Amino Acid Transport System y+ L in Human Umbilical vein Endothelium. Exp. Physiol. 2003, 88, 699–710. [Google Scholar] [CrossRef]
  27. Fujimoto, M.; Kameji, T.; Kanaya, A.; Hagihira, H. Purification and Properties of Rat Small Intestinal Arginase. J. Biochem. 1976, 79, 441–449. [Google Scholar] [CrossRef]
  28. Ribeiro, C.B.; Christofoletti, D.C.; Pezolato, V.A.; de Cassia Marqueti Durigan, R.; Prestes, J.; Tibana, R.A.; Pereira, E.C.; de Sousa Neto, I.V.; Durigan, J.L.; da Silva, C.A. Leucine minimizes denervation-induced skeletal muscle atrophy of rats through akt/mtor signaling pathways. Front. Physiol. 2015, 6, 73. [Google Scholar] [CrossRef]
  29. Pereira, M.G.; Silva, M.T.; da Cunha, F.M.; Moriscot, A.S.; Aoki, M.S.; Miyabara, E.H. Leucine supplementation improves regeneration of skeletal muscles from old rats. Exp. Gerontol. 2015, 72, 269–277. [Google Scholar] [CrossRef]
  30. Pereira, M.G.; Baptista, I.L.; Carlassara, E.O.C.; Moriscot, A.S.; Aoki, M.S.; Miyabara, E.H. Leucine Supplementation Improves Skeletal Muscle Regeneration after Cryolesion in Rats. PLoS ONE 2014, 9, e85283. [Google Scholar] [CrossRef]
  31. Savary-Auzeloux, I.; Magne, H.; Migné, C.; Oberli, M.; Breuillé, D.; Faure, M.; Vidal, K.; Perrot, M.; Rémond, D.; Combaret, L.; et al. A Dietary Supplementation with Leucine and Antioxidants Is Capable to Accelerate Muscle Mass Recovery after Immobilization in Adult Rats. PLoS ONE 2013, 8, e81495. [Google Scholar] [CrossRef] [PubMed]
Figure 1. The gastrocnemius muscle weight in rats in the casein diet group (Cas-cont), the Alaska pollack protein diet group (APP), or the casein supplemented with 0.44% arginine diet group (Cas-Arg) after 7 days of feeding in Exp. 1. Data are expressed as the mean ± SEM. Each group included 10 rats. Statistical analysis was performed using Dunnett’s method. Asterisks indicate a significant difference compared to the Cas-cont group (*, p < 0.05).
Nutraceuticals 03 00037 g001
Figure 2. The gastrocnemius muscle weight in rats fed (A): casein diet (Cas-cont), Alaska pollack protein diet (APP) or amino acid mixture (which had the same composition as Alaska pollack protein) diet (A-APP) group, (B) casein, the same diet group in which all protein, one-third or one-ninth source was replaced with Alaska pollack protein (APP, 1/3 APP, and 1/9 APP, respectively), (C) the casein diet (Cas-cont) or the same diet in which the protein source was replaced with Alaska pollack protein, whey, soy protein isolate, or egg white protein diets (APP, Whey, SPI, and EWP, respectively) once a day after 7 days (except (D)) of feeding in Exp. 3–5, (D) orally administrated casein 333 mg/kg, Alaska pollack protein 333 mg/kg or saline (Cas-cont 333, APP 333 and saline, respectively) after 2 days of administering in Exp. 6. Data are expressed as the mean ± SEM. Each group included 6 rats. Statistical analysis was performed using Dunnett’s method. Asterisks indicate a significant difference compared to the Cas-cont group (*, p < 0.05).
Nutraceuticals 03 00037 g002
Figure 3. The correlations between the amino acid concentrations in protein sources and serum amino acid concentrations in the casein, Alaska pollack protein, and amino acid mixture (which has the same composition as Alaska pollack protein) group (Cas-cont, APP, A-APP group). Plots and approximate straight lines of amino acids concentrations in protein sources versus mean of serum amino acids concentrations in the Cas-cont (open circle labeled with upright, solid line), APP (closed square labeled with italic, dotted line) and A-APP (closed triangle labeled with underlined italic, dash-dotted line) groups are shown. The regression line was analyzed using the f statistic. Statistical significance was defined as p < 0.05.
Nutraceuticals 03 00037 g003
Table 1. The nutritional profile and amino acid composition of protein sources in dry material.
Cas-ContAPPWheySPIEWP
Protein, g/100 g86.296.987.087.980.4
Fat, g/100 g1.0<0.10.2<0.10.7
Amino acids, %
Leucine8.47.512.96.67.4
Valine5.84.55.13.85.8
Isoleucine4.54.05.53.74.4
Methionine2.52.92.41.13.1
Threonine3.94.25.03.33.9
Histidine2.72.22.02.32.0
Phenylalanine4.63.63.54.56.2
Tryptophan1.11.12.31.21.2
Lysine7.18.610.85.35.9
Arginine3.37.02.56.44.8
Glycine1.74.21.73.53.0
Glutamic acid20.014.116.915.911.6
Alanine2.85.55.33.55.1
Tyrosine5.03.33.63.23.3
Aspartic acid6.49.611.89.99.0
Serine5.24.03.94.46.7
Cystine0.31.13.21.12.4
Proline9.63.24.34.63.2
Taurine0.00.50.00.00.0
Cas-cont, casein; APP, Alaska pollack protein; SPI, soy protein isolate; EWP, egg white protein.
Table 2. Compositions of the experimental diets (g/kg diet).
Cas-ContAPPA-
APP
Cas-Arg1/3
APP
1/9
APP
WheySPIEWP
Ingredient, g/kg diet -----
Casein200--200133178---
APP-178--5920---
A-APP--172------
Whey------198--
SPI-------196-
EWP--------215
L-Cysteine333 33333
L-Arginine---4.4-----
α-Cornstarch532554560526.6540534537536517
Sucrose100100100100100100100100100
Cellulose505050505050505050
Soybean oil707070707070707070
Lard---- ----
AIN-93 mineral mixture353535353535353535
AIN-93 vitamin mixture101010101010101010
Component, unit/kg diet
Energy, kcal387639463970387638873872388238743812
Protein, g172172172172172172172172172
Fat, g727070707172707072
The AIN-93 vitamin mixture contained 25 g of choline bitartrate/100 g. Cas-cont, casein; APP, Alaska pollack protein; A-APP, amino acid mixture, which has the same composition as Alaska pollack protein; Cas-Arg, casein supplemented with 0.44% arginine; APP 1/3, APP1/9, the same diet group in which one-third or one-ninth source was replaced by Alaska pollack protein; SPI, soy protein isolate; EWP, egg white protein.
Table 3. Effects of APP for 2 or 7 days on the final body weight, body weight gain, and food intake in rats in Experiments 1–5.
Final Body WeightBody Weight GainTotal Food Intake
(g)
Exp. 1
Cas-cont233 ± 357 ± 2134 ± 3
APP238 ± 461 ± 2134 ± 3
Cas-Arg235 ± 359 ± 1137 ± 3
Exp. 2
Cas-cont233 ± 545 ± 2117 ± 5
APP239 ± 751 ± 3 *111 ± 4
A-APP228 ± 340 ± 1118 ± 2
Exp. 3
Cas-cont222 ± 360 ± 1144 ± 3
APP228 ± 365 ± 1 *142 ± 3
A-APP216 ± 254 ± 1 *148 ± 3
Exp. 4
Cas-cont230 ± 264 ± 2140 ± 2
APP239 ± 2 *73 ± 2 **143 ± 3
1/3 APP237 ± 371 ± 1 *139 ± 2
1/9 APP234 ± 368 ± 2140 ± 3
Exp. 5
Cas-cont226 ± 354 ± 1128 ± 3
APP229 ± 357 ± 1124 ± 3
Whey220 ± 348 ± 2 *126 ± 3
SPI220 ± 248 ± 1 *120 ± 2
EWP223 ± 352 ± 2124 ± 2
Exp. 6
Cas-cont 333183 ± 315 ± 136 ± 1
APP 333184 ± 215 ± 135 ± 1
Saline185 ± 215 ± 136 ± 1
The final body mass, body mass gain, and food intake in each experiment are shown. Data are expressed as the mean ± SEM. Statistical analyses were performed using Dunnett’s method. Asterisks show a significant difference compared to the Cas-cont group (*, p < 0.05; **, p < 0.01). Cas-cont, casein; APP, Alaska pollack protein; A-APP, amino acid mixture, which has the same composition as Alaska pollack protein; Cas-Arg, casein supplemented with 0.44% arginine; 1/3 APP, 1/9 APP, the same diet group in which one-third or one-ninth source was replaced with Alaska pollack protein; SPI, soy protein isolate; EWP, egg white protein.
Table 4. Effects of casein, Alaska pollack protein and casein supplemented with 0.44% arginine as dietary protein sources on serum amino acid concentrations (μmol/L) in Exp. 1.
Cas-ContAPPCas-Arg
Val247 ± 12 b169 ± 8 a226 ± 8 b
Leu130 ± 10111 ± 8116 ± 6
Ile92 ± 589 ± 583 ± 3
Arg90 ± 4 a150 ± 11 b117 ± 11 a
Gly121 ± 5 a251 ± 9 b116 ± 4 b
Pro446 ± 21 b160 ± 10 a427 ± 20 b
Lys389 ± 15 ab468 ± 33 b378 ± 22 a
Asp26 ± 324 ± 325 ± 3
Thr472 ± 38491 ± 27447 ± 44
Ser227 ± 10214 ± 10200 ± 12
Asn71 ± 2 b58 ± 3 a63 ± 2 ab
Glu129 ± 8126 ± 9121 ± 8
Gln702 ± 25 b586 ± 17 a663 ± 22 ab
Ala473 ± 23449 ± 42412 ± 19
Cys33 ± 237 ± 336 ± 3
Met75 ± 3 ab80 ± 4 b68 ± 3 a
Tyr89 ± 5 c53 ± 3 a72 ± 3 b
Phe52 ± 347 ± 247 ± 2
Trp109 ± 3 b101 ± 2 a105 ± 2 ab
His52 ± 2 c39 ± 2 a45 ± 2 b
Serum amino acid concentrations in rats fed the casein diet group (Cas-cont), Alaska pollack protein diet group (APP), and casein supplemented with 0.44% arginine diet group (Cas-Arg) for 7 days are shown. Data are expressed as the mean ± SEM. Each group included 10 rats. Statistical analyses were performed using the Tukey–Kramer method. Values with different letters were significantly differences (p < 0.05).
Table 5. Effects of casein, Alaska pollack protein and casein supplemented with 0.44% arginine as dietary protein sources on free amino acid concentrations (μmol/L) of gastrocnemius muscle in Exp. 1.
Cas-ContAPPCas-Arg
Val225 ± 7 c147 ± 5 a204 ± 7 b
Leu110 ± 6 b85 ± 5 a104 ± 6 b
Ile87 ± 376 ± 483 ± 3
Arg65 ± 8 a196 ± 21 c139 ± 10 b
Gly1981 ± 79 a3294 ± 96 b1840 ± 87 a
Pro1068 ± 52 b269 ± 9 a971 ± 30 b
Lys600 ± 52 a852 ± 95 b617 ± 46 a
Asp192 ± 16150 ± 13161 ± 17
Thr1228 ± 891092 ± 431141 ± 84
Ser1041 ± 45 b770 ± 27 a924 ± 47 b
Asn304 ± 14 c173 ± 4 a257 ± 6 b
Glu907 ± 55755 ± 38903 ± 61
Gln5787 ± 216 b4217 ± 128 a5270 ± 137 a
Ala3013 ± 87 c2210 ± 65 a2566 ± 75 b
Cysn.d.n.d.n.d.
Met86 ± 287 ± 281 ± 3
Tyr102 ± 7 c55 ± 3 a83 ± 4 b
Phe49 ± 2 b41 ± 1 a49 ± 3 b
Trp23 ± 322 ± 421 ± 3
His213 ± 8 c124 ± 6 a180 ± 2 b
Tau7799 ± 2177910 ± 2587481 ± 251
Free amino acid concentrations of gastrocnemius muscle in rats in the casein diet group (Cas-cont), Alaska pollack protein diet group (APP), and casein supplemented with 0.44% arginine diet group (Cas-Arg) for 7 days are shown. Data are expressed as the mean ± SEM. Each group included 10 rats. Statistical analyses were performed using the Tukey–Kramer method. Values with different letters were significantly differences (p < 0.05).
Table 6. Effects of casein, Alaska pollack protein, and amino acid mixture, which has the same composition as Alaska pollack protein, as dietary protein sources on serum amino acid concentrations (μmol/L) in Exp. 2.
Cas-ContAPPA-APP
Val303 ± 24 b176 ± 6 a133 ± 7 a
Leu177 ± 18 b124 ± 5 a103 ± 9 a
Ile113 ± 11 b95 ± 3 b61 ± 5 a
Arg113 ± 6 a176 ± 13 b196 ± 18 b
Gly122 ± 5 a275 ± 8 b468 ± 21 c
Pro560 ± 26 c169 ± 6 a282 ± 26 b
Lys462 ± 16 a596 ± 50 a844 ± 71 b
Asp31 ± 534 ± 227 ± 4
Thr413 ± 13 a387 ± 21 a970 ± 113 b
Ser228 ± 13 a226 ± 5 a398 ± 20 b
Asn90 ± 5 c73 ± 2 b33 ± 2 a
Glu141 ± 15157 ± 7143 ± 11
Gln626 ± 27 b526 ± 23 a455 ± 14 a
Ala540 ± 37 a535 ± 40 a798 ± 43 b
Cys46 ± 2 a40 ± 3 a54 ± 2 b
Met86 ± 485 ± 180 ± 3
Tyr113 ± 12 b62 ± 2 a73 ± 7 a
Phe63 ± 4 b47 ± 1 a44 ± 2 a
Trp119 ± 7 b100 ± 5 ab85 ± 7 a
His55 ± 3 b43 ± 1 a61 ± 5 b
Serum amino acid concentrations in rats fed the casein diet group (Cas-cont), Alaska pollack protein diet group (APP), and amino acid mixture (which has the same composition as Alaska pollack protein) diet group (A-APP) for 7 days are shown. Data are expressed as the mean ± SEM. Each group included 6 rats. Statistical analyses were performed using the Tukey–Kramer method. Values with different letters were significantly differences (p < 0.05).
Table 7. Effects of casein, Alaska pollack protein, 1/3 or 1/9 sources replaced with Alaska pollack protein as dietary protein sources on serum amino acid concentrations (μmol/L) in Exp. 4.
Cas-contAPP1/3 APP1/9 APP
Val306 ± 9 a191 ± 14 c226 ± 5 bc245 ± 8 b
Leu189 ± 9 a131 ± 10 b137 ± 4 b143 ± 7 b
Ile127 ± 5 a102 ± 7 b99 ± 2 b98 ± 4 b
Arg117 ± 4 b179 ± 13 a127 ± 4 b103 ± 4 b
Gly135 ± 2 c245 ± 15 a168 ± 5 b137 ± 5 bc
Pro556 ± 16 a163 ± 12 d331 ± 10 c412 ± 15 b
Lys527 ± 28 ab582 ± 51 a482 ± 26 ab447 ± 22 b
Asp30 ± 329 ± 330 ± 329 ± 2
Thr508 ± 35513 ± 44474 ± 28466 ± 31
Ser243 ± 5215 ± 14215 ± 5211 ± 9
Asn96 ± 3 a68 ± 5 b74 ± 2 b75 ± 2 b
Glu171 ± 11158 ± 17156 ± 8151 ± 9
Gln666 ± 21 a469 ± 35 c571 ± 17 b588 ± 9 ab
Ala567 ± 14 a481 ± 37 b431 ± 8 b436 ± 13 b
Cys38 ± 138 ± 231 ± 434 ± 1
Met80 ± 2 ab86 ± 6 a75 ± 2 ab72 ± 2 b
Tyr104 ± 6 a65 ± 5 b81 ± 3 b81 ± 7 b
Phe65 ± 2 a50 ± 3 b55 ± 2 b54 ± 2 b
Trp128 ± 4114 ± 9115 ± 5112 ± 4
His69 ± 4 a41 ± 3 c54 ± 1 b55 ± 1 b
EAA2000 ± 61 a1810 ± 133 ab1717 ± 47 ab1691 ± 59 b
BCAA622 ± 22 a424 ± 31 b462 ± 11 b486 ± 19 b
Serum amino acid concentrations in rats fed the casein diet (Cas-cont) or the same diet in which all protein, one-third, or one-ninth sources were replaced with Alaska pollack protein (APP, 1/3 APP, and 1/9 APP, respectively) for 7 days are shown. Data are expressed as the mean ± SEM. Each group included 10 rats. Statistical analyses were performed using the Tukey–Kramer method. Values with different letters were significantly differences (p < 0.05). EAA, essential amino acids; BCAA, branched-chain amino acids.
Disclaimer/Publisher’s Note: The statements, opinions and data contained in all publications are solely those of the individual author(s) and contributor(s) and not of MDPI and/or the editor(s). MDPI and/or the editor(s) disclaim responsibility for any injury to people or property resulting from any ideas, methods, instructions or products referred to in the content.

