Article

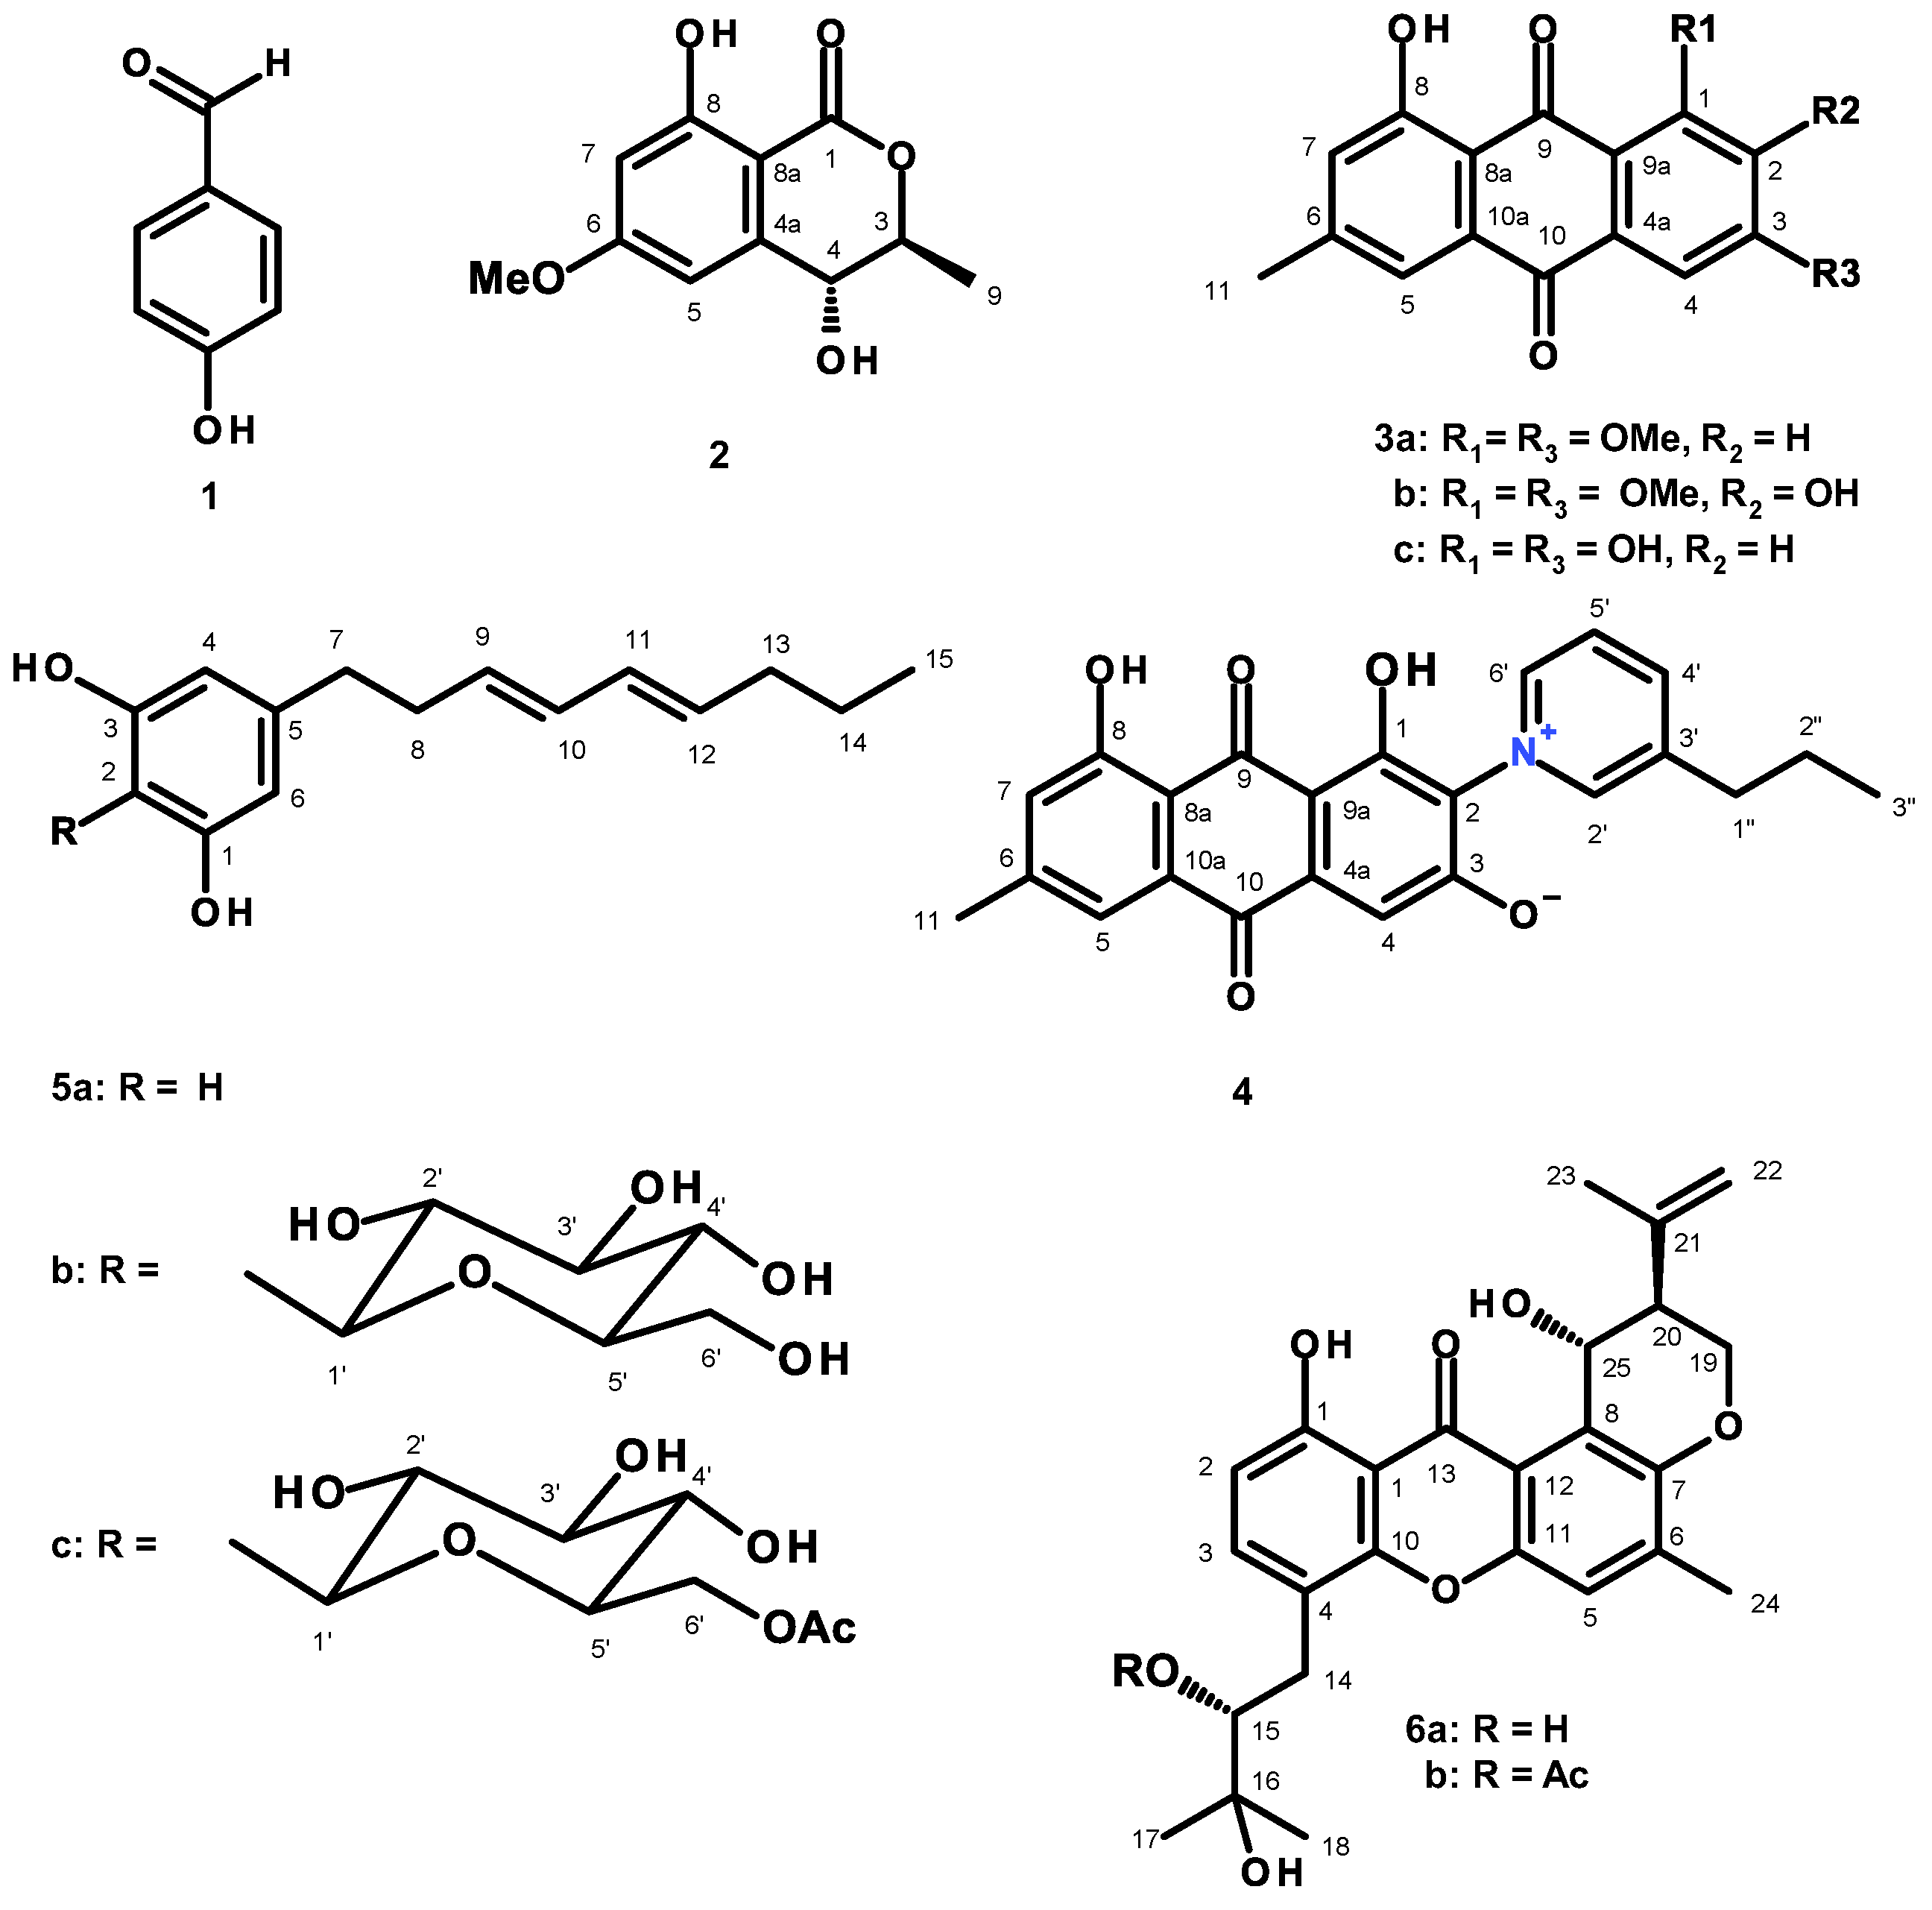
New Alkylpyridinium Anthraquinone, Isocoumarin, C-Glucosyl Resorcinol Derivative and Prenylated Pyranoxanthones from the Culture of a Marine Sponge-Associated Fungus, Aspergillus stellatus KUFA 2017

1
ICBAS-Instituto de Ciências Biomédicas Abel Salazar, Rua de Jorge Viterbo Ferreira, 228, 4050-313 Porto, Portugal
2
Interdisciplinary Centre of Marine and Environmental Research (CIIMAR), Terminal de Cruzeiros do Porto de Leixões, Av. General Norton de Matos s/n, 4450-208 Matosinhos, Portugal
3
Instituto de Biologia Molecular e Celular (i3S-IBMC), Universidade do Porto, Rua de Jorge Viterbo Ferreira, 228, 4050-313 Porto, Portugal
4
Department of Plant Pathology, Faculty of Agriculture, Kasetsart University, Bangkok 10240, Thailand
5
Department of Chemistry, University of Leicester, University Road, Leicester LE 7 RH, UK
6
Departamento de Química & QOPNA, Universidade de Aveiro, 3810-193 Aveiro, Portugal
7
FCUP-Faculty of Sciences, University of Porto, Rua do Campo Alegre, s/n, 4169-007 Porto, Portugal
*
Author to whom correspondence should be addressed.
Mar. Drugs 2022, 20(11), 672; https://doi.org/10.3390/md20110672
Submission received: 22 September 2022 / Revised: 25 October 2022 / Accepted: 26 October 2022 / Published: 27 October 2022
(This article belongs to the Special Issue Bioactive Secondary Metabolites of Marine Fungi)

Abstract

:
An unreported isocoumarin, (3S,4R)-4-hydroxy-6-methoxymellein (2), an undescribed propylpyridinium anthraquinone (4), and an unreported C-glucosyl resorcinol derivative, acetyl carnemycin E (5c), were isolated, together with eight previously reported metabolites including p-hydroxybenzaldehyde (1), 1,3-dimethoxy-8-hydroxy-6-methylanthraquinone (3a), 1,3-dimethoxy-2,8-dihydroxy-6-methylanthraquinone (3b), emodin (3c), 5[(3E,5E)-nona-3,5-dien-1-yl]benzene (5a), carnemycin E (5b), tajixanthone hydrate (6a) and 15-acetyl tajixanthone hydrate (6b), from the ethyl acetate extract of the culture of a marine sponge-derived fungus, Aspergillus stellatus KUFA 2017. The structures of the undescribed compounds were elucidated by 1D and 2D NMR and high resolution mass spectral analyses. In the case of 2, the absolute configurations of the stereogenic carbons were determined by comparison of their calculated and experimental electronic circular dichroism (ECD) spectra. The absolute configurations of the stereogenic carbons in 6a and 6b were also determined, for the first time, by X-ray crystallographic analysis. Compounds 2, 3a, 3b, 4, 5a, 5b, 5c, 6a, and 6b were assayed for antibacterial activity against four reference strains, viz. two Gram-positive (Staphylococcus aureus ATCC 29213, Enterococcus faecalis ATCC 29212) and two Gram-negative (Escherichia coli ATCC 25922, Pseudomonas aeruginosa ATCC 27853), as well as three multidrug-resistant strains. However, only 5a exhibited significant antibacterial activity against both reference and multidrug-resistant strains. Compound 5a also showed antibiofilm activity against both reference strains of Gram-positive bacteria.

1. Introduction

The genus Aspergillus (family Aspergillaceae) is one of the most extensively studied genera of filamentous fungi, mainly due to the medical relevance, food spoilage, and industrial application of some of its species. Aspergilli can grow in a wide range of niches, mainly in soils and on dead matter, but some are also capable of colonizing living animal or plant hosts. However, the increasing numbers of Aspergillus species have been found in different niches in the marine environment, from tropical waters [1] to the Arctic [2], and from shallow waters [3] to the deep-sea [4]. In total, approximately 350 Aspergillus species have been identified [5].
In the last two decades, marine-derived Aspergillus species have attracted tremendous attention from researchers working on marine natural products since they were responsible for a production of the highest numbers of marine fungal metabolites as demonstrated by two review articles, one covering the period of January 1992 to December 2014, reporting 512 metabolites, and another covering the period of 2015 to December 2020, which reported 361 compounds, isolated from marine-derived Aspergillus species [6]. It is also worth mentioning that the specialized metabolites produced by marine-derived Aspergillus species possess not only structural diversity such as indole alkaloids, diketopiperazine derivatives, meroterpenoids, anthraquinones, isocoumarins, xanthones, p-terphenyl derivatives, and peptides, but also a myriad of biological activities [6].
In our pursuit of antibiotic and antibiofilm compounds from marine-derived fungi from tropical seas, we focused our attention on the marine sponge-associated Aspergillus stellatus since this fungus has not been extensively investigated. A literature search revealed that a mycotoxin, asteltoxin, was isolated from toxic maize meal cultures of A. stellatus Curzi (MRC 277) [7]. In another work, Kamal et al. reported the isolation of tajixanthone, shamixanthone, ajamxanthone, shahenxanthone, najamxanthone, radixanthone, and mannitol from the mycelium of A. stellatus Curzi [8]. For this reason, we investigated secondary metabolites from the culture of A. stellatus KUFA 2017, isolated from a marine sponge, Mycale sp., which was collected from the coral reef at the Samaesan Island, in the Gulf of Thailand.
Fractionation of the ethyl acetate (EtOAc) extract of the culture A. stellatus KUFA 2017 by column chromatography of silica gel, followed by purification by preparative TLC, Sephadex LH-20 column and crystallization, led to the isolation of undescribed (3S,4R)-4-hydroxy-6-methoxymellein (2), stellatanthraquinone (4), and acetyl carnemycin E (5c), as well as the previously reported p-hydroxybenzaldehyde (1) [9], 1,3-dimethoxy-8-hydroxy-6-methylanthraquinone (3a) [10], 1,3-dimethoxy-2,8-dihydroxy-6-methylanthraquinone (3b) [11], emodin (3c) [12] and 5[(3E,5E)-nona-3,5-dien-1-yl]benzene (5a) [13], carnemycin E (5b) [13], tajixanthone hydrate (6a) [14,15], and 15-acetyl tajixanthone hydrate (6b) [16]. (Figure 1). The structures of the undescribed compounds were established on the basis of an extensive analysis of their 1D and 2D NMR as well as HRMS spectra. In the case of 2, the absolute configurations of their stereogenic carbons were established by comparison of their experimental and calculated electronic circular dichroism (ECD) spectra. Additionally, the absolute structures of tajixanthone hydrate (6a), and 15-acetyl tajixanthone hydrate (6b) were also unambiguously determined by X-ray analysis for the first time.

2. Results and Discussion

The structures of p-hydroxybenzaldehyde (1) [9], 1,3-dimethoxy-8-hydroxy-6-methylanthraquinone (3a) [10], 1,3-dimethoxy-2,8-dihydroxy-6-methylanthraquinone (3b) [11], emodin (3c) [12], 5[(3E,5E)-nona-3,5-dien-1-yl]benzene-1,3-diol (5a) [13], carnemycin E (5b) [13], tajixanthone hydrate (6a) [14,15], and 15-acetyl tajixanthone hydrate (6b) [16] were elucidated by the analysis of their 1D and 2D NMR spectra as well as HRMS data (Figures S1, S2, S9–23, S29–S38, S47–S56, S59 and S60, Tables S1–S3) and by the comparison of their NMR spectral data with those reported in the literature.
Compound 2 was isolated as white crystals (mp 116–118 °C), and its molecular formula C11H12O5 was established based on the (+)-HRESIMS m/z 225.0765 [M + H]+ (calculated for C11H13O5, 225.0763) (Figure S57), requiring six degrees of unsaturation. The 13C NMR spectrum (Table 1, Figure S4), exhibited eleven carbon signals, which in combination with DEPT and HSQC spectra (Figure S6), can be categorized as one conjugated ester carbonyl (δC 169.1), two oxygen-bearing non-protonated sp2 (δC 166.2 and 164.5), two non-protonated sp2 (δC 142.1 and 100.0), two protonated sp2 (δC 106.8 and 101.3), two oxymethine sp3 (δC 77.8 and 67.5), one methoxy (δC 55.8) and one methyl (δC 15.9) carbon, respectively. The 1H NMR spectrum (Table 1, Figure S3), in combination with the HSQC spectrum (Figure S6), displayed a singlet of the hydrogen-bonded hydroxyl proton at δH 11.20 (OH-8), a multiplet of a hydroxyl proton at δH 2.28 (OH-4), two doublets of meta-coupled aromatic protons at δH 6.48 (J = 2.3 Hz, H-5/δC 106.8) and δH 6.45 (J = 2.3 Hz, H-7/δC 101.3), a double quartet at δH 4.63 (J = 6.6, 2 Hz, H-3/δC 77.8), which was coupled with a double doublet at δH 4.50 (J = 5.6, 1.5 Hz, H-4/δC 67.5), a methoxy singlet at δH 3.85 (δC 55.8) and a methyl doublet at δH 1.55 (J = 6.6 Hz, Me-9/δC 15.9). The HMBC spectrum (Table 1, Figure S7) exhibited correlations from OH-8 to the carbons at δC 164.5 (C-8), 101.3 (C-7) and 100.0 (C-8a), H-5 to the carbons at δC 166.2 (C-6), C-7, C-8a, C-4, H-7 to C-5, C-6, C-8a, H-3 to Me-9, H-4 to C-4a (δC 142.1), C-5, C-8a, OMe-6 to C-6, Me-9 to C-3, C-4, and a weak correlation from OH-4 to C-3 and C-4.
The 1H and 13C NMR chemical shift values, together with COSY and HMBC correlations, revealed that the planar structure of 2 is the same as that of the enantiomeric mixture of (3R,4R)- and (3S,4S)-4-hydroxy-6-methoxymellein, previously isolated from the culture extract of the mycobionts of Graphis sp. Since the mixture showed a negative sign of Cotton effect at 267 nm, the authors proposed that the (3R,4R)-enantiomer was predominant [17]. Surprisingly, the NOESY spectrum (Table 1, Figure S8) of 2 exhibited a strong correlation from H-4 to Me-9, but not from H-3 to H-4, suggesting that H-4 and Me-9 are on the same face, which is contrary to (3R,4R)- and (3S,4S)-4-hydroxy-6-methoxymellein where H-3 and H-4 are on the same face.
The absolute configurations of C-3 and C-4 were thus determined by comparison of the experimental ECD spectrum with a quantum-mechanically simulated spectrum derived from the most significant conformations of the computational models of (3S,4R)-2 and (3R,4S)-2 (Figure 2). Figure 3 shows a very good match between the experimental ECD spectrum and the calculated ECD spectrum for (3S,4R)-2, thus confirming that 2 is (3S,4R)-4-hydroxy-6-methoxymellein. Compound 2 is, therefore, a diastereomer of (3R,4R)- and (3S,4S)-4-hydroxy-6-methoxymellein [17] and has never been previously reported.
Compound 4 was isolated as a red solid (mp. 228–229 °C), and its molecular formula C23H19NO5 was established on the basis of (+)-HRESIMS m/z 390.1340 [M + H]+ (calculated for C23H20NO5, 390.1341) (Figure S58), requiring fifteen degrees of unsaturation. The 13C NMR spectrum (Table 2, Figure S25) displayed 23 carbon signals which, in combination with DEPT and HSQC spectra (Figure S27), can be classified as two conjugated ketone carbonyls (δC 184.5 and 183.3), three oxygen-bearing non-protonated sp2 (δC 171.9, 161.2, 159.5), seven non-protonated sp2 (δC 146.7, 142.8, 134.4, 133.2, 123.2, 114.6, 100.0), seven protonated sp2 (δC 147.2, 146.2, 145.6, 127.5, 124.4, 120.4, and 118.6), two methylene sp3 (δC 33.8 and 23.7), and two methyl (δC 21.9 and 13.7) carbons. The 1H NMR spectrum (Table 2, Figure S24) showed two singlets of hydrogen-bonded phenolic hydroxyls at δH 12.50 and 13.44, seven aromatic protons appearing as a broad singlet at δH 8.91, two singlets at δH 7.11 and 6.80, three doublets at δH 8.57 (J = 8.0 Hz), 8.85 (J = 6.1 Hz), 7.46 (J = 1.0 Hz), one double doublet at δH 8.16 (J = 8.0, 6.1 Hz), one methylene triplet at δH 2.83 (J = 7.4 Hz), one methylene sextet at δH 1.70 (J = 7.4 Hz), one methyl singlet at δH 2.40, and one methyl triplet at δH 0.94 (J = 7.3 Hz). The presence of the 1,8-dihydroxy-6-methyl-1,2,3,6,8-pentasubstitututed anthraquinone scaffold was supported by COSY correlations (Table 2, Figure 4 and Figure S26) from H-7 (δH 7.11, s/δC 124.4) to H-5 (7.46, d, J = 1.0 Hz)/δC 120.4) and Me-11 (2.40, s/ δC 21.9), as well as by HMBC correlations (Table 2, Figure 4 and Figure S28) from OH-1 (δH 13.44, s) to C-1 (δC 159.5), C-2 (δC 123.2), C-9a (δC 100.0), OH-8 (δH 12.50, s) to C-7 (δC 124.4), C-8 (δC 161.2), C-8a (δC 114.6), H-5 (δH 7.46, d, J = 1.0 Hz) to C-10 (δC 183.3), C-7, C-8a, Me-11 (δC 21.9), H-7 (δH 7.11, s) to C-8, C-5 (δC 120.4), C-8a, Me-11, H-4 (δH 6.80,s) to C-10, C-2 (δC 123.2), and C-9a. That another portion of the molecule is 3-propylpyridinium was corroborated by COSY correlations (Table 2, Figure 4 and Figure S26) from H-4’ (δH 8.57, d, J = 8.0 Hz) to H-5’ (δH 8.16, dd, J = 8.0, 6.1 Hz) and H-2’ (δH 8.91, brs), H-5’ to H-4’ and H-6’ (8.85, d, J = 6.1 Hz), which was confirmed by HMBC correlations (Table 2, Figure 4 and Figure S28) from H-2’ to C-3’ (δC 142.8), C-4’ (δC 146.2) and C-1” (δC 33.8), H-4’ to C-2’ (δC 147.2), C-6’ (δC 145.6) and C-1”, H-5’ to C-3’, and C-6’ and H-6’ to C-4’ and C-5’ [18]. That the propyl group was on C-3’ of the pyridinium ring was supported by the spin system from H2-1” (δH 2.83, t, J = 7.4 Hz/δC 33.8) through H2-2” (δH 1.70, sex, J = 7.4 Hz/δC 23.7) to H3-3” (δH 0.94, t, J = 7.4 Hz/δC 13.7) as well as by HMBC correlations from H-3” to C-1” and C-2”, H-2” to C-1”, and C-3” and C-2’. Since H-2’ and H-6’ showed strong and weak cross peaks, respectively, to C-2 (Table 2, Figure 4 and Figure S28), the 3-propylpyridinium moiety is linked to the anthraquinone scaffold through the nitrogen atom for the former and C-2 of the latter.
Since 1,8-dihydroxy-6-methyl anthraquinone and the 3-propylpyridinium moiety account for C23H19NO4, the only oxygen atom left must be on C-3 of the anthraquinone nucleus to produce a molecular formula C23H19NO5. Therefore, the oxygen atom on C-3 should bear a negative charge (4). This was supported by a high chemical shift value of C-3 (δC 171.9). This phenoxide ion can establish an ionic interaction with the positive-charged nitrogen of the pyridinium ring. Interestingly, although alkyl pyridinium-containing compounds have never been reported from marine-derived fungi, cyclic 3-alkylpyridinium alkaloids are common secondary metabolites from sponges of the order Haplosclerida [19,20]. Therefore, 4 is the first 3-alkylpyridinium anthraquinone reported from nature, and it was named stellatanthraquinone.
Compound 5b was isolated as a pale-yellow viscous mass, and its molecular formula C21H30O7 was established on the basis of the (+)-HRESIMS m/z 395.2076 [M + H]+ (calculated for C21H31O7, 395.2070 (Figure S60), requiring seven degrees of unsaturation. Analysis of its 1H, 13C NMR, DEPT, COSY, HSQC, and HMBC spectra (Table 3, Figures S34–S38) revealed the presence of a 5 [(3E,5E)-nona-3,5-dien-1-yl]benzene-1,3-diol moiety, identical to 5a, with a substitution on C-2. The presence of five oxymethine sp3 (δC 81.5, 79.1, 75.0, 72.1, 70.3), one oxymethylene sp3 (δC 61.2) carbons, two hydroxyl groups at δH 4.90 dd (J = 10.7, 2.9 Hz) and 4.59 d (J = 5.5 Hz), and the molecular formula C6H11O5 of the substituent on C-2 revealed the presence of a pyranosyl moiety. However, since four oxymethine protons of the sugar moiety appeared as complex multiplets at δH 3.20–3.22 and 3.74, it was not possible to identify the sugar moiety of 5b. Although Wen et al. [13] identified the sugar moiety in carnemycin E as glucopyranosyl, it was not possible to compare its 1H and 13C chemical shift values with those of the sugar moiety 5b since the 1H and 13C NMR spectra of carnemycin E were obtained in pyridine-d5, while those of 5b were obtained in DMSO-d6. Moreover, carnemycin E was obtained as an amorphous reddish gum, while 5b was obtained as a pale-yellow viscous mass. In order to unravel the identity of the sugar moiety in 5b, we tried to compare its carbon chemical shift values with those of the C-glycosides from the 13C NMR spectra obtained in DMSO-d6. The chemical shift values of C-1’, C-2’, C-3’, C-4’, C-5’ and C-6’ of the sugar moiety of 5b (Table 3, Figure S36) were nearly identical to those of C-glucosyl moiety of tricetin 6,8-di-C-glucoside [21]. Moreover, the chemical shift value and coupling constant of H-1’ were also identical with those of the corresponding proton in tricetin 6,8-di-C-glucoside [21]. The value of the coupling constant of H-1’ (J = 9.6 Hz) confirmed the presence of a β-d-glucopyranosyl moiety. Therefore, 5a was elucidated as carnemycin E, previously isolated from the culture extract of Aspergillus sp., which was isolated from superficial mycobiota of the brown alga, Saccharina cichorioides f. sachalinensis, collected from the South China Sea [13].
Compound 5c was also isolated as a pale-yellow viscous mass and its molecular formula C23H32O8 was established on the basis of the (+)-HRESIMS m/z at 437.2175 [M + H]+ (calculated for C23H33O8, 437.2175), and m/z 459.1989 [M + Na]+ (calculated for C23H32O8Na, 459.1995) (Figure S61).The 1H and 13C NMR spectra of 5c (Table 4; Figures S39 and S40) resembled those of 5b (Table S2 and Figures S34 and S35) except for CH2-6’, which appeared at higher frequencies (δH 4.32 d, J = 11.6 Hz, and 3.98 dd, J = 11.6, 3.9 Hz/δC 64.8) than those of 5b (δH 3.50, dd, J = 11.0, 5.5 Hz, and 3.65, dd, J = 11.0, 5.2 Hz)/δC 61.2) as well as the appearance of an acetyl group (δH 2.00, s/δC 21.2, CH3; δC 170.9, CO), suggesting that 5c is a C-21 acetate of 5b.
Contrary to other proton signals, the signals of OH-3, OH-3’, and OH-4’ appeared as broad signals in the 1H NMR spectrum at 500 MHz (Figure S39). Moreover, they did not show any COSY and HMBC correlations with any protons (Table 4, Figures S41 and S43), which made it impossible to assign them. Interestingly, in the 1H NMR spectrum at 300 MHz (Figure S44), the signal of OH-3 appeared as a sharp singlet at δH 8.70, whereas those of OH-3’ and OH-4’ appeared as two well-resolved doublets at δH 4.59, d (J = 6.5 Hz) and 5.15, d (J = 4.4 Hz), respectively. Furthermore, in the 300 MHz spectra, OH-3 displayed HMBC correlations to C-2 (δC 109.9) and C-3 (δC 157.2) (Figure S46), while OH-3’ and OH-4’ showed COSY correlations to H-3’ (δH 3.20) and H-4’ (δH 3.18) (Figure S45), respectively. The coupling constant of H-1’ (J = 9.8 Hz) confirmed the β-anomer of the glucosyl moiety. Since 5c has never been previously reported, it was named acetyl carnemycin E
The 1H and 13C NMR spectra of 6a and 6b (Table S3. Figures S47, S48, S52 and S53) are in agreement with those reported for tajixanthone hydrate [14] and 15-acetyl tajixanthone hydrate [16]. However, Pornpakakul et al. [14] assigned the configurations of C-15, C-20 and C-25 of tajixanthone hydrate, based on the coupling constant between H-14 and H-15 and NOESY correlations of the protons in tajixanthone methanoate, and also referred its stereochemistry to the previous study by Chexal et al. [22], who elegantly determined the absolute configurations of C-15 and C-25 of tajixanthone as 15S and 25R by chemical transformation (the method of Boar and Damps) while the relative configuration of C-20 was suggested by the preferred axial conformation of the isopropyl substituent in the hydrogenated derivatives [22]. Later on, the same group [23], described the isolation of tajixanthone hydrate which they obtained in a small quantity. The structure and stereochemistry of tajixanthone hydrate were identified on the basis of the same optical rotation of the acid-catalyzed hydrolysis product of tajixanthone and of the natural product. On the other hand, the absolute stereochemistry of 15-acetyl tajixanthone hydrate was concluded to be the same as that of tajixanthone hydrate, which was obtained by hydrolysis of 15-acetyl tajixanthone hydrate. However, neither optical rotation nor absolute configurations of their stereogenic carbons were provided [16].
Literature search revealed that the absolute configurations of C-15, C-20, and C-25 of both tajixanthone hydrate and 15-acetyl tajixanthone hydrate have never been established by either X-ray crystallographic or chiroptical methods. Fortunately, we were able to obtain suitable crystals of both 6a and 6b for X-ray analysis using an X-ray diffractometer equipped with CuKα radiation. The Ortep views of 6a and 6b are shown in Figure 5A and Figure 5B, respectively, revealing that the absolute configurations of C-15, C-20, and C-25 in both compounds are 15S, 20S, and 25R. Moreover, both compounds are levorotatory.
The antimicrobial activity of 2, 3a, 3b, 4, 5a, 5b, 5c, 6a, and 6b was evaluated against four reference bacterial species and three multidrug-resistant strains. However, only 5a exhibited antibacterial activity against all Gram-positive strains, viz. E. faecalis ATCC 29212, vancomycin-resistant E. faecalis B3/101, and methicillin-resistant S. aureus 74/24, with a MIC value of 16 µg/mL, and S. aureus ATCC 29213, with a MIC value of 32 µg/mL (Table 5). The minimal bactericidal concentration (MBC) for 5a was equal to or one-fold higher than the MIC, indicating its bactericidal effect towards E. faecalis ATCC 29212, S. aureus 74/24, and S. aureus ATCC 29213. For E. faecalis B3/101, its MBC was more than two-fold higher than the MIC, suggesting its bacteriostatic effect.
Although 5a was found to significantly inhibit NO production in lipopolysaccharide (LPS)-induced murine macrophage RAW264.7 cells [13], this compound has never been tested for antibacterial acivity. Interestingly, some alkenylresorcinols, such as 9-(3,5-dihydroxy-4-methylphenyl)nona-3(Z)-enoic acid, isolated from the methanolic extract of fruits of Hakea sericea, significantly inhibited the growth of E. faecalis, Listeria monocytogenes and Bacillus cereus, and showed good MIC values against S. aureus strains, including the clinical isolates and MRSA strains [24]. Intriguingly, 5b and 5c, analogs of 5a which possess a β-glucosyl moiety on C-2 of the benzene ring, were void of antibacterial activity in our assays. We speculate that the polar and bulky glucosyl moiety might have negatively affected the antibacterial activity, possibly by preventing the compounds from penetrating the bacterial cell wall.
Another interesting aspect is that even though there were several reports on the antibaterial activity of anthraquinones from marine-derived fungi [25], neither of the three anthraquinones tested, i.e., 3a, 3b, and 4, showed antibacterial activity in our assays. This is not surprising since we also found in our previous report that the anthraquinone purnipurdin A, isolated from the culture extract of the marine sponge-associated fungus, Neosartorya spinosa KUFA 1047, did not exhibit any antibacterial activity against the same bacterial strains tested [26].
Compounds 2, 3a, 3b, 4, 5a, 5b, 5c, 6a, and 6b were also investigated for their potential synergy with clinically relevant antibiotics on multidrug-resistant strains, by both disk diffusion method and checkerboard assay; however, no interactions were found with cefotaxime (ESBL E. coli), methicillin (MRSA S. aureus), and vancomycin (VRE E. faecalis).
The inhibitory effect of 2, 3a, 3b, 4, 5a, 5b, 5c, 6a, and 6b on biofilm production was also evaluated in all reference strains. However, only 5a showed an extensive ability to significantly inhibit biofilm formation in two of the four reference strains used in this study (Table 6). Indeed, 5a was able to completely inhibit biofilm formation in S. aureus ATCC 29213 and E. faecalis ATCC 29212, at both MIC and 2xMIC concentrations.

3. Experimental Sections

3.1. General Experimental Procedures

The melting points were determined on a Stuart Melting Point Apparatus SMP3 (Bibby Sterilin, Stone, Staffordshire, UK) and are uncorrected. Optical rotations were measured on an ADP410 Polarimeter (Bellingham + Stanley Ltd., Tunbridge Wells, Kent, UK). 1H and 13C NMR spectra were recorded at ambient temperature on a Bruker AMC instrument (Bruker Biosciences Corporation, Billerica, MA, USA) operating at 300 or 500 and 75 or 125 MHz, respectively. High resolution mass spectra were measured with a Waters Xevo QToF mass spectrometer (Waters Corporations, Milford, MA, USA) coupled to a Waters Aquity UPLC system. A Merck (Darmstadt, Germany) silica gel GF254 was used for preparative TLC, and a Merck Si gel 60 (0.2–0.5 mm) was used for column chromatography. LiChroprep silica gel and Sephadex LH 20 were used for column chromatography.

3.2. Fungal Material

The fungus was isolated from the marine sponge Mycale sp., which was collected by scuba diving at a depth of 5–10 m, from the coral reef at Samaesan Island (12°34′36.64″ N 100°56′59.69″ E), in the Gulf of Thailand, Chonburi province, in May 2015. The sponge was washed with 0.01% sodium hypochlorite solution for 1 min, followed by sterilized seawater three times, and then dried on a sterile filter paper under a sterile aseptic condition. The sponge was cut into small pieces (ca. 5 × 5 mm) and placed on Petri dish plates containing 15 mL potato dextrose agar (PDA) medium mixed with 300 mg/L of streptomycin sulfate and incubated at 28 °C for 7 days. The hyphal tips emerging from sponge pieces were individually transferred onto a PDA slant and maintained as pure cultures at Kasetsart University Fungal Collection, Department of Plant Pathology, Faculty of Agriculture, Kasetsart University, Bangkok, Thailand. The fungal strain KUFA 2017 was identified as Aspergillus stellatus, based on morphological characteristics such as colony growth rate and growth pattern on standard media, namely Czapek′s agar, Czapek yeast autolysate agar, and malt extract agar. Microscopic characteristics including size, shape, and ornamentation of conidiophores and spores were examined under light microscope. This identification was confirmed by molecular techniques using internal transcribed spacer (ITS) primers. DNA was extracted from young mycelia following a modified Murray and Thompson method [27]. Primer pairs ITS1 and ITS4 were used for ITS gene amplification [28]. PCR reactions were conducted on Thermal Cycler and the amplification process consisted of initial denaturation at 95 °C for 5 min, 34 cycles at 95 °C for 1 min (denaturation), at 55 °C for 1 min (annealing), and at 72 °C for 1.5 min (extension), followed by final extension at 72 °C for 10 min. PCR products were examined by Agarose gel electrophoresis (1% agarose with 1× Tris-Borate-EDTA (TBE) buffer) and visualized under UV light after staining with ethidium bromide. DNA sequencing analyses were performed using the dideoxyribonucleotide chain termination method [29] by Macrogen Inc. (Seoul, South Korea). The DNA sequences were edited using FinchTV software and submitted to the BLAST program for alignment and compared with that of fungal species in the NCBI database (http://www.ncbi.nlm.nih.gov/, accessed on 18 May 2021). Its gene sequences were deposited in GenBank with the accession number MZ331807.

3.3. Extraction and Isolation

The fungus was cultured in five Petri dishes (i.d. 90 mm) containing 20 mL of PDA per dish at 28 °C for one week. The mycelial plugs (5 mm in diameter) were transferred to two 500 mL Erlenmeyer flasks containing 200 mL of potato dextrose broth (PDB), and incubated on a rotary shaker at 120 rpm at 28 °C for one week. Thirty 1000 mL Erlenmeyer flasks, each containing 300 g of cooked rice, were autoclaved at 121 °C for 15 min. After cooling to room temperature, 20 mL of mycelial suspension of the fungus was inoculated per flask and incubated at 28 °C for 30 days, after which 500 mL of EtOAc was added to each flask of the moldy rice and macerated for 7 days, and then filtered with Whatman No. 1 filter paper.
The EtOAc solutions were combined and concentrated under reduced pressure to yield 280.4 g of a crude EtOAc extract, which was dissolved in 300 mL of CHCl3, washed with H2O (3 × 500 mL) and dried with anhydrous Na2SO4, and filtered and evaporated under reduced pressure to obtain 134.9 g of a crude CHCl3 extract. The crude CHCl3 extract (57.1 g) was applied on a silica gel column (385 g) and eluted with mixtures of petrol-CHCl3 and CHCl3-Me2CO, wherein 250 mL fractions (frs) were collected as follows: frs 1–61 (petrol-CHCl3, 1:1), 62–129 (petrol-CHCl3, 3:7), 130–231 (petrol-CHCl3, 1:9), 232–397 (CHCl3-Me2CO, 9:1), 398–524 (CHCl3-Me2CO, 7:3). Frs 40–45 were combined (241.9 mg) and applied over a Sephadex LH-20 column (15 g), and eluted with MeOH, wherein 37 subfractions (sfrs) of 2 mL were collected. Sfrs 30–35 were combined (102.9 mg) and precipitated in MeOH to produce 13.6 mg of 3a. Frs 74–77 were combined (851.6 mg) and precipitated in Me2CO to produce 20.3 mg of 3b. Frs 78–89 were combined (396.5 mg) and applied over a Sephadex LH-20 column (15 g), and eluted with MeOH, wherein 28 sfrs of 2 mL were collected. Sfrs 21–25 were combined to produce 11.4 mg of 3c. Frs 95–118 were combined (535.5 mg) and applied over a Sephadex LH-20 column (15 g), and eluted with MeOH, wherein 47 sfrs of 2 mL were collected. Sfrs 16–33 were combined (231.4 mg) and applied over another Sephadex LH-20 column (5 g), and eluted with CHCl3, wherein 22 sub-subfractions (ssfrs) of 1 mL were collected. Ssfrs 9–10 were combined to produce 69.4 mg of 2, while ssfrs 20–22 were combined to produce 45.0 mg of 1. Frs 126–140 were combined (274.9 mg) and applied over a Sephadex LH-20 column (15 g), and eluted with MeOH, wherein 31 sfrs of 2 mL were collected. Sfrs 4–15 were combined (108.4 mg) and precipitated in Me2CO to produce 26.7 mg of 6b. Frs 149-173 were combined (1.02 g) and applied over a Sephadex LH-20 column (15 g), and eluted with MeOH, wherein 49 sfrs of 1 mL were collected. Sfrs 20–28 were combined (305.2 mg) and applied over another Sephadex LH-20 column (5 g), and eluted with CHCl3, wherein 20 ssfrs of 0.5 mL were collected. Ssfrs 15–19 were combined to produce 153.0 mg of 5a. Frs 178–206 were combined (509.4 mg) and precipitated in MeOH to produce 46.8 mg of 6a. Frs 237–238 were combined (209.3 mg) and applied over a Sephadex LH-20 column (15 g), and eluted with MeOH, wherein 20 sfrs of 2 mL were collected. Sfrs14-20 were combined (182.4 g) and applied over another Sephadex LH-20 column (5 g), and eluted with CHCl3, wherein 13 ssfrs of 1 mL were collected. Ssfrs 8–9 were combined to produce 7.3 mg of 5c. Frs 437-455 were combined (323.3 mg) and applied over a Sephadex LH-20 column (15 g), and eluted with MeOH, wherein 24 sfrs of 2 mL were collected. Sfrs 11–15 were combined (211.9 mg) and applied over another Sephadex LH-20 column (5 g), and eluted with CHCl3, wherein 18 ssfrs of 0.5 mL were collected. Ssfrs 17–18 were combined to produce 141.7 mg of 5b. Frs 460–513 were combined (297.3 mg) and applied over a Sephadex LH-20 column (15g), and eluted with MeOH, wherein 25 sfrs of 2 mL were collected. Sfrs 15–18 were combined (20.9 mg) and applied over another Sephadex LH-20 column (5 g), and eluted with CHCl3, wherein 13 ssfrs of 0.5 mL were collected. Ssfrs 4–7 were combined to produce 5.6 mg of 4.

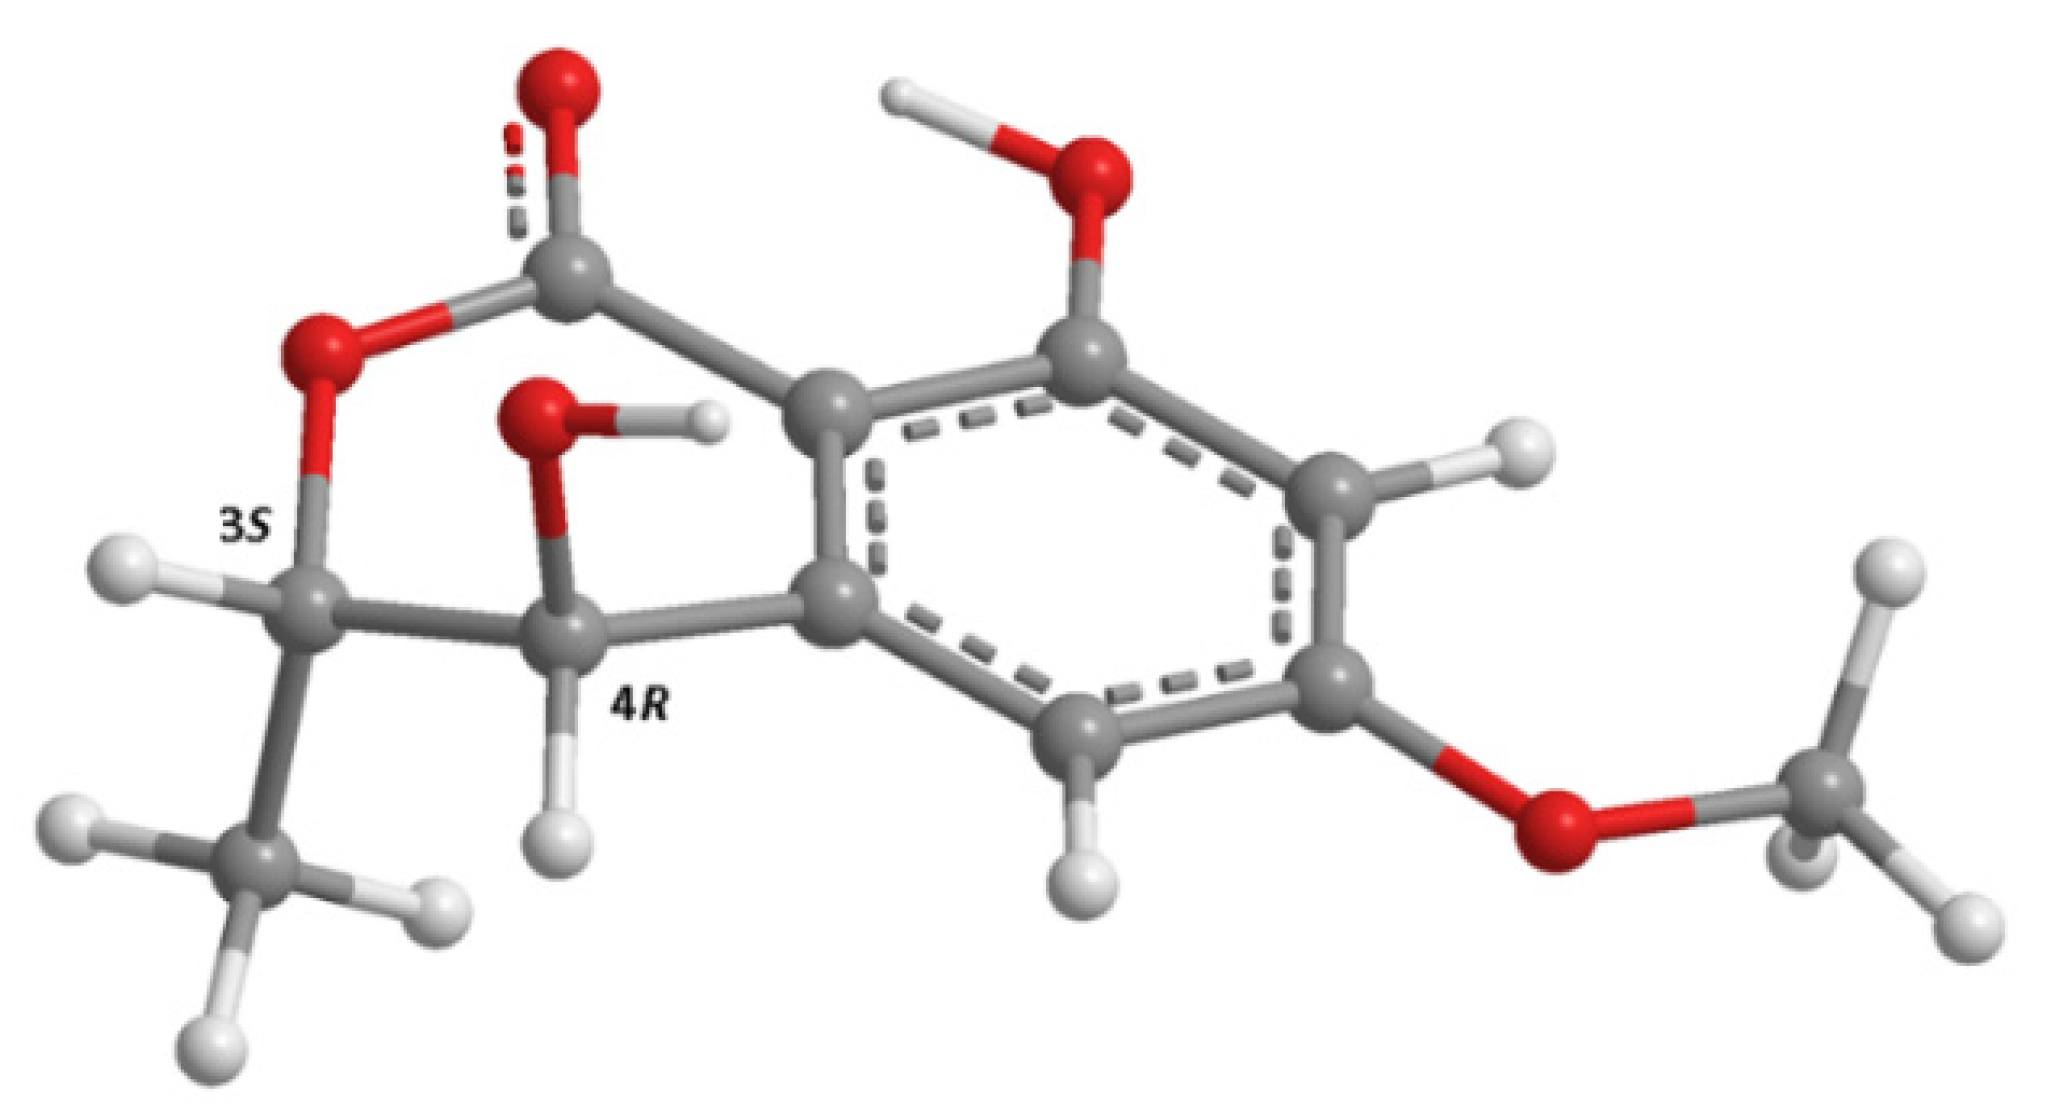
3.3.1. (3S,4R)-4-Hydroxy-6-Methoxymellein (2)

White crystal. Mp 116–118 °C. [α ] D 23 −200 (c 0.05, MeOH); For 1H and 13C spectroscopic data (CDCl3, 300 and 75 MHz), see Table 1; (+)-HRESIMS m/z 225.0765 [M + H]+ (calculated for C11H13O5, 225.0763).

3.3.2. Stellatanthraquinone (4)

Red solid. Mp. 228–229 °C. For 1H and 13C spectroscopic data (DMSO-d6, 500 and 125 MHz), see Table 2; (+)-HRESIMS m/z 390.1340 [M + H]+ (calculated for C23H20NO5, 390.1341).

3.3.3. Carnemycin E (5b)

Pale-yellow viscous mass. [α]20D +60 (c 0.05, MeOH). 1H and 13C spectroscopic data (DMSO-d6, 300 and 75 MHz), see Table 3; (+)-HRESIMS m/z 395.2076 [M + H]+ (calculated for C21H331O7, 395.2070).

3.3.4. Acetyl Carnemycin E (5c)

Pale-yellow viscous mass. [α]20D +260 (c 0.05, MeOH). 1H and 13C spectroscopic data (DMSO-d6, 500 and 125 MHz), see Table 4; (+)-HRESIMS m/z 437.2175 [M + H]+, (calculated for C23H33O8, 437.2175); m/z 459.1989 [M + Na]+ (calculated for C23H32O8Na, 459.1995).

3.4. X-ray Crystal Structures

Single crystals were mounted on cryoloops using paratone. X-ray diffraction data were collected at 290 K with a Gemini PX Ultra equipped with CuKα radiation (λ = 1.54184 Å). The structures were solved by direct methods using SHELXS-97 and refined with SHELXL-97 [30]. Non-hydrogen atoms were refined anisotropically. Hydrogen atoms were either placed at their idealized positions using appropriate HFIX instructions in SHELXL and included in subsequent refinement cycles or were directly found from difference Fourier maps and were refined freely with isotropic displacement parameters.

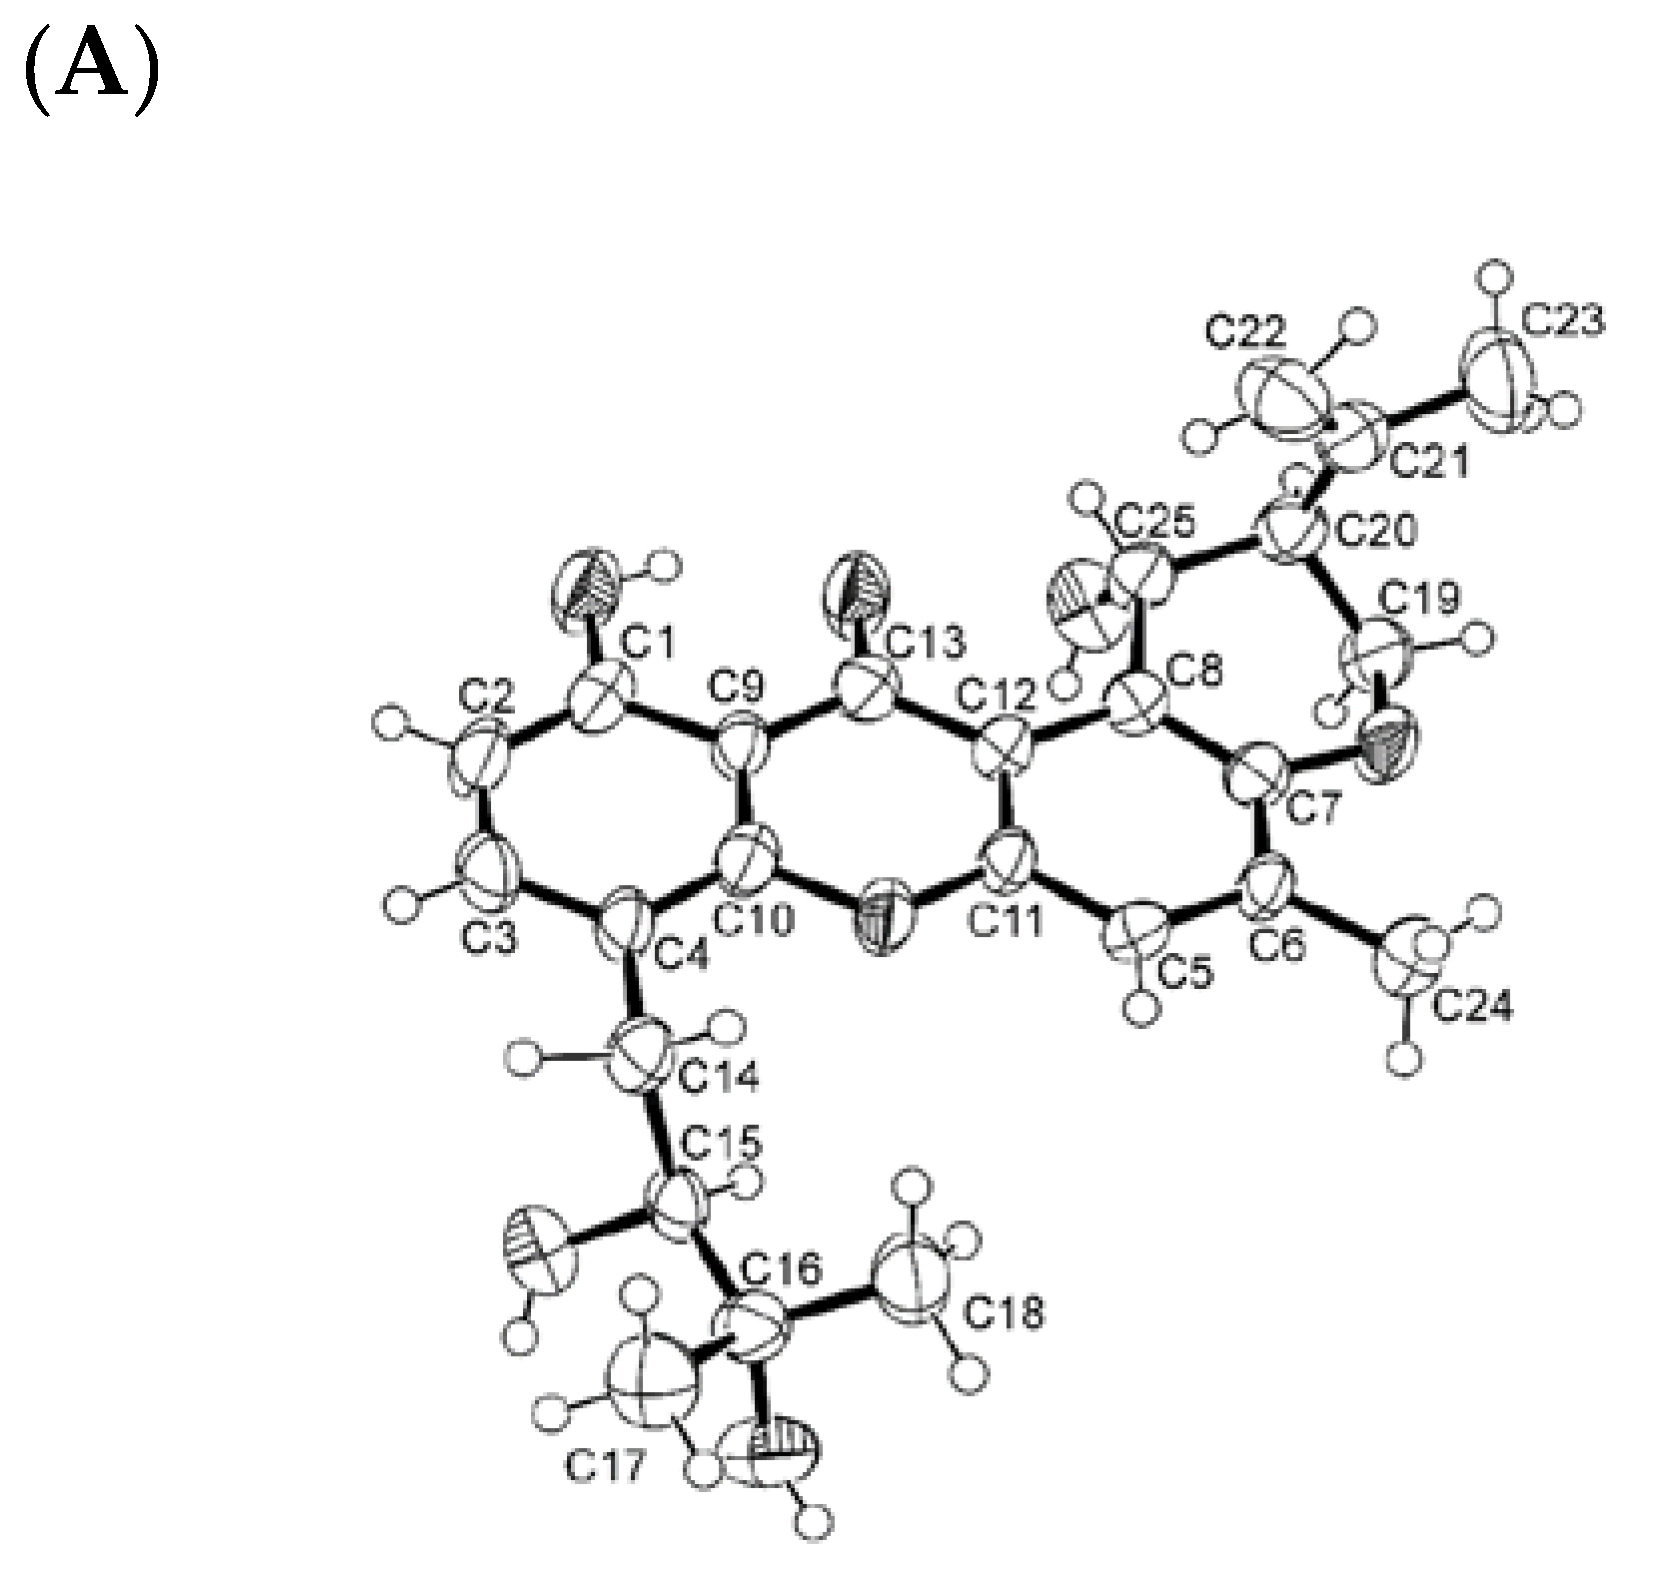
3.4.1. X-ray Crystal Structure of 6a

Crystal was orthorhombic, space group P212121, cell volume 2178.1(4) Å3 and unit cell dimensions a = 6.2933(5) Å, b = 17.9862(18) Å and c = 19.243(3) Å (uncertainties in parentheses). Flack x [31] was refined parameter by means of TWIN and BASF in SHELXL to 0.0(5). The refinement converged to R (all data) = 8.88% and wR2 (all data) = 17.80%. Full details of the data collection and refinement and tables of atomic coordinates, bond lengths and angles, and torsion angles have been deposited with the Cambridge Crystallographic Data Centre (CCDC 2206108).

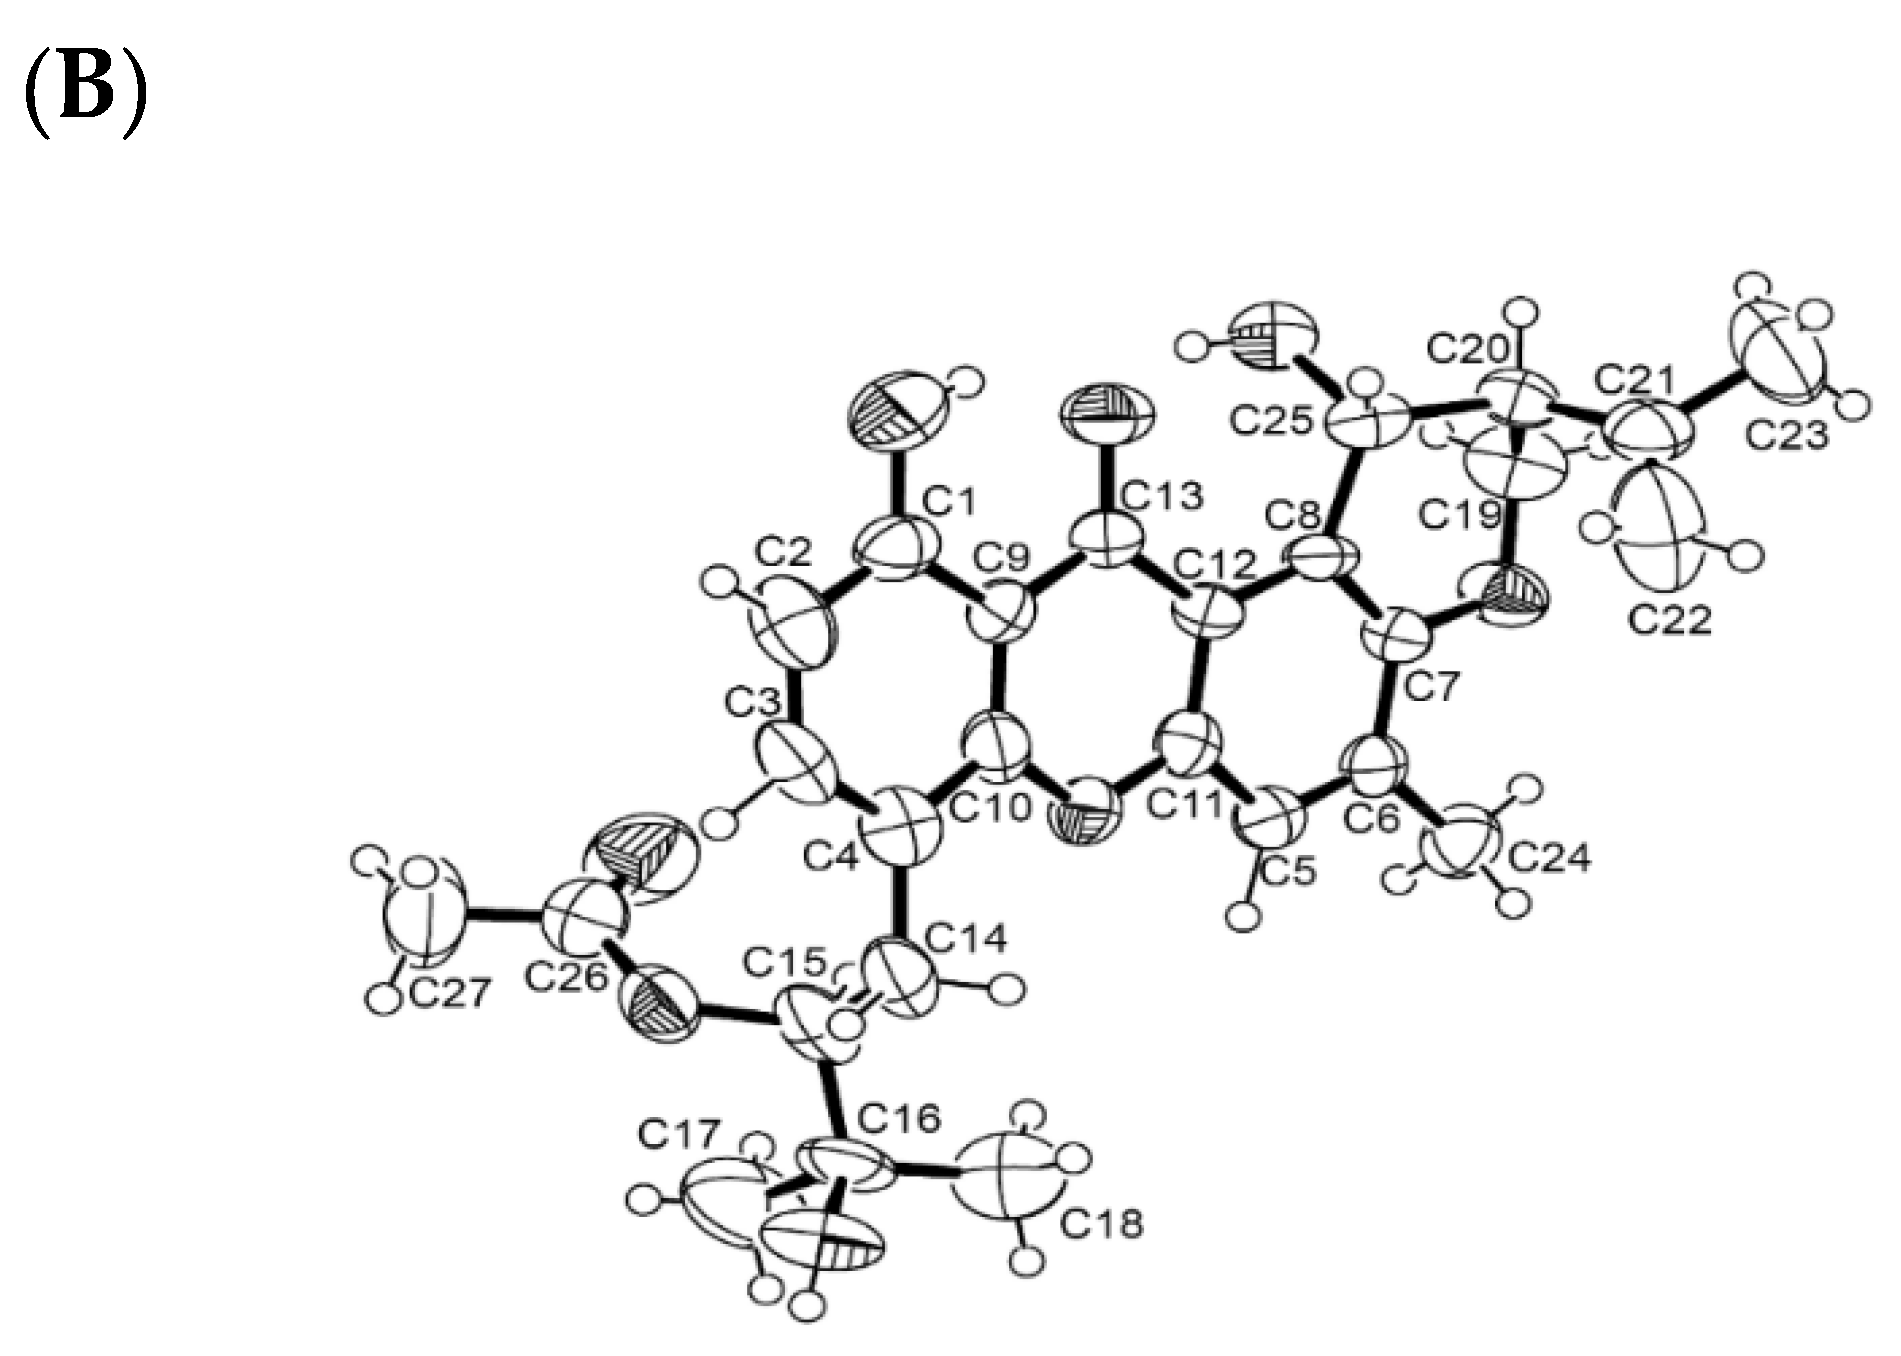
3.4.2. X-ray Crystal Structure of 6b

The crystal was orthorhombic, space group P212121, cell volume 2454.0(4) Å3, and unit cell dimensions a = 5.9772(6) Å, b = 13.8321(13) Å and c = 29.682(2) Å (uncertainties in parentheses). Calculated crystal density was 1.306 g/cm−3. The structure was solved by direct methods using SHELXS-97 and refined with SHELXL-97 [30]. The refinement converged to R (all data) = 8.45% and wR2 (all data) = 12.84% and Flack parameter = 0.0(3). Full details of the data collection and refinement and tables of atomic coordinates, bond lengths and angles, and torsion angles have been deposited with the Cambridge Crystallographic Data Centre (CCDC 2204631).

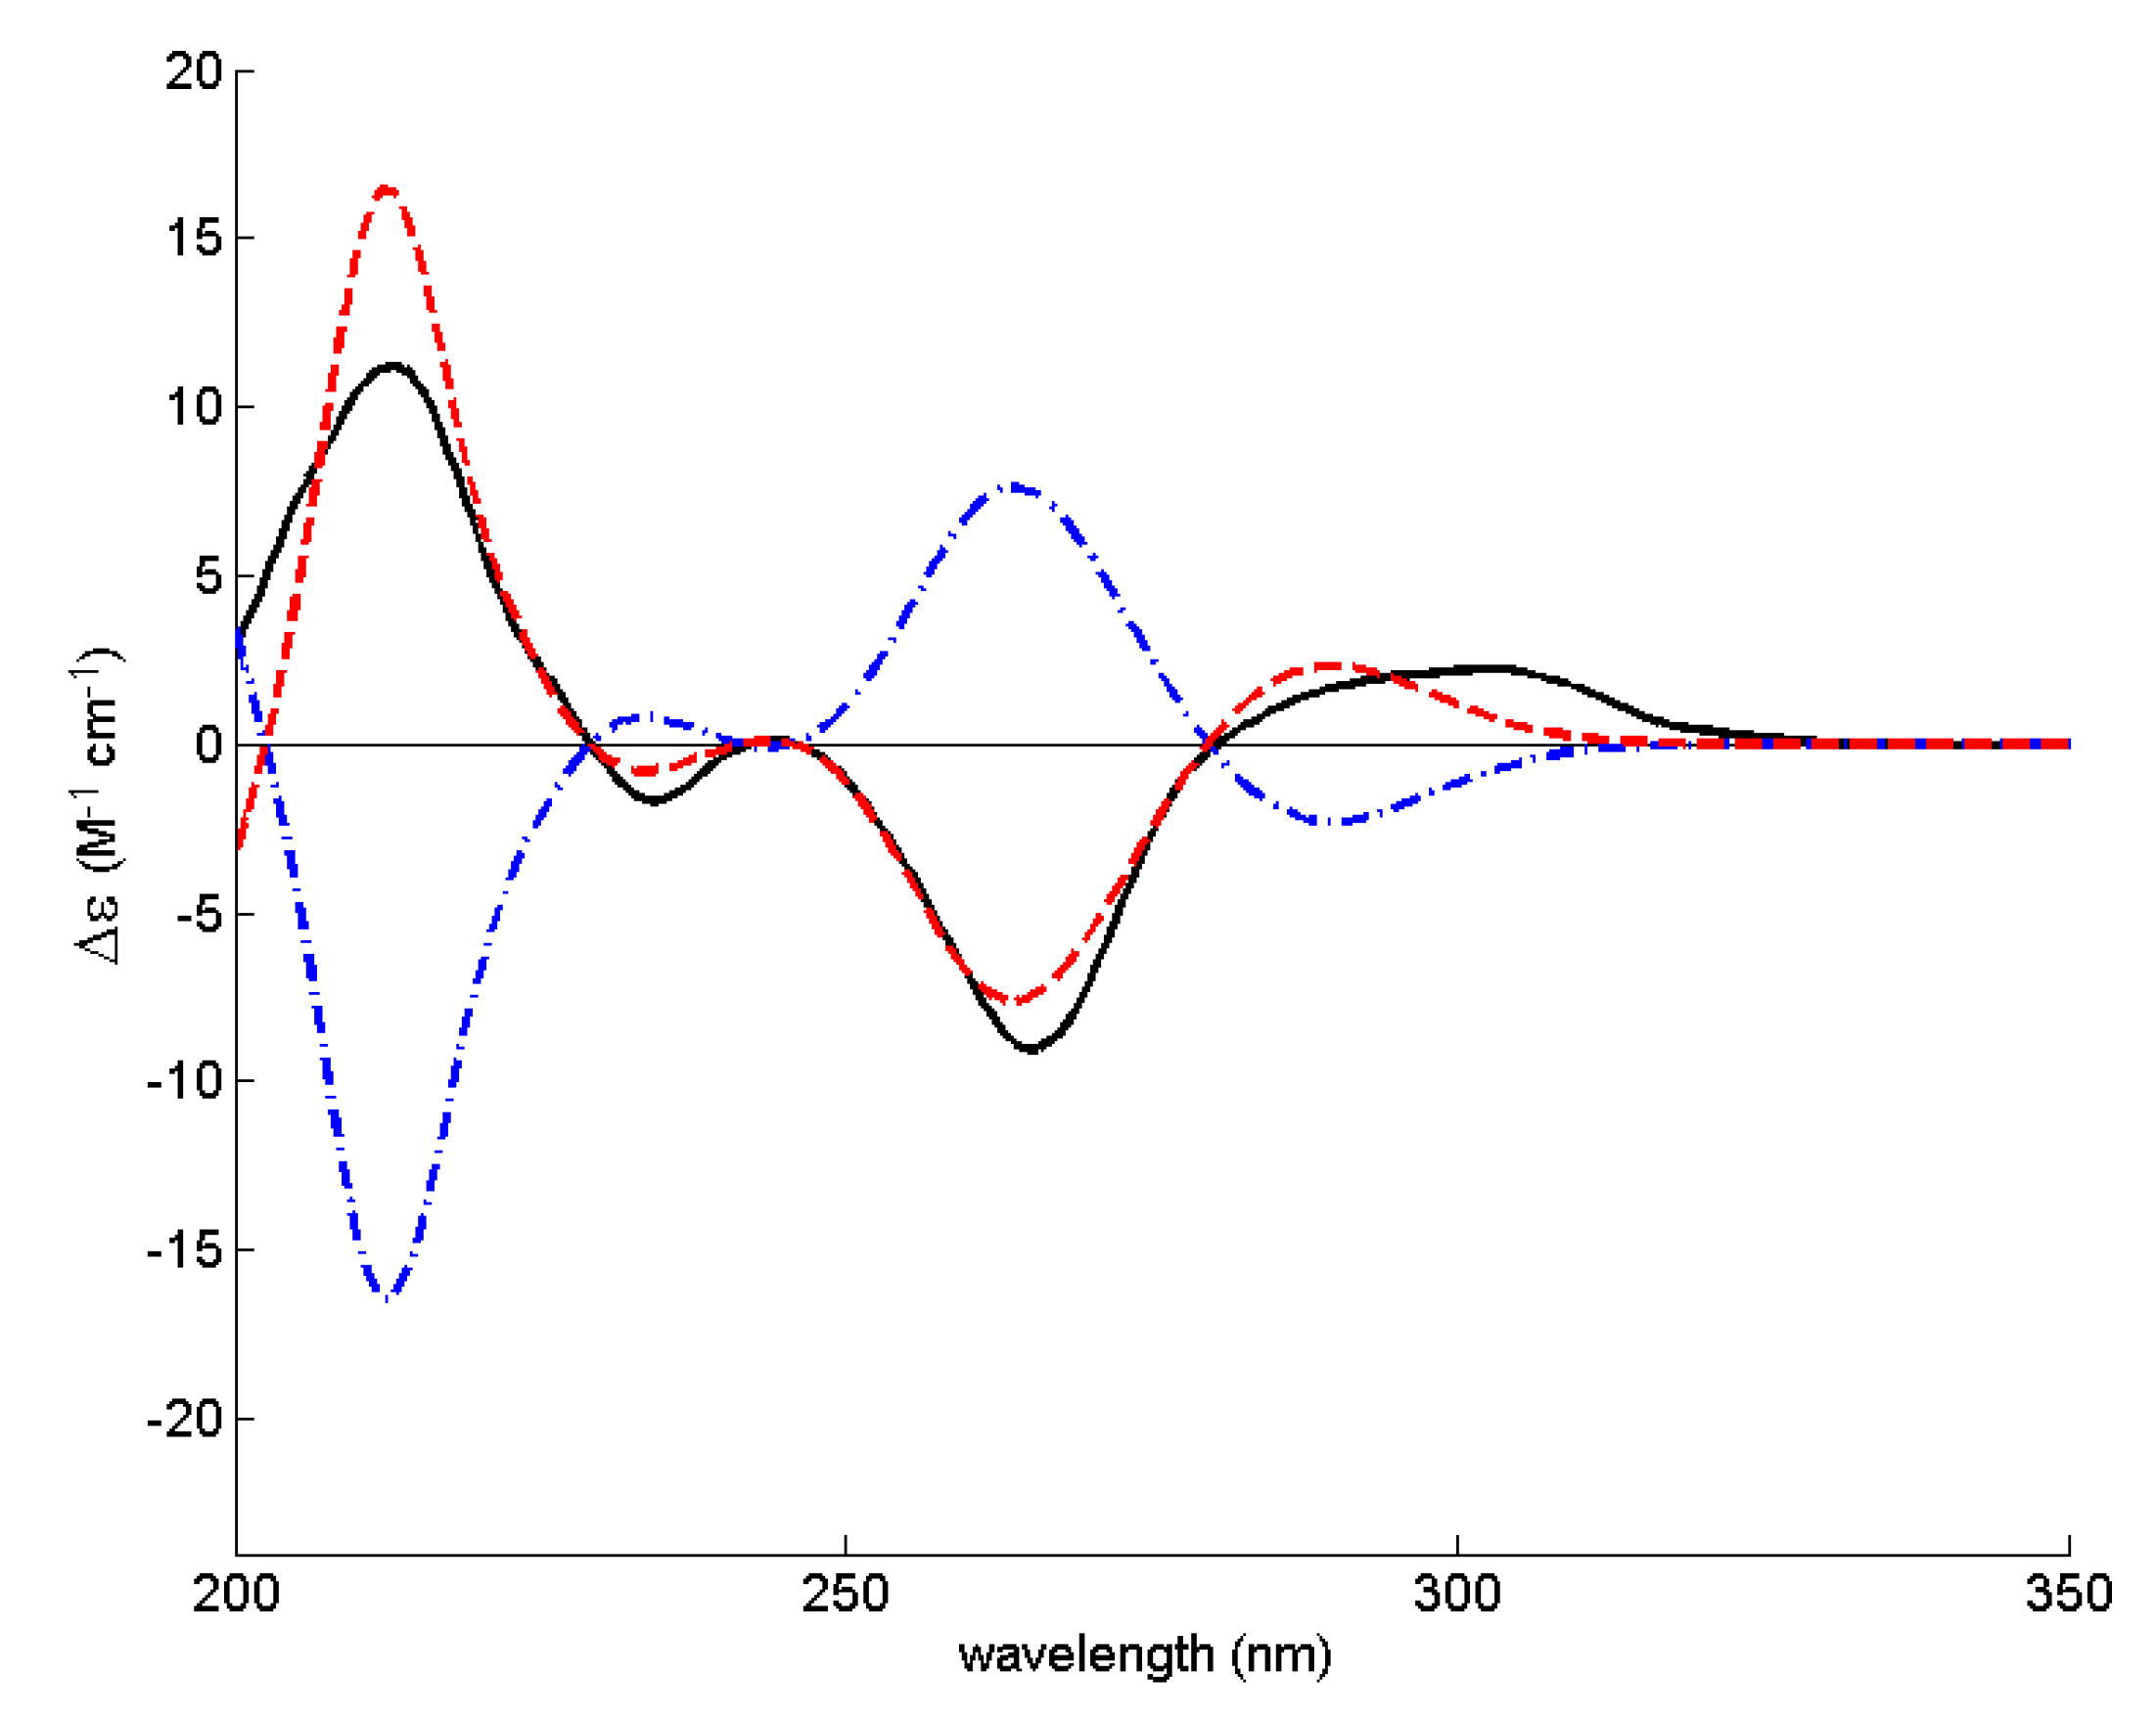
3.5. Electronic Circular Dichroism (ECD)

The experimental ECD spectrum of 2 (ca. 2 mg/mL in acetonitrile) was obtained in a Jasco J-815 CD spectropolarimeter (Jasco Europe S.R.L., Cremella, Italy) with a 0.1 mm cuvette and 6 accumulations. The simulated ECD spectra were obtained by first determining all the relevant conformers of the computational model. Its conformational space was developed by rotating all the single, non-ring, bonds for each of the two possible bends of the non-aromatic ring. The resulting 24 molecular mechanics conformers were minimized using the quantum mechanical DFT method B3LYP/6-31G with Gaussian 16W (Gaussian Inc., Wallingford, USA). The lowest 95% of the conformer Boltzmann populations (11 models) were subjected to a final minimization round using the method APFD/6-311+G(2d,p)/acetonitrile method (Gaussian 16W), which was also used, coupled with a TD method, to calculate its first 50 ECD transitions. The line spectrum for each one of the 11 models was built by applying a Gaussian line broadening of 0.15 eV to each computed transition with a constant UV-shift of 5 nm. The final ECD spectrum was obtained by the Boltzmann-weighted sum of the 11 line spectra [32].

3.6. Antibacterial Activity Bioassays

3.6.1. Bacterial Strains and Testing Conditions

Four reference strains, obtained from the American Type Culture Collection (ATCC), viz. two Gram-positive (Staphylococcus aureus ATCC 29213, Enterococcus faecalis ATCC 29212), and two Gram-negative (Escherichia coli ATCC 25922, Pseudomonas aeruginosa ATCC 27853), were included in this study. Additionally, three multidrug-resistant strains including an extended-spectrum β-lactamase (ESBL)-producing E. coli (clinical isolate SA/2), and two environmental isolates, i.e., a methicillin-resistant isolate (MRSA) S. aureus 74/24 [33], and a vancomycin-resistant (VRE) isolate E. faecalis B3/101 [34]. All bacterial strains were cultured in MH agar (MH-BioKar Diagnostics, Allone, France) and incubated overnight at 37 °C before each assay. Stock solutions of each compound (4 mg/mL for the less soluble compounds, 3a and 4, and 10 mg/mL for the others) were prepared in dimethyl sulfoxide (DMSO-Alfa Aesar, Kandel, Germany), kept at −20 °C, and freshly diluted in the appropriate culture media before each assay. In all experiments, in-test concentrations of DMSO were kept below 1%, as recommended by the Clinical and Laboratory Standards Institute [35].

3.6.2. Antimicrobial Susceptibility Testing

The Kirby–Bauer method was performed to screen the antimicrobial activity of the compounds according to CLSI recommendations [36]. Briefly, sterile blank paper discs with 6 mm diameter (Oxoid/Thermo Fisher Scientific, Basingstoke, UK) were impregnated with 15 µg of each compound and placed on MH plates, previously inoculated with a bacterial inoculum equal to 0.5 McFarland turbidity. After 18–20 h incubation at 37 °C, the diameter of the inhibition zones was measured in mm. Blank paper discs impregnated with DMSO were used as a negative control. Minimal inhibitory concentrations (MIC) were determined by the broth microdilution method, as recommended by the CLSI [37]. Two-fold serial dilutions of the compounds were prepared in cation-adjusted Mueller–Hinton broth (CAMHB-Sigma-Aldrich, St. Louis, MO, USA). With the exception of 3a and 4, the tested concentrations ranging from 1 to 64 µg/mL were used to keep in-test concentrations of DMSO below 1% to avoid bacterial growth inhibition. For 3a and 4, the highest concentration tested was 32 µg/mL. Colony forming unit (CFU) counts of the inoculum were conducted to ensure that the final inoculum size closely approximated the 5 × 10⁵ CFU/mL. The 96-well U-shaped untreated polystyrene plates were incubated for 16–20 h at 37 °C, and the MIC was determined as the lowest concentration of the compound that prevented visible growth. During the essays, vancomycin (VAN-Oxoid/Thermo Fisher Scientific, Basingstoke, UK) and oxacillin sodium salt monosulfate (OXA-Sigma-Aldrich, St. Louis, MO, USA) were used as positive controls for E. faecalis ATCC 29212 and S. aureus ATCC 29213, respectively. The minimal bactericidal concentration (MBC) was determined by spreading 10 µL of the content of the wells with no visible growth on MH plates. The MBC was defined as the lowest concentration to effectively reduce 99.9% of the bacterial growth after overnight incubation at 37 °C [38]. At least three independent assays were conducted for reference and multidrug-resistant strains.

3.6.3. Antibiotic Synergy Testing

The Kirby–Bauer method was also used to evaluate the combined effect of the tested compounds with clinically relevant antibacterial drugs, as previously described [39]. A set of antibiotic discs (Oxoid/Thermo Fisher Scientific, Basingstoke, UK), to which the isolates were resistant, was selected: cefotaxime (CTX, 30 µg) for E. coli SA/2, vancomycin (VAN, 30 µg) for E. faecalis B3/101, and oxacillin (OXA, 1 µg) for S. aureus 74/24. Antibiotic discs impregnated with 15 µg of each compound were placed on seeded MH plates. The controls used included antibiotic discs alone, blank paper discs impregnated with 15 µg of each compound alone, and blank discs impregnated with DMSO. Plates with CTX were incubated for 18–20 h and plates with VAN and OXA were incubated for 24 h at 37 °C [35]. Potential synergy was considered when the inhibition halo of the antibiotic disc impregnated with compound was greater than the inhibition halo of the antibiotic or compound-impregnated blank disc alone.
The MIC method was also performed in order to evaluate the combined effect of the compounds and clinically relevant antimicrobial drugs. Briefly, when it was not possible to determine a MIC value for the tested compound, the MIC of CTX (Duchefa Biochemie, Haarlem, The Netherlands), VAN (Oxoid, Basingstoke, England), and OXA (Sigma-Aldrich, St. Louis, MO, USA) for the respective multidrug-resistant strains was determined in the presence of the highest concentration of each compound tested in previous assays (64 µg/mL or 32 µg/mL for compounds 3a and 4). The tested antibiotic was serially diluted whereas the concentration of each compound was kept fixed. Antibiotic MICs were determined as described above. Potential synergy was considered when the antibiotic MIC was lower in the presence of compound [40]. Fractional inhibitory concentrations (FIC) were calculated as follows: FIC of the compound = MIC of the compound combined with antibiotic/MIC of the compound alone, and FIC antibiotic = MIC of antibiotic combined with compound/MIC of antibiotic alone. The FIC index (FICI) was calculated as the sum of each FIC and interpreted as follows: FICI ≤ 0.5, ‘synergy’; 0.5 < FICI ≤ 4, ‘no interaction’; 4 < FICI, ‘antagonism’ [41].

3.6.4. Biofilm Formation Inhibition Assay

In order to evaluate the antibiofilm activity of the compounds, the crystal violet method was used to quantify the total biomass produced [39,42]. Briefly, the highest concentration of the compound tested in the MIC assay was added to bacterial suspensions of 1 × 10⁶ CFU/mL prepared in unsupplemented Tryptone Soy broth (TSB-Biokar Diagnostics, Allone, Beauvais, France) or TSB supplemented with 1% (w/v) glucose (d-(+)-glucose anhydrous for molecular biology, PanReac AppliChem, Barcelona, Spain) for Gram-positive strains. When it was possible to determine the MIC, concentrations between 2× MIC and ¼ MIC were tested, while keeping in-test concentrations of DMSO below 1%. When it was not possible to determine the MIC value, the concentration tested was 64 µg/mL (or 32 µg/mL for compounds 3a and 4). Controls with appropriate concentration of DMSO, as well as a negative control (TSB or TSB + 1% glucose alone) were included. Sterile 96-well flat-bottomed untreated polystyrene microtiter plates were used. After a 24 h incubation at 37 °C, the biofilms were heat-fixed for 1 h at 60 °C and stained with 0.5% (v/v) crystal violet (Química Clínica Aplicada, Amposta, Spain) for 5 min. The stain was resolubilized with 33% (v/v) acetic acid (Acetic acid 100%, AppliChem, Darmstadt, Germany) and the biofilm biomass was quantified by measuring the absorbance of each sample at 570 nm in a microplate reader (Thermo Scientific Multiskan® FC, Thermo Fisher Scientific, Waltham, MA, USA). The background absorbance (TSB or TSB + 1% glucose without inoculum) was subtracted from the absorbance of each sample and the data are presented as percentage of control. Three independent assays were performed for reference strains, with triplicates for each experimental condition.

4. Conclusions

The EtOAc extract of the culture of a marine-derived fungus, Aspergillus stellatus KUFA 2017, isolated from a marine sponge Mycale sp., which was collected in the Gulf of Thailand, furnished three previously unreported secondary metabolites viz. (3S,4R)-4-hydroxy-6-methoxymellein (2), a structurally unique propylpyridinium anthraquinone, stellatanthraquinone (4), and acetyl carnemycin E (5c), in addition to eight previously reported compounds, including p-hydroxybenzaldehyde (1), 1,3-dimethoxy-8-hydroxy-6-methylanthraquinone (3a), 1,3-dimethoxy-2,8-dihydroxy-6-methylanthraquinone (3b), emodin (3c), 5[(3E,5E)-nona-3,5-dien-1-yl]benzene (5a), carnemycin E (5b), tajixanthone hydrate (6a), and 15-acetyl tajixanthone hydrate (6b). While the absolute configurations of the stereogenic carbons in 2 were established unambiguously by a combination of NOESY correlations and a comparison of experimental and calculated ECD spectra, the stereostructures of 6a and 6b were established by X-ray analysis for the first time.
All the compounds, except 1 and 3c, were evaluated for their antibacterial activity against four reference strains: two Gram-positive (Staphylococcus aureus ATCC 29213, Enterococcus faecalis ATCC 29212) and two Gram-negative (Escherichia coli ATCC 25922, Pseudomonas aeruginosa ATCC 27853), as well as three multidrug-resistant strains including an extended-spectrum β-lactamase (ESBL)-producing E. coli (clinical isolate SA/2), a methicillin-resistant isolate (MRSA) S. aureus 74/24 and a vancomycin-resistant (VRE) isolate E. faecalis B3/101. However, only 5c exhibited antibacterial activity against all Gram-positive strains with a MIC value of 16 µg/mL toward E. faecalis ATCC 29212, vancomycin-resistant E. faecalis B3/101, and methicillin-resistant S. aureus 74/24, but with a higher MIC value (32 µg/mL) toward S. aureus ATCC 29213. Since 5a displayed the minimal bactericidal concentration (MBC) equal to or one-fold higher than the MIC, it was suggested that 5a exerted a bactericidal effect towards E. faecalis ATCC 29212, S. aureus 74/24, and S. aureus ATCC 29213. On the contrary, the MBC of 5a was more than two-fold higher than the MIC toward E. faecalis B3/101; therefore, this compound was suggested to have a bacteriostatic effect against this multidrug-resistant species. Interestingly, 5b and 5c, which are C-glucosylated 5a, were void of antibacterial activity against all the tested organisms. These results lead to a conclusion that the polar and bulky glucosyl substituent on the benzene ring can negatively affect the antibacterial activity of this series of compounds. Finally, 5a was also able to completely inhibit biofilm formation in S. aureus ATCC 29213 and E. faecalis ATCC 29212 at both MIC and 2× MIC concentrations. Since 5a possesses interesting antibacterial and potent antibiofilm activities, this compound can be considered as an interesting model for the development of a new type of antibiotics.

Supplementary Materials

The following are available online at https://www.mdpi.com/article/10.3390/md20110672/s1. Figures S1–S56: 1D and 2D NMR spectra of compounds 1, 2, 3a, 3b, 3c, 4, 5a, 5b, 5c, 6a, 6b. Figures S57–S61: HRMS data for compounds 2, 4, 5a, 5b, and 5c. Table S1: 1H and 13C NMR data (CDCl3, 300 and 75 MHz) of compounds 3a and 3b. Table S2: 1H and 13C NMR data of 5b (DMSO-d6, 300 and 75 MHz), 5c (DMSO-d6, 500 and 125 MHz), and 5a (CDCl3, 300 and 75 MHz). Table S3: 1H and 13C NMR data of 6a and 6b (CDCl3, 300 and 75 MHz).

Author Contributions

A.K. conceived, designed the experiments, and elaborated the manuscript; F.P.M. performed isolation, purification, and part of structure elucidation of the compounds; T.D. collected, isolated, identified, and cultured the fungus; J.A.P. performed calculations and measurement of ECD spectra and interpretation of the results; L.G. performed X-ray analysis; I.C.R. and P.M.C. performed antibacterial and antibiofilm assays; S.M. provided HRMS; A.M.S.S. provided NMR spectra; V.V. assisted in the preparation of a manuscript. All authors have read and agreed to the published version of the manuscript.

Funding

This work is partially supported by the national infrastructure PT-OPENSCREEN (NORTE-01-0145-FEDER-085468) and the national funds through the FCT-Foundation for Science and Technology with the scope of UIDB/04423/2020 and UIDP/04423/2020.

Institutional Review Board Statement

Not applicable.

Data Availability Statement

Data sharing is not applicable.

Acknowledgments

The authors acknowledge the support of the Biochemical and Biophysical Technologies i3S Scientific Platform with the assistance of Frederico Silva and Maria de Fátima Fonseca for the access of the Jasco J-815 CD spectropolarimeter.

Conflicts of Interest

The authors declare no conflict of interest.

References

  1. Wang, X.-C.; Zhuang, W.-Y. New species of Aspergillus (Aspergillaceae) from tropical islands of China. J. Fungi 2022, 8, 225. [Google Scholar] [CrossRef] [PubMed]
  2. Hagestad, O.C.; Andersen, J.H.; Altermark, B.E.; Rämä, T. Cultivable marine fungi from the Arctic Archipelago of Svalbard and their antibacterial activity. Mycology 2020, 11, 230–242. [Google Scholar] [CrossRef] [PubMed] [Green Version]
  3. Machado, F.P.; Kumla, D.; Pereira, J.A.; Sousa, E.; Dethoup, T.; Freitas-Silva, J.; Costa, P.M.; Mistry, S.; Silva, A.M.S.; Kijjoa, A. Prenylated phenylbutyrolactones from cultures of a marine sponge-associated fungus Aspergillus flavipes KUFA1152. Phytochemistry 2021, 185, 112709. [Google Scholar] [CrossRef] [PubMed]
  4. Wang, Y.-T.; Xue, Y.-R.; Liu, C.-H. A brief review of bioactive metabolites derived from deep-sea fungi. Mar. Drugs 2015, 13, 4594–4616. [Google Scholar] [CrossRef] [Green Version]
  5. Samson, R.; Visagie, C.M.; Houbraken, J.; Hong, S.B.; Hubka, V.; Klaassen, C.H.W.; Perrone, G.; Seifert, K.A.; Susca, A.; Tanney, J.B.; et al. Phylogeny, identification and nomenclature of the genus Aspergillus. Stud. Mycol. 2014, 78, 141–173. [Google Scholar] [CrossRef] [PubMed] [Green Version]
  6. Orfali, R.; Aboseada, M.A.; Abdel-Wahab, N.M.; Hassan, H.M.; Perveen, S.; Ameen, F.; Alturki, E.; Abdelmohsen, U.R. Recent updates on the bioactive compounds of the marine-derived genus Aspergillus. RSC Adv. 2021, 11, 17116–17150. [Google Scholar] [CrossRef]
  7. Kruger, G.J.; Steyn, P.S.; Vleggaar, R.; Rabie, C.J. X-ray crystal structure of astelotoxin, a novel mycotoxin from Aspergillus stellatus Curzi. J. Chem. Soc. Chem. Comm. 1979, 10, 441–442. [Google Scholar] [CrossRef]
  8. Kamal, A.; Husain, S.A.; Noorani, R.; Murtaza, N.; Qureshi, I.H.; Quershi, A.A. Studies in the biochemistry of microorganisms. XI. Isolation of tajixanthone, shamixanthone, ajamxanthone, shahenxanthone, najamxanthone, radixanthone and mannitol from mycelium of Aspergillus stellatus, Cruzi. J. Sci. Indus. Res. 1970, 13, 251–255. [Google Scholar]
  9. Prompanya, C.; Dethoup, T.; Bessa, L.J.; Pinto, M.M.M.; Gales, L.; Costa, P.M.; Silva, A.M.S.; Kijjoa, A. New isocoumarin derivatives and meroterpenoids from the marine sponge-associated fungus Aspergillus similanensis sp. nov. KUFA 0013. Mar. Drugs 2014, 12, 5160–5173. [Google Scholar] [CrossRef] [Green Version]
  10. Manojlović, I.; Bogdanović-Dusanović, G.; Gritsanapan, W.; Manojlović, N. Isolation and identification of anthraquinones of Caloplaca cerina and Cassia tora. Chem. Pap. 2006, 60, 466–468. [Google Scholar] [CrossRef]
  11. Hawas, U.W.; El-Beih, A.A.; El-Halawany, A.M. Bioactive anthraquinones from endophytic fungus Aspergillus versicolor isolated from red sea algae. Arch. Pharm. Res. 2012, 35, 1749–1756. [Google Scholar] [CrossRef] [PubMed]
  12. Noinart, J.; Buttachon, S.; Dethoup, T.; Gales, L.; Pereira, J.A.; Urbatzka, R.; Freitas, S.; Lee, M.; Silva, A.M.S.; Pinto, M.M.M.; et al. A new ergosterol analog, a new bis-anthraquinone and anti-obesity activity of anthraquinones from the marine sponge-associated fungus Talaromyces stipitatus KUFA 0207. Mar. Drugs 2017, 15, 139. [Google Scholar] [CrossRef] [PubMed] [Green Version]
  13. Wen, H.; Chen, C.; Sun, W.; Zang, Y.; Li, Q.; Wang, W.; Zeng, F.; Liu, J.; Zhou, Y.; Zhou, Q.; et al. Phenolic C-glycosides and aglycones from marine-derived Aspergillus sp. and their anti-inflammatory activities. J. Nat. Prod. 2019, 82, 1098–1106. [Google Scholar] [CrossRef]
  14. Pornpakakul, S.; Liangsakul, J.; Ngamrojanavanich, N.; Roengsumran, S.; Sihanonth, P.; Piapukiew, J.; Sangvichien, E.; Puthong, S.; Amorn Petsom, A. Cytotoxic activity of four xanthones from Emericella variecolor, an endophytic fungus isolated from Croton oblongifolius. Arch. Pharm. Res. 2006, 29, 140–144. [Google Scholar] [CrossRef]
  15. Figueroa, M.; González, M.C.; Rodríguez-Sotres, R.; Sosa-Peinado, A.; González-Andrade, M.; Cerda-Gárcıa-Rojas, C.M.; Mata, R. Calmodulin inhibitors from the fungus Emericella sp. Bioorg. Med. Chem. 2009, 17, 2167–2174. [Google Scholar] [CrossRef] [PubMed] [Green Version]
  16. González, A.M.; Rivera, C.J.; Sosa, P.A.; Figueroa, M.; Rodríguez-Sotres, R.; Mata, R. Development of the fluorescent biosensor h Calmodulin (h CaM) L39C-monobromobimane (mBBr)/V91C-mBBr, a novel tool for discovering new calmodulin inhibitors and detecting calcium. J. Med. Chem. 2011, 54, 3875–3884. [Google Scholar] [CrossRef] [PubMed]
  17. Takenaka, Y.; Hamada, N.; Tanahashi, T. Aromatic compound from cultured lichen mycobionts of the three Graphis species. Heterocycles 2011, 83, 2157–2164. [Google Scholar]
  18. Damodaran, V.; Ryan, J.L.; Keyzers, R.A. Cyclic 3-alkyl pyridinium alkaloid monomers from a New Zealand Haliclona sp. marine sponge. J. Nat. Prod. 2013, 76, 1997–2001. [Google Scholar] [CrossRef]
  19. Schmidt, G.; Timm, C.; Köck, M.; Haliclocyclin, C. A new monomeric 3-alkyl pyridinium alkaloid from the arctic marine sponge Haliclona viscosa. Z. Naturforsch. 2011, 66b, 745–748. [Google Scholar] [CrossRef]
  20. Maarisit, W.; Abdjul, D.B.; Yamazaki, H.; Kato, H.; Rotinsulu, H.; Wewengkang, D.S.; Sumilat, D.A.; Kapojos, M.M.; Ukai, K.; Namikoshi, M. Anti-mycobacterial alkaloids, cyclic 3-alkyl pyridinium dimers, from the Indonesian marine sponge Haliclona sp. Bioorg. Med. Chem. Lett. 2017, 27, 3503–3506. [Google Scholar] [CrossRef]
  21. Markam, K.R.; Mues, R.; Stoll, M.; Zinsmeister, H.D. NMR spectra of flavone di-C-glycosides from Apometzgeria pubescens and the detection of rotational isomerism in 8-C-hexosylflavone. Z. Naturforsch. 1987, 42c, 1039–1042. [Google Scholar] [CrossRef]
  22. Chexal, K.K.; Fouweather, C.; Holker, J.S.E.; Simpson, T.J.; Young, K. The biosynthesis of fungal metabolites. Part III. Structure of shamixanthone and tajixanthone, metabolites of Aspergillus variecolor. J. Chem. Soc. Perkin Trans. 1974, 1, 1584–1593. [Google Scholar] [CrossRef]
  23. Chexal, K.K.; Holker, J.S.E.; Simpson, T.J. The biosynthesis of fungal metabolites. Part VI. Structure and biosynthesis of some minor metabolites from variant strains of Aspergillus variecolor. J. Chem. Soc. Perkin Trans. 1975, 1, 549–554. [Google Scholar] [CrossRef]
  24. Luís, A.; Cruz, C.; Duarte, A.P.; Domingues, F. An alkenylresorcinol derivative from Hakea sericea fruits and their antimicrobial activity. Nat. Prod. Com. 2013, 8, 1459–1462. [Google Scholar] [CrossRef] [Green Version]
  25. Hafez Ghoran, S.; Fatemeh Taktaz, F.; Ayatollahi, S.A.; Kijjoa, A. Anthraquinones and their analogues from marine-derived fungi: Chemistry and biological activities. Mar. Drugs 2022, 20, 474. [Google Scholar] [CrossRef] [PubMed]
  26. de Sá, J.D.M.; Pereira, J.A.; Dethoup, T.; Cidade, H.; Sousa, M.E.; Rodrigues, I.C.; Costa, P.M.; Mistry, S.; Silva, A.M.S.; Kijjoa, A. Anthraquinones, diphenyl ethers, and their derivatives from the culture of the marine sponge-associated fungus Neosartorya spinosa KUFA 1047. Mar. Drugs 2021, 19, 457. [Google Scholar] [CrossRef]
  27. Murray, M.G.; Thompson, W.F. Rapid isolation of high molecular weight plant DNA. Nucleic Acids Res. 1980, 8, 4321–4326. [Google Scholar] [CrossRef] [Green Version]
  28. White, T.J.; Bruns, T.; Lee, S.; Taylor, J. Amplification and direct sequencing of fungal ribosomal RNA genes for phylogenetics. In PCR Protocols: A Guide to Methods and Applications; Innis, M.A., Gelfand, D.H., Sninsky, J.J., White, T.J., Eds.; Academic Press: New York, NY, USA, 1990; pp. 315–322. [Google Scholar]
  29. Sanger, F.; Nicklen, S.; Coulson, A.R. DNA sequencing with chain-terminating inhibitors. Proc. Natl. Acad. Sci. USA 1977, 72, 5463–5467. [Google Scholar] [CrossRef] [Green Version]
  30. Sheldrick, G.M. A short history of SHELX. Acta Crystallogr. Sect. A 2008, A64, 112–122. [Google Scholar] [CrossRef] [Green Version]
  31. Flack, H.D. On enantiomorph-polarity estimation. Acta Crystallogr. Sect. A 1983, 39, 876–881. [Google Scholar] [CrossRef]
  32. Stephens, P.J.; Harada, N. ECD Cotton effect approximated by the Gaussian curve and other methods. Chirality 2010, 22, 229–233. [Google Scholar] [CrossRef] [PubMed]
  33. Simões, R.R.; Aires-de-Sousa, M.; Conceição, T.; Antunes, F.; da Costa, P.M.; de Lencastre, H. High prevalence of EMRSA-15 in Portuguese public buses: A worrisome finding. PLoS ONE 2011, 6, e0017630. [Google Scholar] [CrossRef] [PubMed]
  34. Bessa, L.J.; Barbosa-Vasconcelos, A.; Mendes, Â.; Vaz-Pires, P.; Da Costa, P.M. High prevalence of multidrug-resistant Escherichia coli and Enterococcus spp. in river water, upstream and downstream of a wastewater treatment plant. J. Water Health 2014, 12, 426–435. [Google Scholar] [CrossRef]
  35. CLSI. Performance Standards for Antimicrobial Susceptibility Testing, 28th ed.; CLSI supplement M100; Clinical and Laboratory Standards Institute: Wayne, PA, USA, 2018. [Google Scholar]
  36. CLSI. Performance Standards for Antimicrobial Disk Susceptibility Tests; Approved Standard, 11th ed.; CLSI Document M02-A11; Clinical and Laboratory Standards Institute: Wayne, PA, USA, 2012. [Google Scholar]
  37. CLSI. Methods for Dilution Antimicrobial Susceptibility Tests for Bacteria that Grow Aerobically, 11th ed.; CLSI Standard M07; Clinical and Laboratory Standards Institute: Wayne, PA, USA, 2018. [Google Scholar]
  38. CLSI. Methods for Determining Bactericidal Activity of Antimicrobial Agents; Approved Guideline; CLSI Document M26-A; Clinical and Laboratory Standards Institute: Wayne, PA, USA, 1999. [Google Scholar]
  39. Kumla, D.; Dethoup, T.; Gales, L.; Pereira, J.A.; Freitas-Silva, J.; Costa, P.M.; Silva, A.M.S.; Pinto, M.M.M.; Kijjoa, A. Erubescensoic acid, a new polyketide and a xanthonopyrone SPF-3059-26 from the culture of the marine sponge-associated fungus Penicillium erubescens KUFA 0220 and antibacterial activity evaluation of some of its constituents. Molecules 2019, 24, 208. [Google Scholar] [CrossRef] [PubMed] [Green Version]
  40. Gomes, N.M.; Bessa, L.J.; Buttachon, S.; Costa, P.M.; Buaruang, J.; Dethoup, T.; Silva, A.M.S.; Kijjoa, A. Antibacterial and antibiofilm activities of tryptoquivalines and meroditerpenes isolated from the marine-derived fungi Neosartorya paulistensis, N. laciniosa, N. tsunodae, and the soil fungi N. fischeri and N. siamensis. Mar. Drugs 2014, 12, 822–839. [Google Scholar] [CrossRef] [Green Version]
  41. Odds, F.C. Synergy, antagonism, and what the chequer board puts between them. J. Antimicrob. Chemother. 2003, 52, 1. [Google Scholar] [CrossRef]
  42. Stepanović, S.; Vuković, D.; Hola, V.; Di Bonaventura, G.; Djuki’c, S.; Cirković, I.; Ruzicka, F. Quantification of biofilm in microtiter plates: Overview of testing conditions and practical recommendations for assessment of biofilm production by staphylococci. Apmis 2007, 115, 891–899. [Google Scholar] [CrossRef] [PubMed]
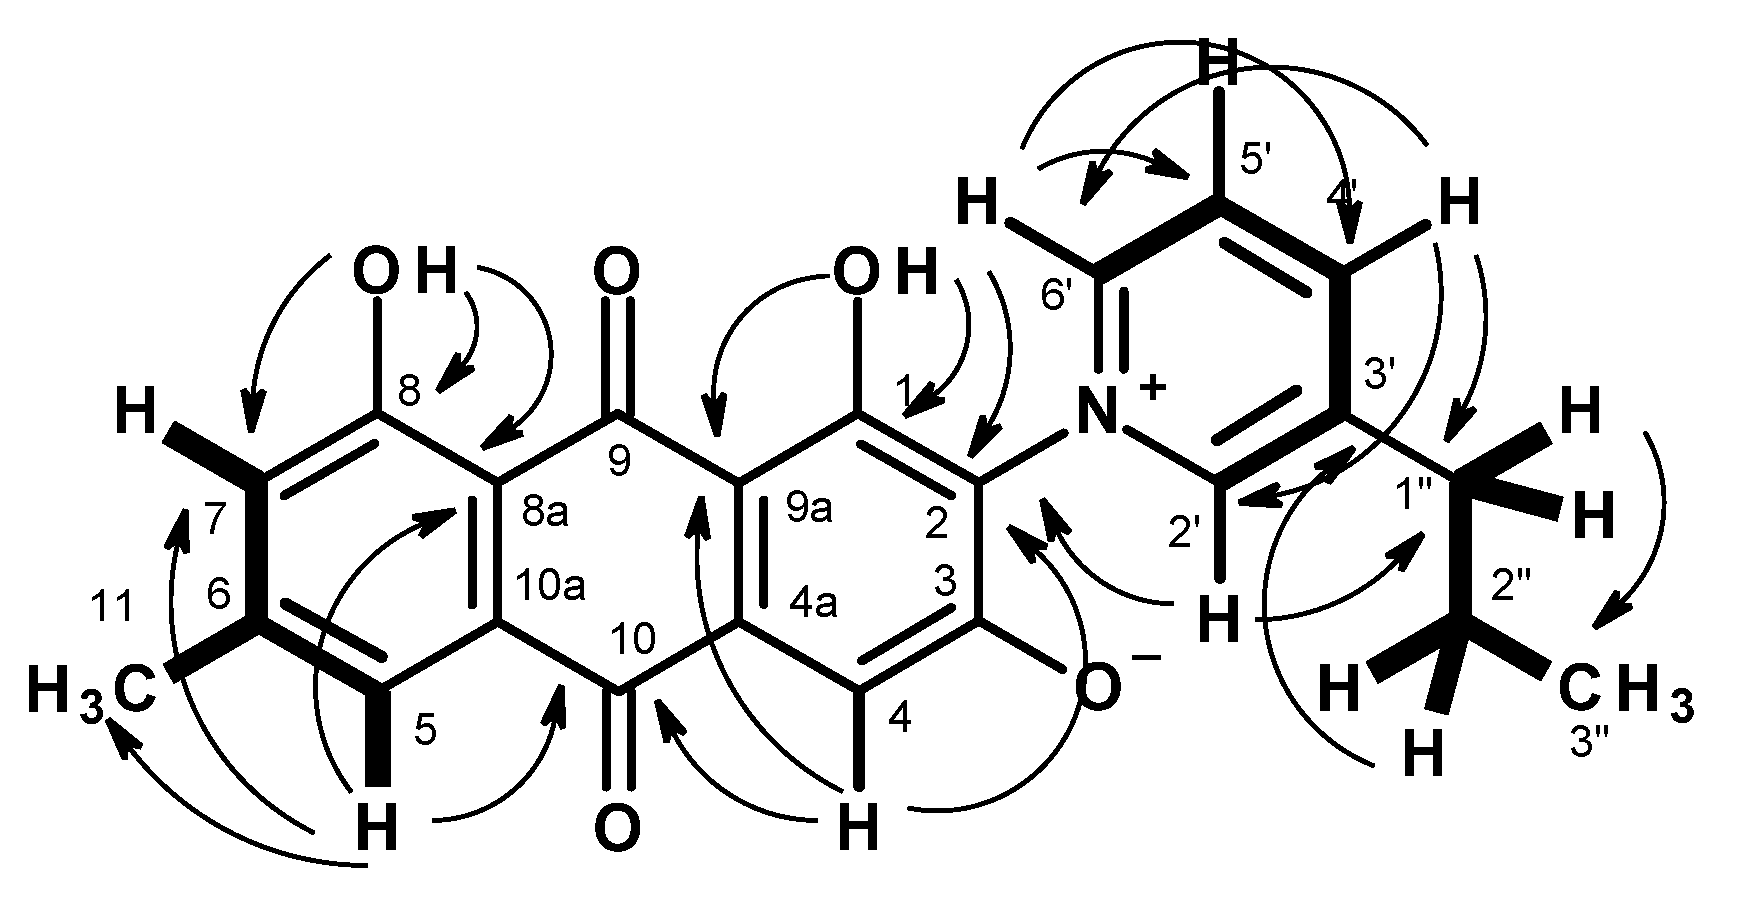
Figure 1. Structures of p-hydroxybenzaldehyde (1), (3S,4R)-4-hydroxy-6-methoxymellein (2), 1,3-dimethoxy-8-hydroxy-6-methylanthraquinone (3a), 1,3-dimethoxy-2,8-dihydroxy-6-methylanthraquinone (3b), emodin (3c), stellatanthraquinone (4), 5[(3E,5E)-nona-3,5-dien-1-yl]benzene-1,3-diol (5a), carnemycin E (5b), acetyl carnemycin E (5c), tajixanthone hydrate (6a), 15-acetyl tajixanthone hydrate (6b).
Marinedrugs 20 00672 g001
Figure 2. Model of the most abundant conformation of 2 (lowest APFD/6-311+G(2d,p)/acetonitrile energy conformer), accounting for 25% of conformer population, in its ECD-assigned (3S,4R) configuration.
Marinedrugs 20 00672 g002
Figure 3. Experimental acetonitrile ECD spectrum of 2 (solid black line) and theoretical ECD spectra of its (3R,4S) (dot-dashed blue line) and (3S,4R) (dashed red line) computational models. Of the two theoretical spectra, the (3R,4S) was the one actually simulated and the (3S4,R) was obtained by changing the sign of every point of the (3R,4S) spectrum.
Marinedrugs 20 00672 g003
Figure 4. Key COSY (Marinedrugs 20 00672 i001) and HMBC (Marinedrugs 20 00672 i002) correlations in 4.
Marinedrugs 20 00672 g004
Figure 5. Ortep views of 6a (A) and 6b (B).
Marinedrugs 20 00672 g005aMarinedrugs 20 00672 g005b
Table 1. 1H and 13C NMR data (CDCl3, 300 and 75 MHz), COSY, HMBC, and NOESY for 2.
PositionδC, TypeδH, (J in Hz)COSYHMBCNOESY
1169.1, CO-
377.8, CH4.63, dq (6.6, 2.0)CH3-9CH3-9CH3-9
467.5, CH4.50, dd (5.6, 1.5)OH-4C-4a, 5, 8aH-5, CH3-9
4a142.1, C--
5106.8, CH6.48, d (2.3)H-7C-4, 6, 7, 8aH-4, OCH3-6
6166.2, C-
7101.3, CH6.45, d (2.3)H-5,C-5, 6, 8aOCH3-6
8164.5, C-
8a100.0, C-
915.9, CH31.55, d (1.6)H-3C-3, 4H-3, 4
OCH3-655.8, CH33.85, s C-6
OH-4-2.28, m C-3, 4
OH-8-11.20, s C-7, 8, 8a
Table 2. 1H and 13C NMR data (DMSO-d6, 500 and 125 MHz), COSY and HMBC assignment for 4.
PositionδC, TypeδH, (J in Hz)COSYHMBC
1159.5, C
2123.2, C
3171.9, C
4118.6, CH6.80, s C-2, 9a, 10
4a133.2, C
5120.4, CH7.46, d (1.0)H-7C-7, 8a, 10, CH3-11
6146.7, C
7124.4, CH7.11, sH-5, CH3-11C-5, 8, 8a, CH3-11
8161.2, C
8a114.6, C
9184.5, CO
9a100.0, C
10183.3, CO
10a134.4, C
1121.9, CH32.40, sH-7C-5, 6,7
2’147.2, CH8.91, brsH-4’C-2, 3’, 4’, 1”
3’142.8, C
4’146.2, CH8.57, d (8.0)H-2’,5’C-2’, 6’, 1”
5’127.5, CH8.16, dd (8.0, 6.1)H-4’, 6’C-3’, 6’
6’145.6, CH8.85, d (6.1)H-5’C-2, 4’, 5’
1”33.8, CH22.83, t (7.4)H-2”C-2’, 2”, 3’, 3”
2”23.7, CH21.70, sex (7.4)H-1”, 3”C-1”, 3’, 3”
3”13.7, CH30.94, t (7.3)H-2”C-1”, 3”
OH-1 13.44, s C-1, 2, 9a
OH-8 12.50, s C-7, 8, 8a
Table 3. 1H and 13C NMR data (DMSO-d6, 300 and 75 MHz), COSY, and HMBC assignment for 5b.
PositionδC, TypeδH, (J in Hz)COSYHMBC
1157.1, C
2110.2, C
3157.1, C
4107.6, CH6.11, s C-1’, 3, 6, 7
5142.5, C
6107.6,CH6.11, s C-1’, 2, 4, 7
735.5, CH22.45, t (6.8)H-8C-4, 5, 6, 8, 9
834.0, CH22.27, dd (14.3, 6.6)H-7, H-9C-5, 7, 9, 10
9131.8, CH5.62, mH-8, 10C-10, 11
10130.9, CH5.91, mH-9, 11C-8, 9, 12
11131.1, CH6.04, mH-10, 12C-9, 13
12132.6, CH5.55, mH-11, 13C-10, 13, 14
1334.5, CH22.00, dd (14.3, 7.2)H-12, 14C-11, 12, 14, 15
1422.5, CH21.36, sext (7.2)H-13, 15C-12, 13, 15
1514.0, CH30.87, t (7.2)H-14C-13, 14
1’75.0, CH4.62, d (9.6)H-2’C-1, 2, 2’, 3, 3’
2’72.1, CH3.74, m
3’79.1, CH3.22, m
4’70.3, CH3.22, mOH-4’
5’81.5, CH3.20, m
6’a
b
61.2, CH2 3.50, dd (11.0, 5.5)
3.65, dd (11.0, 5.2)
H-5’, 6’b, OH-6’
H-5’, 6’a, OH-6’
OH-3 8.67, s C-2, 3, 4
OH-4’ 4.90, dd (10.7, 2.9)H-4’C-4’, 5’
OH-6’ 4.59, d (5.5)H2-6’C-6’
Table 4. 1H and 13C NMR data (DMSO-d6, 500 and 125 MHz), COSY, and HMBC assignment for 5c.
PositionδC, TypeδH, (J in Hz)COSYHMBC
1157.3, C
2109.9, C
3157.3, C
4107.5, CH6.11, s C-1’, 2, 3, 6, 7
5142.5, C
6107.5, CH6.11, s C-1’, 2, 3, 4, 7
735.5, CH22.44, t (7.2)H-8C-4, 5, 6, 8, 9
834.0, CH22.26, dd (14.7, 7.2)H-7, 9C-7, 9, 10
9131.8, CH5.59, ddd (14.6, 7.2, 7.2)H-8, 10C-11
10130.9, CH5.97, mH-9, 11
11131.1, CH6.04, mH-10, 12C-9 (w), 13
12132.6, CH5.57, ddd (14.5, 7.7, 7.1)H-11, 13C-10, 13, 14
1334.5, CH22.01, mH-12, 14C-11, 12, 14, 15
1422.5, CH21.36, sex (7.4)H-13, 1512, 13, 15
1514.0, CH30.86, t (7.4)H-14C-13, 14
1’74.9, CH4.60, d (9.8)H-2’C-1, 2, 2’ 3, 3’
2’71.5, CH3.83, t (9.2)H-1’, 3’C-1’, 3’
3’79.0, CH3.21, t (8.7)H-4’C-4’
4’70.6, CH3.18, t (8.7)H-3’C-3’
5’78.4, CH3.36 (under water peak)H-6’bC-4’ (w)
6’a
b
64.8, CH24.32, d (11.6)
3.98 dd (11.6, 3.9)
H-6’b
H-5’, 6’a
C-4’, CO (OAc)
C-5’, 6’
OAc170.9, CO-
OAc21.2, CH32.00, s C-6’
OH-3 8.74, brs
OH-3’ 4.95, br
OH-4’ 5.15, br
Table 5. Antibacterial activity of 2, 3a, 3b, 4, 5a, 5b, 5c, 6a, and 6b against Gram-positive reference and multidrug-resistant strains. MIC and MBC are expressed in µg/mL.
CompoundE. faecalis ATCC 29212E. faecalis B3/101 (VRE)S. aureus ATCC 29213S. aureus 74/24 (MRSA)
MICMBCMICMBCMICMBCMICMBC
2>64>64>64>64>64>64>64>64
3a>32>32>32>32>32>32>32>32
3b>64>64>64>64>64>64>64>64
4>32>32>32>32>32>32>32>32
5a1632166432321632
5b>64>64>64>64>64>64>64>64
5c>64>64>64>64>64>64>64>64
6a>64>64>64>64>64>64>64>64
6b>32>32>32>32>32>32>32>32
VAN4-------
OXA----0.2---
MIC, minimal inhibitory concentration; MBC, minimal bactericidal concentration; VAN, vancomycin; OXA, oxacillin.
Table 6. Percentage of biofilm formation in the presence of 5a after 24 h incubation.
CompoundConcentrationBiofilm Biomass (% of Control)
E. faecalis ATCC 29212S. aureus ATCC 29213
5a64 µg/mL-0.00 ± 0.06 ***
32 µg/mL0.01 ± 0.01 ***0.04 ± 0.12 ***
16 µg/mL0.02 ± 0.01 ***-
DMSO1% (v/v)1.00 ± 0.03 ***1.00 ± 0.01 ***
Data are shown as mean ± SD of three independent experiments. One-sample t-test: * p < 0.05, ** p < 0.01, *** p < 0.001 significantly different from 100%.
Publisher’s Note: MDPI stays neutral with regard to jurisdictional claims in published maps and institutional affiliations.

