Article

Precursor-Directed Biosynthesis Mediated Amplification of Minor Aza Phenylpropanoid Piperazines in an Australian Marine Fish-Gut-Derived Fungus, Chrysosporium sp. CMB-F214

by
Ahmed H. Elbanna
1,2,†,
Amila Agampodi Dewa
1,†,
Zeinab G. Khalil
1 and
Robert J. Capon
1,*
1
Institute for Molecular Bioscience, The University of Queensland, St Lucia, QLD 4072, Australia
2
Department of Pharmacognosy, Faculty of Pharmacy, Cairo University, Cairo 11562, Egypt
*
Author to whom correspondence should be addressed.
Both the authors contribute equally to this paper.
Mar. Drugs 2021, 19(9), 478; https://doi.org/10.3390/md19090478
Submission received: 9 August 2021 / Revised: 23 August 2021 / Accepted: 24 August 2021 / Published: 25 August 2021
(This article belongs to the Special Issue Fungal Natural Products: An Ongoing Source for New Drug Leads)

Abstract

:
Chemical analysis of an M1 agar plate cultivation of a marine fish-gut-derived fungus, Chrysosporium sp. CMB-F214, revealed the known chrysosporazines A–D (1114) in addition to a suite of very minor aza analogues 16. A microbioreactor (MATRIX) cultivation profiling analysis failed to deliver cultivation conditions that significantly improved the yields of 16; however, it did reveal that M2 agar cultivation produced the new natural product 15. A precursor-directed biosynthesis strategy adopting supplementation of a CMB-F214 M1 solid agar culture with sodium nicotinate enhanced production of otherwise inaccessible azachrysposorazines A1 (1), A2 (2), B1 (3), C1 (4), C2 (5) and D1 (6), in addition to four new chrysosporazines; chrysosporazines N–P (79) and spirochrysosporazine A (10). Structures inclusive of absolute configurations were assigned to 115 based on detailed spectroscopic and chemical analyses, and biosynthetic considerations. Non-cytotoxic to human carcinoma cells, azachrysosporazies 15 were capable of reversing doxorubicin resistance in P-glycoprotein (P-gp)-overexpressing human colon carcinoma cells (SW620 Ad300), with optimum activity exhibited by the C-2′ substituted analogues 35.

1. Introduction

During prior investigations into Australian marine-derived fungi, we reported on the gastrointestinal tract (GIT) of fresh market-purchased fish (Mugil mullet) as a rich source of taxonomically and chemically diverse fungi. We went on to report on the discovery of rare lipodepsipeptide scopularides from Scopulariopsis spp. CMB-F458 and CMB-F115, and Beauveria sp. CMB-F585 [1]; unprecedented hydrazine N-amino-l-proline methyl ester and associated Schiff base artifact prolinimines from Evlachovaea sp. CMB-F563 [2,3]; and N-benzoyl and N-cinnamoyl phenylpropanoid piperazine chrysosporazines from Chrysosporium spp. CMB-F214 and CMB-F294, respectively [4,5]. The chrysosporazines were particular noteworthy, being non-cytotoxic to human carcinoma cells but exhibiting promising inhibitory activity against the multidrug resistance efflux pump P-glycoprotein (P-gp). For example, P-gp-overexpressing human colon carcinoma (SW620 Ad300) cells pre-treated with chrysosporazine F (2.5 µM) acquired a gain in sensitivity (GS 14) against the anticancer agent doxorubicin, >2-fold that of the positive control verapamil (GS 6.1), making chrysosporazine F one of the more potent P-gp inhibitors reported to date [5]. We now report a precursor-directed biosynthesis strategy where supplementation of a CMB-F214 M1 solid agar culture with sodium nicotinate enhanced production of otherwise inaccessible new natural products—namely azachrysposorazines A1 (1), A2 (2), B1 (3), C1 (4), C2 (5) and D1 (6), chrysosporazines N–P (79) and spirochrysosporazine A (10)—along with the known chrysosporazines A–D (1114). By contrast, a CMB-F214 M2 solid agar culture without precursor supplementation produced a new natural product, chrysosporazine Q (15). Structures were assigned to 115 (Figure 1) on the basis of detailed spectroscopic and chemical analyses, and biosynthetic considerations. Access to 115 facilitated a structure–activity relationship analysis on the P-gp inhibitory properties of this novel class of phenylpropanoid piperazines.

2. Results and Discussion

UPLC-DAD (210 nm) analysis of an M1 agar plate cultivation of CMB-F214 revealed the known chrysosporazines A–D (1114) accompanied by a suite of earlier-eluting very minor co-metabolites 16 (Figure 2A). A microbioreactor (MATRIX) cultivation profiling analysis employing 12 media compositions under solid phase as well as shaken and static broth failed to deliver cultivation conditions that significantly improved the yields of 16; however, it did reveal that M2 solid-phase agar cultivations produced the new natural product 15 (Figure 2B and Figures S1 and S2). Notwithstanding low yields for 1–6, a trace amount of pure 4 recovered from a large-scale CMB-F214 rice cultivation possessed a molecular formula (C28H27N3O5) suggestive of an aza analogue of the co-metabolite chrysosporazine C (13) (C29H28N2O5). Consistent with this hypothesis, the (albeit limited) 1D NMR (DMSO-d6) data for 4 indicated incorporation of an N-nicotinoyl moiety, rather than the N-benzoyl moiety found in 13, leading to speculation that nicotinic acid (i.e., niacin, vitamin B3) may be a rate-limiting biosynthetic precursor. This view was validated when analytical scale M1 solid-phase and static broth cultures of CMB-F214 supplemented with sodium nicotinate generated enhanced yields of the target aza analogues 16 (Figure 2A and Figure S3), as well as four new exemplars (710) of the chrysosporazine class. A large-scale 18-day cultivation of CMB-F214 on M1 agar plates supplemented with sodium nicotinate (2 mg/mL) was subjected to solvent extraction, trituration and reversed phase fractionation to yield the new metabolites 110, while comparable treatment of a large-scale 8-day M2 agar plate cultivation yielded the new metabolite 15. An account of the structure elucidation of 110 and 15 is outlined below.
HRESI(+)MS measurements on 1 and 2 returned isomeric molecular formulae (C21H19N3O5, Δmmu +0.2 and +0.7, respectively) consistent with aza analogues of chrysosporazine A (11) (C22H20N2O5). Comparison of the 1D NMR (DMSO-d6) data for 1 (Table 1 and Table 2, Tables S1 and S10, Figures S4–S7) with 11 revealed many similarities, with key differences attributed to replacement of the C-3″ to C-3 cyclised N-benzoyl moiety in 11, with a C-3″ to C-3 cyclised N-nicotinoyl moiety in 1. The N-4″ regiochemistry in 1 was evident from the contiguous nature and significant deshielding of H-5″ (δH 8.56, dd, 4.8, 1.8 Hz) and H-7″ (δH 8.26, dd, 7.8, 1.8 Hz) relative to H-6″ (δH 7.43, ddd, 7.8, 4.8, 0.8 Hz), as well as diagnostic 2D NMR correlations (Figure 3). Comparison of the 1D NMR (DMSO-d6) data for 2 (Table 1 and Table 2, Tables S2 and S10, Figures S8–S12) with that for 1 and 11 attributed differences to an alternate N-6″ N-nicotinoyl regiochemistry, as would be expected by cyclisation of an alternate C-1″ to C-2″ rotamer to C-3. The N-6″ regiochemistry was evident from J4″,5″ ortho coupling (5.0 Hz) and lack of coupling to H-7″, deshielding of H-5″ (δH 8.59) and H-7″ (δH 9.03) relative to H-4″ (δH 6.66), and diagnostic 2D NMR correlations (Figure 3). The E rotamer configuration of the acetamide in 1 and 2 was evident from ROESY correlations between N-COCH3 and H-2′ (Figure 3), while excellent concordance among key 1H NMR resonances in 1H 4.47, ddd, 12.3, 9.8, 3.0 Hz, H-2; 4.51, d, 12.3 Hz, H-3) and 2H 4.49, ddd, 12.1, 9.8, 3.0 Hz, H-2; 4.46, d, 12.1 Hz, H-3) with 11H 4.44, ddd, 12.2, 10.4, 3.1 Hz, H-2; 4.36, d, 12.2 Hz, H-3) suggested a common diaxial relative configuration. These observations, together with biosynthetic considerations and the fact the absolute configuration for 11 had been prior confirmed by X-ray analysis [4] permitted assignment of the structures for azachrysosporazines A1 (1) and A2 (2) as shown.
HRESI(+)MS measurement on 3 returned a molecular formula (C28H25N3O6, Δmmu –0.5) consistent with an aza analogue of chrysosporazine B (12) (C29H26N2O6). Comparison of the 1D NMR (DMSO-d6) data for 3 (Table 1 and Table 2, Tables S3 and S11, Figures S13–S18) with 12 revealed many similarities, including the presence of major and minor acetamide rotamers (ratio 1:0.3), with key differences attributed to replacement of the C-3″ to C-3 cyclised N-benzoyl moiety in 12, with a C-3″ to C-3 cyclised N-nicotinoyl moiety in 3. The N-4″ regiochemistry in 3 was evident from the contiguous nature and significant deshielding of H-5″ (δH 8.64, dd, 4.7, 1.8 Hz) and H-7″ (δH 8.18, dd, 7.8, 1.8 Hz) relative to H-6″ (δH 7.44, dd, 7.8, 4.7 Hz), as well as diagnostic 2D NMR correlations (Figure 4). ROESY correlations between N-COCH3 and Ha-1 in 3 permitted assignment of a Z configuration about the major acetamide rotamer (Figure 4), while excellent concordance among key 1H NMR resonances in 3H 4.21, ddd, 9.8, 5.4, 3.8 Hz, H-2; 4.46, d, 5.4 Hz, H-3; 5.89, dd, 5.7, 1.3 Hz, H-2′) and 12H 4.20, ddd, 8.5, 8.0, 3.9 Hz, H-2; 4.39, d, 8.0 Hz, H-3; 5.86, dd, 5.5, 1.3 Hz, H-2′) supported a common relative configuration. This, together with biosynthetic considerations and the fact the absolute configuration for 12 had been prior confirmed by X-ray analysis [4], permitted assignment of the structure for azachrysosporazine B1 (3) as shown.
HRESI(+)MS measurements on 4 and 5 returned isomeric molecular formulae (C28H27N3O5, Δmmu +1.2 and +1.2, respectively) consistent with aza analogues of chrysosporazine C (13) (C29H28N2O5). Comparison of the 1D NMR (DMSO-d6) data for 4 (Table 1 and Table 2, Tables S4 and S12, Figures S19–S24) with 13 revealed many similarities, including the presence of major and minor acetamide rotamers (ratio 1:0.2), with key differences attributed to replacement of the C-3″ to C-3 cyclised N-benzoyl moiety in 13, with a C-3″ to C-3 cyclised N-nicotinoyl moiety in 4. The N-4″ regiochemistry in 4 was evident from the contiguous nature and significant deshielding of H-5″ (δH 8.60, dd, 4.7, 1.8 Hz) and H-7″ (δH 8.18, dd, 7.8, 1.8 Hz) relative to H-6″ (δH 7.45, dd, 7.8, 4.7 Hz), as well as diagnostic 2D NMR correlations (Figure 4). Comparison of the 1D NMR (DMSO-d6) data for 5 (Table 1 and Table 2, Tables S5 and S12, Figures S25–S30) with that for 4 and 13 revealed many similarities, including the presence of major and minor acetamide rotamers (ratio 1: 0.2), with key differences attributed to an alternate N-6″ N-nicotinoyl regiochemistry, as would be expected by C-3 cyclisation with an alternate C-1″ to C-2″ rotamer. The N-6″ regiochemistry was evident from deshielding of H-5″ (δH 8.60) and H-7″ (δH 9.08) relative to H-4″ (δH 6.72), and diagnostic 2D NMR correlations (Figure 4). ROESY correlations between N-COCH3 and H-2′ in 4 and 5 (in common with 13) permitted assignment of a E configuration for the major acetamide rotamers (Figure 4), with excellent concordance among key 1H NMR resonances in 4H 3.88, ddd, 11.4, 10.0, 3.8 Hz, H-2; 4.49, d, 10.0 Hz, H-3; 4.56, dd, 13.4, 1.1 Hz, Ha-1′; 3.00, m, Hb-1′; 4.25, m, H-2′), 5H 3.91, ddd, 11.2, 11.0, 3.9 Hz, H-2; 4.46, d, 11.2 Hz, H-3; 4.56, dd, 13.5, 1.2 Hz, Ha-1′; 2.95, dd, 13.5, 4.1 Hz, Hb-1′; 4.27, m, H-2′) and 13H 3.85, ddd, 11.0, 11.0, 3.9 Hz, H-2; 4.38, d, 11.0 Hz, H-3; 4.58, dd, 13.5, 1.2 Hz, Ha-1′; 2.95, dd, 13.5, 4.2, Hb-1′; 4.25, m, H-2′) supporting a common relative configuration. This, together with biosynthetic considerations, permitted assignment of the structures for azachrysosporazines C1 (4) and C2 (5) as shown.
HRESI(+)MS measurement on 6 returned a molecular formula (C28H29N3O5, Δmmu 0.0) consistent with an aza analogue of chrysosporazine D (14) (C29H30N2O5). As with 14, the NMR (DMSO-d6) data for 6 (Figures S31 and S32) was heavily broadened, suggestive of equilibrating rotamers. UPLC-DAD-QTOF analysis of the acid hydrolysate prepared from 6 yielded a peak (m/z [M + H]+ 341, C20H24N2O3) (Figure S64 and Scheme S3) that co-eluted with an authentic sample of the piperazine 16 (Figure 5) previously prepared and fully characterised following acid hydrolysis of 14 [4]. These observations, together with biosynthetic considerations, permitted assignment of the structure for azachrysosporazine D1 (6) as shown.
HRESI(+)MS measurements on 7 and 8 returned isomeric molecular formulae (C29H28N2O6, Δmmu −0.6 and −0.1, respectively) consistent with reduced (+H2) analogues of chrysosporazine B (12). Comparison of the 1D NMR (DMSO-d6) data for 7 and 8 (Table 3 and Table 4 and Tables S6 and S7, Figures S33–S44) with 12 revealed many similarities, including major and minor acetamide rotamers (ratio 1:0.2 in 7, 1:0.3 in 8), with differences attributed to replacement of the asymmetric 6,7-methylenedioxy-8-methoxy-4-benzyl moiety in 12 with a symmetric 6,8-dimethoxy-7-hydroxy-4-benzyl moiety in 7 and 8. Diagnostic 2D NMR correlations supported this structure, with a ROESY correlation between N-COCH3 and H-1 confirming the major acetamide rotamers in both 7 and 8 having a Z configuration (Figure 6). Excellent concordance in key 1H NMR resonances for 7H 4.27, ddd, 12.4, 9.0, 4.1 Hz, H-2; 4.36, d, 9.0 Hz, H-3; 4.76, dd, 14.3, 1.9 Hz, Ha-1′; 3.52, dd, 14.3, 5.5, Hb-1′; 5.83, dd, 5.5, 1.9, H-2′) and 12H 4.20, ddd, 8.5, 8.0, 3.9 Hz, H-2; 4.39, d, 8.0 Hz, H-3; 4.78, dd, 14.1, 1.3 Hz, Ha-1′; 3.48, dd, 14.1, 5.5, Hb-1′; 5.86, dd, 5.5, 1.3, H-2′) supported a common relative configuration, which together with biosynthetic considerations permitted assignment of the structure for chrysosporazine N (7) as shown. By contrast, key differences in the 1H NMR data for 8H 4.37, dd, 14.1, 7.1 Hz, Ha-1′; 3.98, dd, 14.1, 4.5, Hb-1′; 5.67, dd, 7.1, 4.5, H-2′) compared to both 7 and 12, together with biosynthetic considerations, supported assignment of the 2′-epimer structure for chrysosporazine O (8) as shown.
HRESI(+)MS measurement on 9 returned a molecular formula (C29H32N2O5, Δmmu +1.0) consistent with a reduced (+H2) analogue of chrysosporazine D (14). As with 14, the NMR (DMSO-d6) data for 9 (Figures S45 and S46) was heavily broadened, and indicative of an equilibrating mixture of acetamide and benzamide rotamers. Fortuitously, cultivation of CMB-F214 on M2 agar plates yielded a new metabolite 15, which HRESI(+)MS measurement attributed a molecular formula (C22H28N2O4, Δmmu 0.0). Analysis of the 1D NMR (DMSO-d6) data for 15 (Table 3 and Table 4 and Table S9, Figures S53–S58) revealed the now almost ubiquitous major and minor acetamide rotamers (ratio 1:0.3), a symmetric 6,8-dimethoxy-7-hydroxy-4-benzyl moiety in common with 7 and 8, and a core piperazine bearing an unsubstituted benzyl moiety. Diagnostic 2D NMR correlations permitted assembly of the planar structure, with a ROESY correlation between N-COCH3 and H-2′ confirming an E configuration for the major acetamide rotamer (Figure 6). These observations, together with biosynthetic considerations and the fact that acid hydrolysis of 9 and 15 yielded a common co-eluting piperazine 19 (along with production of 15 from 9) (Figure 5, Figure S65 and Scheme S4), allowed assignment of the structures for chrysosporazine P (9) and Q (15) as shown.
HRESI(+)MS measurement on 10 returned a molecular formula (C20H22N2O5, Δmmu +0.1) suggestive of truncated analogue of chrysosporazine Q (15). Analysis of the 1D NMR (DMSO-d6) data for 10 (Table 3 and Table 4 and Table S8, Figures S47–S52) revealed major and minor acetamide rotamers (ratio 1:0.6), with resonances attributed to C-1′ to C-9′ in common with 15. Consideration of diagnostic 2D NMR correlations allowed assembly of the planar structure for 10, with a ROESY correlation between N-COCH3 and H-2′ confirming an E configuration about the major acetamide rotamer (Figure 7). ROESY correlations between H-2 and Hα-3, and between Hβ-3 and H-7, established the relative configuration about C-2/C-4, which together with biosynthetic considerations permitted assignment of the structure for spirochrysosporazine A (10) as shown. A plausible biosynthesis pathway leading to 10 could proceed via enzyme-mediated (stereospecific) oxidative aromatic ring contraction and sequential lactonisation and lactamisation of 15 (Figure 8).
As with chrysosporazines 1114, the new metabolites 110 and 15 did not show any growth inhibitory properties (IC50 > 30 µM) against the Gram-positive and Gram-negative bacteria, the fungus Candida albicans (Figure S67), or human colon (SW620) and P-glycoprotein (P-gp)-overexpressing human colon (SW620 Ad300) carcinoma cells (Figure 9). Significantly, 110 and 15 reversed doxorubicin resistance in SW620 Ad300 carcinoma cells, with 1 and 2 inducing a gain in sensitivity (GS) comparable to, and 35 >2.5-fold that of the positive control verapamil (Table 5, Figure 9). A structure–activity relationship analysis based on these results suggests the methylenedioxy ring, C-3/C-3″ cyclisation and C-2′ substitution are key determinants for improved P-gp inhibition.

3. Materials and Methods

3.1. Chrysosporium sp. CMB-F214 Collection, Isolation and Taxonomy

The fungus Chrysosporium sp. CMB-F214 was isolated from the gastrointestinal tract of a specimen of Mugil mullet fish, on an M1 agar plate in the presence of 3.3% artificial sea salt (M1S), and incubated at 26.5 °C for eight days. Genomic DNA for CMB-F214 was extracted from its mycelia using the DNeasy Plant Mini Kit (Qiagen, Brisbane, Australia) as per the manufacturer’s protocol and as previously described [4]. A BLAST analysis (NCBI database) on the amplified ITS gene sequence (GenBank accession no. MN249497) revealed 99% homology with Chrysosporium lobatum.

3.2. Chrysosporium sp. CMB-F214 Media MATRIX Study

From an agar plate culture of the fungus Chrysosporium sp. CMB-F214, spores were transferred into 24-well microbioreactors (MBRs) charged with a range of different culture media (×12), and in solid (2.5 mL), broth static (1.5 mL) and broth shaken (1.5 mL) formats. MBRs were incubated at 26.5 °C for 8 days, with 190 rpm for shaken broth. After incubation, individual wells were extracted in situ with EtOAc (2 mL, each), filtered and dried under N2. The resulting extracts were dissolved in MeOH (100 µL for solid and 50 µL for broth, each containing trace levels of an internal calibrant) and analysed by Ultra-High Performance Liquid Chromatography-diode array detector (UPLC-DAD) and Ultra-High Performance Liquid Chromatography-quadrupole time of flight (UPLC-QTOF), with the resulting chromatograms compared at the same scale (Figures S1 and S2)

3.3. Analytical Precursor-Directed (Nicotinate) Feeding Study

Sodium salts of nicotinic acid were prepared by dissolving in equal amounts of saturated NaHCO3 solution and sterile H2O to provide the required concentrations (pH ~7). A 24-well MBR was used to obtain miniaturised cultures where M1 broth media (1400 µL) was mixed with the corresponding sodium salt concentration (100 µL) to provide final concentrations of 2 and 4 mg/mL. A single colony of Chrysosporium sp. CMB-F214 was inoculated in each well and incubated under static conditions for eight days at 26.5 °C. After incubation, the cultures were extracted in situ with EtOAc (2 mL), filtered and dried under N2 affording the corresponding extracts. These extracts were dissolved in MeOH (100 µL) and subjected to UPLC-DAD and UPLC-QTOF analyses. For the agar plate cultures, a similar procedure was adopted. The sodium nicotinate solution was prepared, mixed with M1 agar media before solidification (2 mg/mL as final concentration), poured to plates and left to solidify. Spores of the fungus CMB-F214 were inoculated on the agar plates and incubated for eight days at 26.5 °C. After incubation, the agar cultures were chopped, extracted with EtOAc, filtered, dried under N2 and analysed by UPLC-DAD and UPLC-QTOF. (Figure 2A and Figure S3)

3.4. M2 Agar Scale-up Culture and Production of Chrysosporazine Q (15)

The fungus Chrysosporium sp. CMB-F214 was inoculated on M2 agar (×40 plates), incubated at 26.5 °C for eight days, after which the agar cultures were chopped, extracted with EtOAc (2 × 400 mL), filtered and concentrated in vacuo at 40 °C, to yield the crude extract (300 mg). The crude extract was then defatted using n-hexane (20 mL × 3) providing the defatted crude extract (250 mg). A portion of the latter (200 mg) was treated with MeOH (2 mL), sonicated, centrifuged and the supernatant was subjected to gel chromatography (Sephadex® LH-20 2.5 cm × 70 cm column, gravity elution with isocratic MeOH). Fractions (10 mL) were collected and monitored by UPLC-DAD and UPLC-QTOF, and collective fraction A (75 mg) was rich in target compound 15. An aliquot of fraction A (20 mg) was subjected to semi-preparative reversed phase HPLC (ZORBAX SB-C8 9.4 mm × 25 cm, 5 µm, 3 mL/min gradient elution 90–0% H2O/MeCN inclusive of 0.1% TFA modifier over 20 min) to yield chrysosporazine Q (15) (7 mg). (Scheme S1)

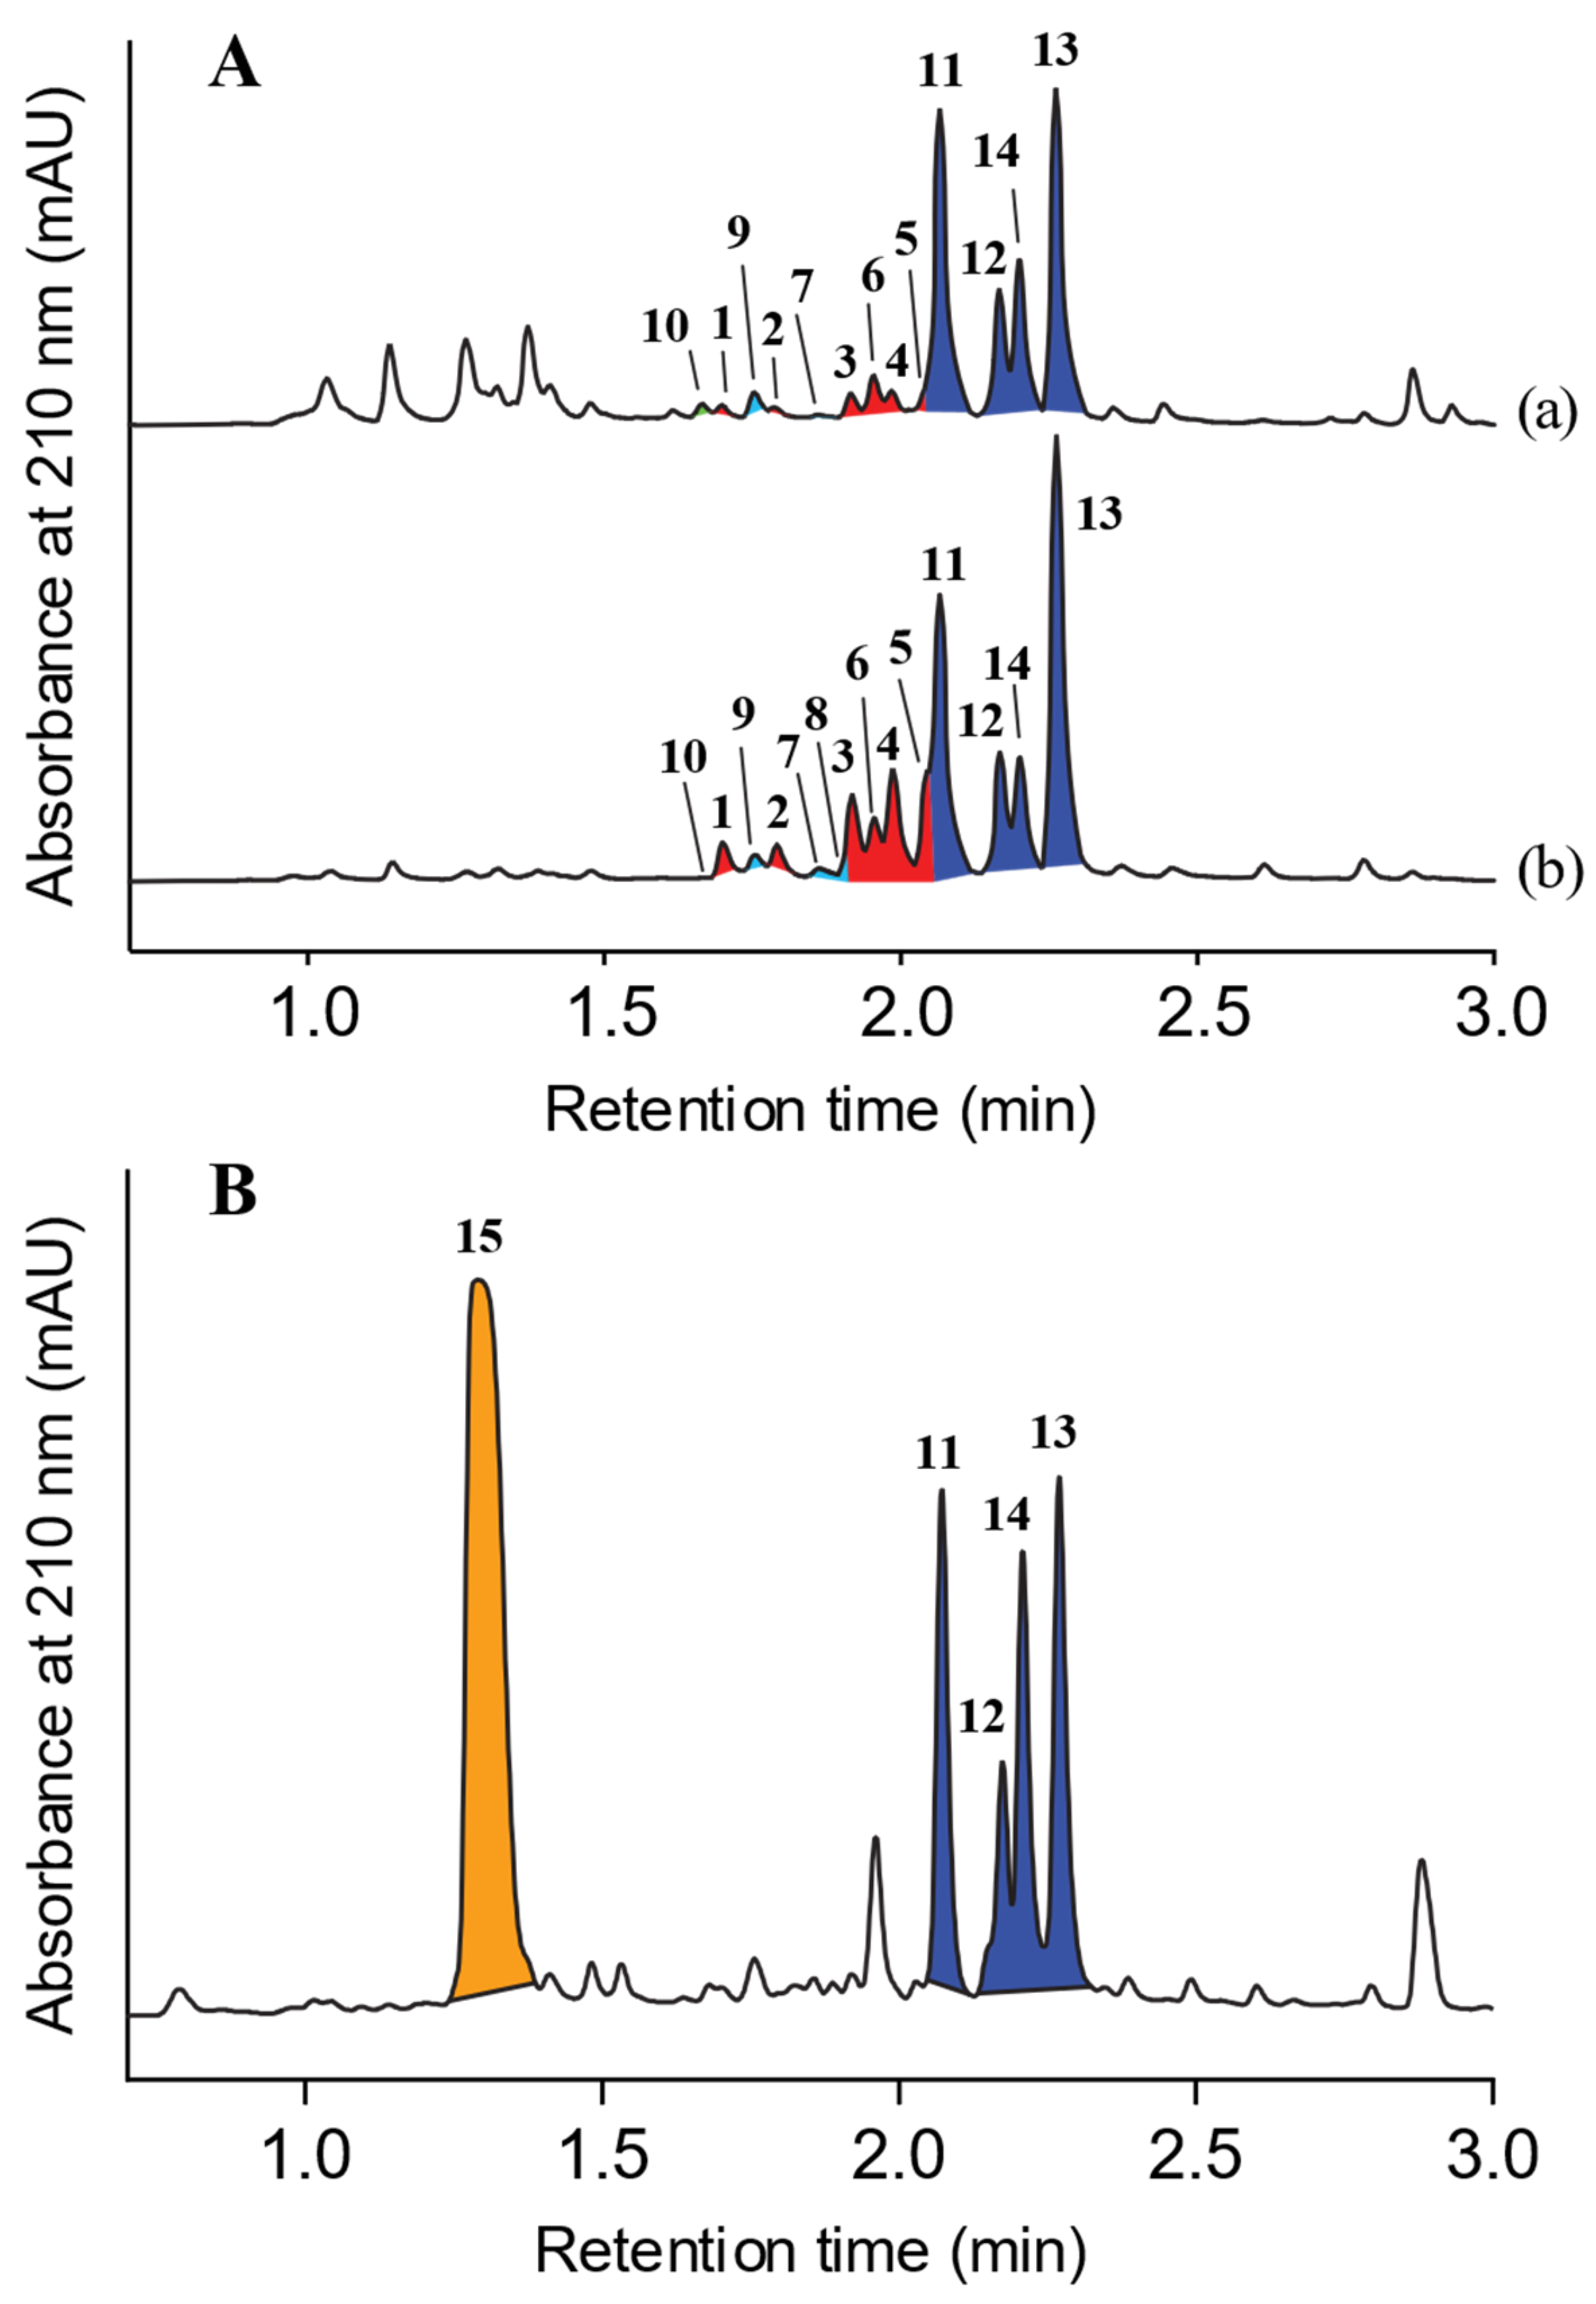
3.5. Chrysosporium sp. CMB-F214 Culture Supplemented with Sodium Nicotinate Leading to Amplified Production of the Minor Natural Products, Azachrysosporazines 16, New Chrysosporazines 79 and Spirochrysosporazine A (10)

Sodium nicotinate solution was prepared by dissolving nicotinic acid (3.2 g) in saturated NaHCO3 solution (26.6 mL) and H2O (26.6 mL) (pH~7). The salt solution was added to warm M1 agar media (final concentration of 2 mg/mL) and stirred for 5 min, then poured to plates and allowed to cool down. The fungus Chrysosporium sp. CMB-F214 was inoculated on the agar plates (×80), incubated at 26.5 °C for 18 days, then extracted with EtOAc (4 × 500 mL), filtered and concentrated in vacuo at 40 °C, to yield the crude extract (482 mg). The crude extract was then triturated with n-hexane (20 mL × 3) providing, after in vacuo concentration, the n-hexane solubles (98 mg) and the defatted MeOH solubles (380 mg). The MeOH solubles fraction (380 mg) was further fractionated by preparative reversed phase HPLC (Phenomenex Luna-C8 21.2 mm × 25 cm × 10 µm, 20 mL/min 90–0% H2O/MeCN gradient elution over 20 min inclusive of an isocratic 0.1% TFA). Fractions A–E were determined as rich in target compounds (1–10) on the basis of UPLC-DAD and UPLC-QTOF analyses. Fraction A (4.2 mg) was subjected to a semi-preparative reversed phase HPLC (ZORBAX SB-C3 9.4 mm × 25 cm, 5 µm, 3 mL/min isocratic elution 70% H2O/MeCN inclusive of 0.1% TFA modifier over 33 min) to yield azachrysosporazine A2 (2) (1.2 mg). Fraction B (5.5 mg) was subjected to a semi-preparative reversed phase HPLC (ZORBAX SB-C3 9.4 mm × 25 cm, 5 µm, 3 mL/min isocratic elution 75% H2O/MeCN inclusive of 0.1% TFA modifier over 37 min) to yield azachrysosporazine A1 (1) (1.0 mg) and spirochrysosporazine A (10) (1.8 mg). Fraction C (5.0 mg) was subjected to a semi-preparative reversed phase HPLC (ZORBAX SB-C3 9.4 mm × 25 cm, 5 µm, 3 mL/min isocratic elution 62% H2O/MeCN inclusive of 0.1% TFA modifier over 35 min) to yield azachrysosporazine C2 (5) (2.0 mg) and azachrysosporazine D1 (6) (0.4 mg). Fraction D (7.0 mg) was subjected to a semi-preparative reversed phase HPLC (ZORBAX SB-C3 9.4 mm × 25 cm, 5 µm, 3 mL/min isocratic elution 62% H2O/MeCN inclusive of 0.1% TFA modifier over 25 min) to yield azachrysosporazine B1 (3) (1.4 mg), chrysosporazine N (7) (1.4 mg) and chrysosporazine O (8) (1.1 mg). Fraction E (5.5 mg) was subjected to a semi-preparative reversed phase HPLC (ZORBAX SB-C3 9.4 mm × 25 cm, 5 µm, 3 mL/min isocratic elution 75% H2O/MeCN inclusive of 0.1% TFA modifier over 35 min) to yield azachrysosporazine C1 (4) (1.5 mg) and chrysosporazine P (9) (1.2 mg). (Scheme S2).

3.6. Metabolites’ Characterisation

  • Azachrysosporazine A1 (1); yellow oil; [α]D21.2 − 88.4 (c 0.083, MeOH); NMR (600 MHz, DMSO-d6) see Table 1 and Table 2 and Table S1, Figures S4–S7; ESI(+)MS m/z 394 [M + H]+; HRESI(+)MS m/z 394.1399 [M + H]+ (calcd for C21H20N3O5, 394.1397).
  • Azachrysosporazine A2 (2); yellow oil; [α]D21.2 − 55.0 (c 0.1, MeOH); NMR (600 MHz, DMSO-d6) see Table 1 and Table 2 and Table S2, Figures S8–S12; ESI(+)MS m/z 394 [M + H]+; HRESI(+)MS m/z 394.1404 [M + H]+ (calcd for C21H20N3O5, 394.1397).
  • Azachrysosporazine B1 (3); yellow oil; [α]D21.2 + 43.1 (c 0.116, MeOH); NMR (600 MHz, DMSO-d6) see Table 1 and Table 2 and Table S3, Figures S13–S18; ESI(+)MS m/z 500 [M + H]+; HRESI(+)MS m/z 500.1831 [M + H]+ (calcd for C28H26N3O6, 500.1816).
  • Azachrysosporazine C1 (4); yellow oil; [α]D21.2 − 29.6 (c 0.125, MeOH); NMR (600 MHz, DMSO-d6) see Table 1 and Table 2 and Table S4, Figures S19–S24; ESI(+)MS m/z 486 [M + H]+; HRESI(+)MS m/z 486.2035 [M + H]+ (calcd for C28H28N3O5, 486.2023).
  • Azachrysosporazine C2 (5); yellow oil; [α]D21.2 − 36.3 (c 0.166, MeOH); NMR (600 MHz, DMSO-d6) see Table 1 and Table 2 and Table S5, Figures S25–S30; ESI(+)MS m/z 486 [M + H]+; HRESI(+)MS m/z 486.2035 [M + H]+ (calcd for C28H28N3O5, 486.2023).
  • Azachrysosporazine D1 (6); yellow oil; [α]D22.2 + 19.3 (c 0.033, MeOH); NMR (600 MHz, DMSO-d6) see Figures S31–S32; ESI(+)MS m/z 488 [M + H]+; HRESI(+)MS m/z 488.2180 [M + H]+ (calcd for C28H30N3O5, 488.2180).
  • Chrysosporazine N (7); yellow oil; [α]D21.2 + 5.3 (c 0.166, MeOH); NMR (600 MHz, DMSO-d6) see Table 3 and Table 4 and Table S6, Figures S33–S38; ESI(+)MS m/z 501 [M + H]+; HRESI(+)MS m/z 501.2014 [M + H]+ (calcd for C29H29N2O6, 501.2020).
  • Chrysosporazine O (8); yellow oil; [α]D21.2 − 86.8 (c 0.185, MeOH); NMR (600 MHz, DMSO-d6) see Table 3 and Table 4 and Table S7, Figures S39–S44; ESI(+)MS m/z 501 [M + H]+; HRESI(+)MS m/z 501.2019 [M + H]+ (calcd for C29H29N2O6, 501.2020).
  • Chrysosporazine P (9); yellow oil; [α]D22.2 + 18.4 (c 0.08, MeOH); NMR (600 MHz, DMSO-d6) see Figures S45–S46; ESI(+)MS m/z 489 [M + H]+; HRESI(+)MS m/z 489.2394 [M + H]+ (calcd for C29H33N2O5, 489.2384).
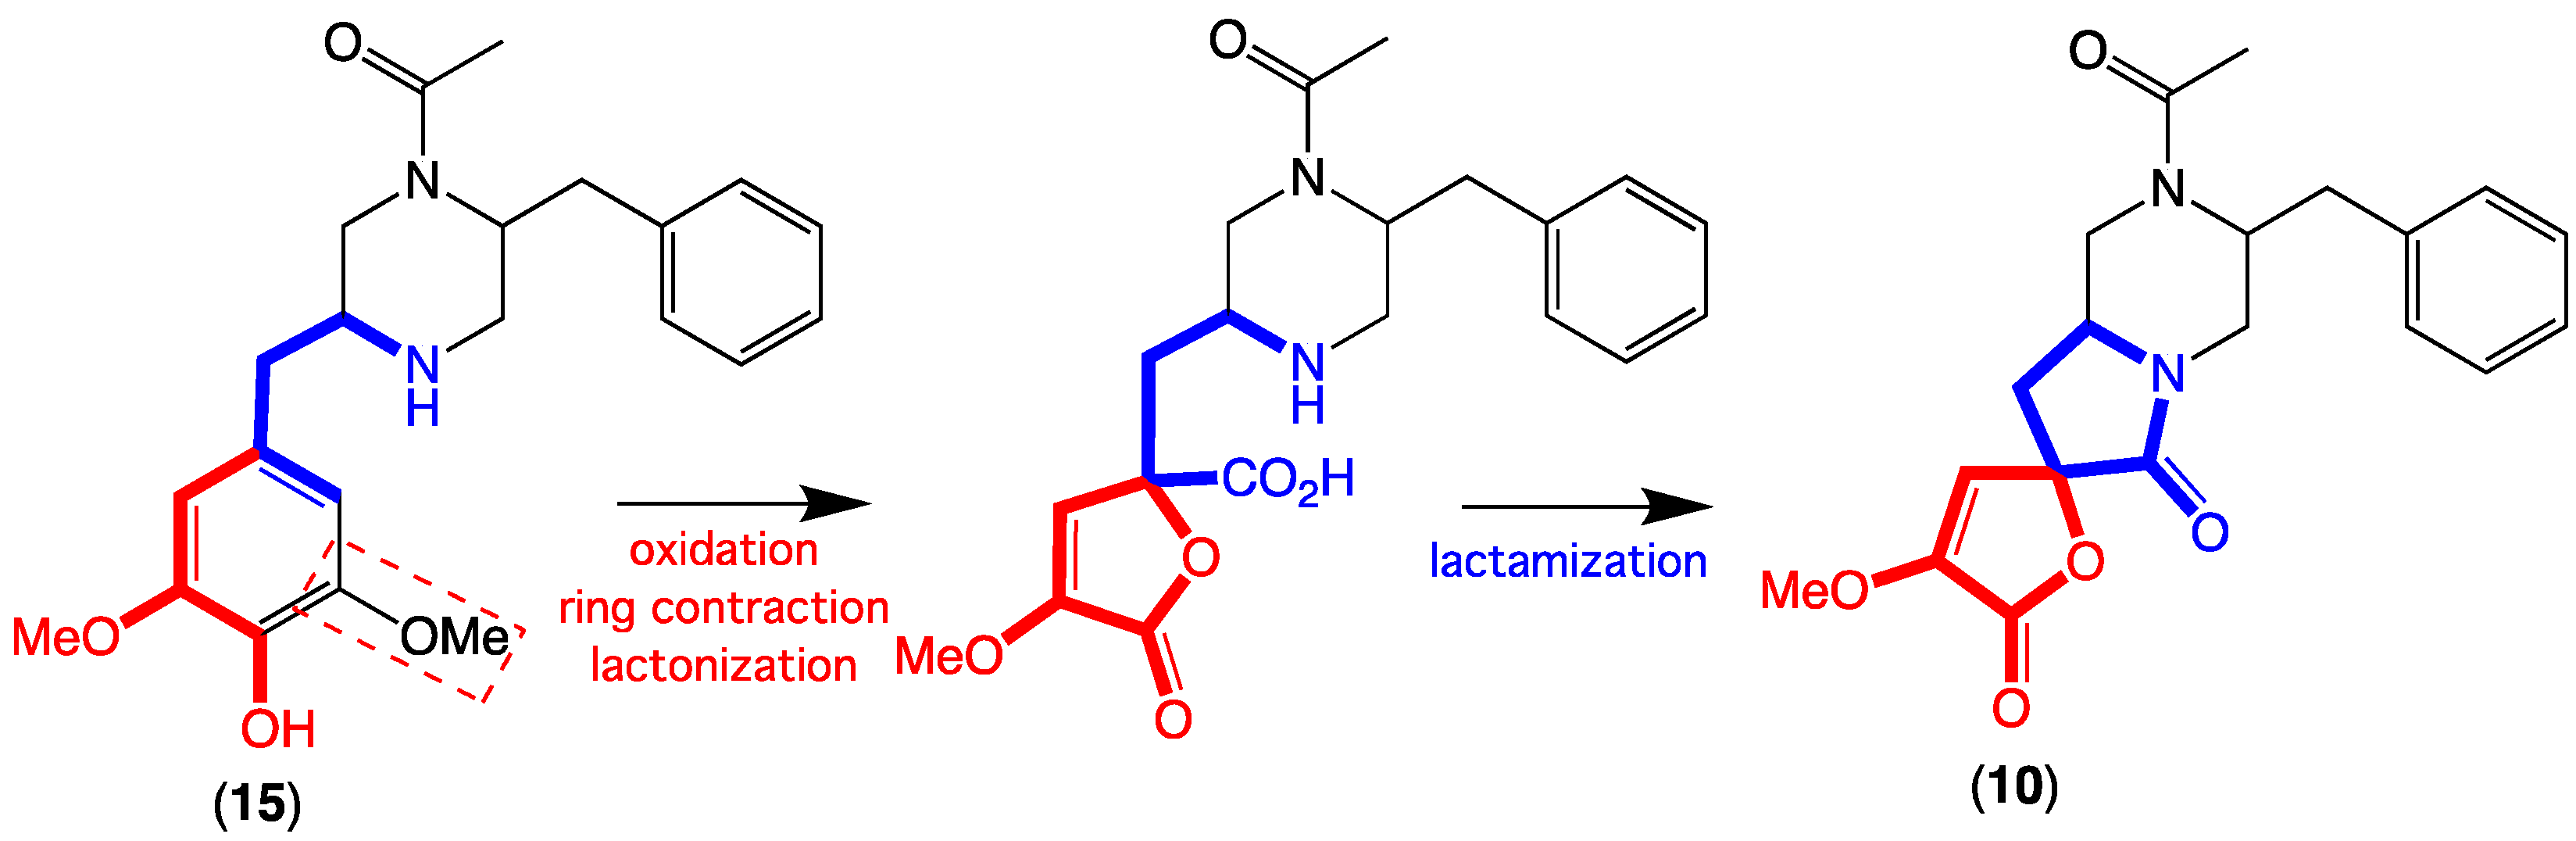
  • Spirochrysosporazine A (10); yellow oil; [α]D21.0 − 76.6 (c 0.154, MeOH); NMR (600 MHz, DMSO-d6) see Table 3 and Table 4 and Table S8, Figures S47–S52; ESI(+)MS m/z 371 [M + H]+; HRESI(+)MS m/z 393.1422 [M + Na]+ (calcd for C20H22N2O5Na, 393.1421).
  • Chrysosporazine Q (15); White powder; [α]D22.5 − 28.2 (c 0.286, MeOH); NMR (600 MHz, DMSO-d6) see Table 3 and Table 4 and Table S9, Figures S53–S58; ESI(+)MS m/z 385 [M + H]+; HRESI(+)MS m/z 385.2122 [M + H]+ (calcd for C22H29N2O4, 385.2122).

3.7. Acid Hydrolysis of Azachrysosporazine D1 (6) and Chrysosporazine P (9)

Aliquots of 6 and 9 (0.1 mg, each) in 1 M HCl (0.3 mL) were heated to 100 °C, and the reaction was monitored by UPLC-DAD and UPLC-QTOF analyses of aliquots (50 µL) taken at 12, 24 and 36 h intervals and compared to the N,N-dideacylated product (16) obtained from a comparable acid hydrolysis of chrysosporazine D (14), as previously described [4]. (Schemes S3 and S4, Figures S64 and S65)

3.8. Antibacterial Assay

The bacterium to be tested was streaked onto a tryptic soy agar plate and was incubated at 37 °C for 24 h. One colony was then transferred to fresh tryptic soy broth (15 mL) and the cell density was adjusted to 104–105 CFU/mL. The compounds to be tested were dissolved in DMSO and diluted with H2O to give 600 µM stock solution (20% DMSO), which was serially diluted with 20% DMSO to give concentrations from 600 µM to 0.2 µM in 20% DMSO. An aliquot (10 µL) of each dilution was transferred to a 96-well microtiter plate and freshly prepared microbial broth (190 µL) was added to each well to give final concentrations of 30–0.01 µM in 1% DMSO. The plates were incubated at 37 °C for 24 h and the optical density of each well was measured spectrophotometrically at 600 nm using POLARstar Omega plate (BMG LABTECH, Offenburg, Germany). Each test compound was screened against the Gram-negative bacteria Escherichia coli ATCC11775 and the Gram-positive clinical isolate bacteria methicillin-resistant Staphylococcus aureus and Bacillus subtilis ATCC 6633. Rifampicin, ampicillin and methicillin were used as a positive control (30 µM in 1% DMSO). The IC50 value was calculated as the concentration of the compound or antibiotic required for 50% inhibition of the bacterial cells using Prism 7.0 (GraphPad Software Inc., La Jolla, CA, USA) (Figure S67).

3.9. Antifungal Assay

The fungus Candida albicans ATCC 10231 was streaked onto a Sabouraud agar plate and was incubated at 37 °C for 48 h. One colony was then transferred to fresh Sabouraud broth (15 mL) and the cell density adjusted to 104–105 CFU/mL. Test compounds were dissolved in DMSO and diluted with H2O to give a 600 µM stock solution (20% DMSO), which was serially diluted with 20% DMSO to give concentrations from 600 µM to 0.2 µM in 20% DMSO. An aliquot (10 µL) of each dilution was transferred to a 96-well microtiter plate and freshly prepared fungal broth (190 µL) was added to each well to give final concentrations of 30–0.01 µM in 1% DMSO. The plates were incubated at 37 °C for 24 h and the optical density of each well was measured spectrophotometrically at 600 nm using a POLARstar Omega plate (BMG LABTECH, Offenburg, Germany). Ketoconazole was used as a positive control (30 µg/ml in 10% DMSO). Where relevant, IC50 values were calculated as the concentration of the compound or antifungal drug required for 50% inhibition of the fungal cells using Prism 7.0 (GraphPad Software Inc., La Jolla, CA, USA) (Figure S67).

3.10. Cytotoxicity Assay

Adherent SW620 (doxorubicin-susceptible human colorectal carcinoma) cells were cultured in Roswell Park Memorial Institute (RPMI) (New York, USA) 1640 medium. All cells were cultured as adherent monolayers in flasks supplemented with 10% foetal bovine serum, L–glutamine (2 mM), penicillin (100 unit/mL) and streptomycin (100 µg/mL), in a humidified 37 °C incubator supplied with 5% CO2. Briefly, cells were harvested with trypsin and dispensed into 96-well microtiter assay plates at 8000 cells/well, after which they were incubated for 48 h at 37 °C with 5% CO2 (to allow cells to attach as adherent monolayers). Test compounds were dissolved in 20% DMSO in PBS (v/v) and aliquots (10 µL) applied to cells over a series of final concentrations ranging from 10 nM to 30 µM. After 48 h incubation at 37 °C with 5% CO2 an aliquot (10 µL) of 3-(4,5-dimethylthiazol-2-yl)-2,5-diphenyltetrazolium bromide (MTT) in phosphate-buffered saline (PBS, 5 mg/mL) was added to each well (final concentration 0.5 mg/mL), and microtiter plates were incubated for a further 4 h at 37 °C with 5% CO2. After final incubation, the medium was aspirated and precipitated formazan crystals dissolved in DMSO (100 µL/well). The absorbance of each well was measured at 600 nm with a POLARstar Omega plate (BMG LABTECH, Offenburg, Germany). Where relevant, IC50 values were calculated using Prism 9.0 GraphPad Software, as the concentration of analyte required for 50% inhibition of cancer cell growth (compared to negative controls). Negative control was 1% aqueous DMSO, while positive control was vinblastine (30 µM). All experiments were performed in duplicate from two independent cultures. (Table 5, Figure 9)

3.11. MDR Reversal (Doxorubicin) Assay (P-glycoprotein Inhibition Assay)

The assay is similar to the above cytotoxicity (MTT) assay. However, instead of measuring the cytotoxicity of azachrysposorazines compounds, this assay was applied to measure the cytotoxicity of doxorubicin against multidrug-resistant SW620 Ad300 (P-gp-overexpressing human colorectal carcinoma) cells, in the presence and absence of PB42 compounds at concentrations that were non-cytotoxic to SW620 Ad300. SW620 Ad300 was cultivated in flasks as adherent monolayers in RPMI medium supplemented with 10% foetal bovine serum, L–glutamine (2 mM), penicillin (100 unit/mL), streptomycin (100 µg/mL) and doxorubicin (300 ng/mL) in a humidified 37 °C incubator supplied with 5% CO2. The cells were passaged 5 times and were maintained in 300 ng/mL of doxorubicin. On the day of the experiment, SW620 Ad300 cells were harvested with trypsin and dispensed into 96-well microtiter assay plates at 8000 cells/well in 180 µL medium per well, after which they were incubated for 48 h at 37 °C with 5% CO2. Following incubation for 48 h, azachrysposorazines A1 (1), A2 (2), B1 (3), C1 (4), C2 (5) and D1 (6), chrysosporazines N–P (79) and spirochrysosporazine A (10), chrysosporazines A–D (1114) and chrysosporazine Q (15) (2.5 µM) were added to the wells containing a series of doxorubicin (30 – 0.01 µM). After 48 h incubation at 37 °C with 5% CO2, a solution of 3-(4,5-dimethylthiazol-2-yl)-2,5-diphenyltetrazolium bromide (MTT) in phosphate-buffered saline (PBS, 5 mg/mL) was added to each well (final concentration 0.5 mg/mL), and microtiter plates were incubated for a further 4 h at 37 °C with 5% CO2. After the media was carefully aspirated, the precipitated formazan crystals were dissolved in DMSO (100 µL). The absorbance of each well was measured at 600 nm with a POLARstar Omega plate (BMG LABTECH, Offenburg, Germany). Verapamil (2.5 µM) and DMSO served as positive and negative controls, respectively. All experiments were performed in duplicate from two independent cultures (Table 5, Figure 9).

Supplementary Materials

The following are available online at https://www.mdpi.com/article/10.3390/md19090478/s1, General experimental, tabulated NMR data and annotated spectra, and biological assays and data.

Author Contributions

R.J.C. conceptualized the research; A.H.E. and A.A.D. contributed equally; A.H.E. and A.A.D. carried out the isolation and spectroscopic characterisation of compounds; Z.G.K. performed the biological assays; A.H.E., A.A.D. and Z.G.K. assigned molecular structures and constructed the Supplementary Materials document; R.J.C. reviewed all data and drafted the manuscript, with support from A.H.E., A.A.D. and Z.G.K. All authors have read and agreed to the published version of the manuscript.

Funding

This research was supported in part by The University of Queensland and the Institute for Molecular Bioscience.

Data Availability Statement

Data is contained within the article or Supplementary Material.

Institutional Review Board Statement

Not applicable.

Acknowledgments

The authors thank S. Bates and R. Robey at the National Cancer Institute, Bethesda, MD, USA for providing the SW620 and SW620 Ad300 cell lines. A.H.E. and A.A.D. acknowledges The University of Queensland for a postgraduate research scholarship.

Conflicts of Interest

The authors declare no conflict of interest.

References

  1. Elbanna, A.H.; Khalil, Z.G.; Bernhardt, P.V.; Capon, R.J. Scopularides Revisited: Molecular Networking Guided Exploration of Lipodepsipeptides in Australian Marine Fish Gastrointestinal Tract-Derived Fungi. Mar. Drugs 2019, 17, 475. [Google Scholar] [CrossRef] [PubMed] [Green Version]
  2. Mohamed, O.G.; Khalil, Z.G.; Capon, R.J. Prolinimines: N-Amino-l-Pro-Methyl Ester (Hydrazine) Schiff Bases from a Fish Gastrointestinal Tract-Derived Fungus, Trichoderma Sp. CMB-F563. Org. Lett. 2018, 20, 377–380. [Google Scholar] [CrossRef] [PubMed]
  3. Mohamed, O.G.; Khalil, Z.G.; Capon, R.J. N-Amino-l-Proline Methyl Ester from an Australian Fish Gut-Derived Fungus: Challenging the Distinction between Natural Product and Artifact. Mar. Drugs. 2021, 19, 151. [Google Scholar] [CrossRef] [PubMed]
  4. Elbanna, A.H.; Khalil, Z.G.; Bernhardt, P.V.; Capon, R.J. Chrysosporazines A-E: P-Glycoprotein Inhibitory Piperazines from an Australian Marine Fish Gastrointestinal Tract-Derived Fungus, Chrysosporium Sp. CMB-F214. Org. Lett. 2019, 21, 8097–8100. [Google Scholar] [CrossRef] [PubMed]
  5. Mohamed, O.G.; Salim, A.A.; Khalil, Z.G.; Elbanna, A.H.; Bernhardt, P.V.; Capon, R.J. Chrysosporazines F-M: P-Glycoprotein Inhibitory Phenylpropanoid Piperazines from an Australian Marine Fish Derived Fungus, Chrysosporium Sp. CMB-F294. J. Nat. Prod. 2020, 83, 497–504. [Google Scholar] [CrossRef] [PubMed]
Figure 1. Metabolites 115 from Chrysosporium sp. CMB-F214.
Marinedrugs 19 00478 g001
Figure 2. UPLC-DAD (210 nm) chromatograms of EtOAc extracts of Chrysosporium sp. CMB-F214 cultured in (A) M1 agar media (a) without addition, (b) with addition of 2 mg/mL sodium nicotinate; and (B) M2 agar media; peaks highlighted are new azachrysosporazines 16 (red), new chrysosporazines 79 (light blue) and spirochrysosporazine 10 (green), known chrysosporazines 1114 (blue) and new chrysosporazine 15 (orange).
Marinedrugs 19 00478 g002
Figure 3. Selected 2D NMR (DMSO-d6) correlations for 1 and 2.
Marinedrugs 19 00478 g003
Figure 4. Selected 2D NMR (DMSO-d6) correlations for 35.
Marinedrugs 19 00478 g004
Figure 5. Piperazines 16 from acid hydrolysis of 6 and 14, and 19 from acid hydrolysis of 9 and 15.
Marinedrugs 19 00478 g005
Figure 6. Selected 2D NMR (DMSO-d6) correlations for 78 and 15.
Marinedrugs 19 00478 g006
Figure 7. Selected 2D NMR (DMSO-d6) correlations for 10.
Marinedrugs 19 00478 g007
Figure 8. A plausible biosynthesis of 10 from 15.
Marinedrugs 19 00478 g008
Figure 9. (A) Cytotoxicity of 115, doxorubicin and verapamil against human colon (SW620) carcinoma cells. (B) Effect of 115 or verapamil (2.5 µM) on the sensitivity of P-gp-overexpressing human colon (SW620 Ad300) carcinoma cells to doxorubicin.
Marinedrugs 19 00478 g009
Table 1. 1H NMR (DMSO-d6) data for compounds 15.
PositionδH, mult (J in Hz)(2) δH, mult (J in Hz)(3) δH, mult (J in Hz)(4) δH, mult (J in Hz)(5) δH, mult (J in Hz)
1a. 4.26, ddd
(13.3,3.0, 1.2)
a. 4.21, ddd
(13.1,3.0, 1.2)
a. 3.98, dd
(12.9, 3.8)
a. 4.29, dd
(13.8, 3.8)
a. 4.19, dd
(13.8, 3.9)
b. 2.99, dd
(13.3, 9.8)
b. 2.97, dd
(13.1, 9.8)
b. 3.51 bb. 3.04 a, dd
(13.8, 11.4)
b. 2.99, dd
(13.8, 11.0)
24.47, ddd
(12.3, 9.8, 3.0)
4.49, ddd
(12.1, 9.8, 3.0)
4.21, ddd
(9.8, 5.4, 3.8)
3.88, ddd
(11.4, 10.0, 3.8)
3.91, ddd
(11.2, 11.0, 3.9)
34.51, d (12.3)4.46, d (12.1)4.46, d (5.4)4.49, d (10.0)4.46, d (11.2)
56.57, d (1.4)6.68, d (0.9)6.31, d (1.4)6.49, d (1.4)6.64, d (1.3)
96.65, d (1.4)6.74, d (0.9)6.55, d (1.4)6.63, d (1.4)6.73, d (1.3)
1′6.80, d (6.8)6.81, d (6.8)a. 4.79, dd
(14.1, 1.3)
a. 4.56, dd
(13.4, 1.1)
a. 4.56, dd
(13.5, 1.2)
--b. 3.51 bb. 3.00, mb. 2.95, dd
(13.5, 4.1)
2′6.55, dd (6.8, 1.2)6.56, dd (6.8, 1.2)5.89, dd (5.7, 1.3)4.25, m4.27, m
3′---a. 3.03 a, ma. 3.06, dd
(13.4, 8.8)
---b. 2.90, dd
(13.4, 5.8)
b. 2.93, dd
(13.4, 5.8)
5′/9′--7.97, m7.26, m7.26, m
6′/8′--7.56, m7.30, m7.30, m
7′--7.68, m7.22, m7.23, m
4″-6.66, d (5.0)--6.72, br s
5′′8.56, dd
(4.8, 1.8)
8.59, d (5.0)8.64, dd
(4.7, 1.8)
8.60, dd
(4.7, 1.8)
8.60, br s
6′′7.43, ddd
(7.8, 4.8, 0.8)
-7.44, dd
(7.8, 4.7)
7.45, dd
(7.8, 4.7)
-
7′′8.26, dd
(7.8, 1.8)
9.03, s8.18, dd
(7.8, 1.8)
8.18, dd
(7.8, 1.8)
9.08, br s
NCOCH32.10, s2.10, s2.00, s1.60, s1.59, s
6-OCH26.02/6.00, Abq6.06/6.05, Abq5.95/5.94, Abq5.99/5.99, Abq6.05, br s
8-OCH33.80, s3.81, s3.78, s3.80, s3.82, s
a overlapping resonances, b obscured by solvent signal.
Table 2. 13C NMR (DMSO-d6) data for compounds 15.
Position(1) δC, Type(2) δC, Type(3) δC, Type(4) δC, Type(5) δC, Type
142.3, CH242.1, CH247.3, CH240.1 c, CH239.8 c, CH2
256.9, CH56.5 a, CH59.2, CH58.0, CH56.9, CH
348.8, CH45.4, CH47.2, CH48.8, CH45.7, CH
4132.8, C131.1, C135.3, C134.6, C132.6, C
5103.4, CH103.0 b, CH102.0, CH103.1, CH103.0, CH
6148.5, C149.0, C148.6, C148.5, C148.9, C
7134.0, C134.6, C133.8, C133.8, C134.4, C
8143.1, C143.6, C143.1, C143.1, C143.5, C
9110.1, CH109.6 b, CH108.6, CH109.6, CH109.5, CH
1′106.7, CH106.4, CH42.6, CH245.0, CH244.5, CH2
2′112.6, CH112.7, CH54.3, CH54.6, CH54.3, CH
3′--197.6, C34.9, CH234.8, CH2
4′--134.7, C138.2, C138.2, C
5′/9′--128.2, CH129.4, CH129.4, CH
6′/8′--128.9, CH128.4, CH128.4, CH
7′--133.5, CH126.5, CH126.5, CH
1″158.5, C157.4, C161.9, C163.5, C162.9, C
2″123.2, C123.1, C122.8, C122.9, C123.0, C
3″158.6, C149.8, C158.1, C158.4, C149.3, C
4″-121.5, CH--121.5, CH
5″152.4, CH152.5, CH153.0, CH152.5, CH152.4, CH
6″122.9, CH-123.1, CH122.7, CH-
7″135.4, CH147.9, CH135.6, CH135.5, CH148.3, CH
1-NCOCH3166.7, C166.7, C170.5, C168.4, C168.3, C
1-NCOCH320.8, CH320.8, CH321.4, CH320.7, CH320.6, CH3
6-OCH2101.2, CH2101.6, CH2101.3, CH2101.2, CH2101.5, CH2
8-OCH356.4, CH356.5 a, CH356.4, CH356.4, CH356.4, CH3
a assignments with the same superscript within a column are interchangeable, b detected from HMBC correlations, c obscured by solvent signal.
Table 3. 1H NMR (DMSO-d6) data for compounds 78, 10 and 15.
Position(7) δH, mult (J in Hz)(8) δH, mult (J in Hz)(10) δH, mult (J in Hz)(15) δH, mult (J in Hz)
1a. 3.77, dd (13.6, 4.1)a. 3.68, dd (14.3, 4.1)a. 4.61, dd (13.3, 4.3)a. 4.48, dd (14.5, 3.2)
b. 3.43 ab. 3.61, dd (14.3, 6.8)b. 2.77 b, dd (13.3, 11.7)b. 2.92 b, m
24.27, ddd (12.4, 9.0, 4.1)4.47, ddd (12.4, 6.8, 4.1)3.60, m3.27, m
34.36, d (9.0)4.25, d (12.4)α. 2.51 a, dd (14.8, 7.2)a. 2.88, dd (13.0, 6.2)
--β. 2.39, dd (14.8, 6.3)b. 2.85, dd (13.0, 8.0)
56.54, s6.61, s-6.55, br s
7--6.65, s-
96.54, s6.61, s-6.55, br s
1′a. 4.76, dd(14.3, 1.9)a. 4.37, dd (14.1, 7.1)a. 3.79 c, d (13.4)a. 3.29, m
b. 3.52, dd (14.3, 5.5)b. 3.98, dd (14.1, 4.5)b. 3.18, dd (13.4, 4.4)b. 3.25, m
2′5.83, dd (5.5, 1.9)5.67, dd (7.1, 4.5)4.21, m4.30, m
3′--a. 2.93, dd (13.2, 6.9)a. 3.21, dd (13.7, 10.4)
--b. 2.80 b, dd (13.2, 8.5)b. 2.93 b, m
5′/9′7.97, dd (8.1, 1.0)8.03, dd (8.4, 1.3)7.24 m7.25 m
6′/8′7.55, dd (8.1, 7.6)7.58, dd (7.8, 7.6)7.29, m7.31, m
7′7.67, t (7.6)7.70, t (7.8)7.23, m7.25, m
4″6.82, d (8.7)6.65, d (7.8)--
5′′7.45, ddd (8.7, 7.4, 1.5)7.42, ddd (7.8, 7.4, 1.3)--
6′′7.35, dd (7.7, 7.4)7.35, dd (7.6, 7.4)--
7′′7.85, dd (7.7, 1.5)7.85, dd (7.6, 1.3)--
NCOCH31.91, s1.83, s1.69, s1.46, s
6-OCH33.69, s3.74, s3.80 c, s3.76, s
8-OCH33.69, s3.74, s-3.76, s
7-OH8.43, br s8.53, br s-8.03, br s
1′-NH---9.06, m
a obscured by solvent signal, b,c assignments with the same superscript within a column are overlapping resonances.
Table 4. 13C NMR (DMSO-d6) data for compounds 78, 10 and 15.
Position(7) δC, Type(8) δC, Type(10) δC, Type(15) δC, Type
146.0, CH244.6, CH241.1, CH237.1, CH2
258.5, CH57.7, CH51.1, CH55.9, CH
345.4, CH46.9, CH32.6, CH236.1, CH2
4130.1, C128.0, C85.0, C125.1, C
5106.3, CH106.6, CH166.1, C106.6, CH
6148.3, C148.5, C147.0, C148.0, C
7134.7 a, C135.0, C117.9, CH134.6, C
8148.3, C148.5, C-148.0, C
9106.3, CH106.6, CH-106.6, CH
1′40.9, CH238.8, CH243.0, CH245.9, CH2
2′55.1, CH57.1, CH53.9, CH52.3, CH
3′196.6, C196.3, C34.7, CH234.7, CH2
4′134.7 a, C134.6, C137.9, C137.6, C
5′/9′128.2, CH128.2, CH129.4, CH129.3, CH
6′/8′128.9, CH129.1, CH128.4, CH128.5, CH
7′133.5, CH133.8, CH126.6, CH126.8, CH
1″162.8, C162.5, C166.7, C-
2″127.4, C127.5 a, C--
3″140.9, C142.0, C--
4″127.7, CH127.1 b, CH--
5″132.4, CH132.3, CH--
6″127.0, CH127.1 b, CH--
7″127.5, CH127.5 a, CH--
1-NCOCH3169.9, C169.1, C168.7, C168.4, C
1-NCOCH321.2, CH320.9, CH321.0, CH320.3, CH3
6-OCH356.1, CH356.2, CH358.4, CH355.9, CH3
8-OCH356.1, CH356.2, CH3-55.9, CH3
a,b assignments with the same superscript within a column are interchangeable.
Table 5. Effect of metabolites 1–15 on inhibition of P-gp-mediated resistance to doxorubicin in human colon (SW620 Ad300) carcinoma cells, and cytotoxicity against doxorubicin-susceptible human colon (SW620) carcinoma cells.
SW620 Ad300SW620
TreatmentIC50 a (µM)FR bGS cTreatmentIC50 a (µM)
Doxorubicin5.7557.51.0Doxorubicin0.10
+1 (2.5 µM)0.606.09.51>30
+2 (2.5 µM)0.848.46.82>30
+3 (2.5 µM)0.282.820.53>30
+4 (2.5 µM)0.272.721.34>30
+5 (2.5 µM)0.292.919.85>30
+6 (2.5 µM)3.5535.51.626>30
+7 (2.5 µM)7.0570.50.817>30
+8 (2.5 µM)5.1551.51.118>30
+9 (2.5 µM)5.0850.81.139>30
+10 (2.5 µM)4.1341.31.3910>30
+11 (2.5 µM)0.808.07.1811>30
+12 (2.5 µM)0.222.226.112>30
+13 (2.5 µM)0.313.018.513>30
+14 (2.5 µM)4.3643.61.3214>30
+15 (2.5 µM)4.5045.01.2715>30
+verapamil (2.5 µM)0.717.08.1doxorubicin + verapamil0.092
verapamil>30----verapamil>30
a MTT assay showing data as means of SEM of two independent cultures. b FR: fold resistance was determined by dividing the IC50 value for doxorubicin for P-gp-overexpressing cancer cells by the IC50 value for doxorubicin for sensitive cancer cells. c GS: Gain in sensitivity was the ratio of IC50 value of doxorubicin against SW620 Ad300 without testing compound to IC50 value of doxorubicin against SW620 Ad300 with testing compound. --: not calculated.
Publisher’s Note: MDPI stays neutral with regard to jurisdictional claims in published maps and institutional affiliations.

