
Dermacozine N, the First Natural Linear Pentacyclic Oxazinophenazine with UV–Vis Absorption Maxima in the Near Infrared Region, along with Dermacozines O and P Isolated from the Mariana Trench Sediment Strain Dermacoccus abyssi MT 1.1T

 ,
,  , ,
, ,  ,
,  ,
,  and
and
Abstract
:
1. Introduction
2. Results and Discussion
2.1. Structure Determination of Dermacozine N (1)
2.2. Structure Determination of Dermacozine O (2)
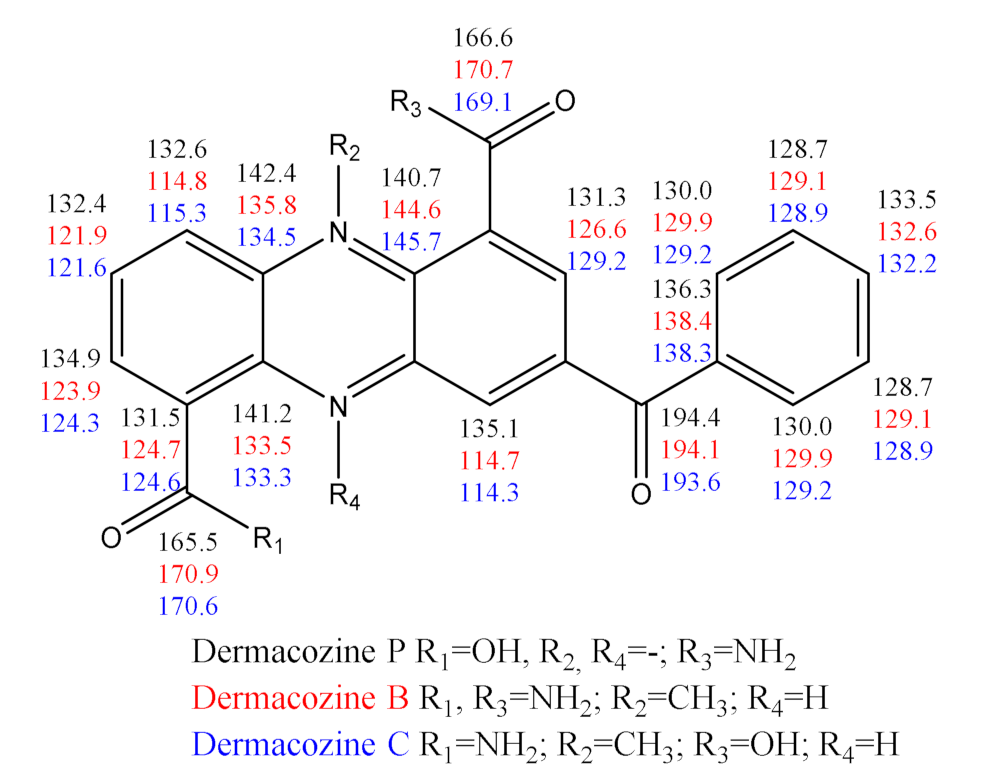
2.3. Structure Determination of Dermacozine P (3)
3. Materials and Methods
3.1. Microorganisms
3.2. Fermentation and Initial Partitioning
3.3. Instrumentation
3.4. Isolation of Compounds
3.5. Cytotoxic Activity of Dermacozines against Human Tumor Cell Lines
3.6. Chemical Characterization of Compounds
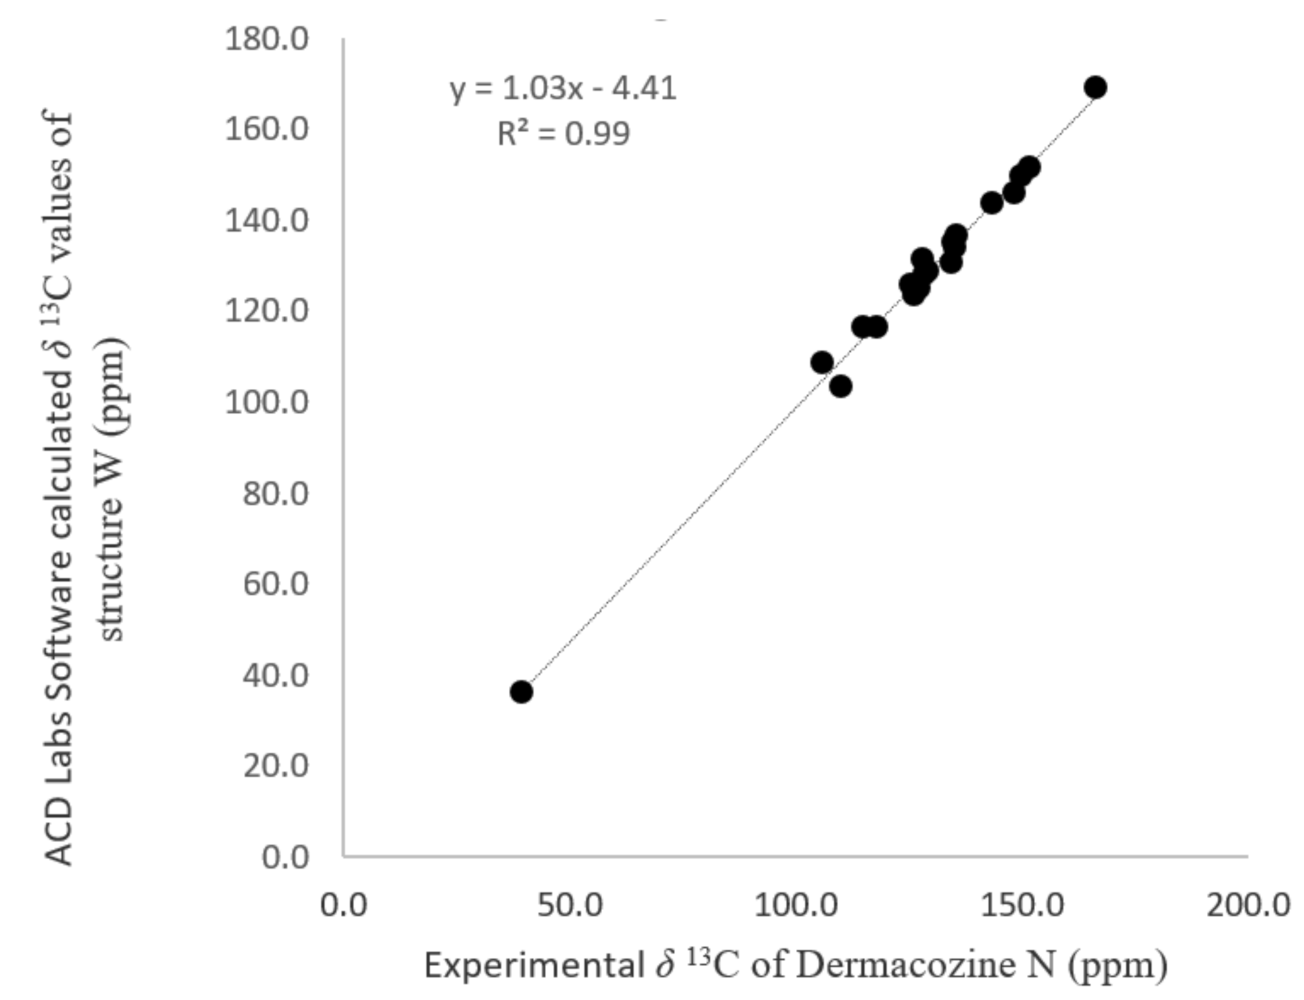
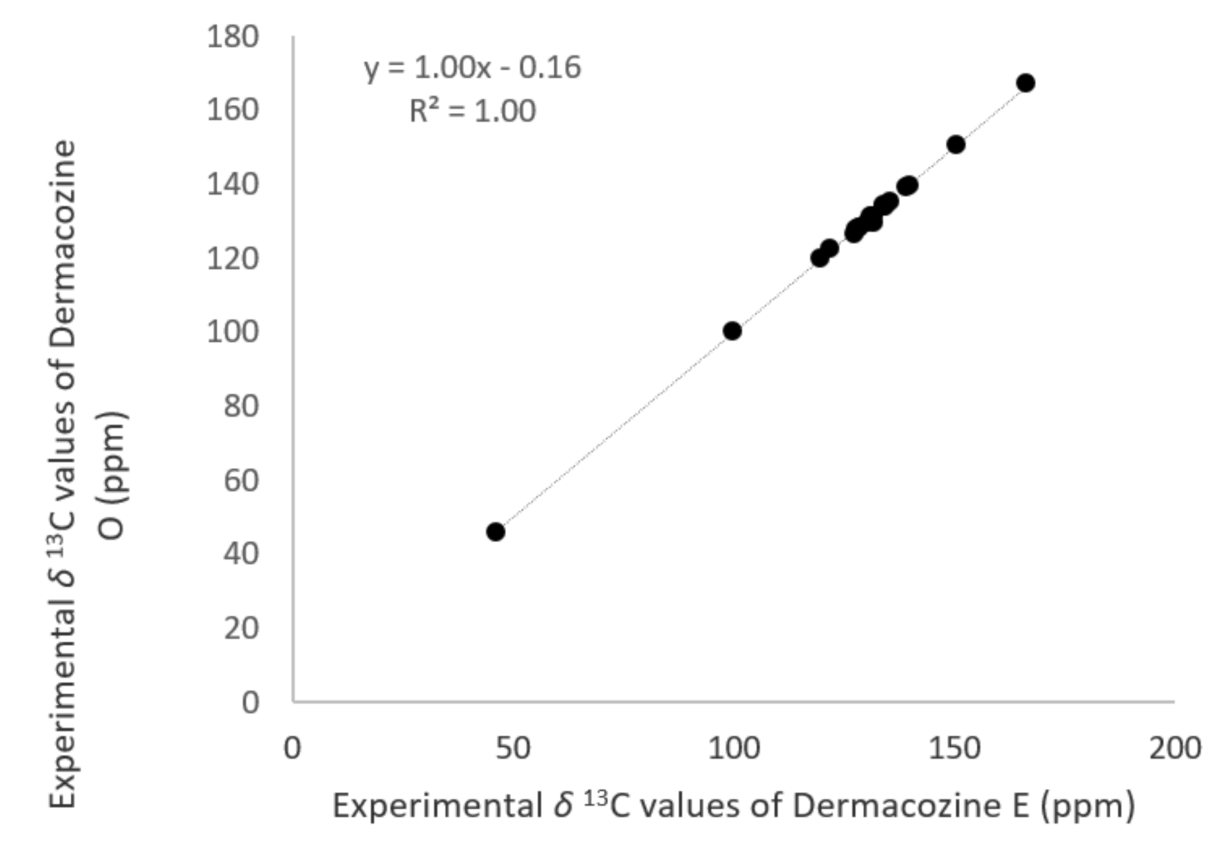
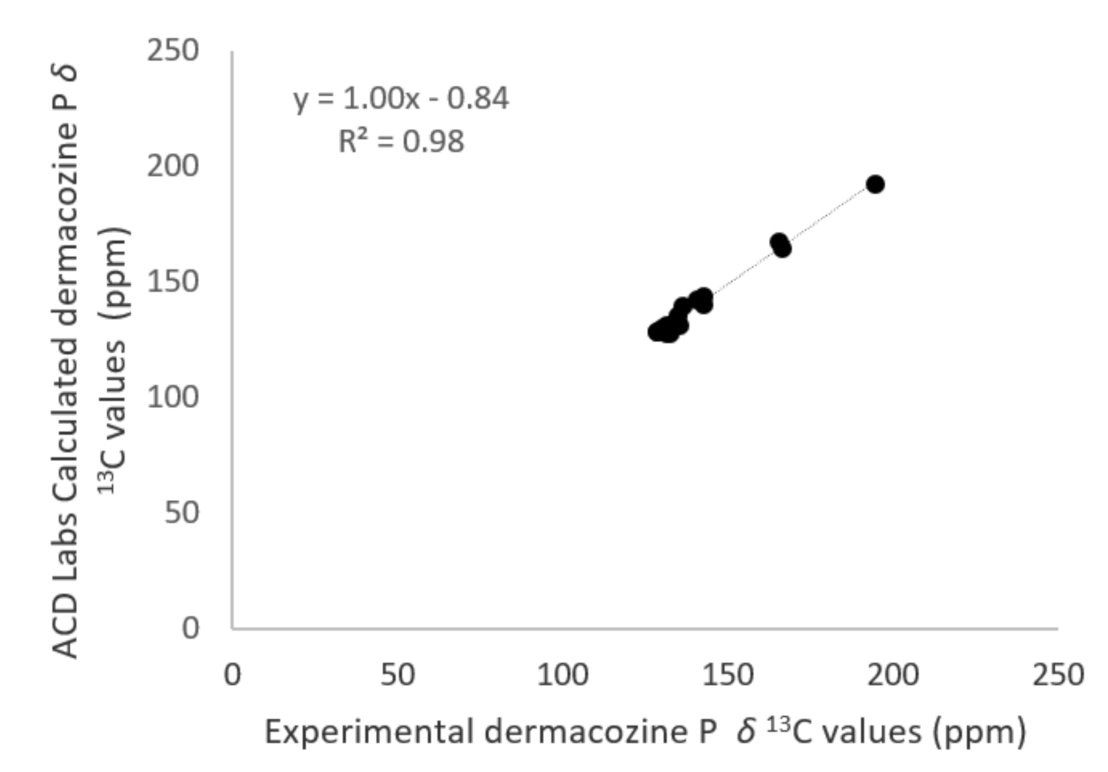
3.7. Regression Models Used in the Structure Elucidation
4. Conclusions
Supplementary Materials
Author Contributions
Funding
Data Availability Statement
Acknowledgments
Conflicts of Interest
References
- Kamjam, M.; Sivalingam, P.; Deng, Z.; Hong, K. Deep Sea Actinomycetes and Their Secondary Metabolites. Front. Microbiol. 2017, 8, 760. [Google Scholar] [CrossRef] [PubMed] [Green Version]
- Sayed, A.; Hassan, M.; Alhadrami, H.; Hassan, H.; Goodfellow, M.; Rateb, M. Extreme environments: Microbiology leading to specialized metabolites. J. Appl. Microbiol. 2020, 128, 630–657. [Google Scholar] [CrossRef] [PubMed] [Green Version]
- Wilson, Z.E.; Brimble, M.A. Molecules derived from the extremes of life. Nat. Prod. Rep. 2008, 26, 44–71. [Google Scholar] [CrossRef] [PubMed]
- Wilson, Z.E.; Brimble, M.A. Molecules derived from the extremes of life: A decade later. Nat. Prod. Rep. 2021, 38, 24–82. [Google Scholar] [CrossRef] [PubMed]
- Pathom-Aree, W.; Nogi, Y.; Sutcliffe, I.C.; Ward, A.C.; Horikoshi, K.; Bull, A.T.; Goodfellow, M. Dermacoccus abyssi sp. nov., a piezotolerant actinomycete isolated from the Mariana Trench. Int. J. Syst. Evol. Microbiol. 2006, 56, 1233–1237. [Google Scholar] [CrossRef] [PubMed]
- Abdel-Mageed, W.M.; Milne, B.F.; Wagner, M.; Schumacher, M.; Sandor, P.; Pathom-Aree, W.; Goodfellow, M.; Bull, A.T.; Horikoshi, K.; Ebel, R.; et al. Dermacozines, a new phenazine family from deep-sea dermacocci isolated from a Mariana Trench sediment. Org. Biomol. Chem. 2010, 8, 2352–2362. [Google Scholar] [CrossRef] [PubMed]
- Wagner, M.; Abdel-Mageed, W.M.; Ebel, R.; Bull, A.T.; Goodfellow, M.; Fiedler, H.-P.; Jaspars, M. Dermacozines H–J Isolated from a Deep-Sea Strain of Dermacoccus abyssi from Mariana Trench Sediments. J. Nat. Prod. 2014, 77, 416–420. [Google Scholar] [CrossRef] [PubMed]
- Abdel-Mageed, W.M.; Juhasz, B.; Lehri, B.; Alqahtani, A.S.; Nouioui, I.; Pech-Puch, D.; Tabudravu, J.N.; Goodfellow, M.; Rodríguez, J.; Jaspars, M.; et al. Whole Genome Sequence of Dermacoccus abyssi MT1.1 Isolated from the Challenger Deep of the Mariana Trench Reveals Phenazine Biosynthesis Locus and Environmental Adaptation Factors. Mar. Drugs 2020, 18, 131. [Google Scholar] [CrossRef] [PubMed] [Green Version]
- Milne, B.; Norman, P.; Nogueira, F.; Cardoso, C. Marine natural products from the deep Pacific as potential non-linear optical chromophores. Phys. Chem. Chem. Phys. 2013, 15, 14814. [Google Scholar] [CrossRef] [PubMed]
- Schumacher, M.; Kelkel, M.; Dicato, M.; Diederich, M. A Survey of Marine Natural Compounds and Their Derivatives with Anti-Cancer Activity Reported in 2010. Molecules 2011, 16, 5629–5646. [Google Scholar] [CrossRef] [PubMed] [Green Version]
- Ghanta, V.R.; Madala, N.; Pasula, A.; Pindiprolu, S.K.S.S.; Battula, K.S.; Krishnamurthy, P.T.; Raman, B. Novel dermacozine-1-carboxamides as promising anticancer agents with tubulin polymerization inhibitory activity. RSC Adv. 2019, 9, 18670–18677. [Google Scholar] [CrossRef] [Green Version]
- Pan, R.; Bai, X.; Chen, J.; Zhang, H.; Wang, H. Exploring Structural Diversity of Microbe Secondary Metabolites Using OSMAC Strategy: A Literature Review. Front. Microbiol. 2019, 10, 294. [Google Scholar] [CrossRef] [Green Version]
- Xie, L.-R.; Li, D.-Y.; Li, Z.-L.; Hua, H.-M.; Wang, P.-L.; Wu, X. A new cyclonerol derivative from a marine-derived fungus Ascotricha sp. ZJ-M-5. Nat. Prod. Res. 2013, 27, 847–850. [Google Scholar] [CrossRef]
- Favali, P.; Beranzoli, L.; De Santis, A. Seafloor Observatories; Springer: Berlin, Germany, 2015; p. 449. [Google Scholar]
- Pavia, D.L.; Lampman, G.M.; Kriz, G.S.; Vyvyan, J.R. Introduction to Spectroscopy, 4th ed.; Brooks/Cole: Pacific Grove, CA, USA, 2009. [Google Scholar]
- Jones, R.N. The ultraviolet absorption spectra of some derivatives of 1,2-benzanthracene. J. Am. Chem. Soc. 1940, 62, 148–152. [Google Scholar] [CrossRef]
- Hellner, C.; Lindqvist, L.; Roberge, P.C. Absorption spectrum and decay kinetics of triplet pentacene in solution, studied by flash photolysis. J. Chem. Soc. Faraday Trans. 1972, 68, 1928–1937. [Google Scholar] [CrossRef]
- Elyashberg, M.; Williams, A.J.; Blinov, K. Structural revisions of natural products by Computer-Assisted Structure Elucidation (CASE) systems. Nat. Prod. Rep. 2010, 27, 1296–1328. [Google Scholar] [CrossRef]
- Rateb, M.E.; Tabudravu, J.; Ebel, R. NMR characterisation of natural products derived from under-explored microorganisms. Nucl. Magn. Reson. 2016, 45, 240–268. [Google Scholar] [CrossRef]
- Tabudravu, J.N.; Pellissier, L.; Smith, A.J.; Subko, K.; Autréau, C.; Feussner, K.; Hardy, D.; Butler, D.; Kidd, R.; Milton, E.J.; et al. LC-HRMS-Database Screening Metrics for Rapid Prioritization of Samples to Accelerate the Discovery of Structurally New Natural Products. J. Nat. Prod. 2019, 82, 211–220. [Google Scholar] [CrossRef]
- Schrödinger suite, V. 2018-4. Schrödinger, LCC. Available online: https://www.schrodinger.com (accessed on 3 May 2021).
- Jacquemin, D.; Laurent, A.D.; Perpète, E.A.; André, J.-M. An ab initio simulation of the UV/visible spectra of N -benzylideneaniline dyes. Int. J. Quantum Chem. 2009, 109, 3506–3515. [Google Scholar] [CrossRef]
- Bruhn, T.; Schaumlöffel, A.; Hemberger, Y.; Bringmann, G. SpecDis: Quantifying the comparison of calculated and experimental electronic circular dichroism spectra. Chirality 2013, 25, 243–249. [Google Scholar] [CrossRef]
- Fischer, O.; Hepp, E. Ueber die Fluorindine II. Eur. J. Inorg. Chem. 1895, 28, 293–301. [Google Scholar] [CrossRef]
- Fischer, O.; Jonas, O. Beitrag zur Oxydation der aromatischen Orthodiamine und Orthoamidophenole. Eur. J. Inorg. Chem. 1894, 27, 2782–2785. [Google Scholar] [CrossRef] [Green Version]
- Fischer, O.; Giesen, C. Ueber die Einwirkung von Basen auf Aposafranin. Eur. J. Inorg. Chem. 1897, 30, 2489–2494. [Google Scholar] [CrossRef] [Green Version]
- Diepolder, E. Ueber Methyl-o-anisidin, Methyl-o-aminophenol und dessen Oxydationsproduct (N-Methylphenoxazin-o-chinon). Eur. J. Inorg. Chem. 1899, 32, 3514–3528. [Google Scholar] [CrossRef] [Green Version]
- Diepolder, E. Ueber Oxydationsproducte des o-Aminophenols. Eur. J. Inorg. Chem. 1902, 35, 2816–2822. [Google Scholar] [CrossRef] [Green Version]
- Afanas’Eva, G.B.; Postovskii, I.Y.; Viktorova, T.S. Research in the chemistry of phenoxazines. Chem. Heterocycl. Compd. 1978, 14, 966–968. [Google Scholar] [CrossRef]
- Shimomura, O. Discovery of Green Fluorescent Protein (GFP) (Nobel Lecture). Angew. Chem. Int. Ed. 2009, 48, 5590–5602. [Google Scholar] [CrossRef]
- Janjua, M.R.S.A. Non-linear Optical response of Phenoxazine-based Dyes: Molecular Engineering of Thiadiazole Derivatives as π-spacers. J. Mex. Chem. Soc. 2017, 61, 260–265. [Google Scholar]
- Traven, V.F.; Cheptsov, D.A. Sensory effects of fluorescent organic dyes. Russ. Chem. Rev. 2020, 89, 713–749. [Google Scholar] [CrossRef]
- Steiner, M.-S.; Duerkop, A.; Wolfbeis, O.S. Optical methods for sensing glucose. Chem. Soc. Rev. 2011, 40, 4805–4839. [Google Scholar] [CrossRef]
- Sherman, D.B.; Pitner, J.B.; Ambroise, A.; Thomas, K.J.; Pitner, B. Synthesis of Thiol-Reactive, Long-Wavelength Fluorescent Phenoxazine Derivatives for Biosensor Applications. Bioconjugate Chem. 2006, 17, 387–392. [Google Scholar] [CrossRef] [PubMed]
- Liu, W.; Sun, R.; Ge, J.-F.; Xu, Y.-J.; Xu, Y.; Lu, J.-M.; Itoh, I.; Ihara, M. Reversible Near-Infrared pH Probes Based on Benzo[a]phenoxazine. Anal. Chem. 2013, 85, 7419–7425. [Google Scholar] [CrossRef] [PubMed]
- Jose, J.; Burgess, K. Benzophenoxazine-based fluorescent dyes for labeling biomolecules. Tetrahedron 2006, 62, 11021–11037. [Google Scholar] [CrossRef]
- Knorr, G.; Kozma, E.; Herner, A.; Lemke, E.A.; Kele, P. New Red-Emitting Tetrazine-Phenoxazine Fluorogenic Labels for Live-Cell Intracellular Bioorthogonal Labeling Schemes. Chem. A Eur. J. 2016, 22, 8972–8979. [Google Scholar] [CrossRef] [PubMed]
- Boonacker, E.; Van Noorden, C.J. Enzyme Cytochemical Techniques for Metabolic Mapping in Living Cells, with Special Reference to Proteolysis. J. Histochem. Cytochem. 2001, 49, 1473–1486. [Google Scholar] [CrossRef] [Green Version]
- Yee, D.J.; Balsanek, V.; Bauman, D.R.; Penning, T.; Sames, D. Fluorogenic metabolic probes for direct activity readout of redox enzymes: Selective measurement of human AKR1C2 in living cells. Proc. Natl. Acad. Sci. USA 2006, 103, 13304–13309. [Google Scholar] [CrossRef] [Green Version]
- Lin, C.W.; Shulok, J.R.; Wong, Y.K.; Schanbacher, C.F.; Cincotta, L.; Foley, J.W. Photosensitization, uptake, and retention of phenoxazine Nile blue derivatives in human bladder carcinoma cells. Cancer Res. 1991, 51, 1109–1116. [Google Scholar]
- Laursen, J.B.; Nielsen, J. Phenazine Natural Products: Biosynthesis, Synthetic Analogues, and Biological Activity. Chem. Rev. 2004, 104, 1663–1686. [Google Scholar] [CrossRef] [PubMed]
- Sarewicz, M.; Osyczka, A. Electronic Connection Between the Quinone and Cytochrome c Redox Pools and Its Role in Regulation of Mitochondrial Electron Transport and Redox Signaling. Physiol. Rev. 2015, 95, 219–243. [Google Scholar] [CrossRef] [PubMed] [Green Version]
- Sinha, S.; Shen, X.; Gallazzi, F.; Li, Q.; Zmijewski, J.W.; Lancaster, J.R.; Gates, K.S. Generation of Reactive Oxygen Species Mediated by 1-Hydroxyphenazine, a Virulence Factor of Pseudomonas aeruginosa. Chem. Res. Toxicol. 2015, 28, 175–181. [Google Scholar] [CrossRef]
- Willker, W.; Leibfritz, D.; Kerssebaum, R.; Bermel, W. Gradient selection in inverse heteronuclear correlation spectroscopy. Magn. Reson. Chem. 1993, 31, 287–292. [Google Scholar] [CrossRef]
- Zwahlen, C.; Legault, P.; Vincent, S.J.F.; Greenblatt, J.; Konrat, R.; Kay, L.E. Methods for Measurement of Intermolecular NOEs by Multinuclear NMR Spectroscopy: Application to a Bacteriophage λ N-Peptide/boxB RNA Complex. J. Am. Chem. Soc. 1997, 119, 6711–6721. [Google Scholar]
- Boyer, R.D.; Johnson, R.; Krishnamurthy, K. Compensation of refocusing inefficiency with synchronized inversion sweep (CRISIS) in multiplicity-edited HSQC. J. Magn. Reson. 2003, 165, 253–259. [Google Scholar] [CrossRef]
- Cicero, D.O.; Barbato, G.; Bazzo, R. Sensitivity Enhancement of a Two-Dimensional Experiment for the Measurement of Heteronuclear Long-Range Coupling Constants, by a New Scheme of Coherence Selection by Gradients. J. Magn. Reson. 2001, 148, 209–213. [Google Scholar]
- Shaw, A.A.; Salaun, C.; Dauphin, J.-F.; Ancian, B. Artifact-Free PFG-Enhanced Double-Quantum-Filtered COSY Experiments. J. Magn. Reason. 1996, 120, 110–115. [Google Scholar] [CrossRef]
- Ancian, B.; Bourgeois, I.; Dauphin, J.-F.; Shaw, A.A. Artifact-Free Pure Absorption PFG-Enhanced DQF-COSY Spectra Including a Gradient Pulse in the Evolution Period. J. Magn. Reson. 1997, 125, 348–354. [Google Scholar] [CrossRef]
- Koagne, R.R.; Annang, F.; Cautain, B.; Martín, J.; Pérez-Moreno, G.; Thierry, M.; Bitchagno, G.; González-Pacanowska, D.; Vicente, F.; Simo, I.K.; et al. Cytotoxicity and antiplasmodial activity of phenolic derivatives from Albizia zygia (DC.) J.F. Macbr. (Mimosae). BMC Complement. Med. Ther. 2020, 20, 8. [Google Scholar] [CrossRef]
- Präbst, K.; Engelhardt, H.; Ringgeler, S.; Hübner, H. Methods in Molecular Biology. In Basic Colorimetric Proliferation Assays: MTT, WST, and Resazurin; Gilbert, D.F., Friedrich, O., Eds.; Springer Nature: New York, NY, USA, 2017; pp. 1–17. [Google Scholar]


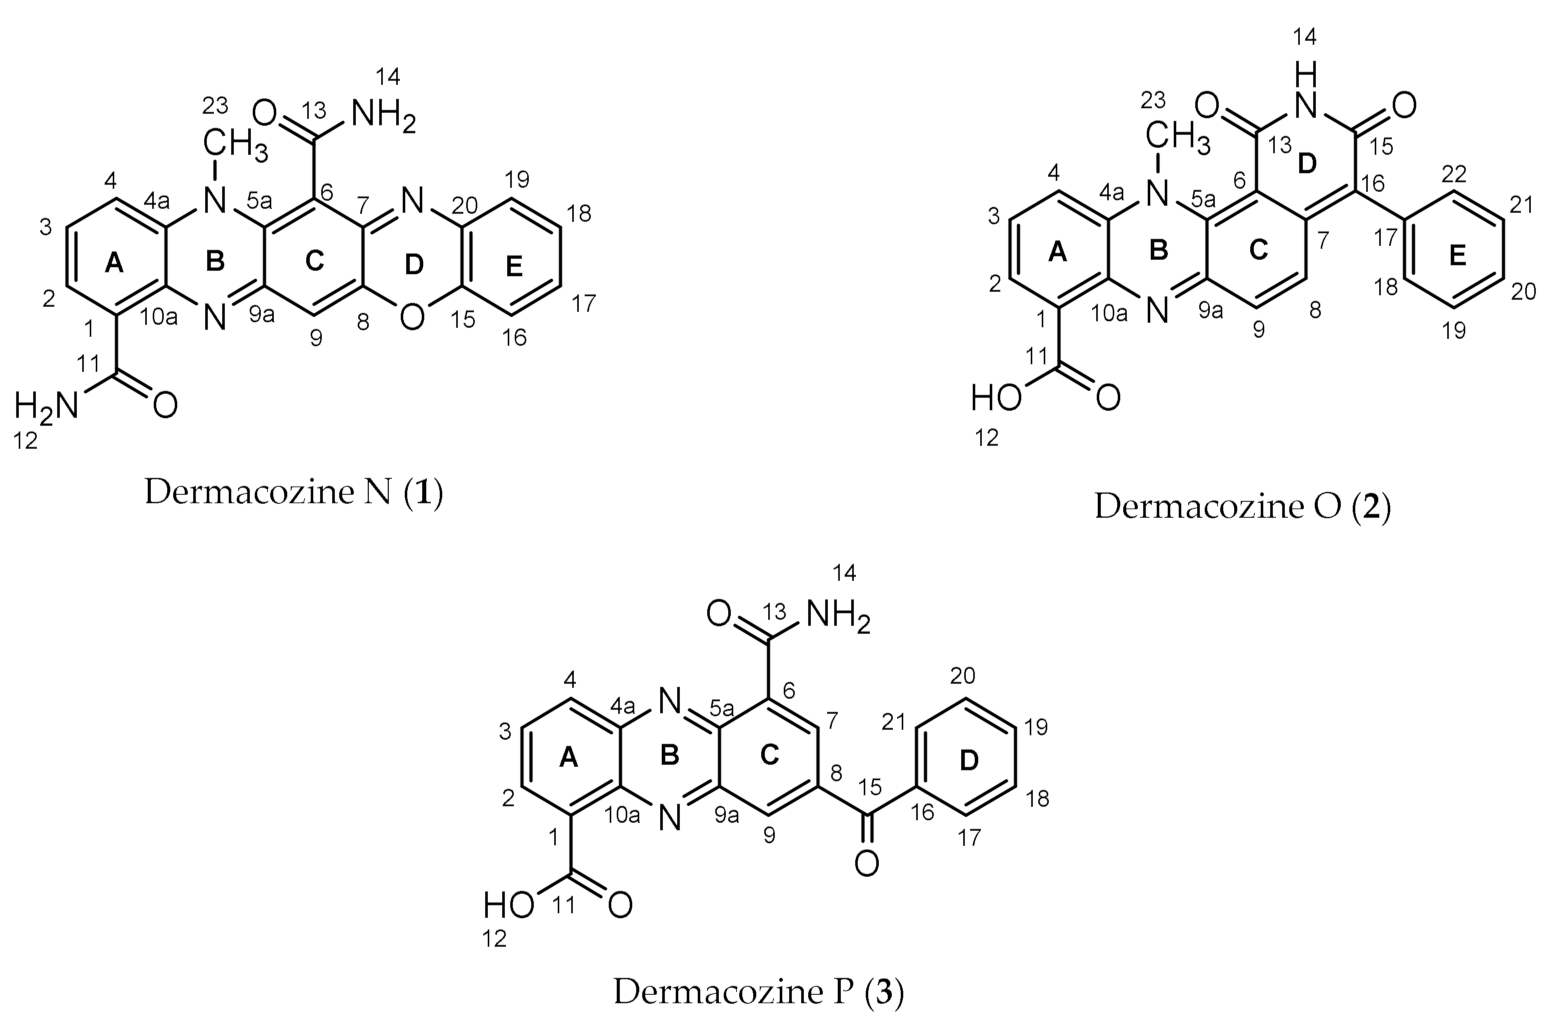
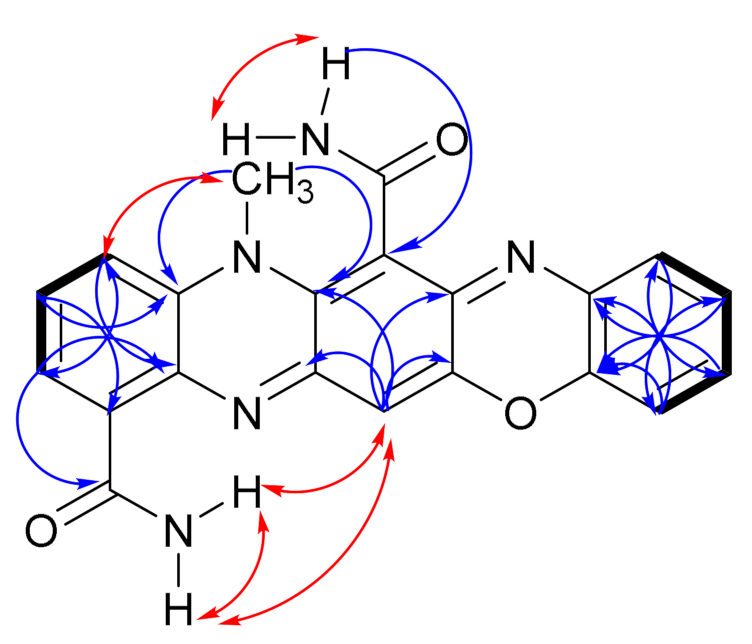
 ), NOESY (
  ) and HMBC (H
  C) correlations of dermacozine N (1).

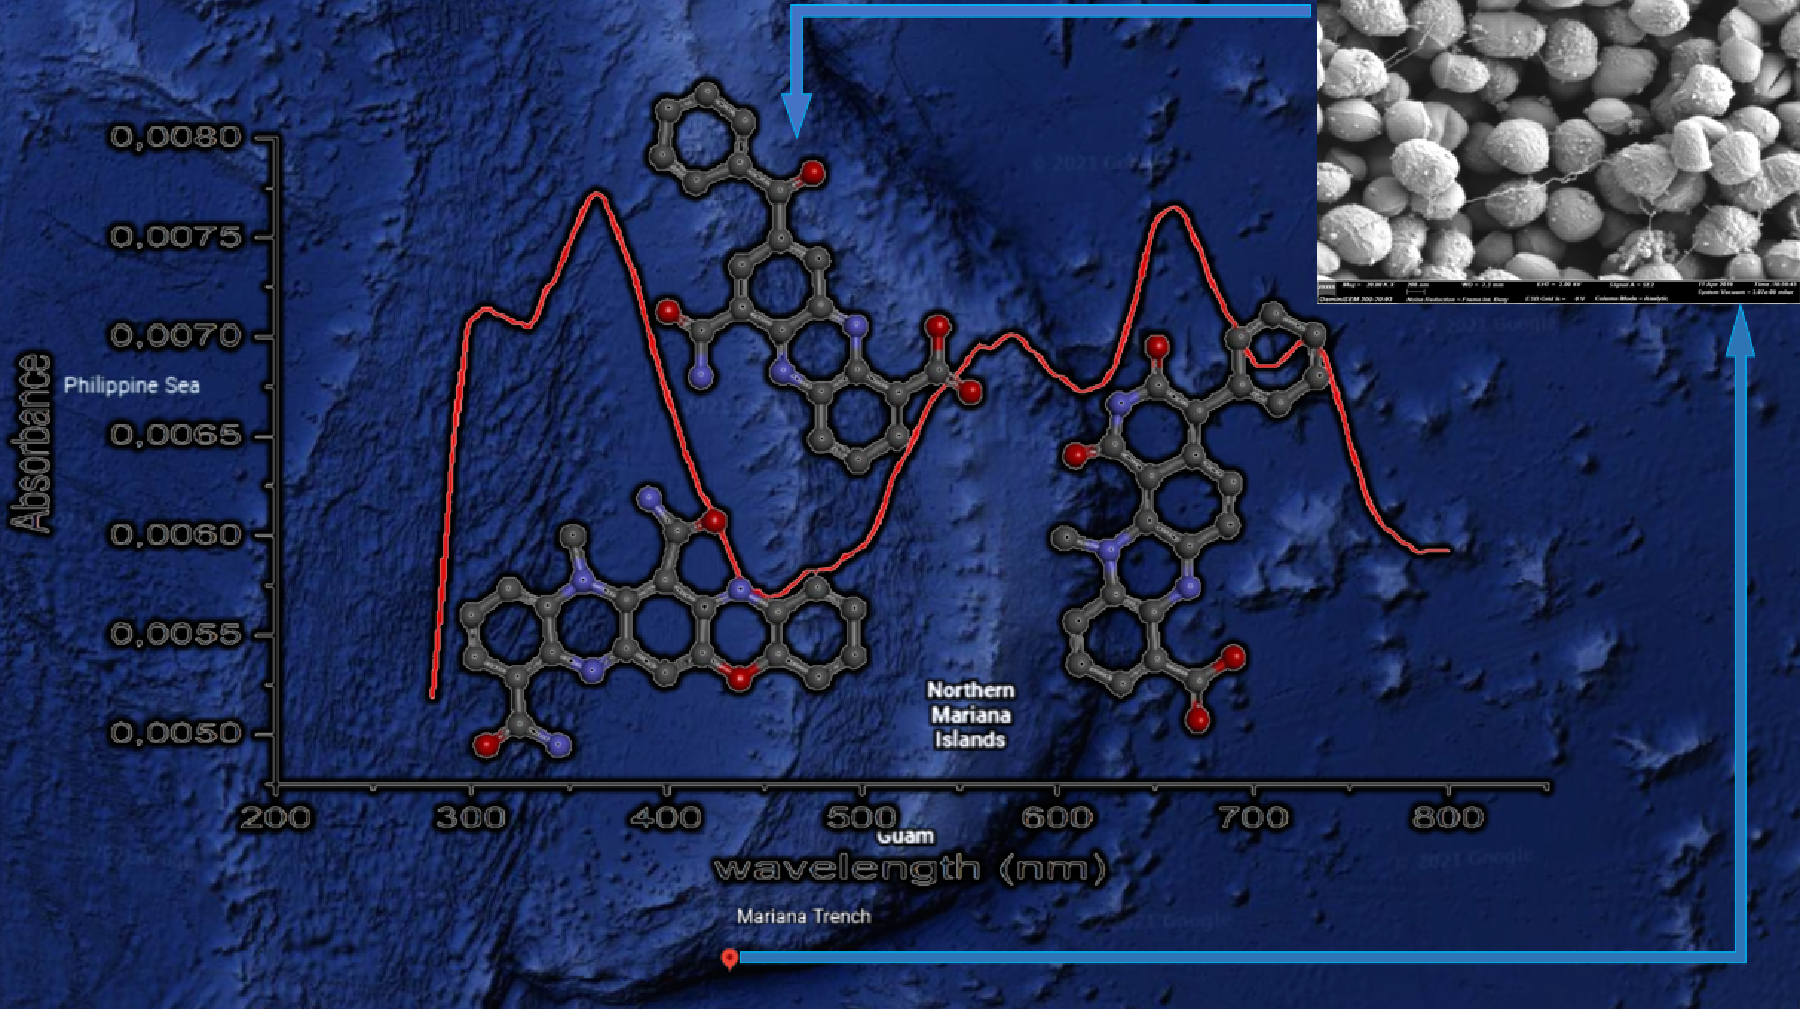
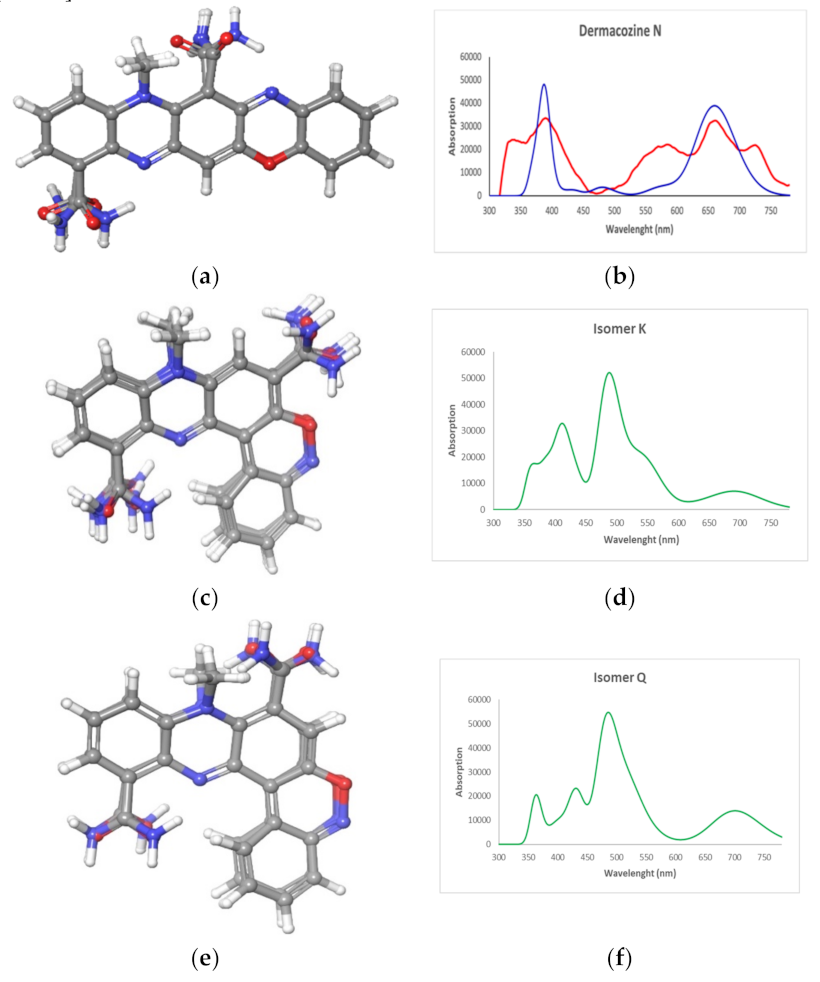
 ) (d) K and (f) Q (
  ) and experimental UV–Vis spectrum (
  ) of (b) dermacozine N (1).
) (d) K and (f) Q ( ) and experimental UV–Vis spectrum ( ) of (b) dermacozine N (1).
) of (b) dermacozine N (1).
) (d) K and (f) Q ( ) and experimental UV–Vis spectrum ( ) of (b) dermacozine N (1).
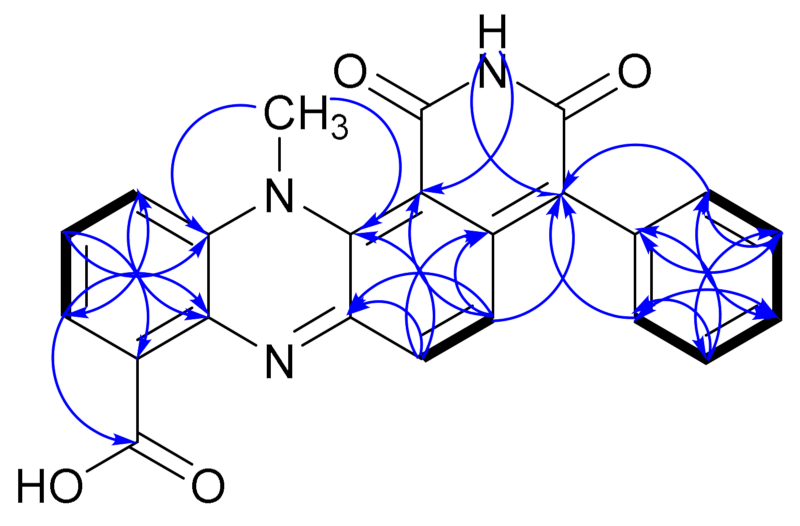
 ) and HMBC (H
  C) correlations of dermacozine O (2).

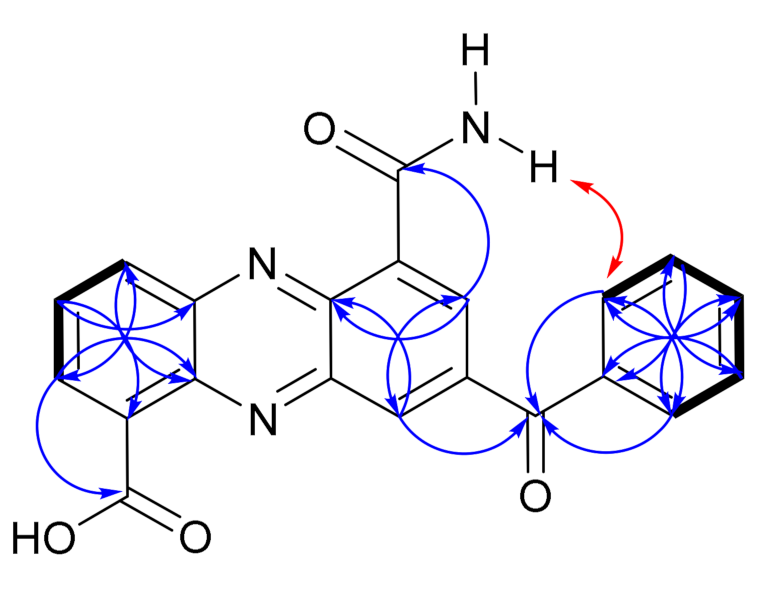
 ), NOESY (
  ) and HMBC (H
  C) correlations of dermacozine P (3).


| N. | Dermacozine N (1) | Dermacozine O (2) | Dermacozine P (3) | |||
|---|---|---|---|---|---|---|
| δC, mult | δH, mult (J in Hz) | δC, mult | δH, mult (J in Hz) | δC, mult | δH, mult (J in Hz) | |
| 1 | 128.9, C | 129.6, C | 131.5, C | |||
| 2 | 125.9, CH | 7.88 (dd, 7.6, 1.3) | 126.6, CH | 7.87 (dd, 7.5, 1.1) | 134.9, CH | 8.74 (dd, 7.0, 1.3) |
| 3 | 128.4, CH | 7.47 (td, 8.3, 7.6) | 131.3, CH | 7.78 (td, 8.5, 7.5) | 132.4, CH | 8.21 (td, 7.0, 8.6) |
| 4 | 118.0, CH | 7.55 (dd, 8.3, 1.3) | 120.3, CH | 7.97 (dd, 8.5, 1.1) | 132.6, CH | 8.55 (dd, 8.6, 1.3) |
| 4a | 134.4, C | 134.0, C | 142.4, C | |||
| 5a | 135.5, C | 139.5, C | 140.7, C | |||
| 6 | 109.8, C | 100.4, C | 129.8, C † | |||
| 7 | 148.1, C | 139.6, C | 131.3, CH | 8.65 (d, 1.9) | ||
| 8 | 149.8, C | 134.5, CH | 7.21 (d, 9.7) | 135.6, C † | ||
| 9 | 105.9, CH | 6.79, s | 129.7, CH | 7.24 (d, 9.7) | 135.1, CH | 8.95 (d, 1.9) |
| 9a | 151.6, C | 150.6, C | 144.0, C † | |||
| 10a | 135.1, C | 135.3, C | 141.2, C | |||
| 11 | 166.3, C | 167.2, C | 165.5, C | |||
| 12 | A 7.70, brs | COOH, not observed | COOH, not observed | |||
| B 9.31, brs | ||||||
| 13 | 168.3, C † | 163.6, C † | 166.6, C | |||
| 14 | A 7.65, brs | A 8.03, brs | ||||
| B 7.98, brs | 11.27, brs | B 9.47, brs | ||||
| 15 | 143.3, C | 163.1, C † | 194.4, C | |||
| 16 | 115.0, CH | 7.12 (dd, 7.6, 1.5) | 122.6, C | 136.3, C | ||
| 17 | 127.9, CH | 7.19 (ddd, 7.6, 7.4, 1.6) | 134.1, C | 130.0, CH | 7.95 (dd, 7.6, 1.3); | |
| 18 | 125.3, CH | 7.15 (ddd, 7.6, 7.4, 1.5) | 131.3, CH | 7.30 (dd, 7.4, 1.3) | 128.7, CH | 7.66 (td, 7.6, 1.3) |
| 19 | 127.2, CH | 7.30 (dd, 7.6, 1.6) | 128.2, CH | 7.47 (td, 7.4, 1.3) | 133.5, CH | 7.78 (td, 7.6, 1.3) |
| 20 | 134.8, C | 127.9, CH | 7.41 (td, 7.4, 1.3) | 128.7, CH | 7.66 (td, 7.6, 1.3) | |
| 21 | 128.2, CH | 7.47 (td, 7.4, 1.3) | 130.0, CH | 7.95 (dd, 7.6, 1.3); | ||
| 22 | 131.3, CH | 7.30 (dd, 7.4, 1.3) | ||||
| 23 | 39.5, CH3 | 3.68, s | 45.9, CH3 | 3.67, s | - | - |
Publisher’s Note: MDPI stays neutral with regard to jurisdictional claims in published maps and institutional affiliations. |
© 2021 by the authors. Licensee MDPI, Basel, Switzerland. This article is an open access article distributed under the terms and conditions of the Creative Commons Attribution (CC BY) license (https://creativecommons.org/licenses/by/4.0/).
Share and Cite
Juhasz, B.; Pech-Puch, D.; Tabudravu, J.N.; Cautain, B.; Reyes, F.; Jiménez, C.; Kyeremeh, K.; Jaspars, M. Dermacozine N, the First Natural Linear Pentacyclic Oxazinophenazine with UV–Vis Absorption Maxima in the Near Infrared Region, along with Dermacozines O and P Isolated from the Mariana Trench Sediment Strain Dermacoccus abyssi MT 1.1T. Mar. Drugs 2021, 19, 325. https://doi.org/10.3390/md19060325
Juhasz B, Pech-Puch D, Tabudravu JN, Cautain B, Reyes F, Jiménez C, Kyeremeh K, Jaspars M. Dermacozine N, the First Natural Linear Pentacyclic Oxazinophenazine with UV–Vis Absorption Maxima in the Near Infrared Region, along with Dermacozines O and P Isolated from the Mariana Trench Sediment Strain Dermacoccus abyssi MT 1.1T. Marine Drugs. 2021; 19(6):325. https://doi.org/10.3390/md19060325
Chicago/Turabian StyleJuhasz, Bertalan, Dawrin Pech-Puch, Jioji N. Tabudravu, Bastien Cautain, Fernando Reyes, Carlos Jiménez, Kwaku Kyeremeh, and Marcel Jaspars. 2021. "Dermacozine N, the First Natural Linear Pentacyclic Oxazinophenazine with UV–Vis Absorption Maxima in the Near Infrared Region, along with Dermacozines O and P Isolated from the Mariana Trench Sediment Strain Dermacoccus abyssi MT 1.1T" Marine Drugs 19, no. 6: 325. https://doi.org/10.3390/md19060325