
Glycosaminoglycans from Litopenaeus vannamei Inhibit the Alzheimer’s Disease β Secretase, BACE1

 , ,
, ,
Abstract
:
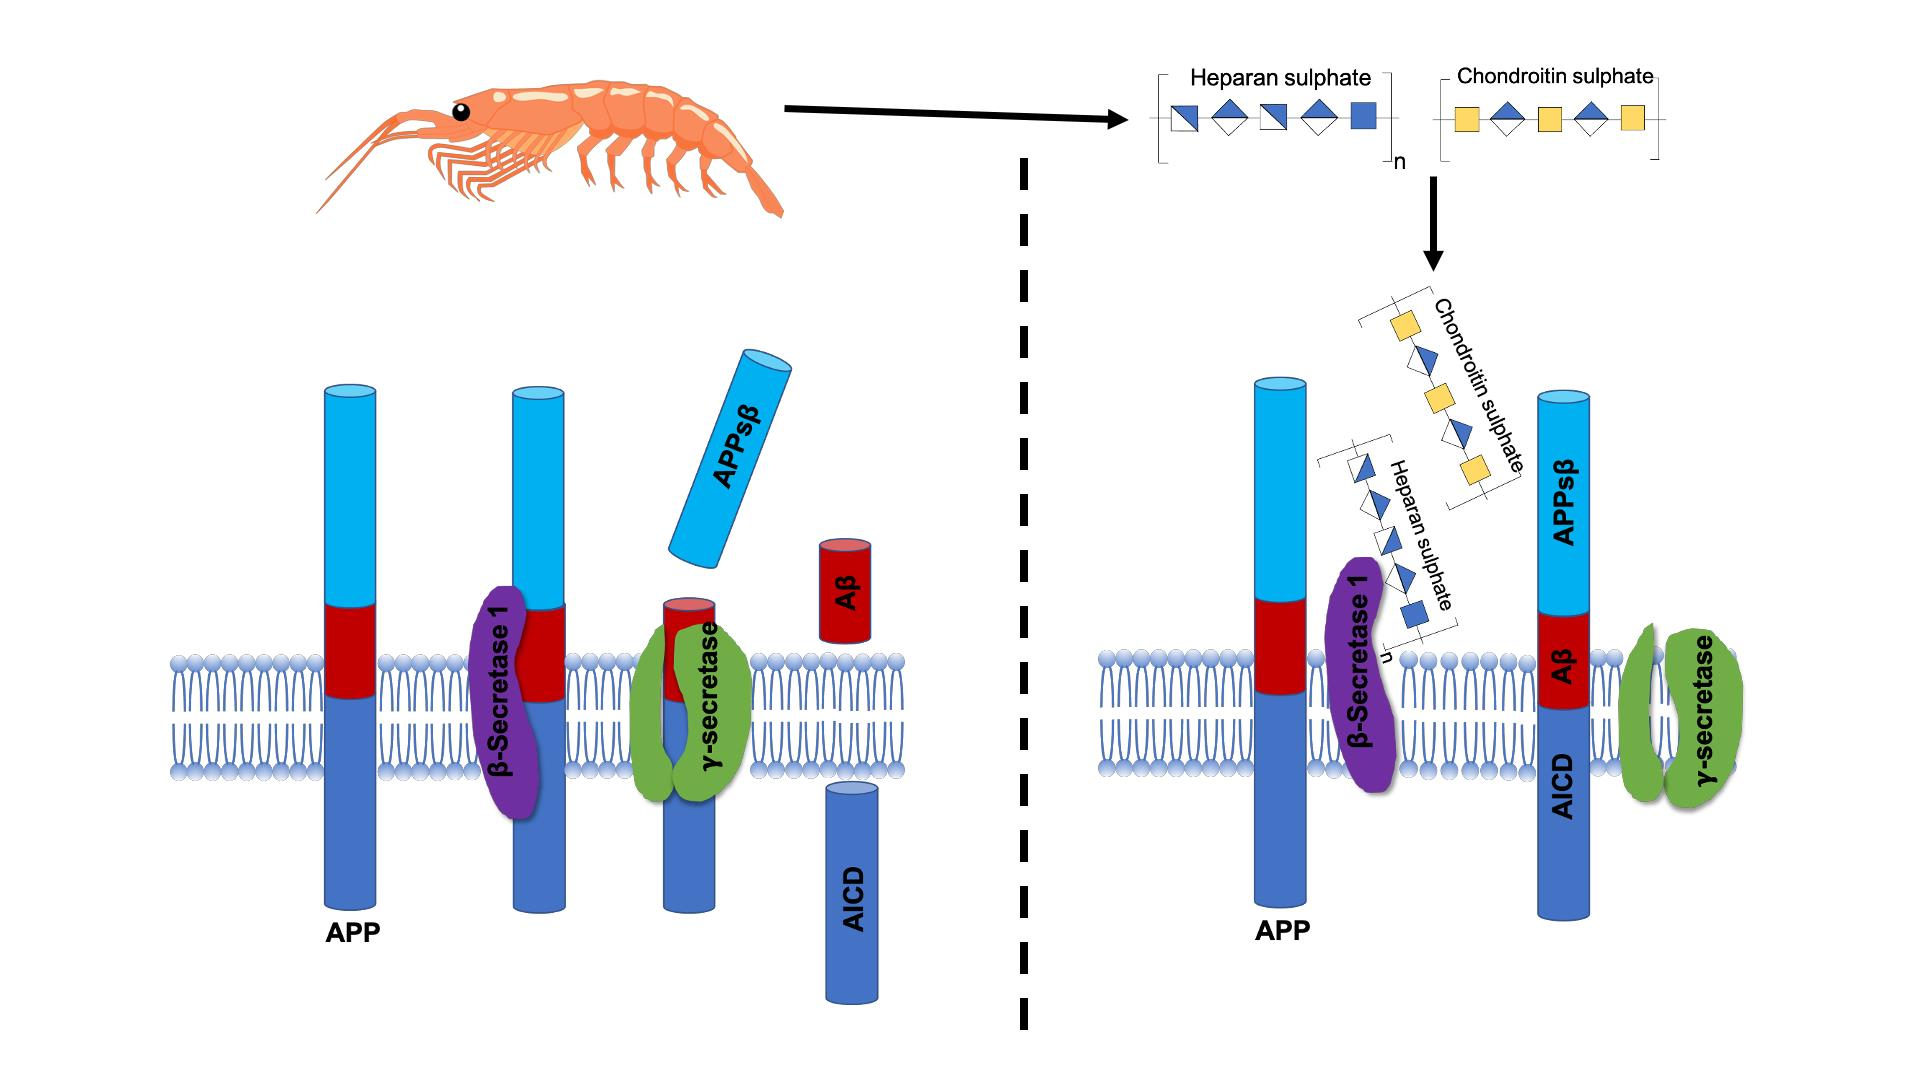
1. Introduction
2. Results
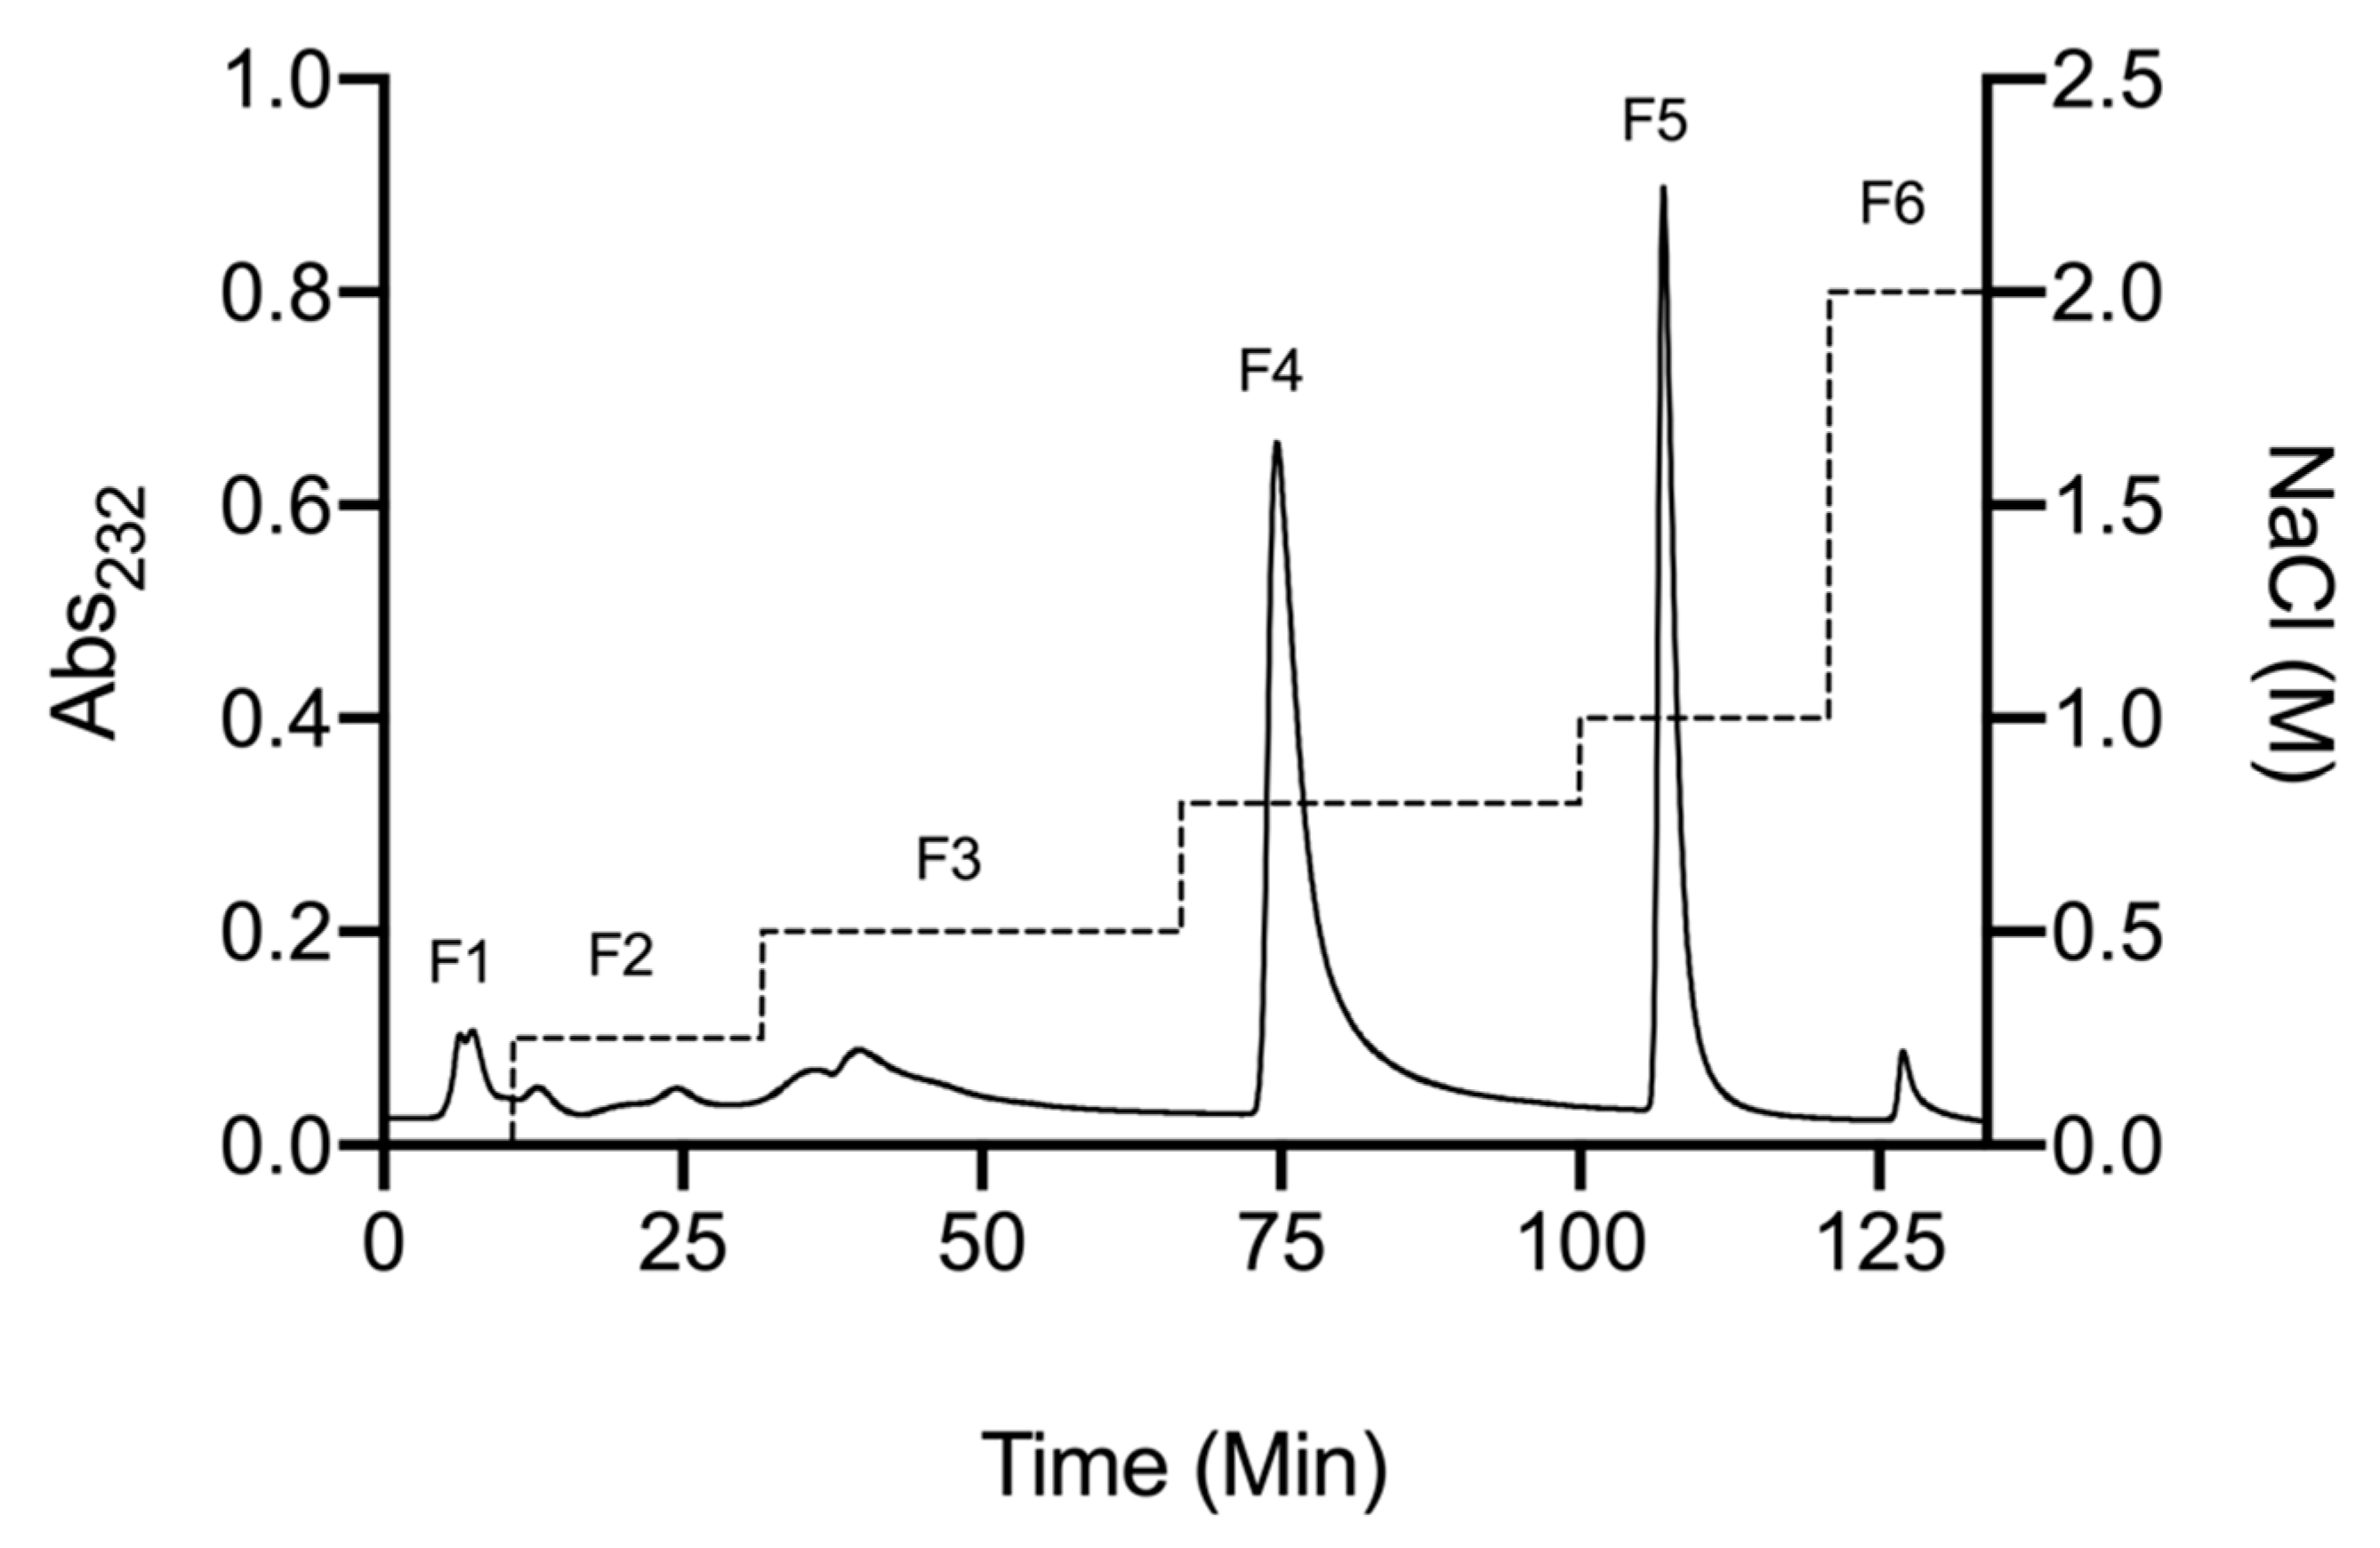
2.1. Isolation of Glycosaminoglycans from Litopenaeus vannamei
2.2. Characterisation of Extracted Glycosaminoglycans from Litopenaeus vannamei
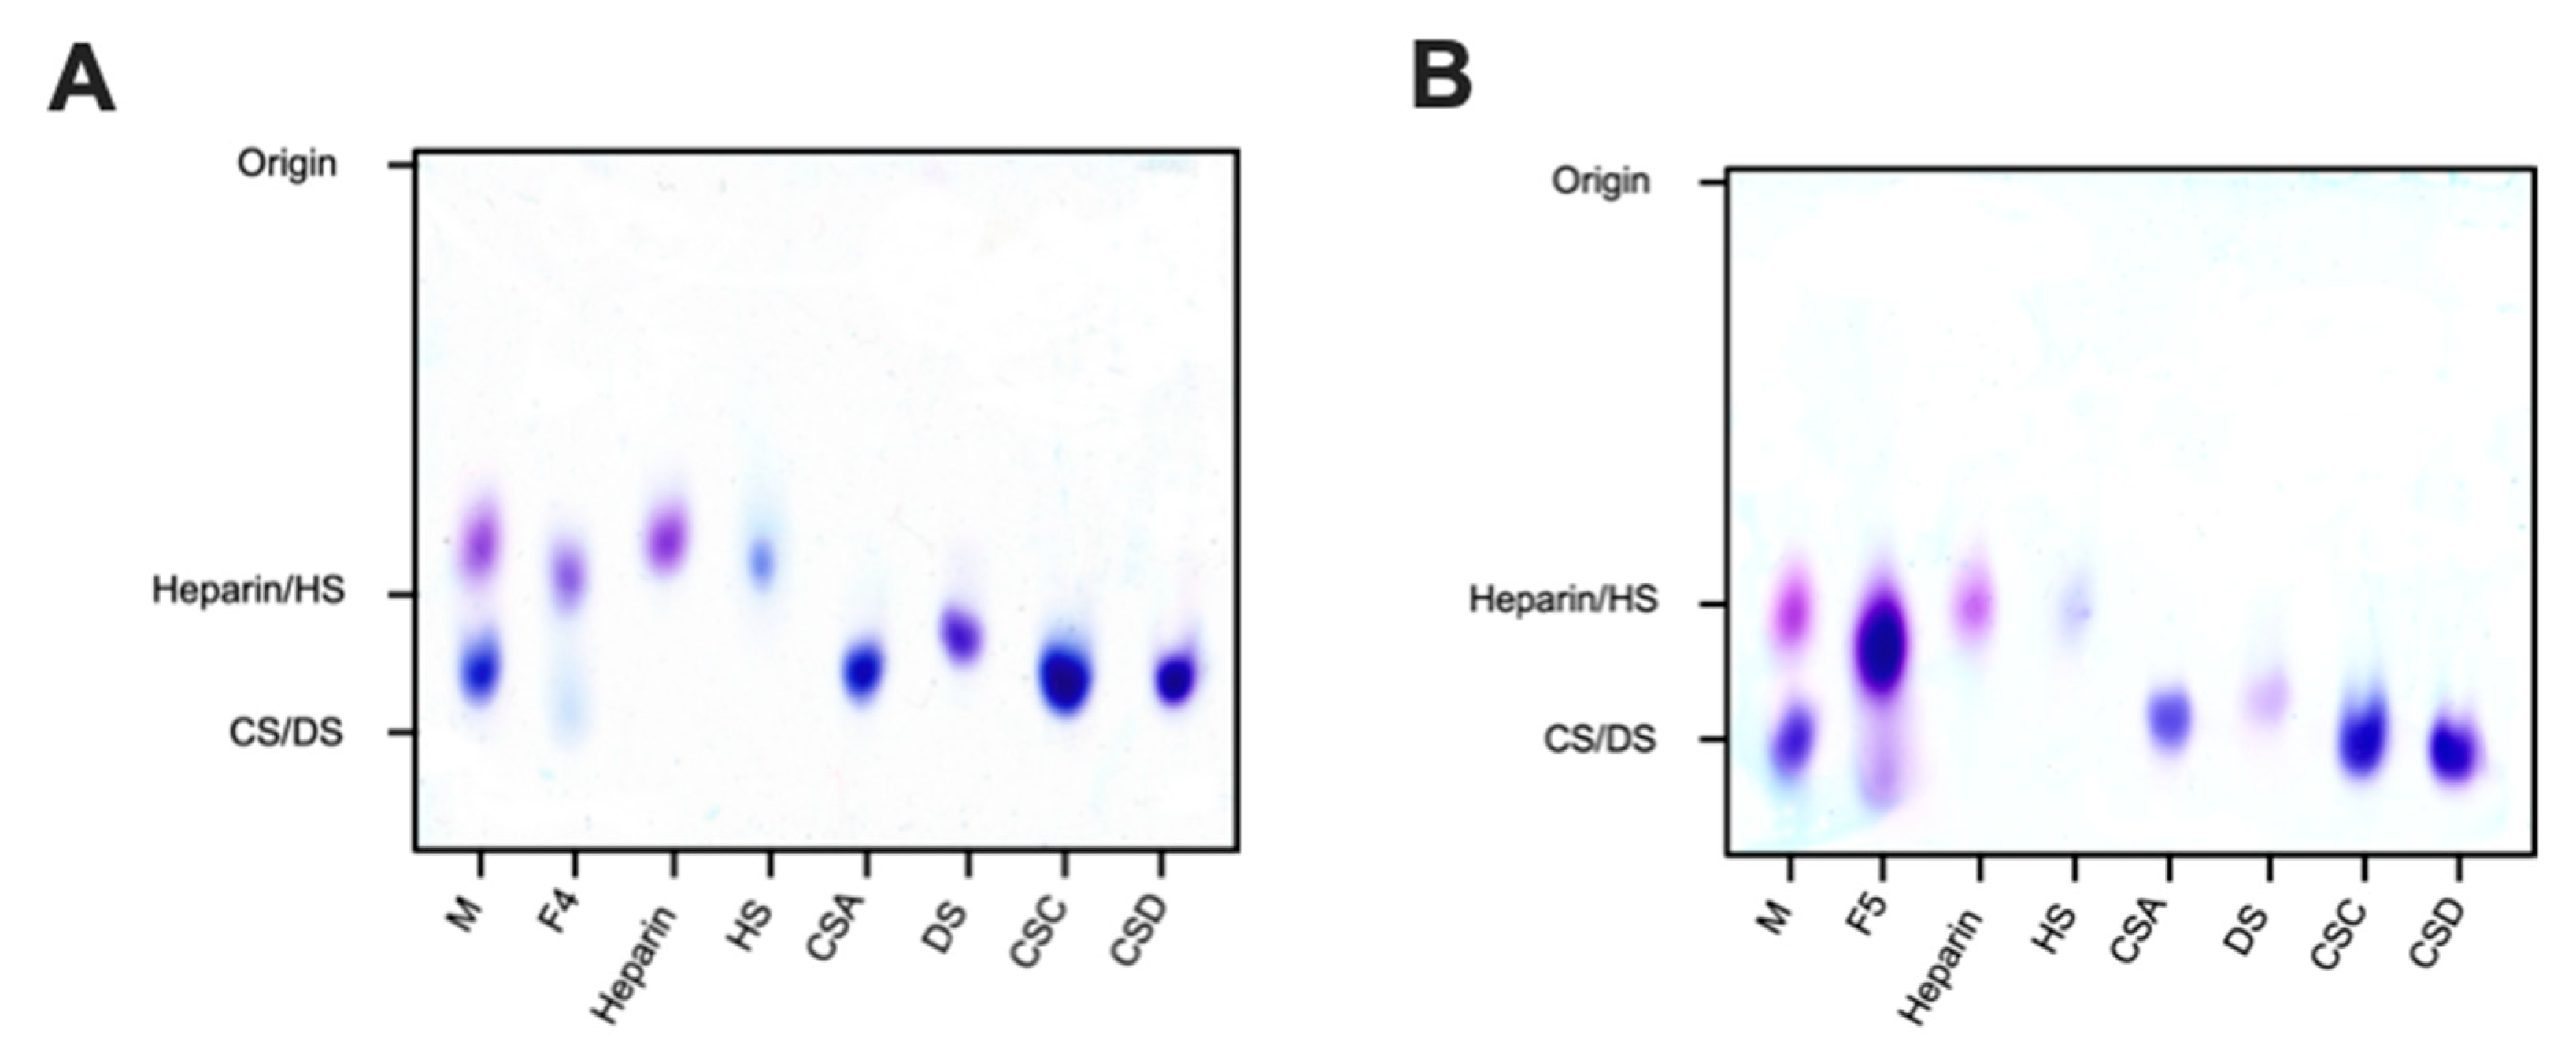
2.2.1. Agarose-Based, Gel Electrophoresis
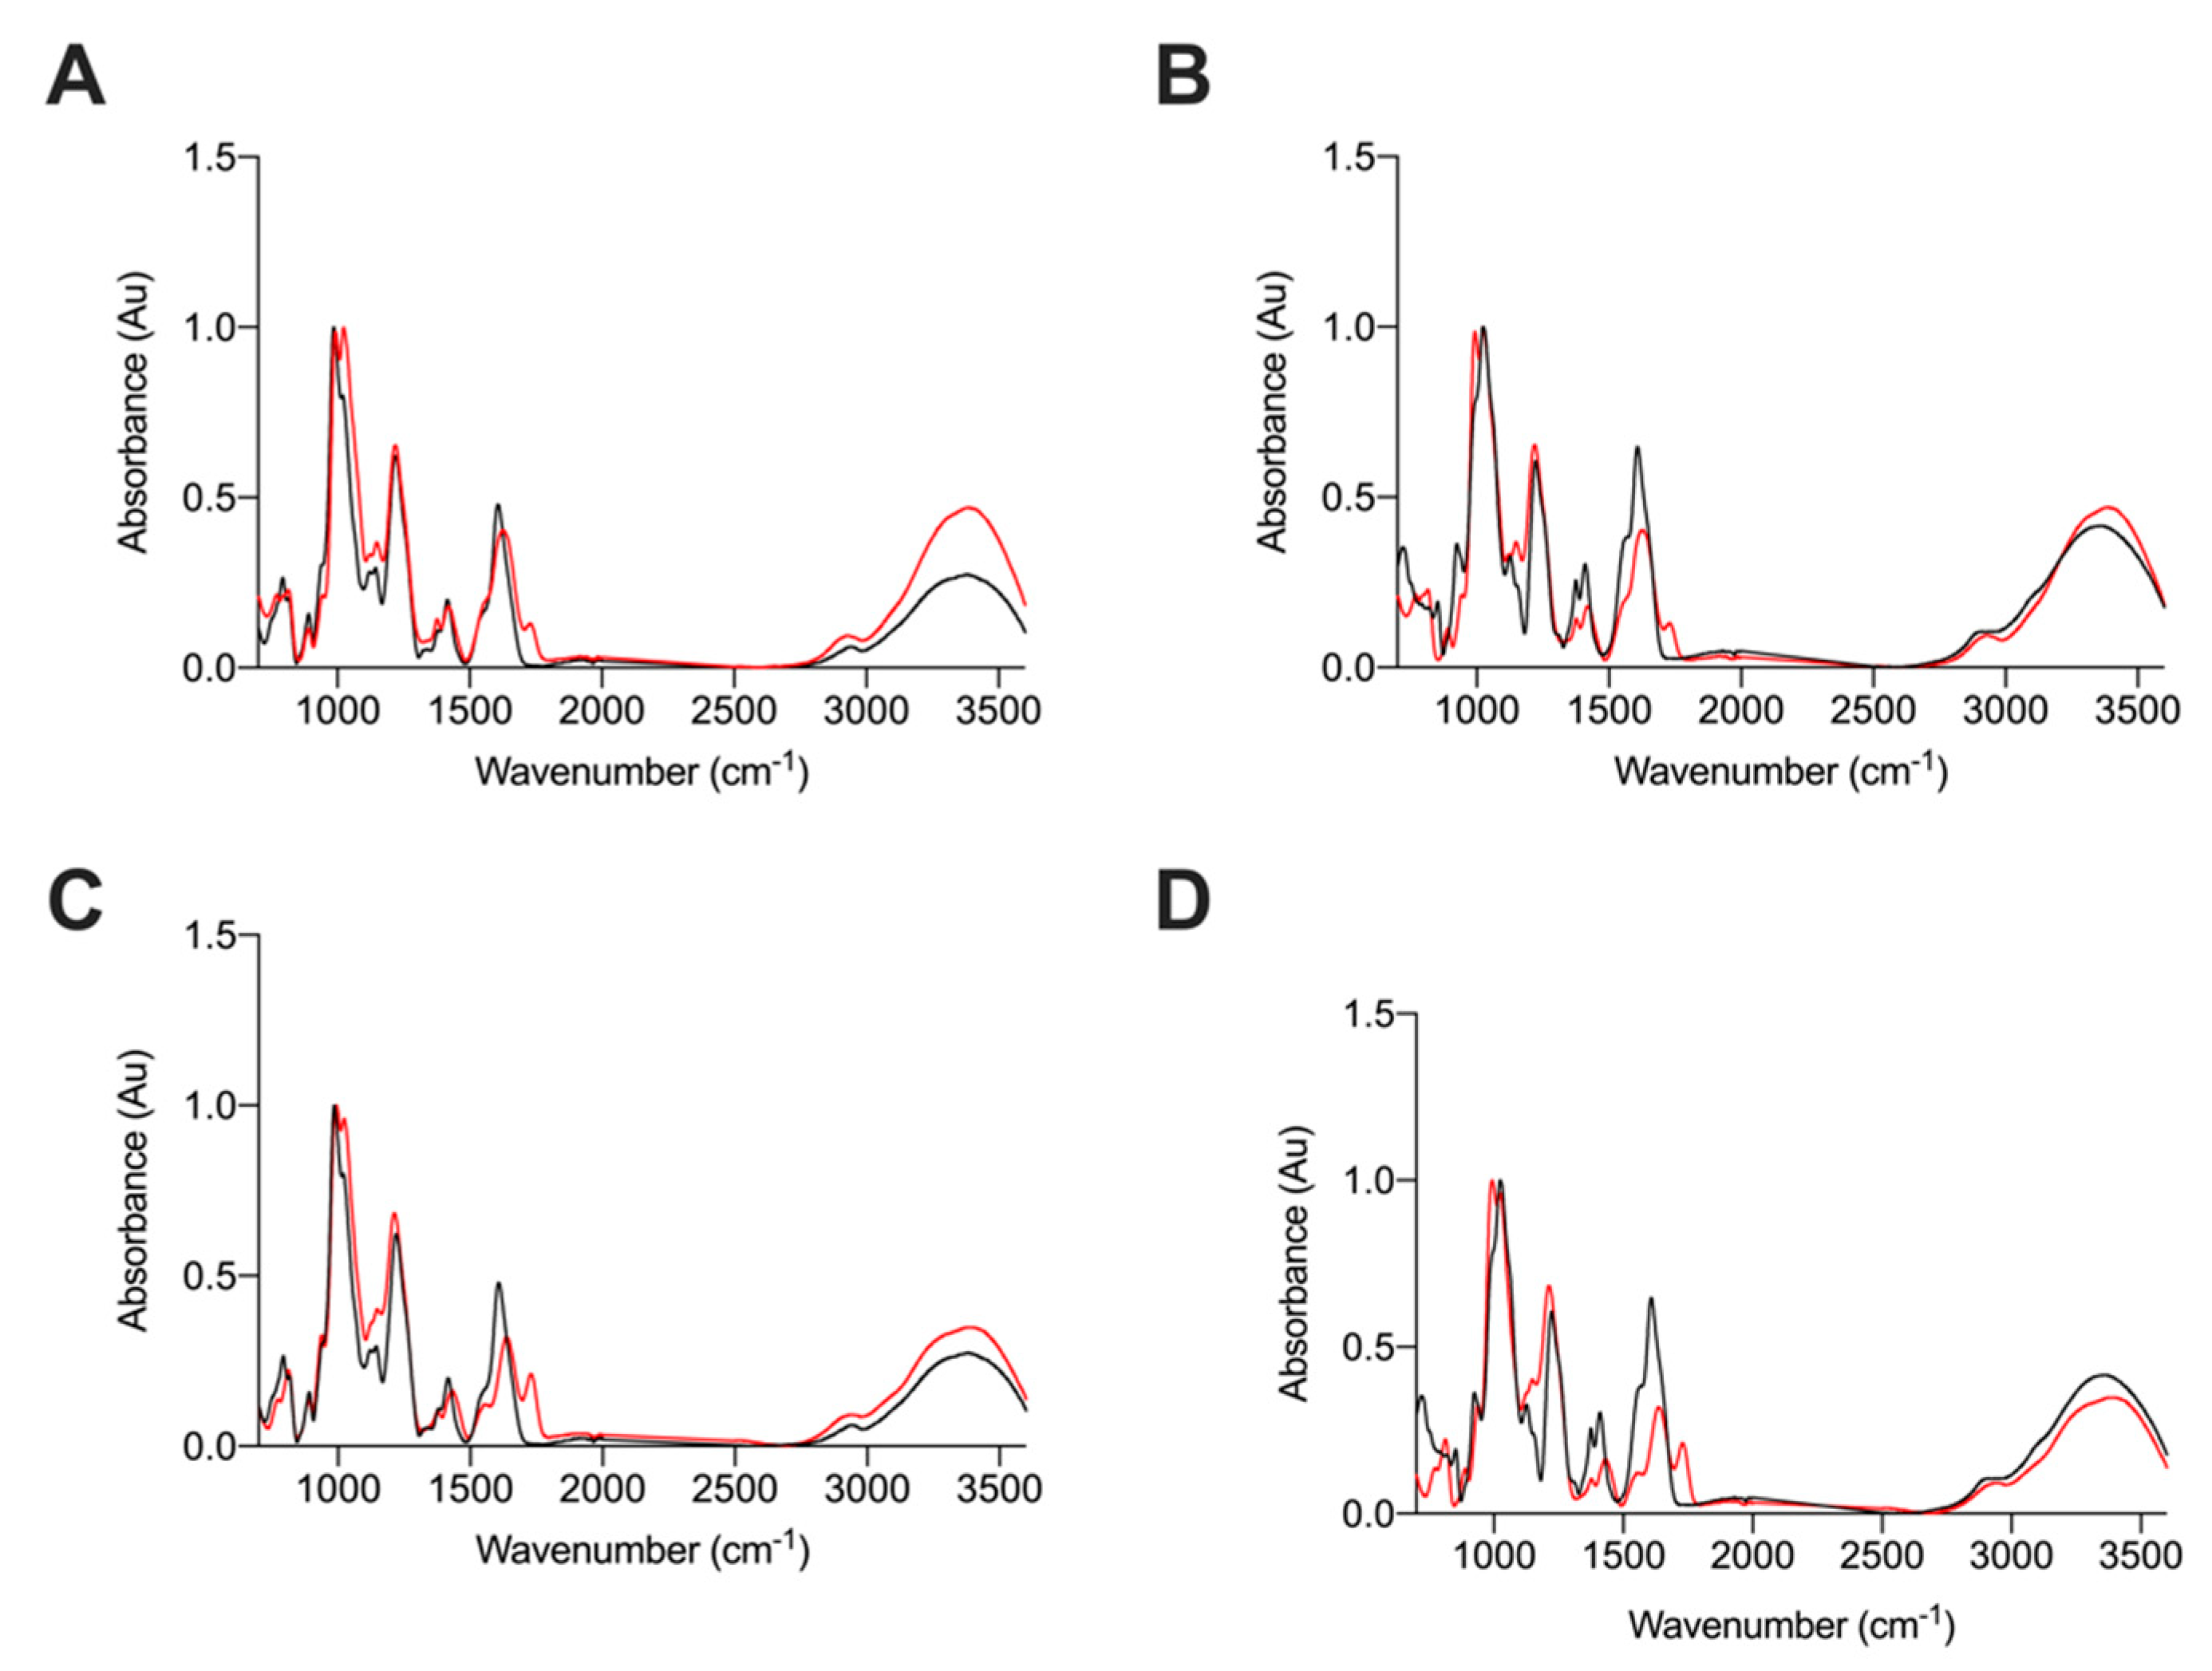
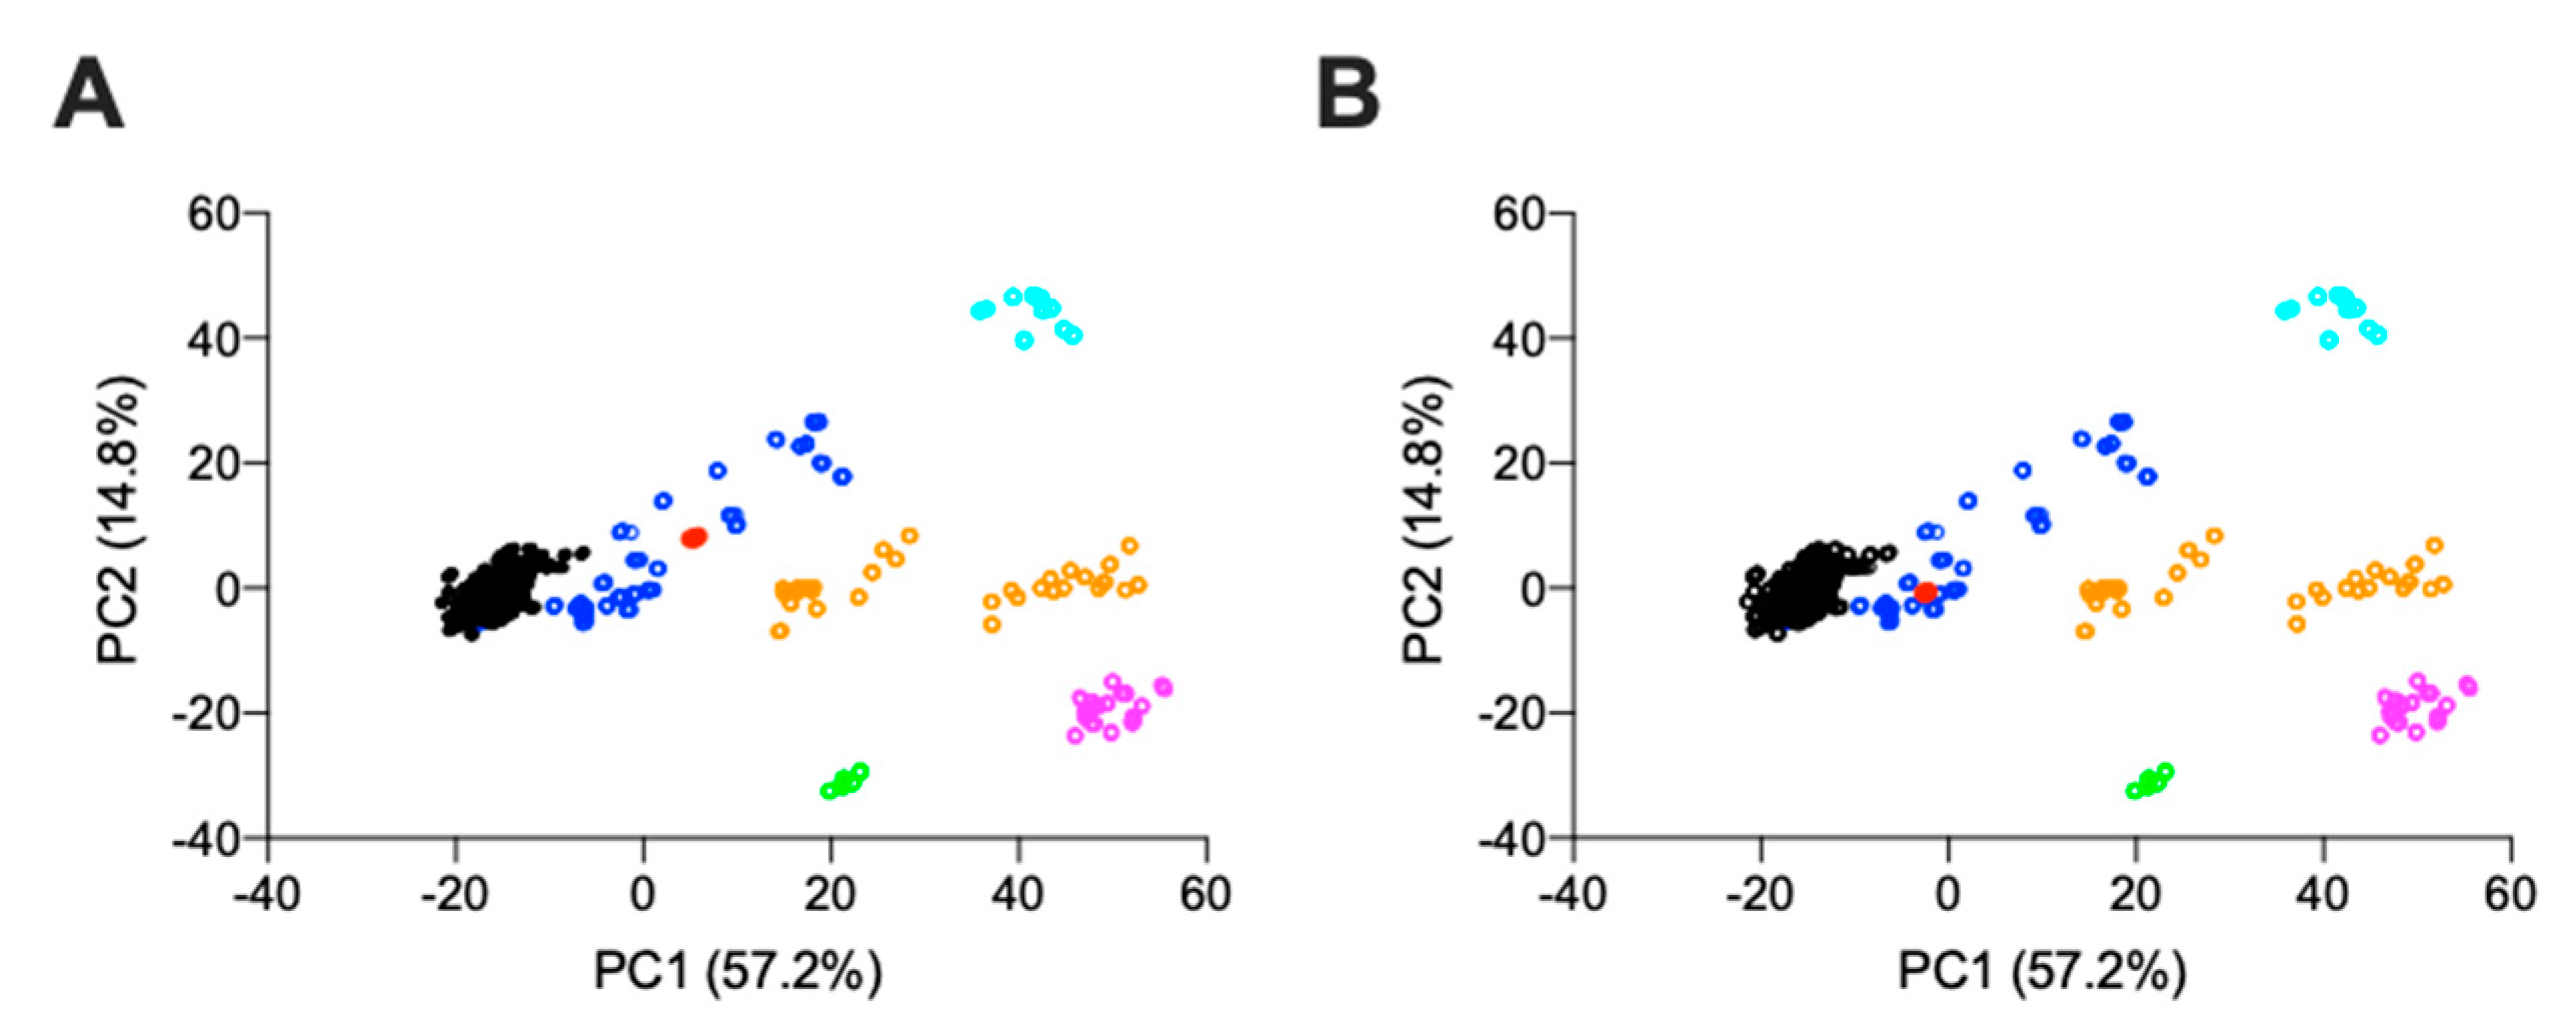
2.2.2. Attenuated Total Reflectance Fourier Transform Infrared Spectroscopy
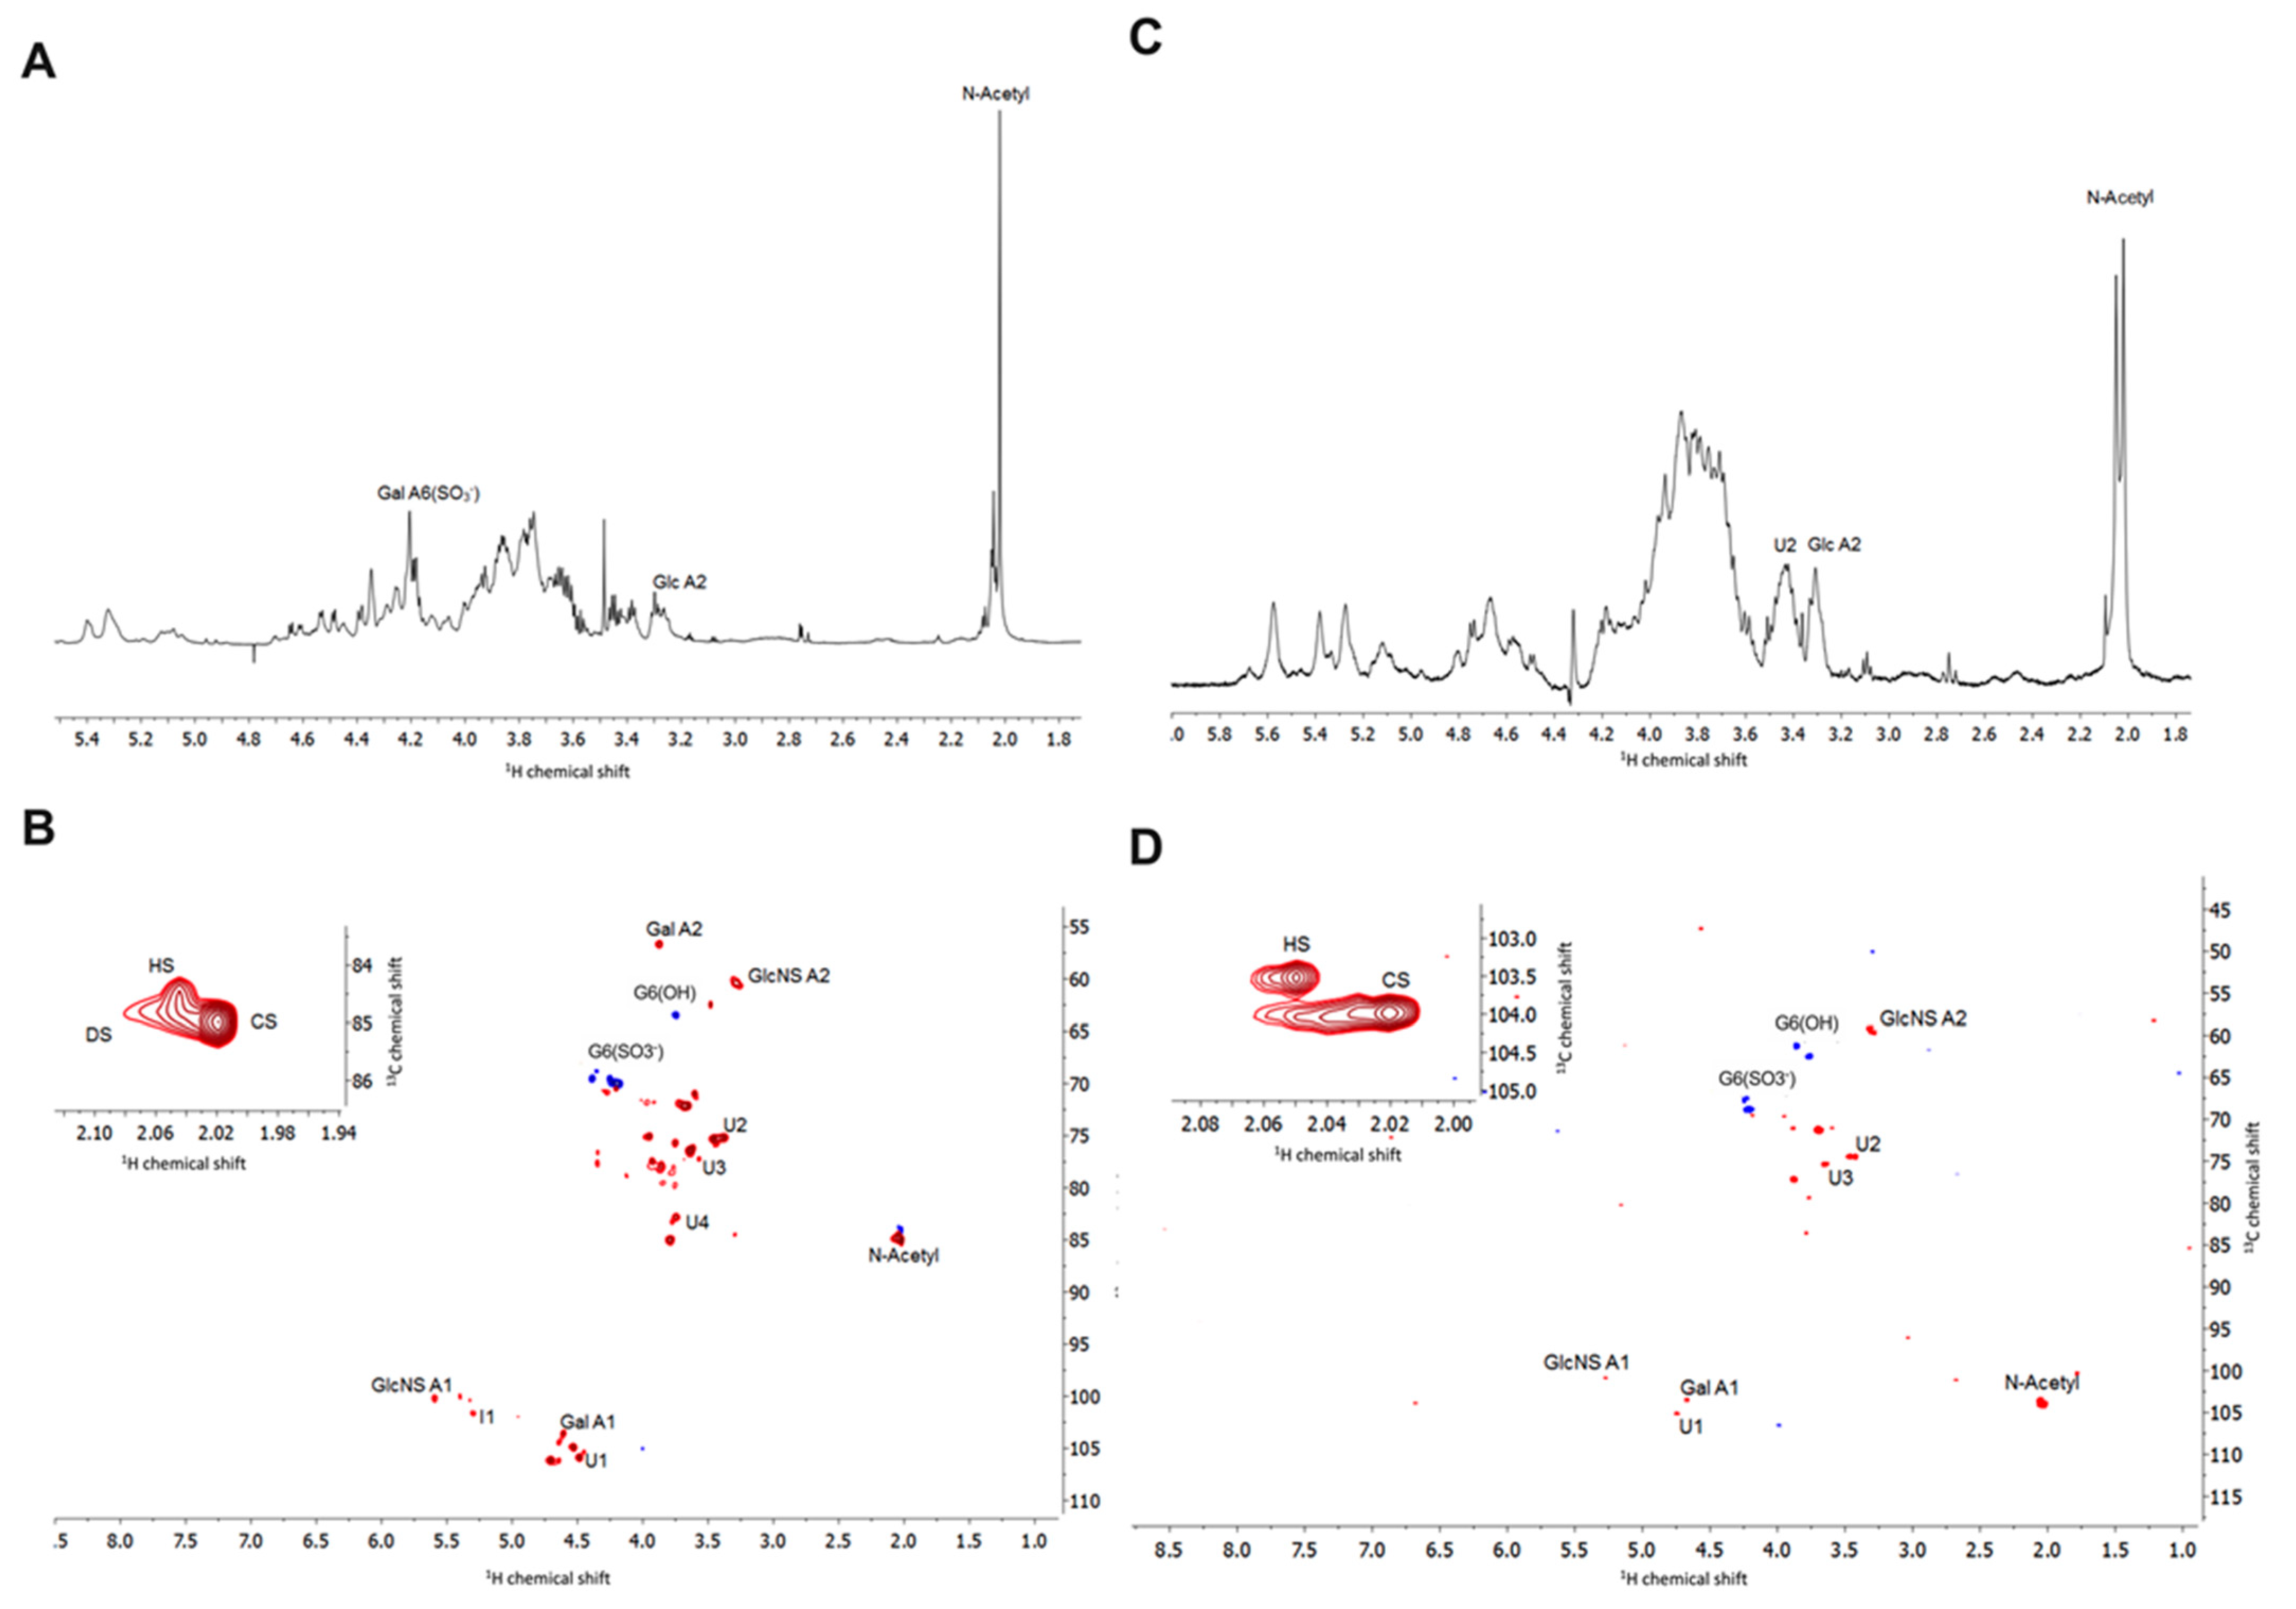
2.2.3. Nuclear Magnetic Resonance
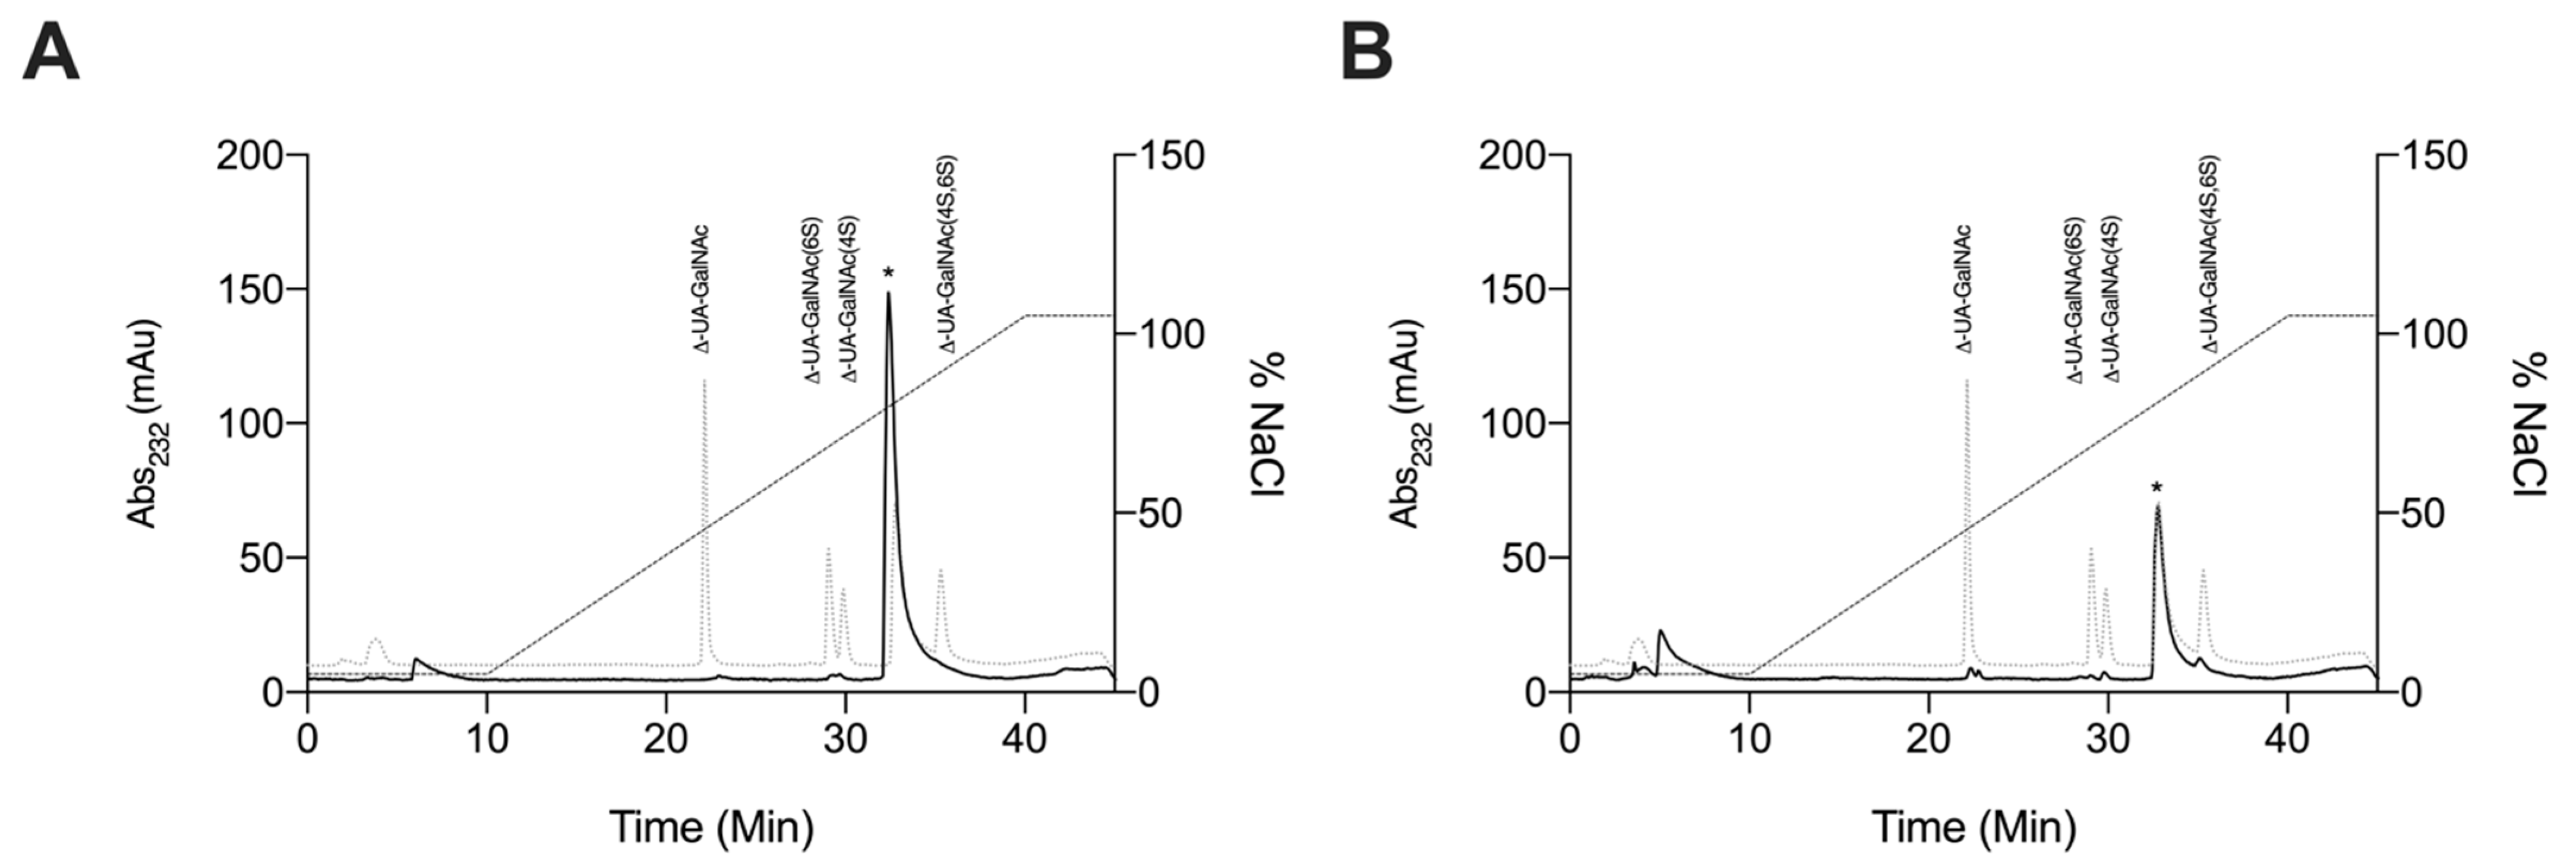
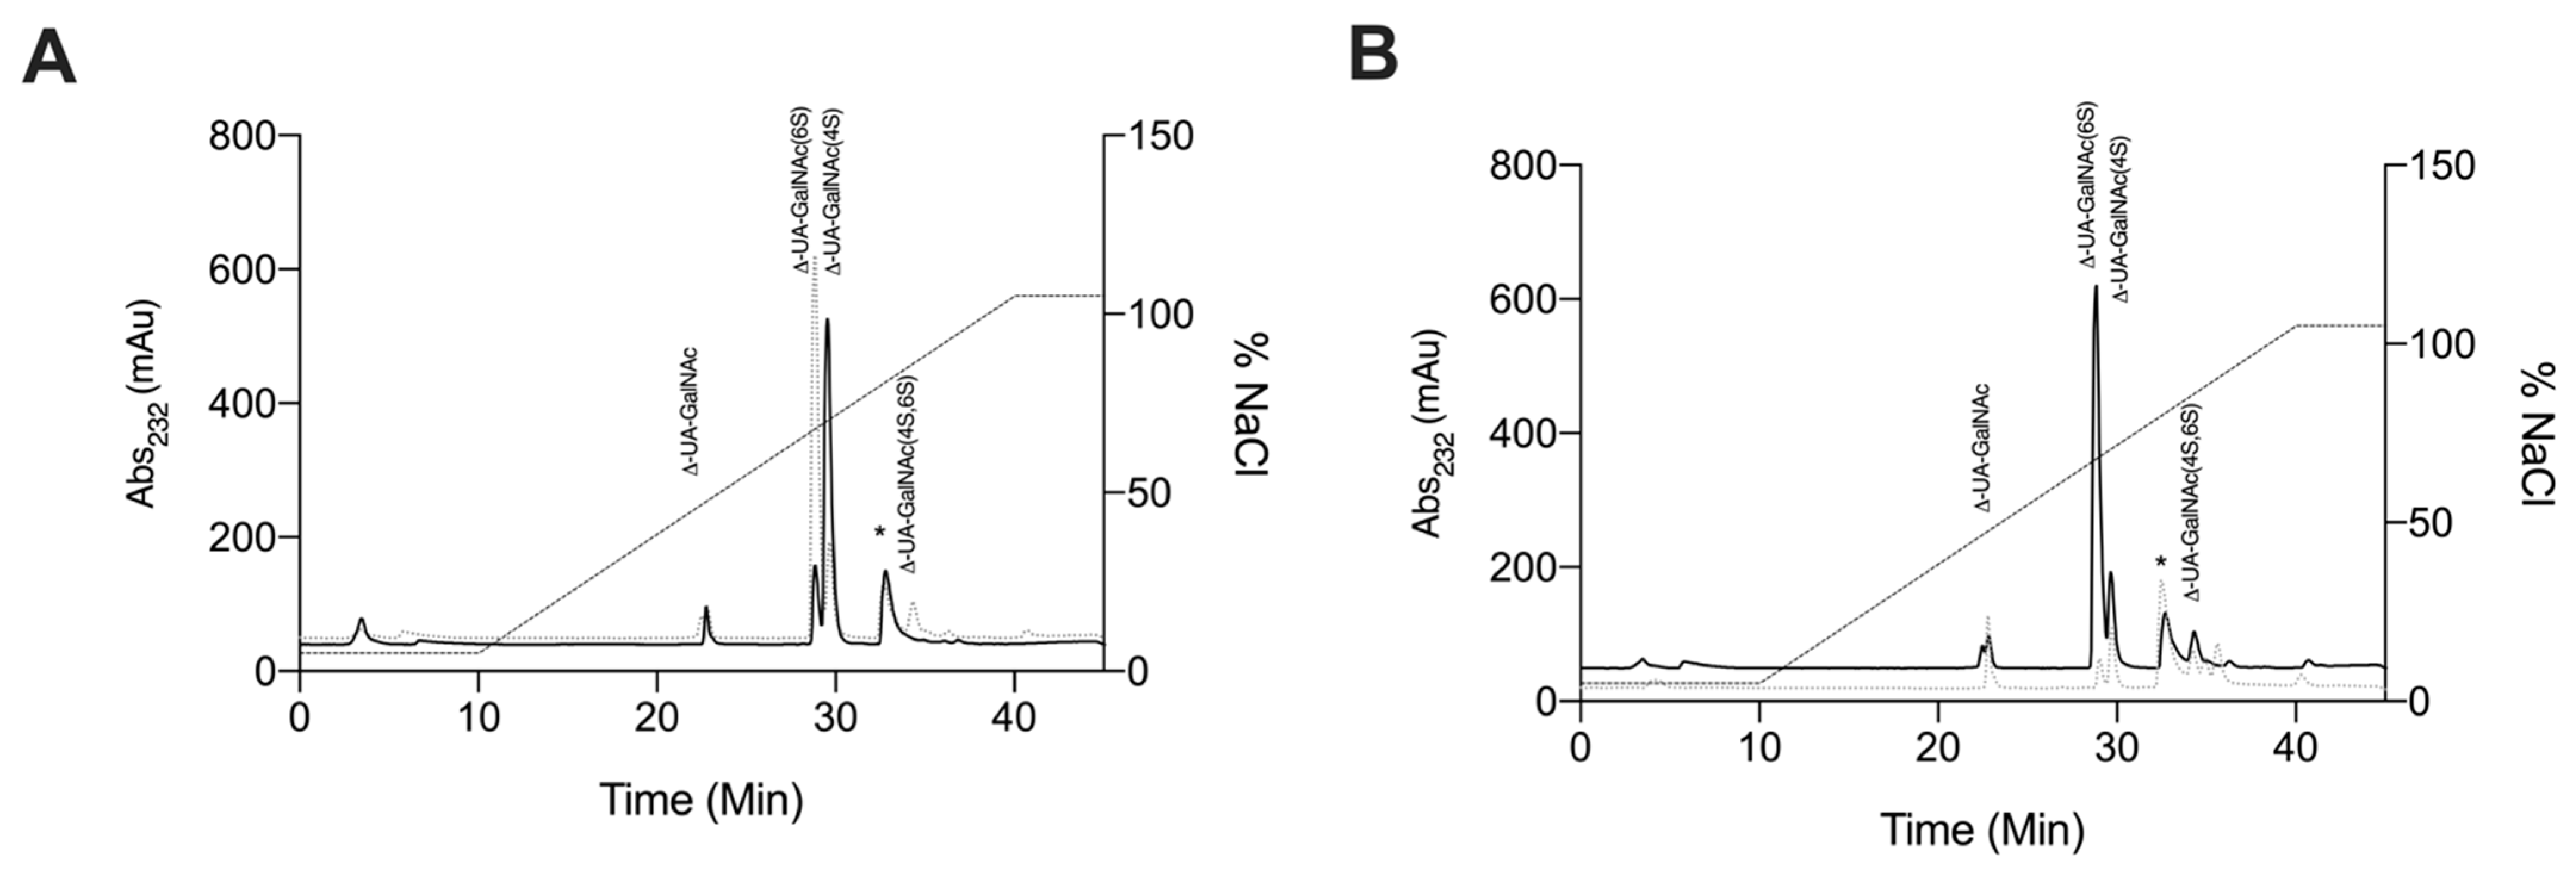
2.2.4. Strong Anion-Exchange High Performance Liquid Chromatography Disaccharide Compositional Analysis
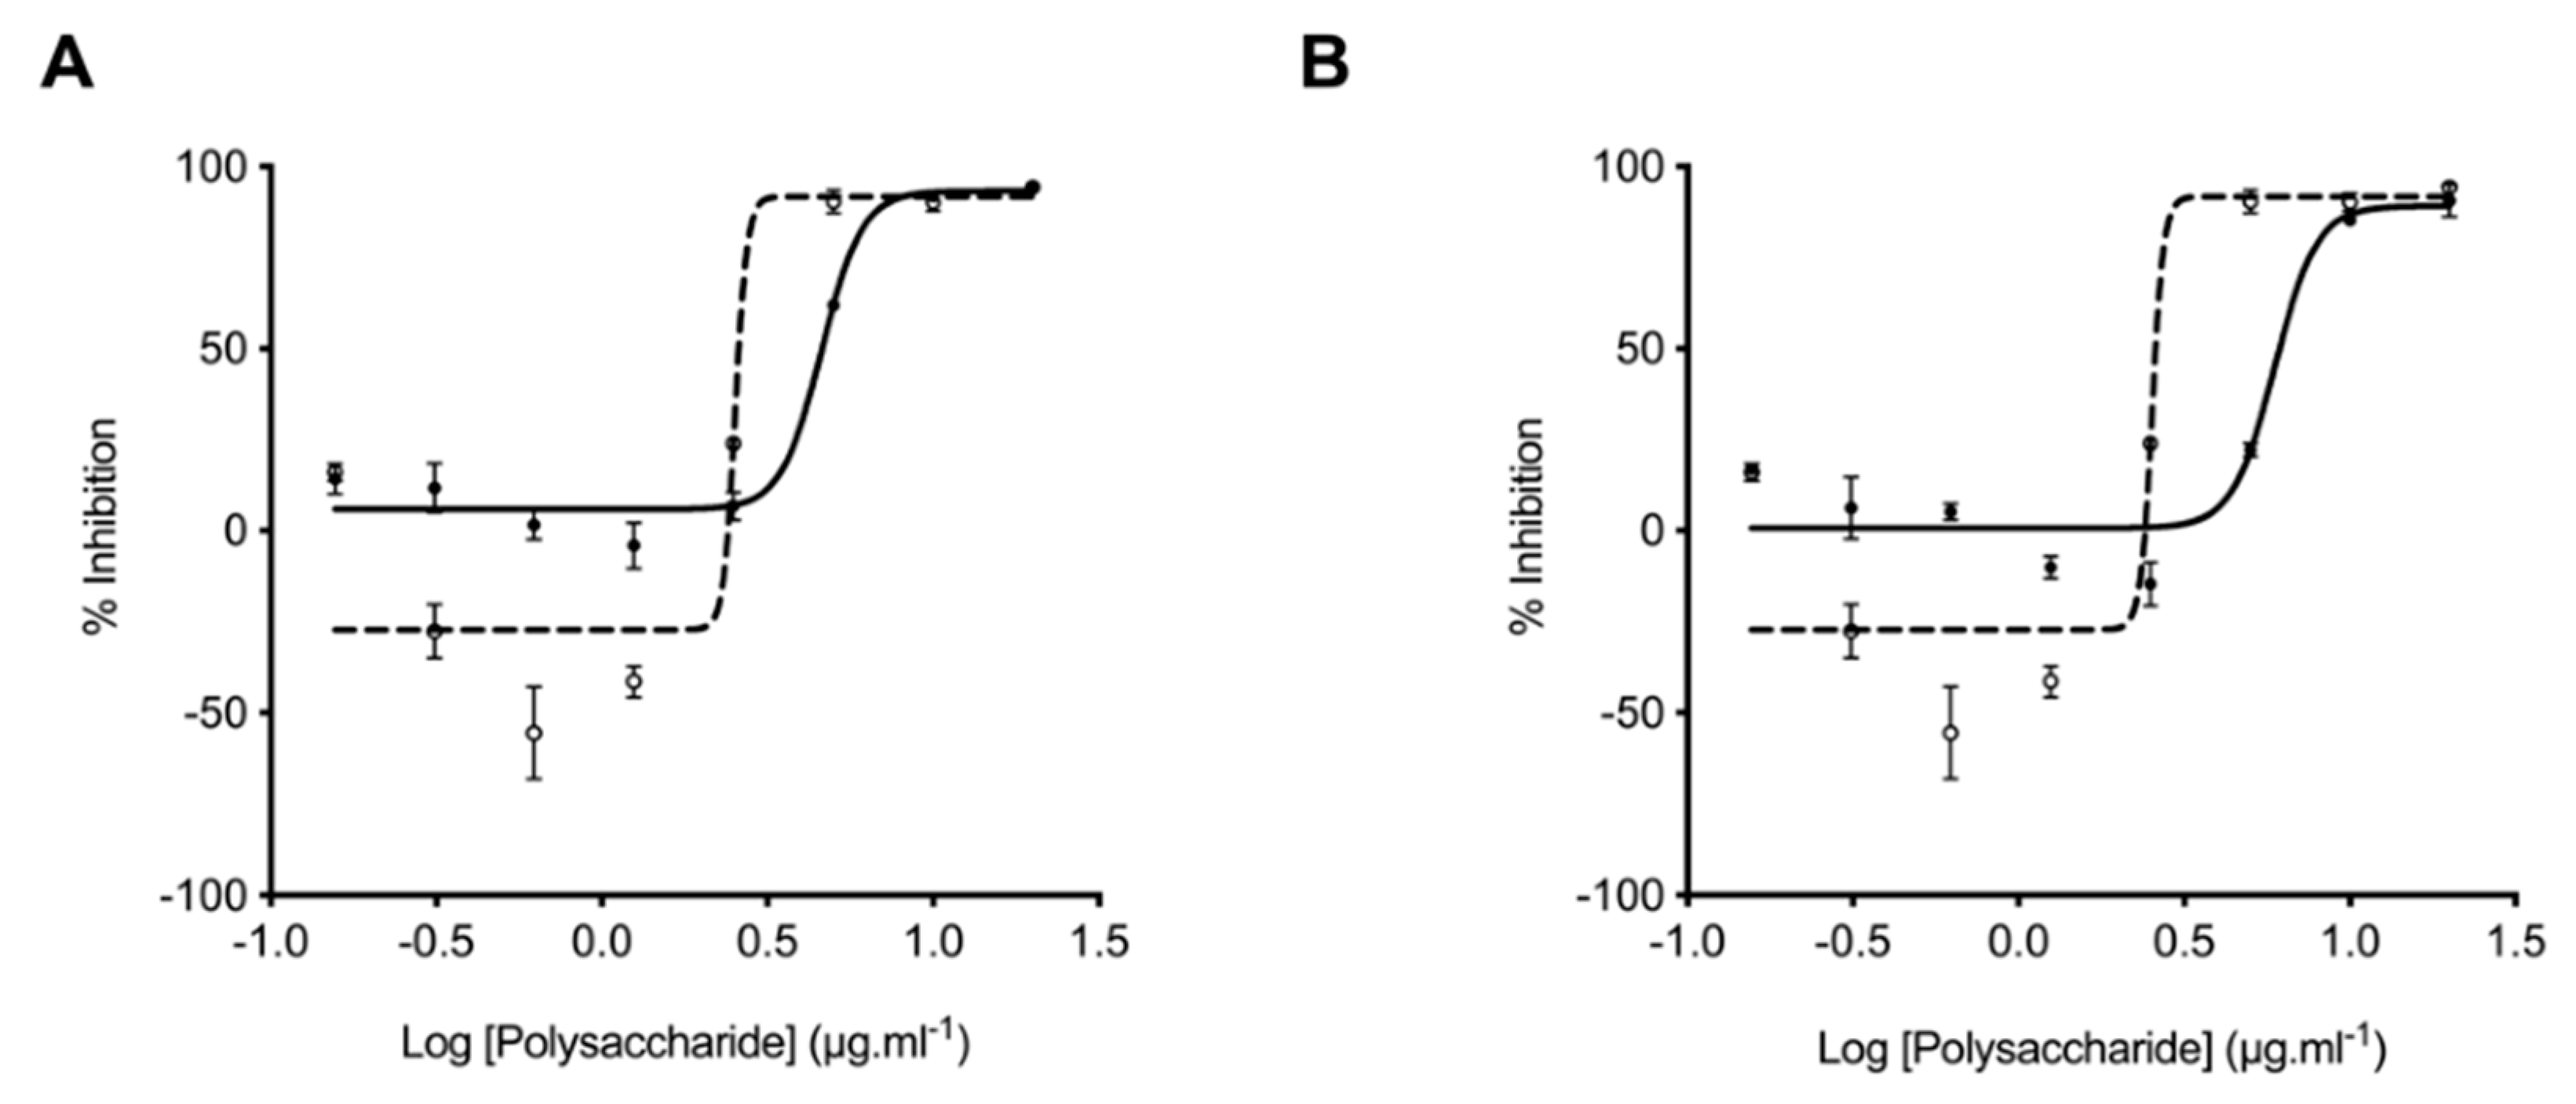
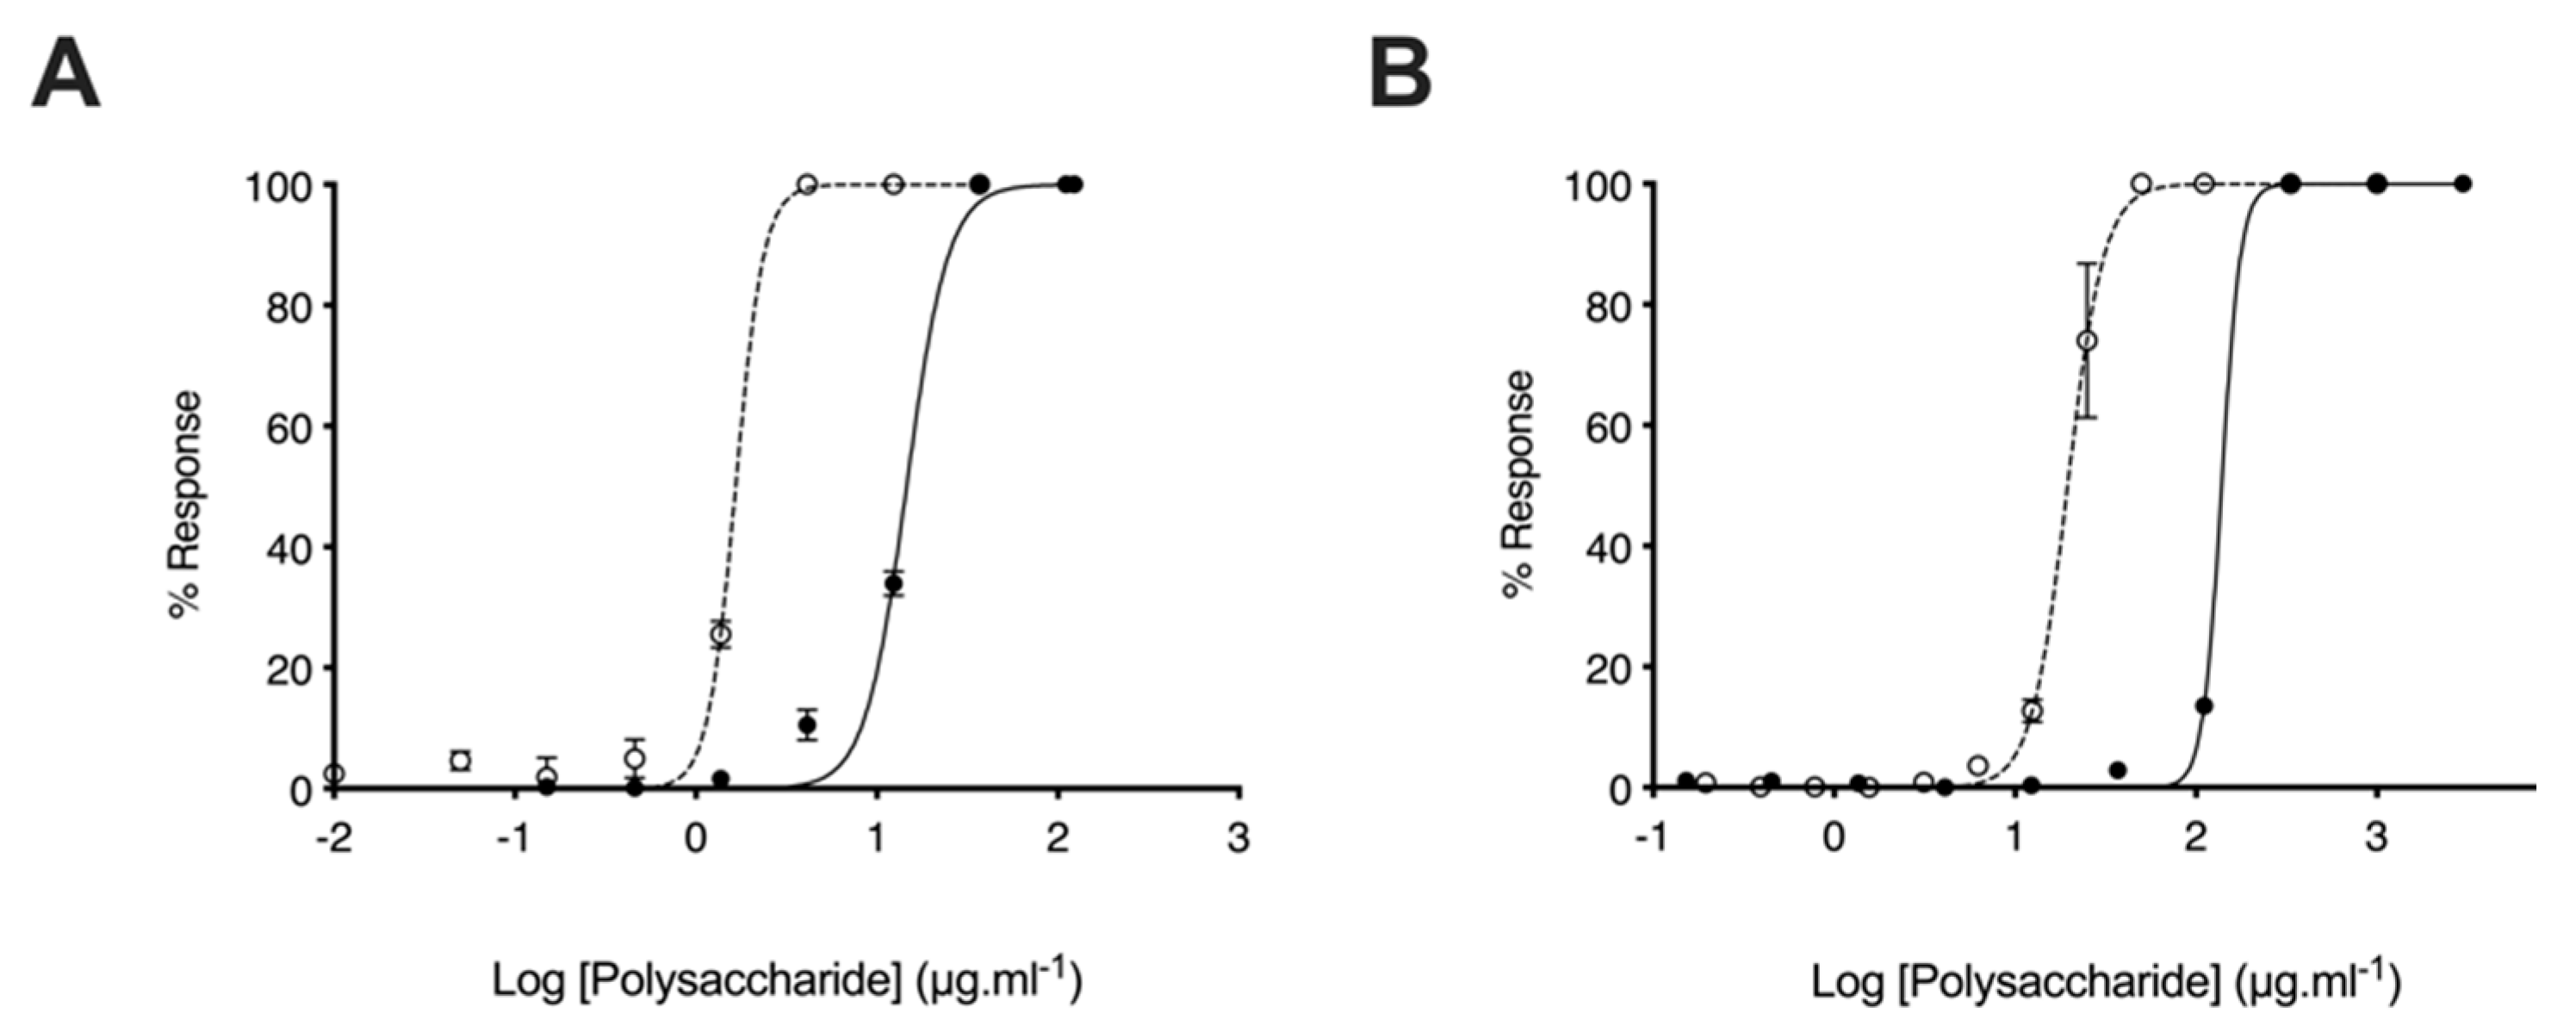
2.3. Glycosaminoglycans from Litopenaeus vannamei Inhibit β-Secretase 1
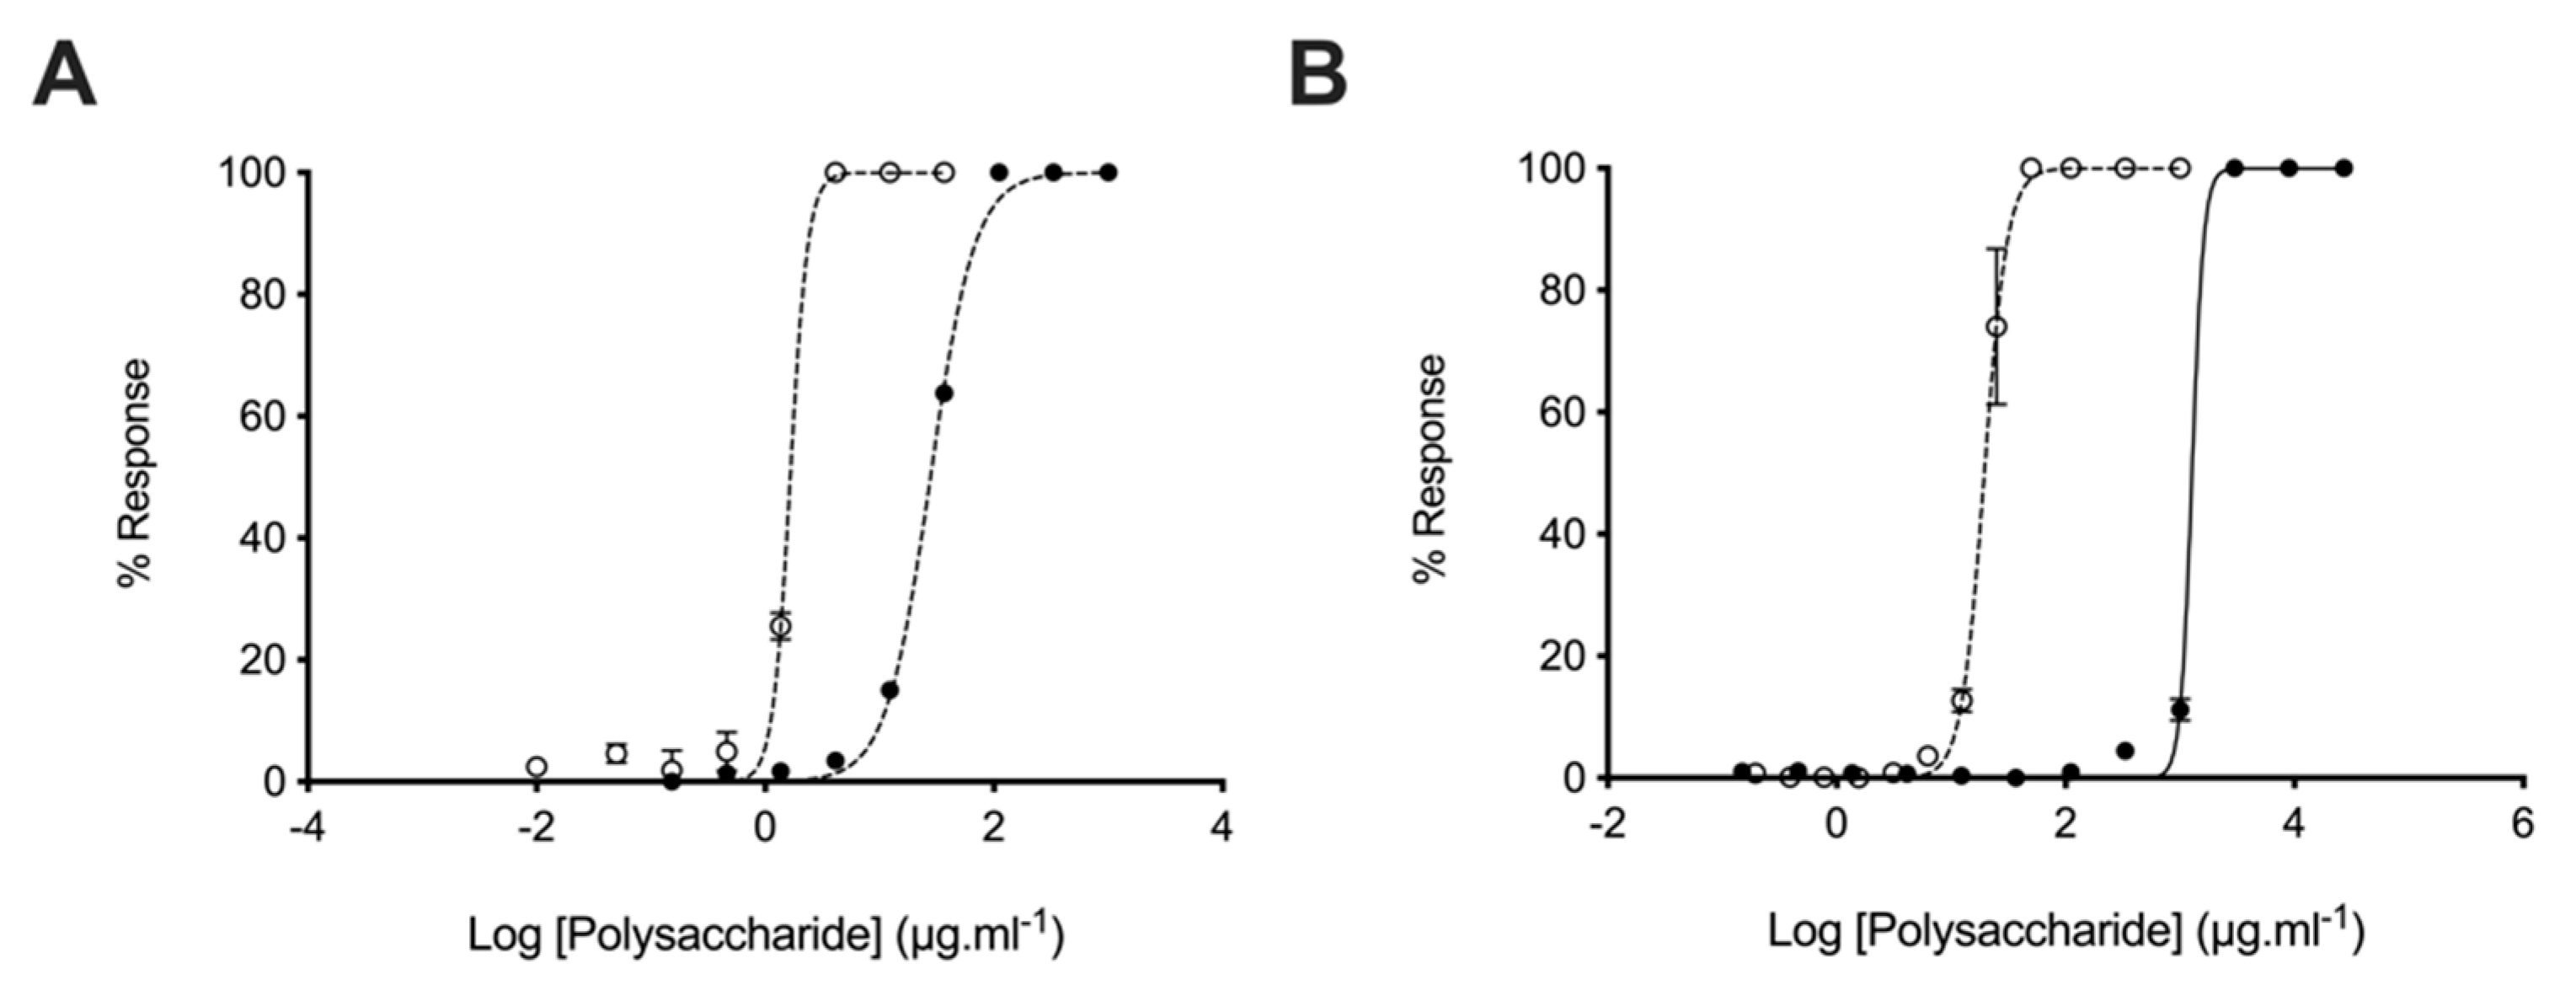
2.4. Glycosaminoglycans from Litopenaeus vannamei Possess Attenuated Anticoagulant Activities
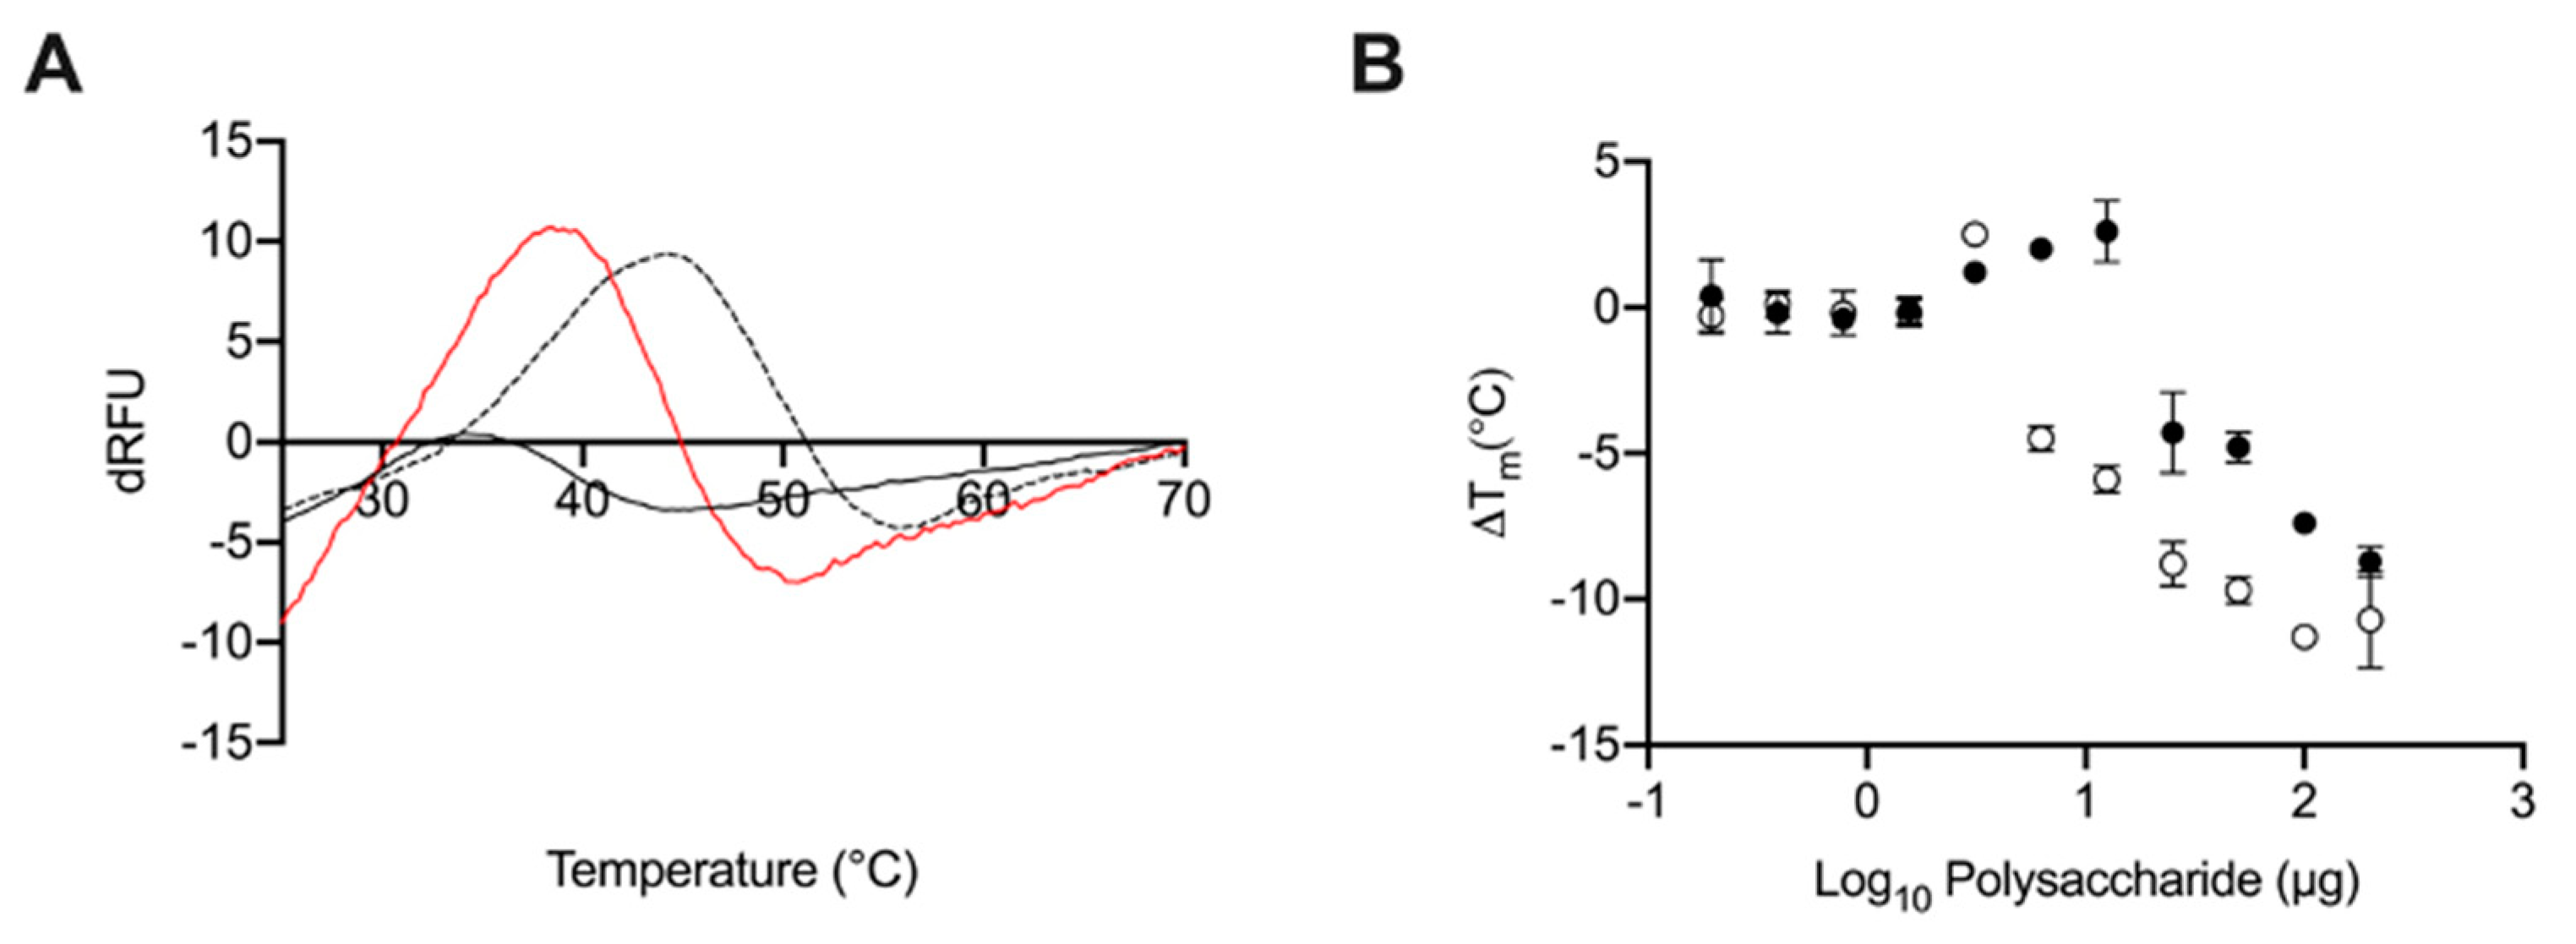
2.5. Glycosaminoglycans from Litopenaeus vannamei Decrease the Thermal Stability of BACE1
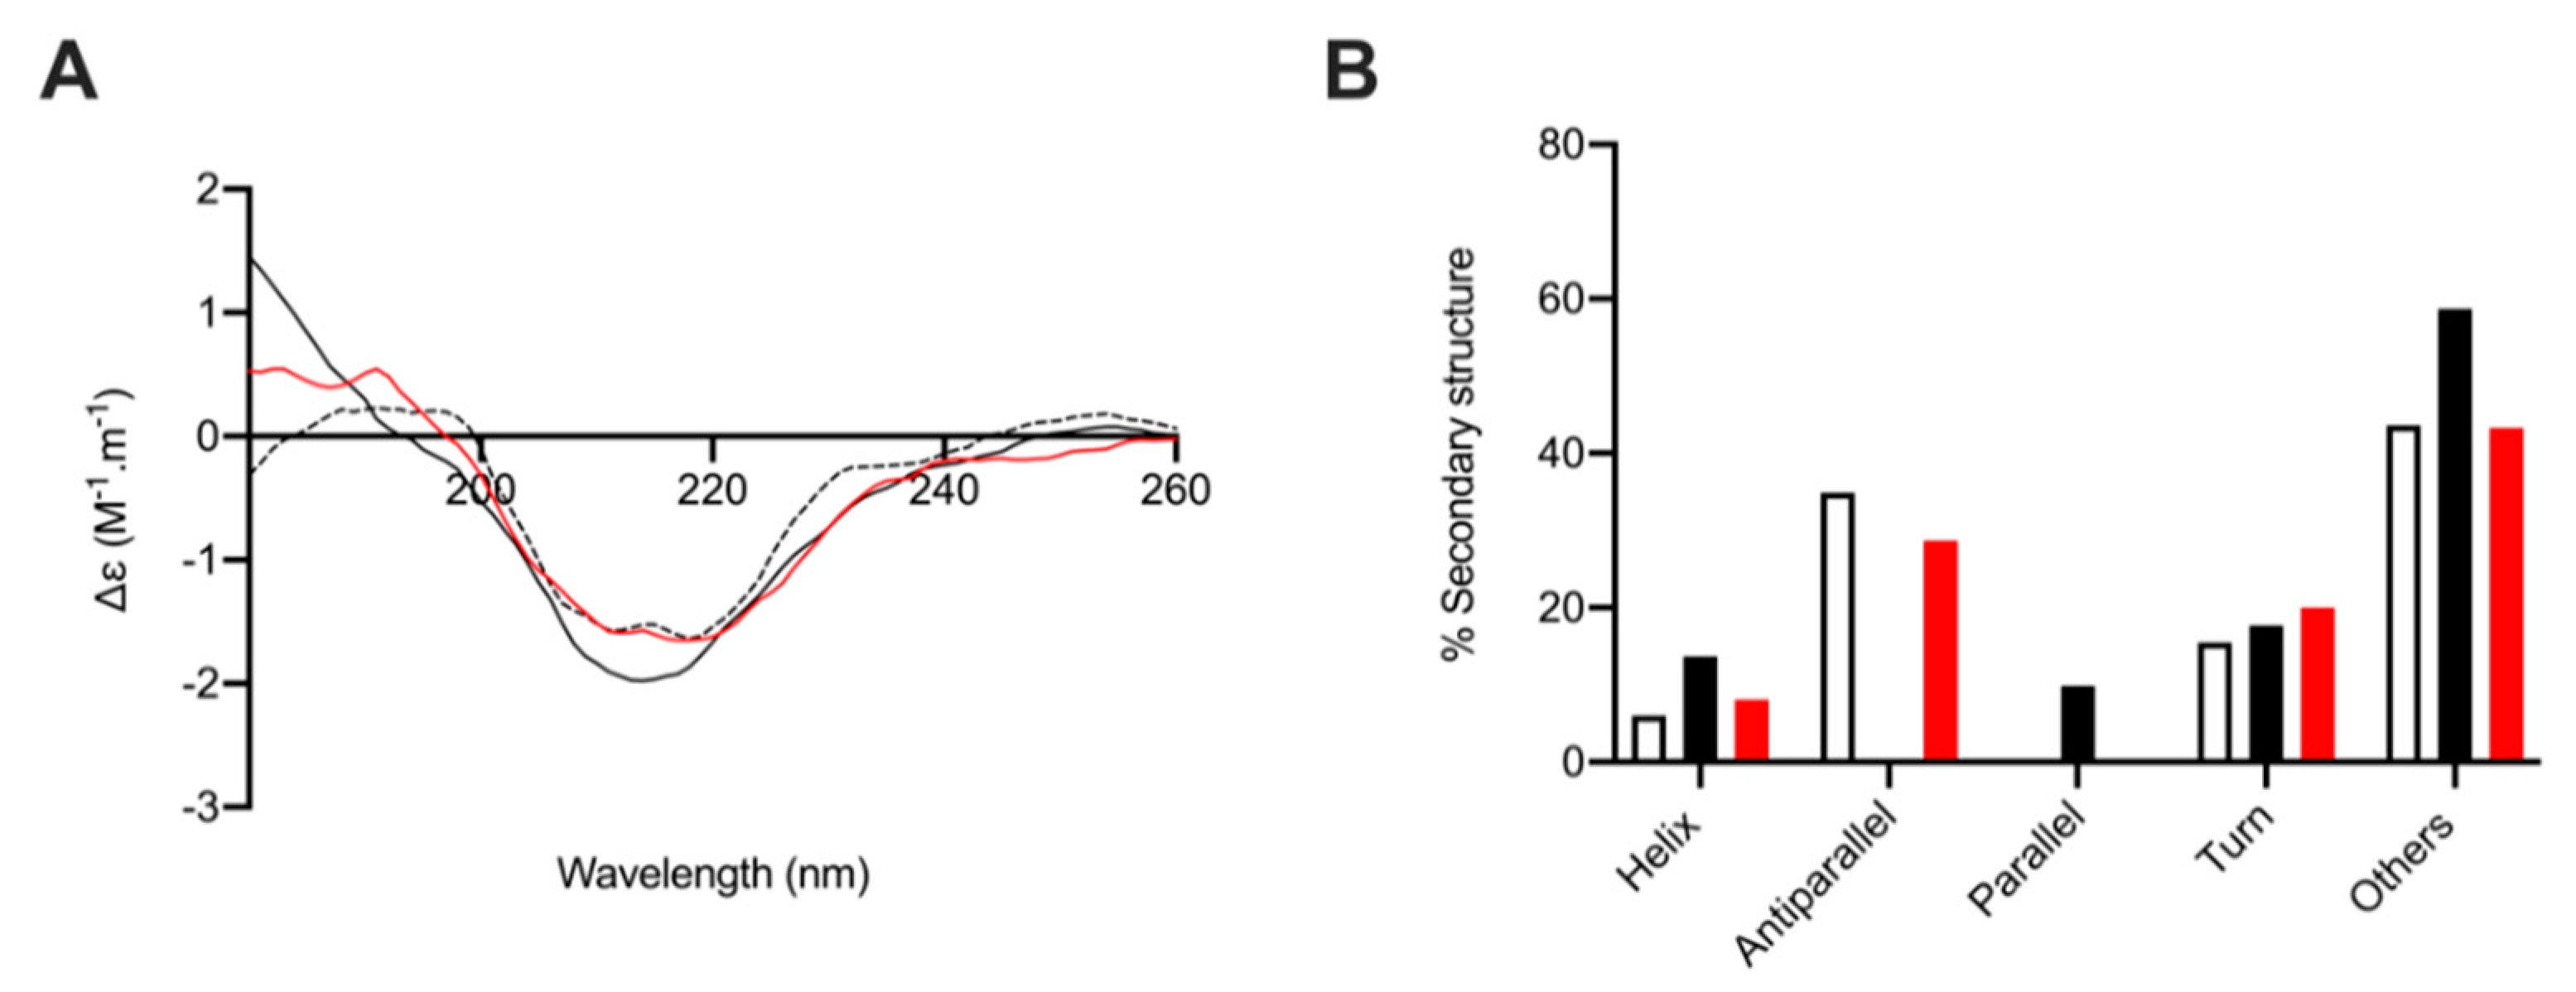
2.6. Circular Dichroism Spectroscopy of Human β-Secretase (BACE-1) with and without L. vannamei F4
3. Discussion
4. Methods
4.1. Isolation of Glycosaminoglycans from Litopenaeus vannamei
4.2. Agarose-Based, Gel Electrophoresis
4.3. Attenuated Total Reflectance Fourier Transform Infrared Spectroscopy
4.4. Strong Anion-Exchange High Performance Liquid Chromatography HS/Heparin Discacchaide Compositional Analysis
4.5. Strong Anion-Exchange High Performance Liquid Chromatography Chondrotin Sulphate Discacchaide Compositional Analysis
4.6. Nuclear Magnetic Resonance
4.7. Glycosaminoglycans from Litopenaeus vannamei Inhibit β-Secretase 1
4.8. Activated Partial Thromboplastin Time
4.9. Prothrombin Time
4.10. Differential Scanning Flurimetry
4.11. Circular Dichroism
Author Contributions
Funding
Data Availability Statement
Acknowledgments
Conflicts of Interest
Appendix A


References
- Cummings, J.; Lee, G.; Ritter, A.; Sabbagh, M.; Zhong, K. Alzheimer’s disease drug development pipeline: 2019. Alzheimer’s Dementia: Transl. Res. Clin. Interv. 2019, 5, 272–293. [Google Scholar] [CrossRef]
- Vaz, M.; Silvestre, S. Alzheimer’s disease: Recent treatment strategies. Eur. J. Pharmacol. 2020, 887, 173554. [Google Scholar] [CrossRef] [PubMed]
- Cai, H.; Wang, Y.; McCarthy, D.B.; Wen, H.; Borchelt, D.R.; Price, D.L.; Wong, P.C. BACE1 is the major β-secretase for generation of Aβ peptides by neurons. Nat. Neurosci. 2001, 4, 233–234. [Google Scholar] [CrossRef] [PubMed]
- Querfurth, H.W.; LaFerla, F.M. Alzheimer’s Disease. New Engl. J. Med. 2010, 362, 329–344. [Google Scholar] [CrossRef] [PubMed] [Green Version]
- Lichtenthaler, S.F.; Haass, C.; Steiner, H. Regulated intramembrane proteolysis—Lessons from amyloid precursor protein processing. J. Neurochem. 2011, 117, 779–796. [Google Scholar] [CrossRef] [PubMed]
- Vassar, R. BACE1 inhibition as a therapeutic strategy for Alzheimer’s disease. J. Sport Health Sci. 2016, 5, 388–390. [Google Scholar] [CrossRef] [PubMed] [Green Version]
- Scholefield, Z.; Yates, E.A.; Wayne, G.; Amour, A.; McDowell, W.H.; Turnbull, J.E. Heparan sulfate regulates amyloid precursor protein processing by BACE1, the Alzheimer’s β-secretase. J. Cell Biol. 2003, 163, 97–107. [Google Scholar] [CrossRef] [Green Version]
- Klaver, D.W.; Wilce, M.C.J.; Gasperini, R.; Freeman, C.; Juliano, J.P.; Parish, C.; Foa, L.; Aguilar, M.-I.; Small, D.H. Glycosaminoglycan-induced activation of the β-secretase (BACE1) of Alzheimer’s disease. J. Neurochem. 2010, 112, 1552–1561. [Google Scholar] [CrossRef]
- Mycroft-West, C.J.; Cooper, L.C.; Devlin, A.J.; Procter, P.; Guimond, S.E.; Guerrini, M.; Fernig, D.G.; Lima, M.A.; Yates, E.A.; Skidmore, M.A. A Glycosaminoglycan Extract from Portunus pelagicus Inhibits BACE1, the β Secretase Implicated in Alzheimer’s Disease. Mar. Drugs 2019, 17, 293. [Google Scholar] [CrossRef] [PubMed] [Green Version]
- Leveugle, B.; Ding, W.; Laurence, F.; Dehouck, M.-P.; Scanameo, A.; Cecchelli, R.; Fillit, H. Heparin Oligosaccharides that Pass the Blood-Brain Barrier Inhibit β-Amyloid Precursor Protein Secretion and Heparin Binding to β-Amyloid Peptide. J. Neurochem. 2002, 70, 736–744. [Google Scholar] [CrossRef]
- Patey, S.J.; Edwards, E.A.; Yates, E.A.; Turnbull, J.E. Heparin Derivatives as Inhibitors of BACE-1, the Alzheimer’s β-Secretase, with Reduced Activity against Factor Xa and Other Proteases. J. Med. Chem. 2006, 49, 6129–6132. [Google Scholar] [CrossRef] [PubMed]
- Ma, Q.; Cornelli, U.; Hanin, I.; Jeske, W.; Linhardt, R.; Walenga, J.; Fareed, J.; Lee, J. Heparin Oligosaccharides as Potential Therapeutic Agents in Senile Dementia. Curr. Pharm. Des. 2007, 13, 1607–1616. [Google Scholar] [CrossRef] [PubMed] [Green Version]
- Bergamaschini, L.; Rossi, E.; Vergani, C.; De Simoni, M.G. Alzheimer’s Disease: Another Target for Heparin Therapy. Sci. World J. 2009, 9, 891–908. [Google Scholar] [CrossRef] [PubMed] [Green Version]
- González, J.F.; Alcántara, A.R.; Doadrio, A.L.; Sánchez-Montero, J.M. Developments with multi-target drugs for Alzheimer’s disease: An overview of the current discovery approaches. Expert Opin. Drug Discov. 2019, 14, 879–891. [Google Scholar] [CrossRef]
- Bergamaschini, L.; Rossi, E.; Storini, C.; Pizzimenti, S.; Distaso, M.; Perego, C.; De Luigi, A.; Vergani, C.; De Simoni, M.G. Peripheral Treatment with Enoxaparin, a Low Molecular Weight Heparin, Reduces Plaques and β-Amyloid Accumulation in a Mouse Model of Alzheimer’s Disease. J. Neurosci. 2004, 24, 4181–4186. [Google Scholar] [CrossRef]
- Timmer, N.M.; Van Dijk, L.; Van Der Zee, C.E.; Kiliaan, A.; De Waal, R.M.; Verbeek, M.M. Enoxaparin treatment administered at both early and late stages of amyloid β deposition improves cognition of APPswe/PS1dE9 mice with differential effects on brain Aβ levels. Neurobiol. Dis. 2010, 40, 340–347. [Google Scholar] [CrossRef]
- Mycroft-West, C.J.; Yates, E.A.; Skidmore, M.A. Marine glycosaminoglycan-like carbohydrates as potential drug candidates for infectious disease. Biochem. Soc. Trans. 2018, 46, 919–929. [Google Scholar] [CrossRef] [PubMed]
- Patey, S.; Edwards, E.; Yates, E.; Turnbull, J. Engineered Heparins: Novel β-Secretase Inhibitors as Potential Alzheimer’s Disease Therapeutics. Neurodegener. Dis. 2008, 5, 197–199. [Google Scholar] [CrossRef]
- Valcarcel, J.; Novoa-Carballal, R.; Pérez-Martín, R.I.; Reis, R.L.; Vázquez, J.A. Glycosaminoglycans from marine sources as therapeutic agents. Biotechnol. Adv. 2017, 35, 711–725. [Google Scholar] [CrossRef]
- Bergefall, K.; Trybala, E.; Johansson, M.; Uyama, T.; Naito, S.; Yamada, S.; Kitagawa, H.; Sugahara, K.; Bergström, T. Chondroitin Sulfate Characterized by the E-disaccharide Unit Is a Potent Inhibitor of Herpes Simplex Virus Infectivity and Provides the Virus Binding Sites on gro2C Cells. J. Biol. Chem. 2005, 280, 32193–32199. [Google Scholar] [CrossRef] [Green Version]
- Wu, M.; Huang, R.; Wen, D.; Gao, N.; He, J.; Li, Z.; Zhao, J. Structure and effect of sulfated fucose branches on anticoagulant activity of the fucosylated chondroitin sulfate from sea cucumber Thelenata ananas. Carbohydr. Polym. 2012, 87, 862–868. [Google Scholar] [CrossRef]
- Brito, A.S.; Arimatéia, D.S.; Souza, L.R.; Lima, M.A.; Santos, V.O.; Medeiros, V.P.; Ferreira, P.A.; Silva, R.A.; Ferreira, C.V.; Justo, G.Z.; et al. Anti-inflammatory properties of a heparin-like glycosaminoglycan with reduced anti-coagulant activity isolated from a marine shrimp. Bioorganic Med. Chem. 2008, 16, 9588–9595. [Google Scholar] [CrossRef] [PubMed]
- Chavante, S.F.; A Santos, E.; Oliveira, F.W.; Guerrini, M.; Torri, G.; Casu, B.; Dietrich, C.P.; Nader, H.B. A novel heparan sulphate with high degree of N-sulphation and high heparin cofactor-II activity from the brine shrimp Artemia franciscana. Int. J. Biol. Macromol. 2000, 27, 49–57. [Google Scholar] [CrossRef]
- Palhares, L.C.; Brito, A.S.; de Lima, M.A.; Nader, H.B.; London, J.A.; Barsukov, I.L.; Andrade, G.P.; Yates, E.A.; Chavante, S.F. A further unique chondroitin sulfate from the shrimp Litopenaeus vannamei with antithrombin activity that modulates acute inflammation. Carbohydr. Polym. 2019, 222, 115031. [Google Scholar] [CrossRef] [PubMed]
- Chavante, S.F.; Brito, A.S.; Lima, M.; Yates, E.; Nader, H.; Guerrini, M.; Torri, G.; Bisio, A. A heparin-like glycosaminoglycan from shrimp containing high levels of 3-O-sulfated d-glucosamine groups in an unusual trisaccharide sequence. Carbohydr. Res. 2014, 390, 59–66. [Google Scholar] [CrossRef] [PubMed]
- Cavalcante, R.S.; Brito, A.S.; Palhares, L.C.; Lima, M.A.; Cavalheiro, R.P.; Nader, H.B.; Sassaki, G.L.; Chavante, S.F. 2,3-Di-O-sulfo glucuronic acid: An unmodified and unusual residue in a highly sulfated chondroitin sulfate from Litopenaeus vannamei. Carbohydr. Polym. 2018, 183, 192–200. [Google Scholar] [CrossRef] [PubMed]
- Pavão, M.S.G. Glycosaminoglycans analogs from marine invertebrates: Structure, biological effects, and potential as new therapeutics. Front. Cell. Infect. Microbiol. 2014, 4, 123. [Google Scholar] [CrossRef] [PubMed] [Green Version]
- Vasconcelos, A.A.; Pomin, V.H. The Sea as a Rich Source of Structurally Unique Glycosaminoglycans and Mimetics. Microorganisms 2017, 5, 51. [Google Scholar] [CrossRef] [Green Version]
- Gomes, A.M.; Kozlowski, E.O.; Borsig, L.; Teixeira, F.C.O.B.; Vlodavsky, I.; Pavão, M.S.G. Antitumor properties of a new non-anticoagulant heparin analog from the mollusk Nodipecten nodosus: Effect on P-selectin, heparanase, metastasis and cellular recruitment. Glycobiology 2015, 25, 386–393. [Google Scholar] [CrossRef] [Green Version]
- Mycroft-West, C.J.; Devlin, A.J.; Cooper, L.C.; Procter, P.; Miller, G.J.; Fernig, D.G.; Guerrini, M.; Guimond, S.E.; Lima, M.A.; Yates, E.A.; et al. Inhibition of BACE1, the β-secretase implicated in Alzheimer’s disease, by a chondroitin sulfate extract from Sardina pilchardus. Neural Regen. Res. 2020, 15, 1546–1553. [Google Scholar]
- Devlin, A.; Mauri, L.; Guerrini, M.; Yates, E.A.; Skidmore, M.A. The use of ATR-FTIR spectroscopy to characterise crude heparin samples by composition and structural features. bioRxiv 2019, 744532. [Google Scholar] [CrossRef]
- Grant, D.; Long, W.F.; Moffat, C.F.; Williamson, F.B. Infrared spectroscopy of chemically modified heparins. Biochem. J. 1989, 261, 1035–1038. [Google Scholar] [CrossRef] [Green Version]
- Vasko, P.; Blackwell, J.; Koenig, J. Infrared and raman spectroscopy of carbohydrates. Part I: Identification of OH and CH-related vibrational modes for D-glucose, maltose, cellobiose, and dextran by deuterium-substitution methods. Carbohydr. Res. 1971, 19, 297–310. [Google Scholar] [CrossRef]
- Myron, P.; Siddiquee, S.; Al Azad, S. Partial structural studies of fucosylated chondroitin sulfate (FuCS) using attenuated total reflection fourier transform infrared spectroscopy (ATR-FTIR) and chemometrics. Vib. Spectrosc. 2017, 89, 26–36. [Google Scholar] [CrossRef]
- Pomin, V.H. NMR Chemical Shifts in Structural Biology of Glycosaminoglycans. Anal. Chem. 2014, 86, 65–94. [Google Scholar] [CrossRef] [PubMed]
- Mucci, A.; Schenetti, L.; Volpi, N. H and 13 C nuclear magnetic resonance identification and characterization of components of chondroitin sulfates of various origin. Carbohydr. Polym. 2000, 41, 37–45. [Google Scholar] [CrossRef]
- Sugahara, K.; Nadanaka, S.; Takeda, K.; Kojima, T. Structural Analysis of Unsaturated Hexasaccharides Isolated from Shark Cartilage Chondroitin Sulfate D that are Substrates for the Exolytic Action of Chondroitin ABC Lyase. JBIC J. Biol. Inorg. Chem. 1996, 239, 871–880. [Google Scholar] [CrossRef] [PubMed]
- Kinoshita-Toyoda, A.; Yamada, S.; Haslam, S.M.; Khoo, K.-H.; Sugiura, M.; Morris, H.R.; Dell, A.A.; Sugahara, K. Structural Determination of Five Novel Tetrasaccharides Containing 3-O-Sulfatedd-Glucuronic Acid and Two Rare Oligosaccharides Containing a β-d-Glucose Branch Isolated from Squid Cartilage Chondroitin Sulfate E. Biochemistry 2004, 43, 11063–11074. [Google Scholar] [CrossRef] [PubMed]
- Fongmoon, D.; Shetty, A.K.; Basappa; Yamada, S.; Sugiura, M.; Kongtawelert, P.; Sugahara, K. Chondroitinase-mediated Degradation of Rare 3-O-Sulfated Glucuronic Acid in Functional Oversulfated Chondroitin Sulfate K and E. J. Biol. Chem. 2007, 282, 36895–36904. [Google Scholar] [CrossRef] [Green Version]
- Skidmore, M.; Guimond, S.; Dumax-Vorzet, A.; Atrih, A.; Yates, E.; Turnbull, J. High sensitivity separation and detection of heparan sulfate disaccharides. J. Chromatogr. A 2006, 1135, 52–56. [Google Scholar] [CrossRef]
- Dietrich, C.P.; Paiva, J.F.; Castro, R.A.; Chavante, S.F.; Jeske, W.; Fareed, J.; Gorin, P.A.; Mendes, A.; Nader, H.B. Structural features and anticoagulant activities of a novel natural low molecular weight heparin from the shrimp Penaeus brasiliensis. Biochim. Biophys. Acta (BBA) Bioenerg. 1999, 1428, 273–283. [Google Scholar] [CrossRef]
- Brito, A.S.; Cavalcante, R.S.; Palhares, L.C.; Hughes, A.J.; Andrade, G.P.; Yates, E.A.; Nader, H.B.; Lima, M.A.; Chavante, S.F. A non-hemorrhagic hybrid heparin/heparan sulfate with anticoagulant potential. Carbohydr. Polym. 2014, 99, 372–378. [Google Scholar] [CrossRef] [Green Version]
- Dietrich, C.P.; Tersariol, I.L.; Toma, L.; Moraes, C.T.; Porcionatto, M.A.; Oliveira, F.W.D.; Nader, H.B. Structure of heparan sulfate: Identification of variable and constant oligosaccharide domains in eight heparan sulfates of different origins. Cell. Mol. Biol. 1998, 44, 417–429. [Google Scholar] [PubMed]
- Beckman, M.; Holsinger, R.M.D.; Small, D.H. Heparin Activates β-Secretase (BACE1) of Alzheimer’s Disease and Increases Autocatalysis of the Enzyme†. Biochemistry 2006, 45, 6703–6714. [Google Scholar] [CrossRef] [PubMed]
- Micsonai, A.; Wien, F.; Kernya, L.; Lee, Y.-H.; Goto, Y.; Réfrégiers, M.; Kardos, J. Accurate secondary structure prediction and fold recognition for circular dichroism spectroscopy. Proc. Natl. Acad. Sci. USA 2015, 112, E3095–E3103. [Google Scholar] [CrossRef] [PubMed] [Green Version]
- Shimizu, H.; Tosaki, A.; Kaneko, K.; Hisano, T.; Sakurai, T.; Nukina, N. Crystal Structure of an Active Form of BACE1, an Enzyme Responsible for Amyloid β Protein Production. Mol. Cell. Biol. 2008, 28, 3663–3671. [Google Scholar] [CrossRef] [PubMed] [Green Version]
- De Simone, A.; Mancini, F.; Fernàndez, F.R.; Rovero, P.; Bertucci, C.; Andrisano, V. Surface plasmon resonance, fluorescence, and circular dichroism studies for the characterization of the binding of BACE-1 inhibitors. Anal. Bioanal. Chem. 2012, 405, 827–835. [Google Scholar] [CrossRef] [PubMed]
- Lo, M.-C.; Aulabaugh, A.; Jin, G.; Cowling, R.; Bard, J.; Malamas, M.; Ellestad, G. Evaluation of fluorescence-based thermal shift assays for hit identification in drug discovery. Anal. Biochem. 2004, 332, 153–159. [Google Scholar] [CrossRef]
- Hogwood, J.; Naggi, A.; Torri, G.; Page, C.; Rigsby, P.; Mulloy, B.; Gray, E. The effect of increasing the sulfation level of chondroitin sulfate on anticoagulant specific activity and activation of the kinin system. PLoS ONE 2018, 13, e0193482. [Google Scholar] [CrossRef]
- Barsotti, G.; Cupisti, A.; Gervasi, G.B.; Bartoli, C.; Barsotti, M.; Pasquariello, A.; Moriconi, L.; Giovannetti, S. Effects of oral administration of heparan sulphate in the rat remnant kidney model. Nephron 1999, 81, 310–316. [Google Scholar] [CrossRef]
- Henrotin, Y.; Mathy, M.; Sanchez, C.; Lambert, C. Chondroitin sulfate in the treatment of osteoarthritis: From in vitro studies to clinical recommendations. Ther. Adv. Musculoskelet. Dis. 2010, 2, 335–348. [Google Scholar] [CrossRef] [PubMed] [Green Version]
- Zhang, Q.; Na, Z.; Cheng, Y.; Wang, F. Low-molecular-weight chondroitin sulfate attenuated injury by inhibiting oxidative stress in amyloid β-treated SH-SY5Y cells. NeuroReport 2018, 29, 1174–1179. [Google Scholar] [CrossRef] [PubMed]
- Ismail, T.; Kanapathipillai, M. Effect of cellular polyanion mimetics on tau peptide aggregation. J. Pept. Sci. 2018, 24, e3125. [Google Scholar] [CrossRef] [PubMed]
- Ji, D.; Wu, X.; Li, D.; Liuac, P.; Zhanga, S.; Gaoa, D.; Gaoa, F.; Zhanga, M.; Xiaoa, Y. Protective effects of chondroitin sulphate nano-selenium on a mouse model of Alzheimer’s disease. Int. J. Biol. Macromol. 2020, 154, 233–245. [Google Scholar] [CrossRef]
- Niesen, F.H.; Berglund, H.; Vedadi, M. The use of differential scanning fluorimetry to detect ligand interactions that promote protein stability. Nat. Protoc. 2007, 2, 2212–2221. [Google Scholar] [CrossRef] [PubMed]
- Uniewicz, K.A.; Ori, A.; Xu, R.; Ahmed, Y.; Wilkinson, M.C.; Fernig, D.G.; Yates, E.A. Differential Scanning Fluorimetry Measurement of Protein Stability Changes upon Binding to Glycosaminoglycans: A Screening Test for Binding Specificity. Anal. Chem. 2010, 82, 3796–3802. [Google Scholar] [CrossRef] [PubMed]
- Rudd, T.; Skidmore, M.A.; Guimond, S.E.; Holman, J.; Turnbull, J.E.; Lauder, R.M.; Fernig, D.G.; Yates, E. The potential for circular dichroism as an additional facile and sensitive method of monitoring low-molecular-weight heparins and heparinoids. Thromb. Haemost. 2009, 102, 874–878. [Google Scholar]


| Δ-Disaccharide | L. vannamei F4 (%) | L. vannamei F5 (%) | CSC (%) | CSA (%) |
|---|---|---|---|---|
| Δ-UA-GalNAc | 18.3 | 8.8 | 3.7 | 2.4 |
| Δ-UA-GalNAc(6S) | 75.8 | 43.0 | 72.0 | 4.3 |
| Δ-UA-GalNAc(4S) | 48.6 | 3.4 | 18.2 | 93.2 |
| Δ-UA-GalNAc(4S,6S) | N. D | 44.9 | 6.0 | N. D |
| Δ-Disaccharide | L. vannamei F4 (%) | L. vannamei F5 (%) | Heparin (%) | HS (%) |
|---|---|---|---|---|
| Δ-UA-GlcNAc | 14.8 | 9.4 | 8.5 | 37.7 |
| Δ-UA-GlcNS | 9.6 | 7.6 | 3.5 | 17.8 |
| Δ-UA-GlcNAc(6S) | 3.7 | 5.7 | 5.5 | 12.8 |
| Δ-UA(2S)-GlcNAc | 1.1 | 0.8 | 2.8 | 0.4 |
| Δ-UA-GlcNS(6S) | 31.7 | 47.9 | 18.2 | 18.0 |
| Δ-UA(2S)-GlcNS | 23.7 | 12.9 | 7.6 | 6.0 |
| Δ-UA(2S)-GlcNAc(6S) | 0.5 | 0.6 | 2.5 | 0.4 |
| Δ-UA(2S)-GlcNS(6S) | 14.9 | 15.0 | 51.4 | 7.0 |
| GAG | aPTT (μg·mL−1) | PT (μg·mL−1) | BACE1 Inhibitory Activity (μg·mL−1) | Therapeutic Ratio |
|---|---|---|---|---|
| PMIH | 1.66 | 19.53 | 2.43 | 0.68 |
| L.vannamei (F4) | 27.91 | 1276.00 | 4.61 | 6.10 |
| L.vannamei (F5) | 14.60 | 138.80 | 5.93 | 2.46 |
Publisher’s Note: MDPI stays neutral with regard to jurisdictional claims in published maps and institutional affiliations. |
© 2021 by the authors. Licensee MDPI, Basel, Switzerland. This article is an open access article distributed under the terms and conditions of the Creative Commons Attribution (CC BY) license (https://creativecommons.org/licenses/by/4.0/).
Share and Cite
Mycroft-West, C.J.; Devlin, A.J.; Cooper, L.C.; Guimond, S.E.; Procter, P.; Guerrini, M.; Miller, G.J.; Fernig, D.G.; Yates, E.A.; Lima, M.A.; et al. Glycosaminoglycans from Litopenaeus vannamei Inhibit the Alzheimer’s Disease β Secretase, BACE1. Mar. Drugs 2021, 19, 203. https://doi.org/10.3390/md19040203
Mycroft-West CJ, Devlin AJ, Cooper LC, Guimond SE, Procter P, Guerrini M, Miller GJ, Fernig DG, Yates EA, Lima MA, et al. Glycosaminoglycans from Litopenaeus vannamei Inhibit the Alzheimer’s Disease β Secretase, BACE1. Marine Drugs. 2021; 19(4):203. https://doi.org/10.3390/md19040203
Chicago/Turabian StyleMycroft-West, Courtney J., Anthony J. Devlin, Lynsay C. Cooper, Scott E. Guimond, Patricia Procter, Marco Guerrini, Gavin J. Miller, David G. Fernig, Edwin A. Yates, Marcelo A. Lima, and et al. 2021. "Glycosaminoglycans from Litopenaeus vannamei Inhibit the Alzheimer’s Disease β Secretase, BACE1" Marine Drugs 19, no. 4: 203. https://doi.org/10.3390/md19040203