Article

Comprehensive GCMS and LC-MS/MS Metabolite Profiling of Chlorella vulgaris

by
Hamza Ahmed Pantami
1,
Muhammad Safwan Ahamad Bustamam
1,
Soo Yee Lee
1,
Intan Safinar Ismail
1,
Siti Munirah Mohd Faudzi
1,
Masatoshi Nakakuni
2 and
Khozirah Shaari
1,*
1
Laboratory of Natural Products, Institute of Bioscience, Universiti Putra Malaysia, Serdang 43400, Selangor, Malaysia
2
Faculty of Science and Engineering, Soka University, 1-236 Tangi-machi, Hachioji City, Tokyo 192-8577, Japan
*
Author to whom correspondence should be addressed.
Mar. Drugs 2020, 18(7), 367; https://doi.org/10.3390/md18070367
Submission received: 18 March 2020 / Revised: 7 April 2020 / Accepted: 24 April 2020 / Published: 17 July 2020

Abstract

:
The commercial cultivation of microalgae began in the 1960s and Chlorella was one of the first target organisms. The species has long been considered a potential source of renewable energy, an alternative for phytoremediation, and more recently, as a growth and immune stimulant. However, Chlorella vulgaris, which is one of the most studied microalga, has never been comprehensively profiled chemically. In the present study, comprehensive profiling of the Chlorella vulgaris metabolome grown under normal culture conditions was carried out, employing tandem LC-MS/MS to profile the ethanolic extract and GC-MS for fatty acid analysis. The fatty acid profile of C. vulgaris was shown to be rich in omega-6, -7, -9, and -13 fatty acids, with omega-6 being the highest, representing more than sixty percent (>60%) of the total fatty acids. This is a clear indication that this species of Chlorella could serve as a good source of nutrition when incorporated in diets. The profile also showed that the main fatty acid composition was that of C16-C18 (>92%), suggesting that it might be a potential candidate for biodiesel production. LC-MS/MS analysis revealed carotenoid constituents comprising violaxanthin, neoxanthin, lutein, β-carotene, vulgaxanthin I, astaxanthin, and antheraxanthin, along with other pigments such as the chlorophylls. In addition to these, amino acids, vitamins, and simple sugars were also profiled, and through mass spectrometry-based molecular networking, 48 phospholipids were putatively identified.

1. Introduction

Microalgae are fast growing autotrophic organisms. They use light energy and carbon dioxide for the photosynthetic biomass production with higher efficiency compared to plants. There are over 300,000 species of microalgae, of which only around 30,000 (10%) of them have been documented [1]. They live in complex natural habitats, making them able to adapt rapidly in different extreme conditions such as variable salinity, temperature, nutrients and UV–irradiation. Therefore, they can produce a great variety of fascinating metabolites, with novel structures that possess biological activities which are not found in other organisms [2]. Microalgae produce some useful bio-products including β-carotene, astaxanthin, fucoxanthin, docosahexaenoic acid (DHA), eicosapentaenoic acid (EPA), bioactive and functional pigments, natural dyes, polysaccharides, amino acids, vitamins, antioxidants, and many more [3]. Algal research started in the 1950s, starting with studies on Chlorella and Spirulina species. Chlorella has been considered as an alternative in phytoremediation and potential source of renewable energy such as biodiesel due to its high lipid content [4]. Biodiesel production is primarily based on grease raw materials, such as palm oil, canola oil, animal tallow, and soybean oil [5]. However, the prices of these commodities are regulated by international laws which consequently affect biodiesel price, and about 80% of biodiesel costs vary with the price of grease raw materials [6], suggesting that new grease sources are needed in order to reduce the biodiesel price. As a result, there is growing interest in using microalgae for biodiesel production, especially because some produce about 150 times more oil per hectare than soybean [7]. Hence, the use of microalgae to produce biofuels has emerged as a promising alternative to the utilization of fossil fuels.
Single cell protein sources like microalgae have recently gained attention as protein sources for fish feed. In digestion trials with fish, microalgae are mostly fed in their natural form, grown without varying culture conditions or undergoing extraction [8]. Thus, microalgae are applied industrially in aquaculture hatcheries [9]. Normally fishes feed on microalgae as a natural source of nutrition. The microalgae can be safely used as a growth and immune stimulant because of their contents of essential amino acids, minerals, vitamins, chlorophylls, and some substances that have antioxidant capacities [10] like carotenoids and without worrying toxicity. Some microalgae are used mainly as healthy nutrition source in aquaculture in which they play important roles in the development of farming aquatic animals for healthy and profitable aquaculture practices [11,12].
Currently, most diseases of cultured fish are treatable with drugs [13]. However, the drugs used are usually expensive and are more effective in the initial therapy. Furthermore, their application is not entirely safe as they may result in several problems such as development of resistance, accumulation of hazardous residues in the fishes [14] and can also lead to water contamination [15]. In this regard, supplementing fish diet with microalgae as a way to enhance fish immunity and resistance to diseases has gained more attention since microalgae do not pose the problems associated with drugs usage in fish treatment [16]. Algal biomass also contains other valuable components, such as pigments, omega-3 fatty acids, minerals and vitamins, which further increase the nutritional value of algae-based feed [17]. Previous studies have shown that adding microalgae to animal feed resulted in enhancements in growth, physiological activity, feed utilization efficiency [18], stress response, starvation tolerance, disease resistance and carcass quality of the cultured fish [19]. These enhancements are very likely due to the diversity of metabolites present in the microalgae.
Chlorella vulgaris is a green-colored, single-celled, and spherical freshwater microalgae belonging to the family Chlorellaceae of the division Chlorophyta. It is highly valued as a food supplement for both humans and animals due to its high medicinal value derived from its carotenoid, chlorophyll and protein contents [20]. It was reported that the incorporation of C. vulgaris in fish diets increased prophenoloxidase activity, total hemocyte, and resistance against Macrobrachium rosenbergii post larvae and Aeromonas hydrophila infections [21]. In addition, increased growth performance and total fish protein were both observed by using fish feed supplemented with Chlorella [21]. Past research also reported that C. vulgaris is a potential source of renewable energy due to its high lipid content. However, the total lipid content is dependent on culture conditions [22]. In addition, studies using FTIR indicated that polyol and amide constituents in C. vulgaris played critical role in synthesizing palladium nanoparticles by reducing the metal ions in an eco-friendly and non-toxic process [23]. Moreover, the proven tolerance limits of C. vulgaris against various heavy metals and metalloids, detoxifying water supply contaminated with As+3 [24], are significant advantages of using C. vulgaris over other microalgal strains.
Previous studies on C. vulgaris have reported an abundance of metabolites, including lipids, fatty acids, amino acids, simple sugars, and few carotenoids. However, there is limited mass spectroscopic data on most of the metabolites of the microalgae species in general [25]. Various studies were conducted on C. vulgaris and other microalgae strains using GC-MS spectrometry and UV-Vis spectroscopy, while very few involved LC-MS spectrometry. However, all these studies were focused on a specific class of metabolites (usually carotenoids or lipids), obtained as a result of optimizing growth medium formulation or via mutagenesis, without comprehensively profiling the metabolites that occur as a result of normal media formulation. Usually, normal media formulations like the bold Basal’s media (BBM) (chemical composition) imitate the favorable natural conditions in which microalgae grow via metamorphosis. In addition, most of the researches also reported the unavoidable depletion of other metabolites in the course of enhancing the routes for the optimal production of the targeted metabolites of their research objective(s). For instance, C. vulgaris mutant strain was reported to have displayed superior lipid productivity with a minor PUFA level [26]. This is the same with total protein content of the wild species which solely depends on culturing conditions [27]. Under NO3 deficit, the production of photosynthetic pigments is drastically reduced with a huge decline of antioxidant activities particularly in C. vulgaris [28]. On the other hand, replete NO3 led to chlorophyll pigments and amino acid accumulation, while NO3 limitation produced a very low amino acid content but was very effective at increasing the generation of neutral lipid content [29,30]. Furthermore, most of the identification carried out on the carotenoids and chlorophylls was conducted on dietary supplements containing C. vulgaris. However, there is no information available regarding the comprehensive metabolite profile of C. vulgaris cultured under normal growing conditions and formulation which is ideal for incorporation into diets. It is important to note that the metabolite composition of a microalgae may contribute in one way or another to its biological effect [31]. Thus, having an appreciably good knowledge of the diversity in metabolite composition is a prerequisite to understanding their correlation to the nutritional and pharmacological effects of the microalgae. Therefore, it is equally important to comprehensively profile microalgae grown under normal conditions and formulations in order to gain a better insight into the C. vulgaris metabolome, which is the aim of the present study.

2. Results and Discussion

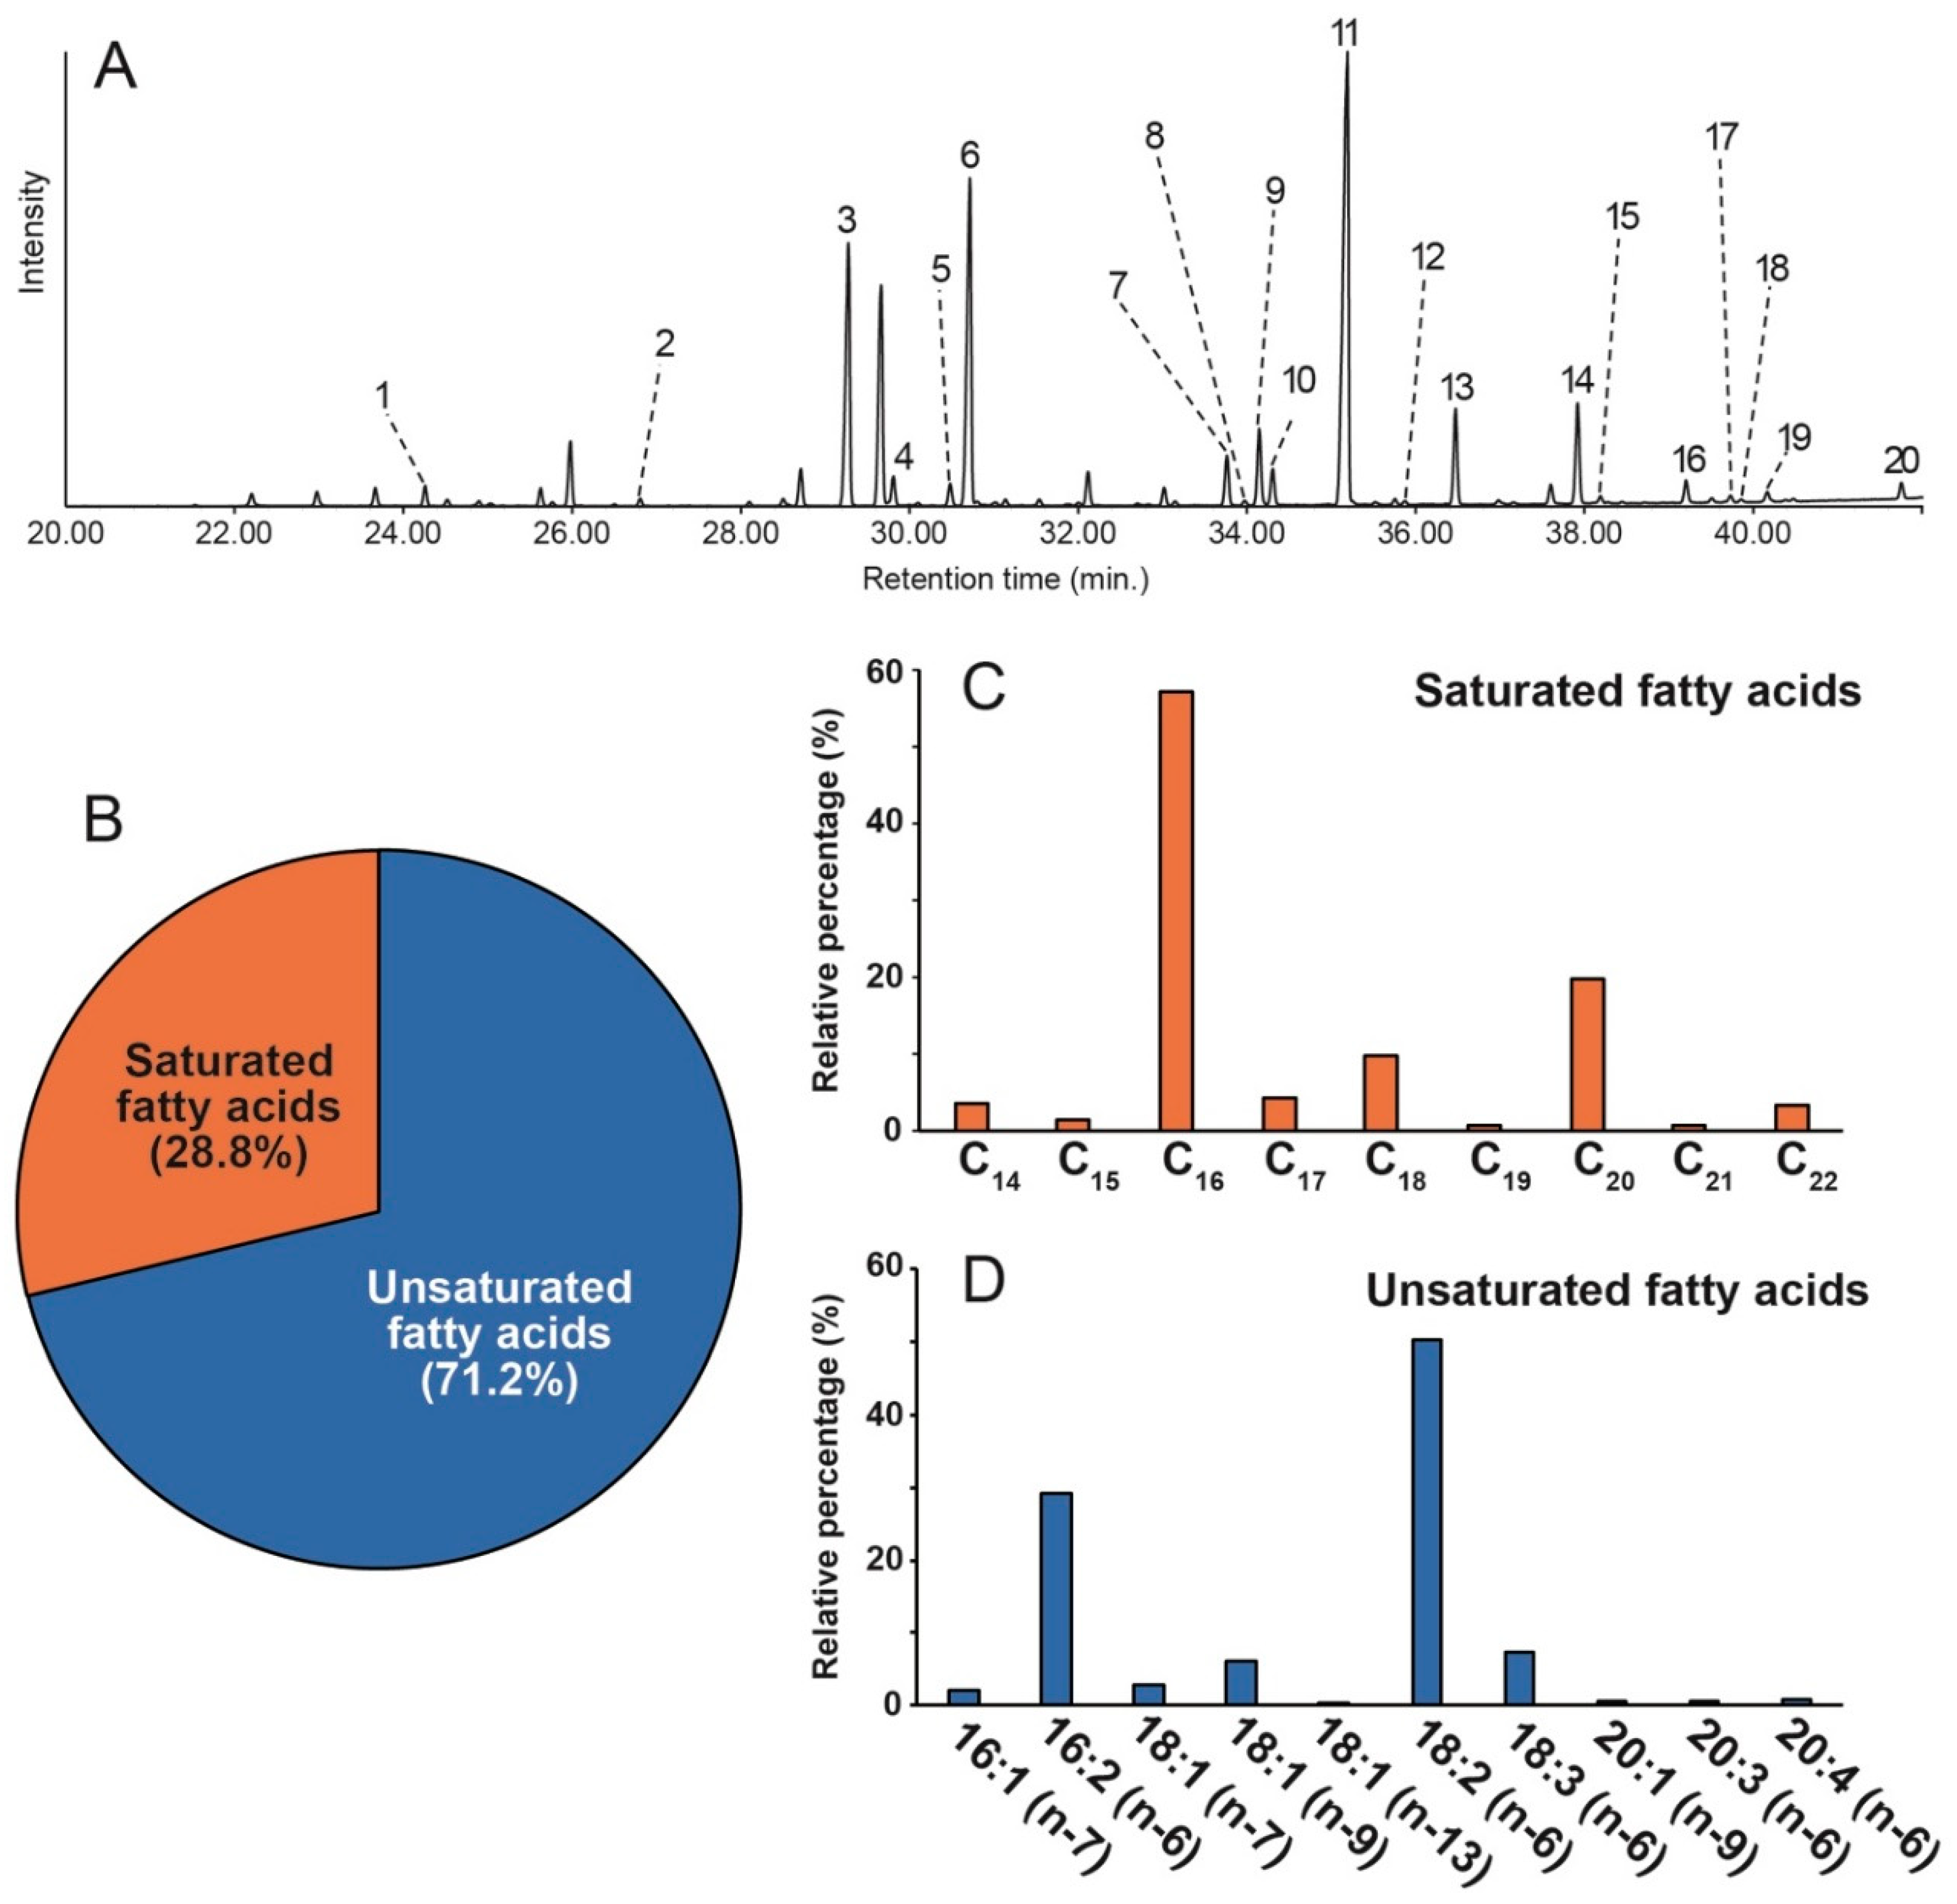
2.1. Identification of Fatty Acids in Chlorella vulgaris

Extracted fatty acids from C. vulgaris were derivatized to fatty acid methyl esters (FAMEs) via reaction with acetyl chloride [32] and subjected to GC-MS analysis (Figure 1A). From the C. vulgaris, nine saturated fatty acids ranging from C14 to C22 were detected, accounting for a percentage of 27.8% of the total fatty acids (Figure 1B), while the unsaturated fatty acids accounted for 71.2% of the total fatty acids. The compositional ratio of fatty acids was calculated from peak areas which were integrated in total ion chromatogram as shown in Figure 1.
The fatty acid profile of C. vulgaris is shown to be rich in omega-6, -7, -9, and -13 with omega-6 being the major fatty acid, representing more than sixty percent (>60%) of the total fatty acids (Figure 1D). This is a clear indication that this Chlorella species could serve as a good source of nutrition when incorporated in diets. The profile also showed that the fatty acid composition is mostly made up of C16-C18 (>92%) fatty acid (Figure 1C,D) which further supports C. vulgaris as a potential candidate for biodiesel production. These results are in agreement with the recently published work of Fernández-Linares et al. [33].

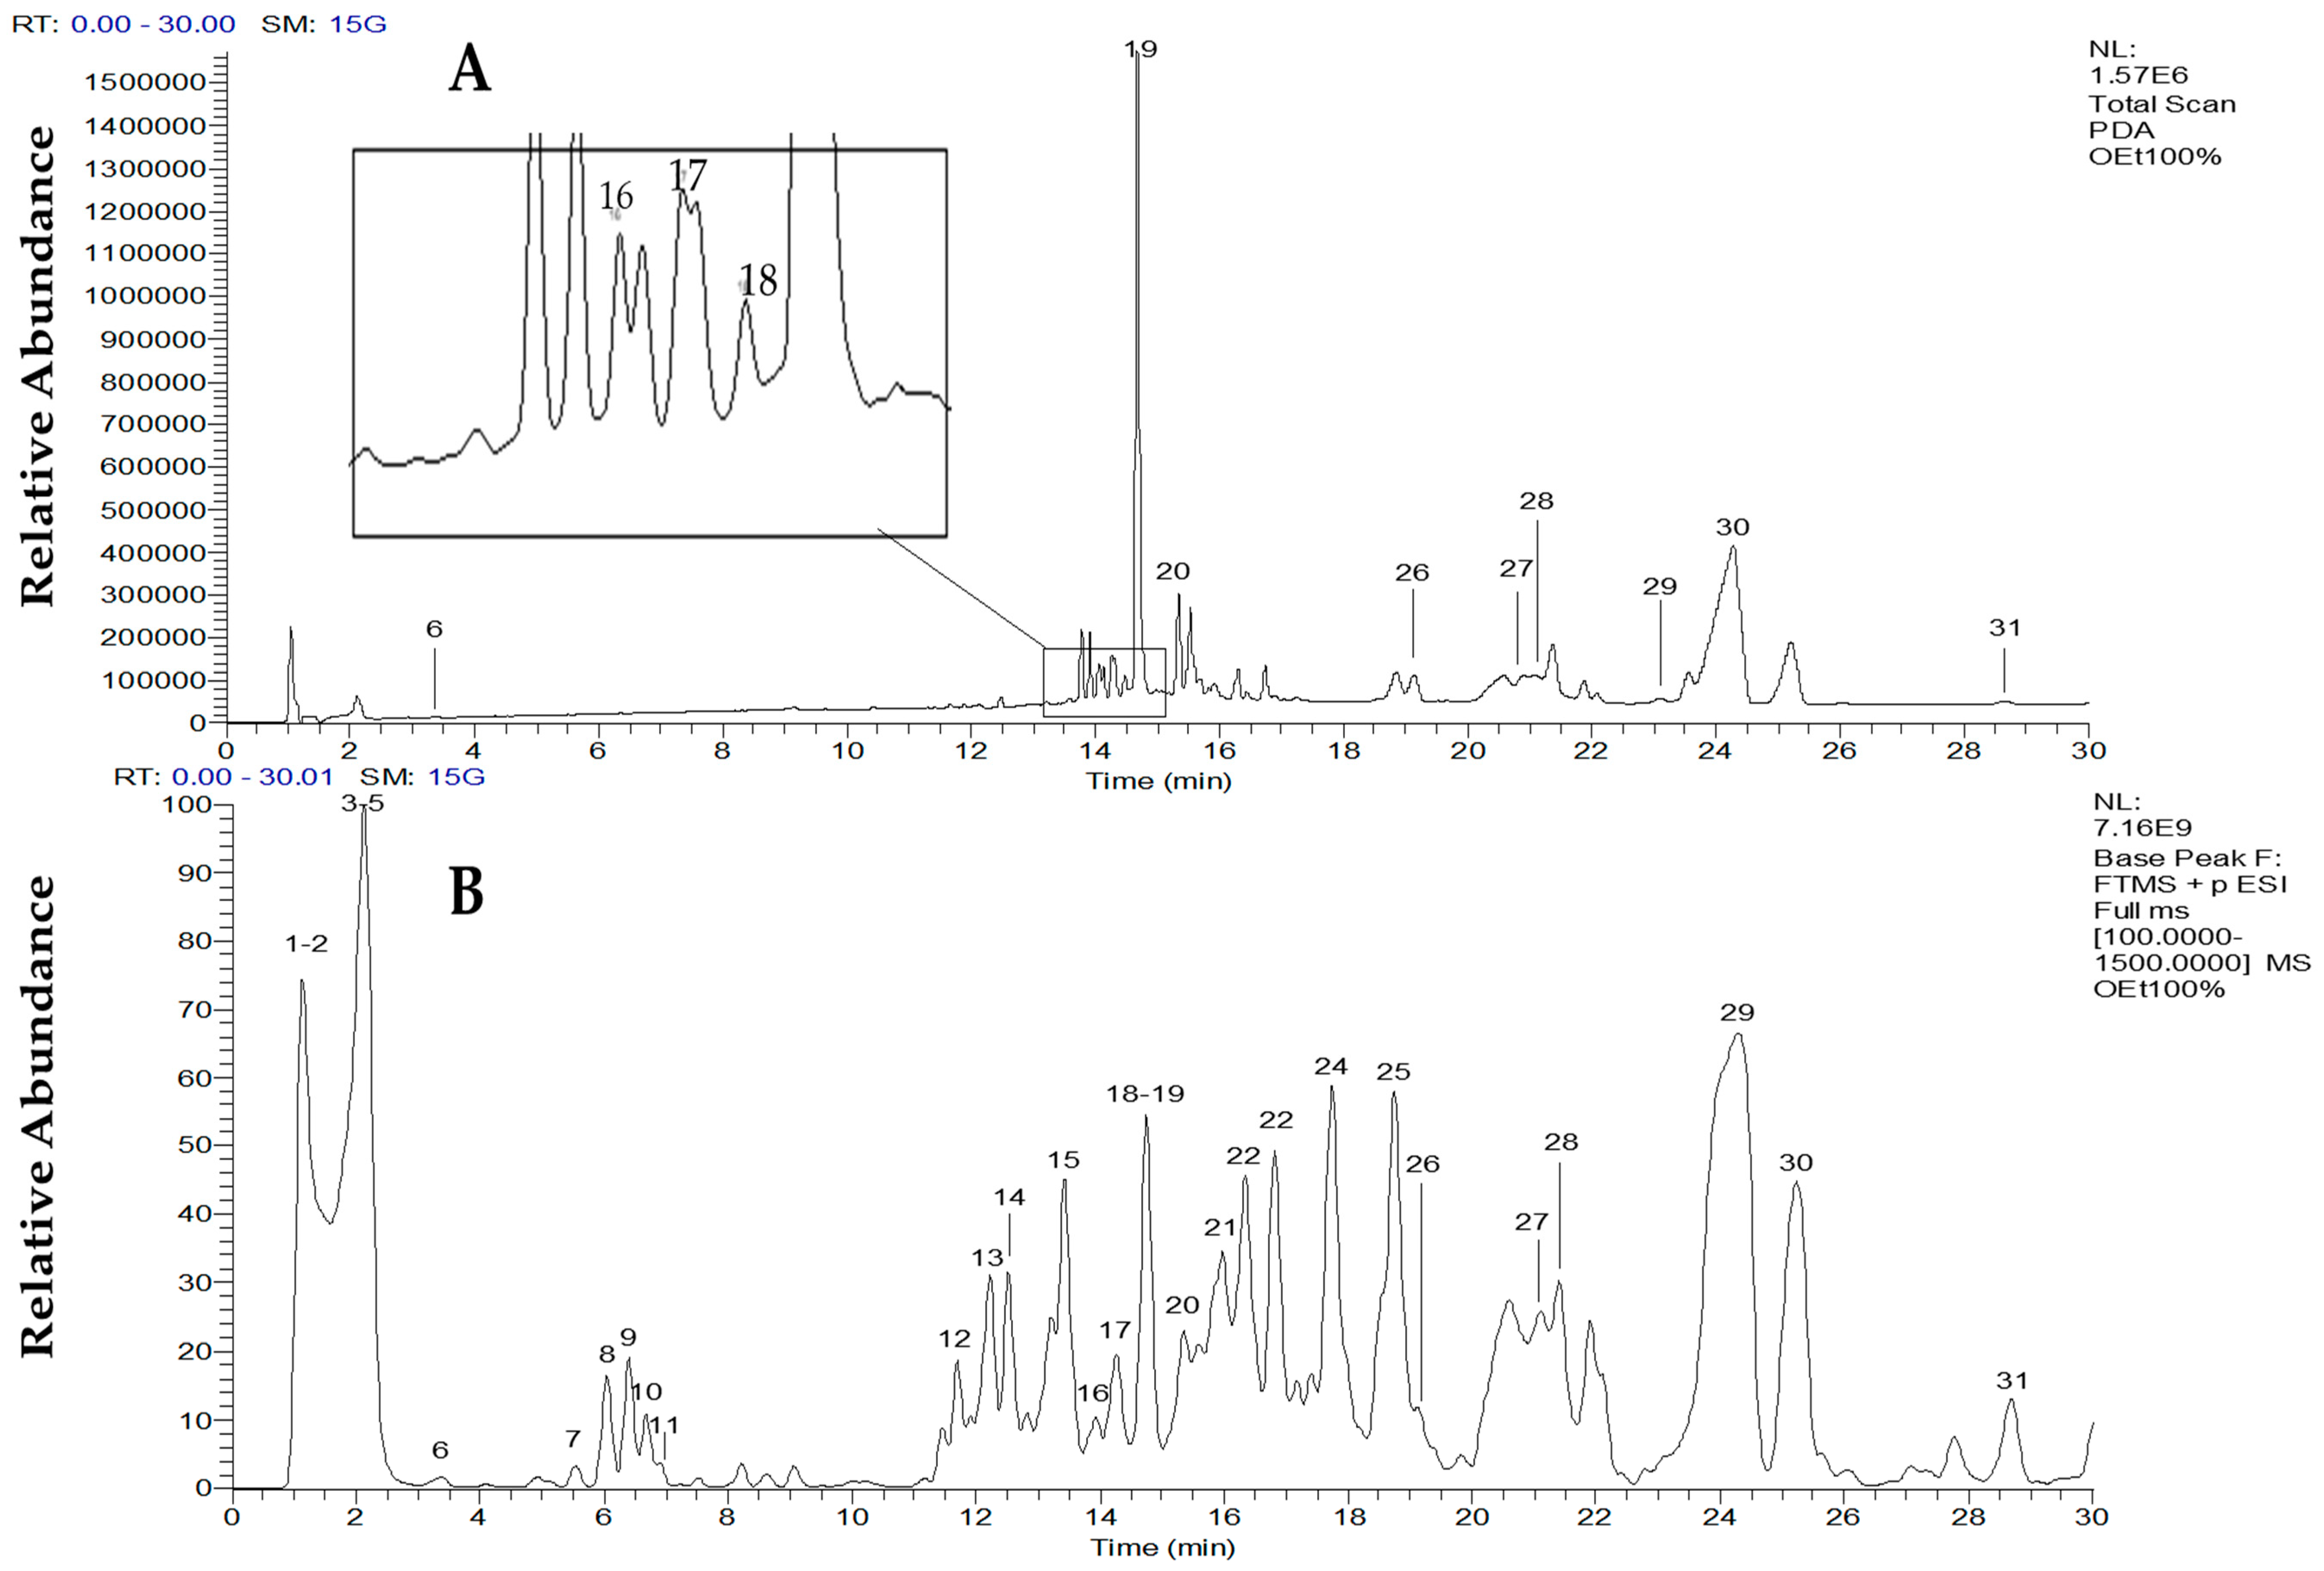
2.2. Metabolite Profiling of Chlorella vulgaris Ethanolic Extract

The ethanolic extract of C. vulgaris was analyzed by LC-MS/MS. The total scan PDA chromatogram and the total ion chromatogram of the extract are shown in Figure 2A,B, respectively. The observed peaks indicating the different metabolites present in the sample were labeled with numbers. A general idea of the compound classes contained in the extract was first obtained from the UV absorptions of compound peaks observed in the total scan PDA chromatograms (Figure 2A). Most of the UV-absorbing compounds detected by the photodiode array (PDA) detector showed maximum absorptions in the range of 200–300 nm. Nevertheless, carotenoids and chlorophyll pigments show characteristic absorption range of 200–400 nm and above, as a fingerprint that supports their identification. The identities of the metabolites were then further elucidated based on their molecular masses and mass fragmentation patterns (Supplementary Figures S1–S5). In some instances where the identity of a peak was masked by overlaps with other peaks of similar retention times, the extracted ion chromatogram (EIC) was obtained for metabolite identification, as in the case of astaxanthin (supplementary materials Figure S6). Although the LC-MS analysis was run in switching mode, almost all the compounds in the sample were better ionized in the positive mode. Therefore, identification of the compounds was conducted based on their full MS and MS/MS spectra obtained in positive ion mode.

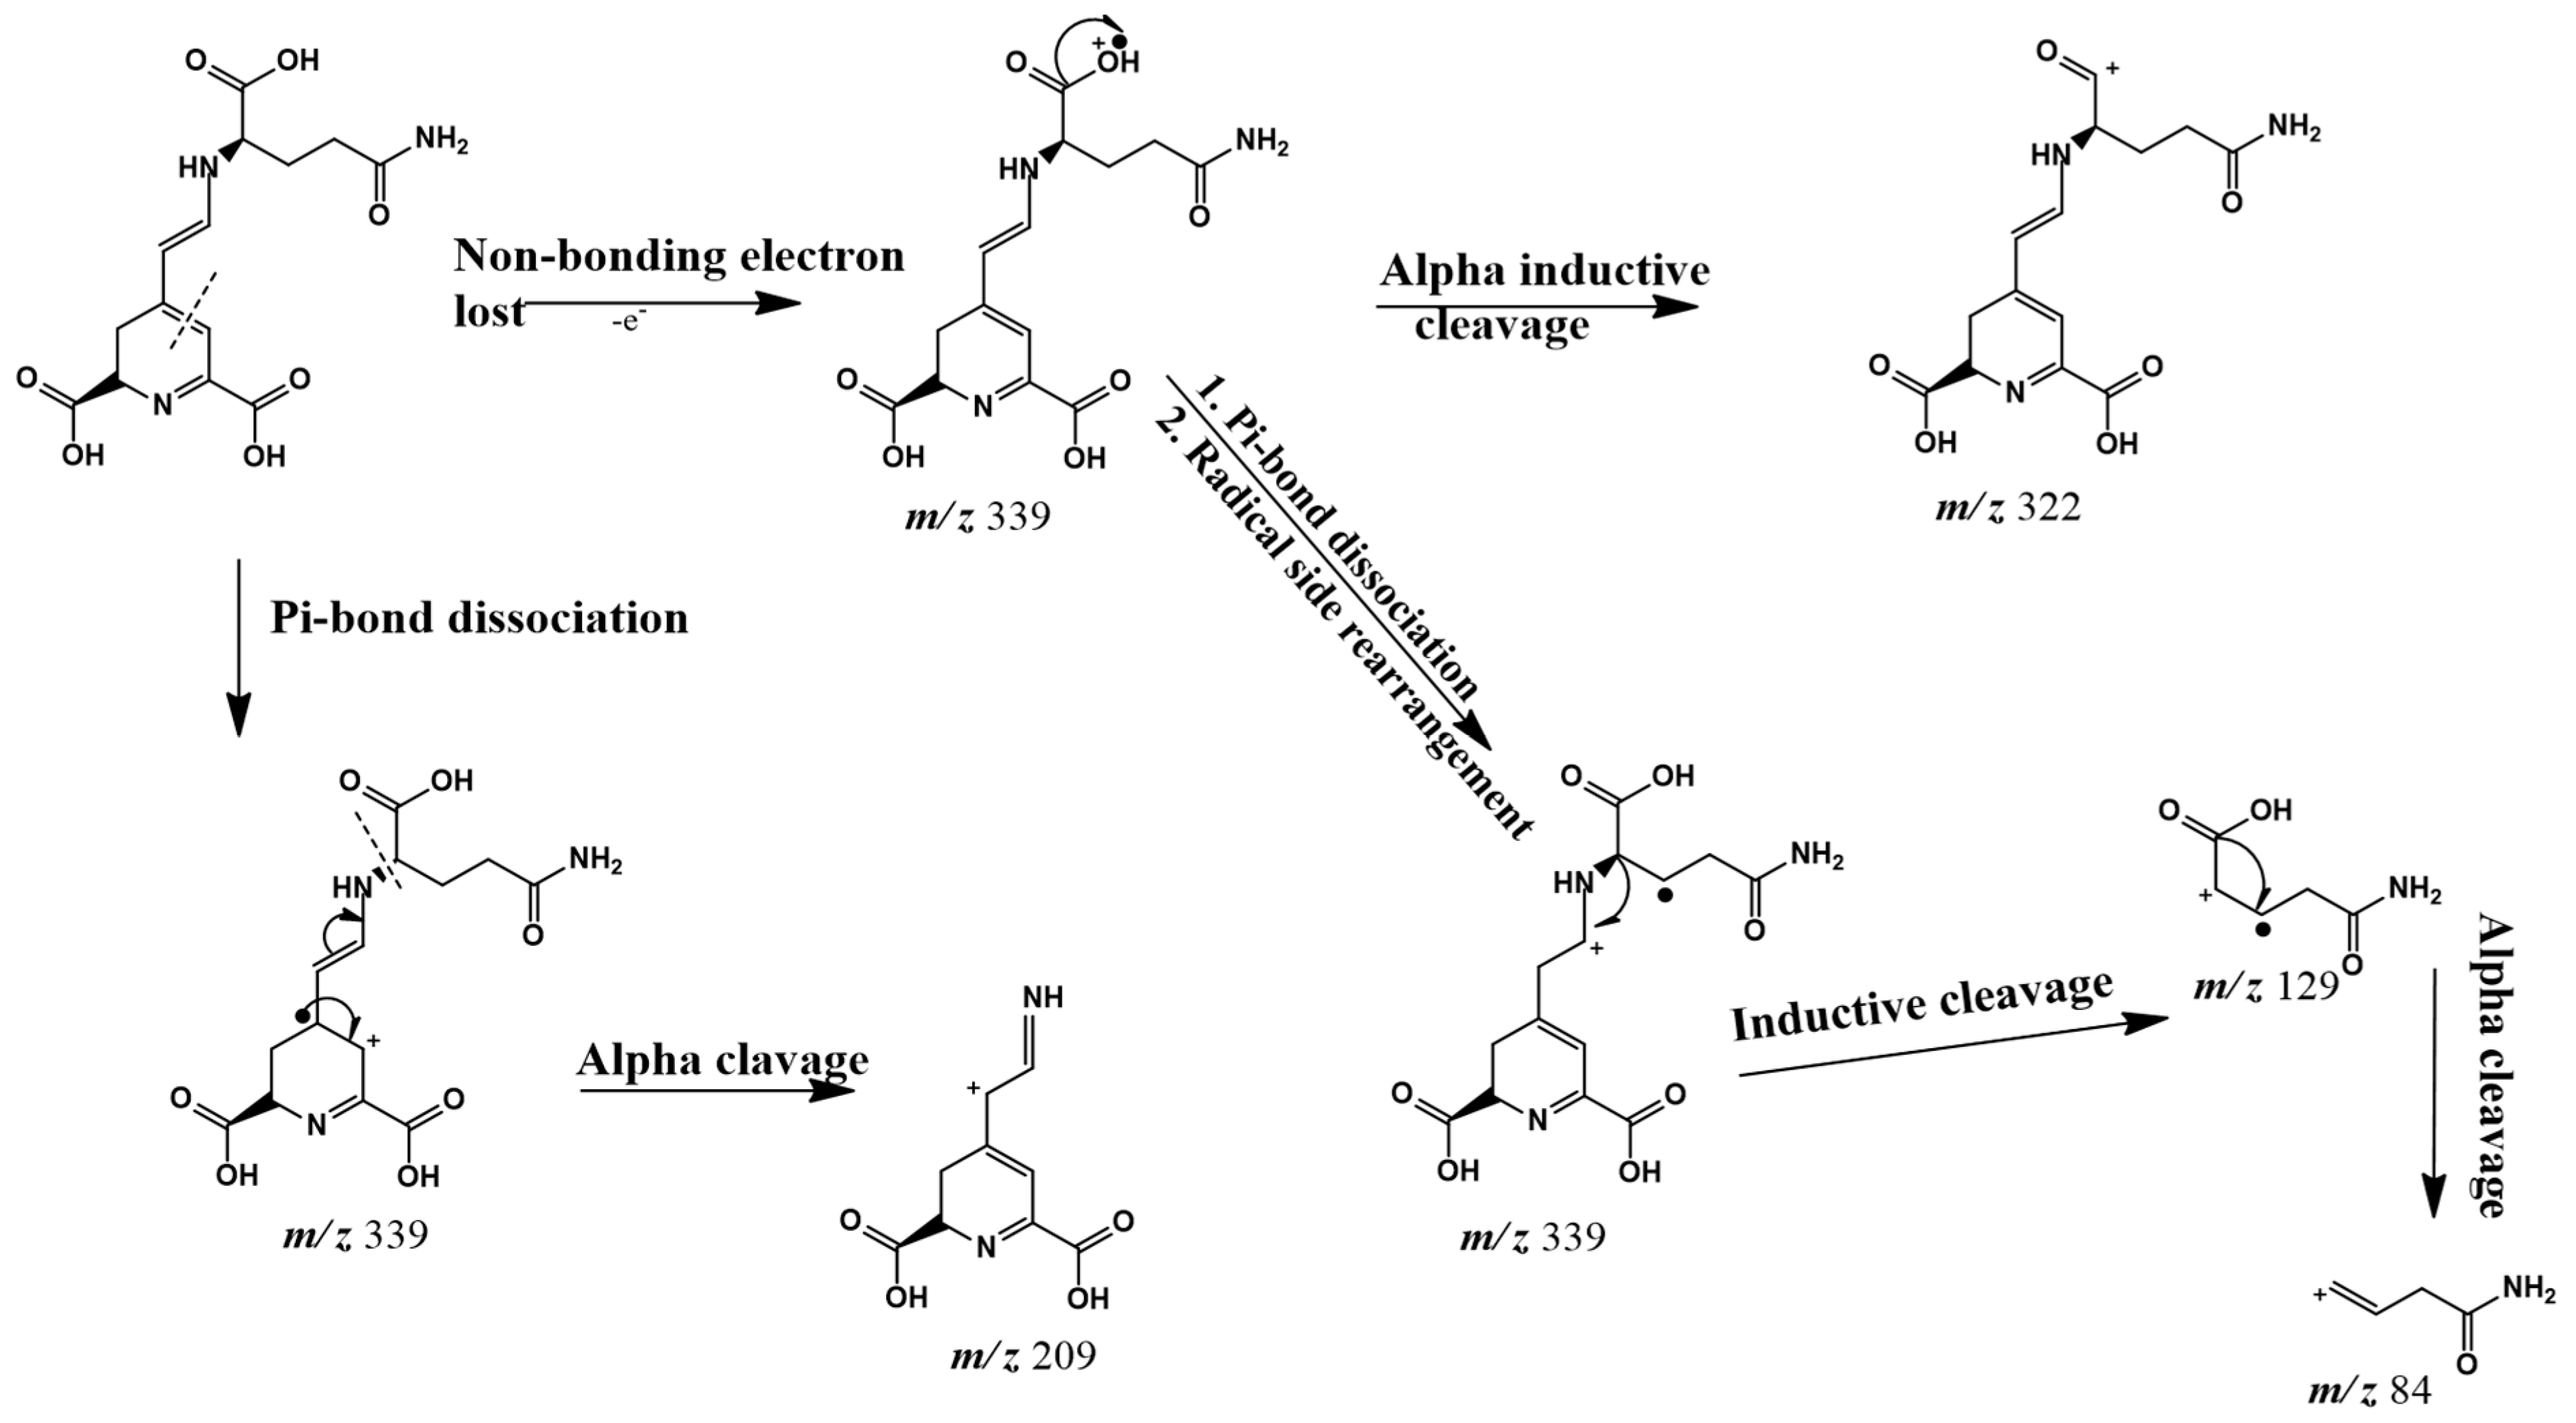
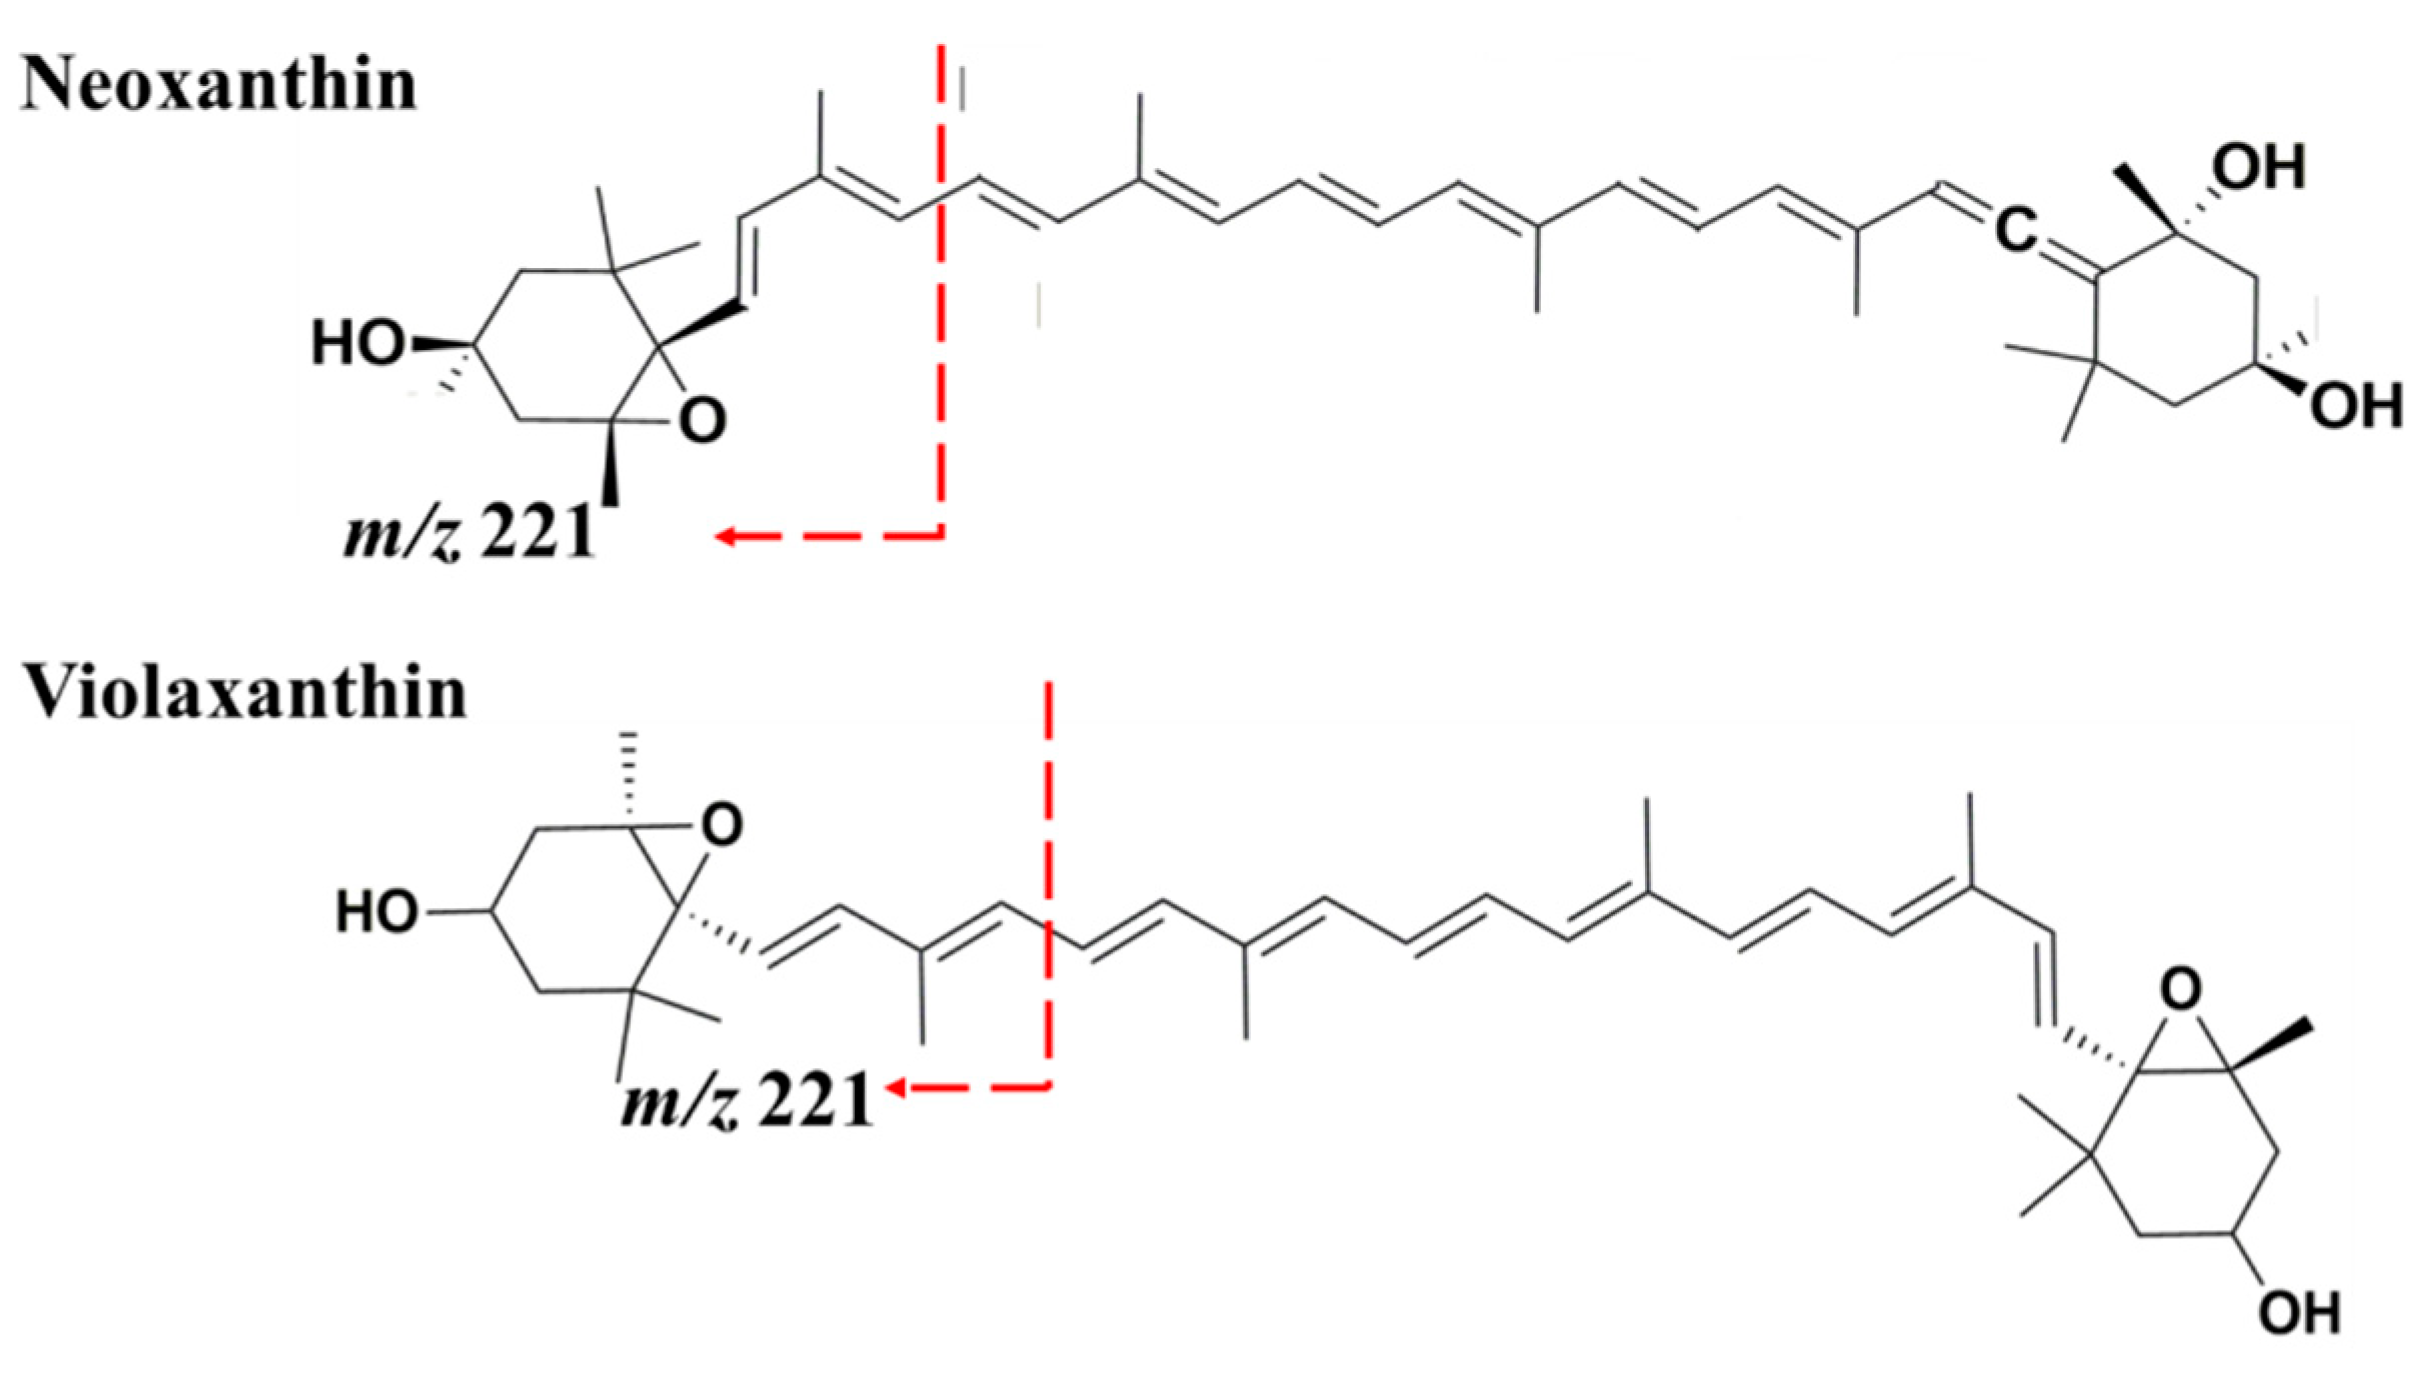
2.2.1. Identification of Carotenoids

The carotenoids were easily recognizable based on their typical λmax values of 410, 430, 440 and 460 nm [33,34,35,36,37,38,39], as shown in Table 2. The mass fragmentation pathway for carotenoid peaks was very useful in assigning the mass fragments and greatly aided their identification.
Peak 6 showed characteristics which were consistent with that of vulgaxanthin I, with a parent ion at m/z 340 [M + H]+ (observed = m/z 340.2592 and exact = m/z 340.1139, error m/z 0.1453). The peak occurred at tR 3.98 giving MS/MS fragment ions at m/z 322 (a loss of 18 amu due to the elimination of water from the protonated parent ion), m/z 209 (product of α-cleavage of the pi-bond dissociated parent ion that undergoes electron loss), and m/z 84 (α-cleavage at the amide terminal of the molecule). A possible fragmentation pathway for vulgaxanthin I is as shown in Figure 3. The proposed fragment ions with m/z 339 and m/z 129, precursors to the fragment ions at m/z 209 and m/z 84, respectively, however were not detected by the MS detector. This could happen as a result of its rapid dissociation due to instability of the ions. Vulgaxanthin I has been previously identified in the higher plant Berberis vulgaris [40]. Although it has been reported before in brown algae Chlorococcum humicola [41], this is the first report of its occurrence in C. vulgaris.
Peaks 16 and 17 with tR 14.35 and 14.52 were attributed to neoxanthin and violaxanthin, respectively. Both peaks showed similar parent ions at m/z 601.4 [M + H]+ and characteristic MS/MS fragment ions at m/z 583.4 [M + H − 18]+ due to loss of water molecule from the protonated parent ions. Both peaks also gave fragment ions at m/z 491.4 [M + H − 92 − 18]+, produced from a loss of C7H8 (92 amu: probably toluene) fragment along with one water molecule, and m/z 221.2 produced as a result of α-cleavage at one end of the molecules which occurred after a radical side rearrangement that precede the pi-bond dissociation of the parent ion (Figure 4). Two additional MS/MS fragments were identified with violaxanthin at very low intensities, where the fragment m/z 565.4 [M + H − 18 − 18]+ corresponding to the loss of two successive water molecules and m/z 509.4 [M + H − 92]+, which is unique to violaxanthin [41], corresponds to the loss of a lone C7H8 fragment. These two peaks share the same parent ion and some MS/MS product ions, the differences in some of their fragmentation pattern suggest that they are isomers. These fragmentation results agree with previously published results [42]. Fragmentation pathways proposed for neoxanthin and violaxanthin are provided in Supplementary Figures S1 and S2, respectively.
Peak 18 with tR 14.55–14.60 was attributed to antheraxanthin. This peak showed a parent ion at m/z 585 [M + H]+ and characteristic MS/MS fragments at m/z 567.4 [M + H − 18]+ due to loss of 18 amu corresponding to loss of water molecule, 475.4 [M + H − 92 − 18]+ corresponding to loss of C7H8 fragment along with a water molecule. The fragment m/z 221.1, was also produced with 100% intensity as expected [42]. Peak 20 at tR 15.35–15.36, having a parent ion m/z 569.4 [M + H]+, exhibited two fragment ions with m/z 551.4 [M + H − 18]+ which occurred as a result of loss of one water molecule, and m/z 533.4 [M + H − 18 − 18]+ due to loss of two water molecules. This is characteristic of lutein and the absence of the fragment m/z 495, which would have resulted in further loss of 56 amu from the first fragment, suggested that the lutein identified in this sample is the isomer 15-cis-lutein [33]. Lutein fragmentation pathway was presented in Supplementary Figure S3. Peak 29 at tR 23.15–23.16 with a parent ion m/z 536.4 [M + H]+ and MS/MS fragment ions at m/z 444.4 [M + H − 92]+ and m/z 321.3 was attributed to β-carotene [42]. The fragmentation pathway for β-carotene is provided in Supplementary Figure S4.
Peak number 26, which was not clearly seen in Figure 2B due to overlap, was identified from its EIC (Supplementary Figure S6) which showed a peak at tR 19.21 with parent ion at m/z 596.6 [M + H]+. The parent ion further dissociated to give fragment ions at m/z 578.6 [M + H − 18]+ and 560.6 [M + H − 18 − 18]+ corresponding to losses of 18 amu and 36 amu for successive loss of one and two water molecules, respectively. Based on this information, peak 26 was identified as astaxanthin [33]. The fragmentation pathway for astaxanthin is shown in Supplementary Figure S5. The carotenoids detected in this work agree with recently published data [43,44].

2.2.2. Identification of Chlorophyll Pigments

The chlorophylls are macromolecules with highly conjugated systems that do not always give MS/MS fragments data under the range of collision energy usually set for other molecules of lower masses. Hence their identification is best conducted with the help of their UV spectrum. Chlorophyll pigments (peaks 19 and 27–31) showed characteristic λmax values in the range between 210 and 530 nm [35], as tabulated in Table 3, which also lists their respective parent ion masses. Compound identification made use of the mass fragmentation data provided in supplementary material (Supplementary Figure S7).
Peak 19, the most intense peak in the UV PDA, at tR 14.68 with characteristic λmax absorptions of 268, 474 and 536 nm was identified as pheophorbide-a based on the parent ion at m/z 593 [M + H]+ in which correspond to its MS base peak at tR 14.74. Peak 27 is pheophytin-b with parent ion at m/z 885 [M + H]+ at MS tR 21.13 (peak 27) gives a UV peak at tR 21.08 with absorption band of λmax 222, 436, 528 nm. Pheophorbide-b with parent ion m/z [M + H]+ 607 was assigned to peak 28. This peak was found under the MS tR 21.25 which corresponds to the UV PDA observed peak at tR 20.90 that show an absorption band of λmax 222, 436 and 528 nm. Pheophytin-a having an MS parent ion m/z 871 [M + H]+ at tR 24.30 (peak 30) also shows a UV peak at tR 24.28 with absorption band of λmax 408, 536 nm, corresponds with previously reported data [34]. The peak with tR 28.70 (peak 31) gives a mass peak of m/z 894 [M + H]+corresponding to a UV peak at tR 28.66 having an absorption of λmax 410, 538 nm, is attributed to chlorophyll a. The detected chlorophylic pigments agree with recently published data [44,45,46].

2.2.3. Identification of Amino Acids, Fatty Acids, Lipids and Fatty Acyls

Table 4 shows peaks 2, 3, 5, 7 and 9 for the amino acids present in C. vulgaris. At tR 1.44 leucine (peak 2) was observed to fragment into m/z 115, 86, 72 and 57. The characteristic MS/MS fragmentation pattern for peak 3 at tR 2.29 with fragment ions m/z 165, 120, 103, 93, 91, 79, was attributable to phenylalanine. Peak 5 at tR 2.72 with m/z 205 and 100% relative abundance was identified as tryptophan based on the fragment ions m/z 146, 144, 143, 142, 132, 118, 91, and 74. Lysophosphatidylethanolamine (Lyso-PE) was assigned to peak 7 at tR 5.44 with fragment ion ions m/z 548, 452, 322, 209, 157, 114, 97, and 57. Disopyramide was the peak at tR 6.30 with fragment ions m/z 322, 306, 212, 196, 114, and 74. Table 4 also shows the identified fatty acids, fatty acyls and lipids.
The identified amino acids, fatty acids and some of the lipids via LCMS agree with recently published results [47,48].

2.2.4. Identification of Vitamins

Vitamin B-3 (nicotinic acid) was identified by fragment ions m/z 123, 80, 78, 53, and 45 which occurred due to peak 1 at tR 1.33. Peak 4 at tR 2.54 with characteristic fragmentation pattern m/z 142, 116, 103, 90, 87, 86, 73, 72, 70, 57, and 55 is attributed to vitamin B-5 (pantothenic acid).

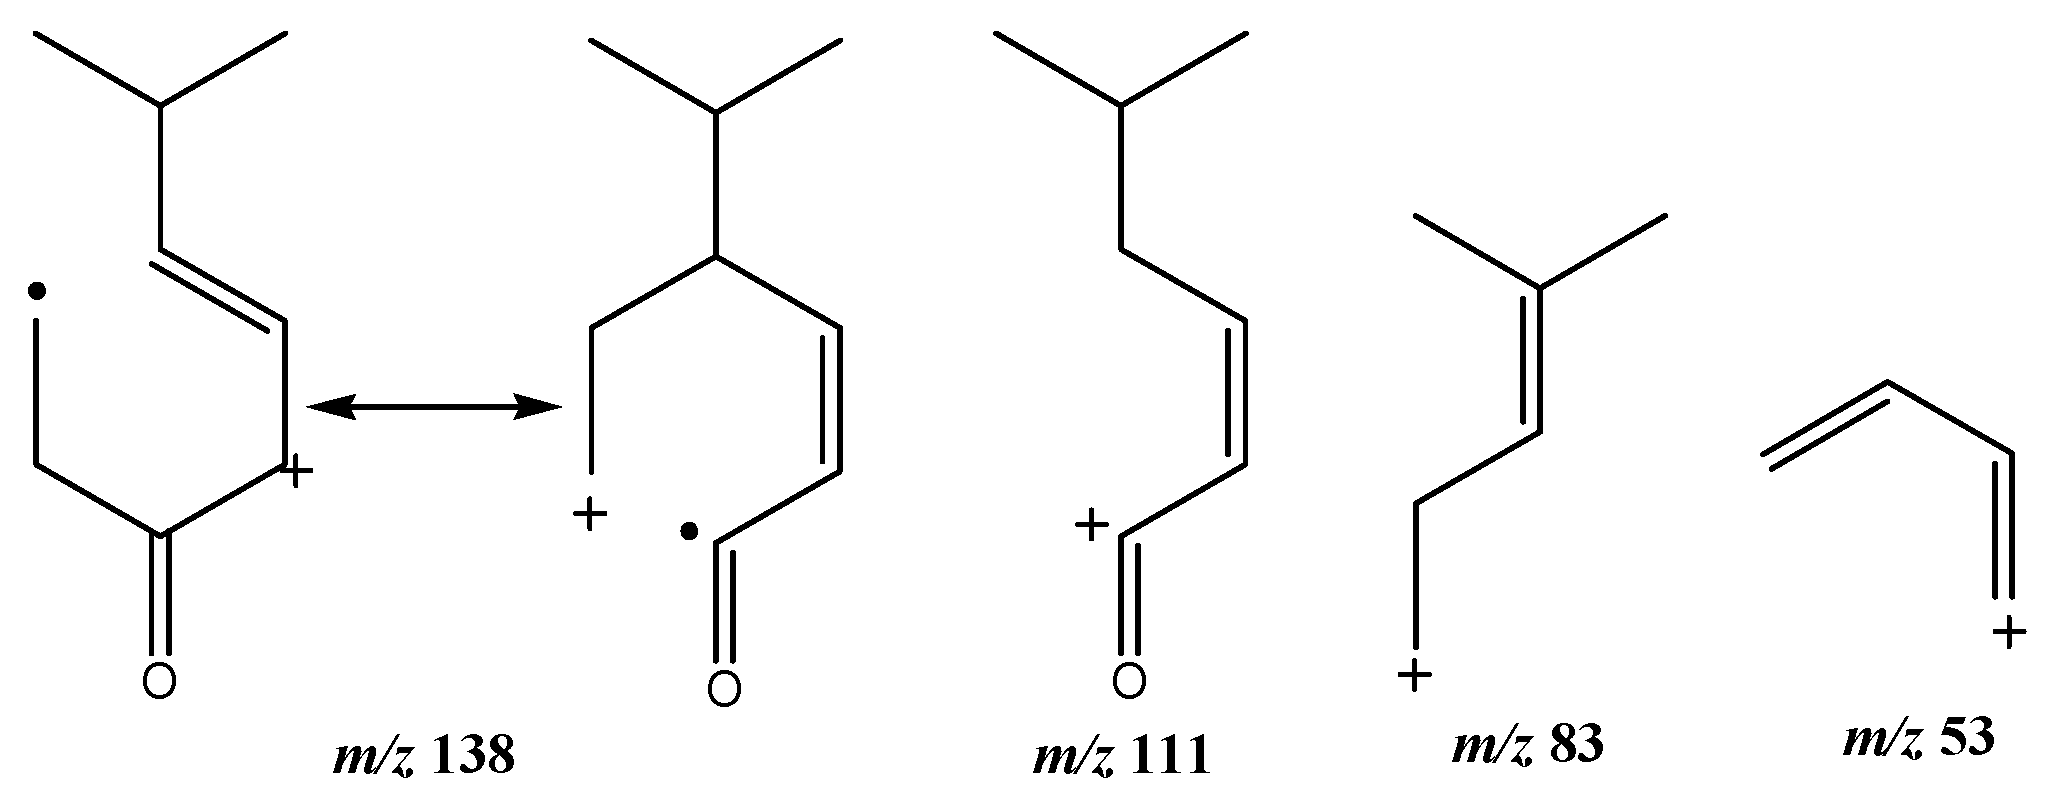
2.2.5. Identification of Other Compounds

The identification of simple sugars in the complex crude ethanol fraction of C. vulgaris was not very successful and hence very few were identified (Table 6). This may be attributed to many factors including the probability of many adduct formations which were not completely identified due to the large error values calculated in relation to the literature. (R)-cryptone, input m/z 139.1228 and exact m/z 139.1117 therefore error m/z 0.0111, is known to be found in the higher plant Eucalyptus bosistoana [49] and has never been reported before as a component metabolite of C. vulgaris in the literature. Hence further research is ongoing to establish more facts regarding its identification in C. vulgaris. The proposed mass fragment ions resulting from fragmentation of R-cryptone are shown in Figure 5. The detected simple sugars agree with previously published results [46].

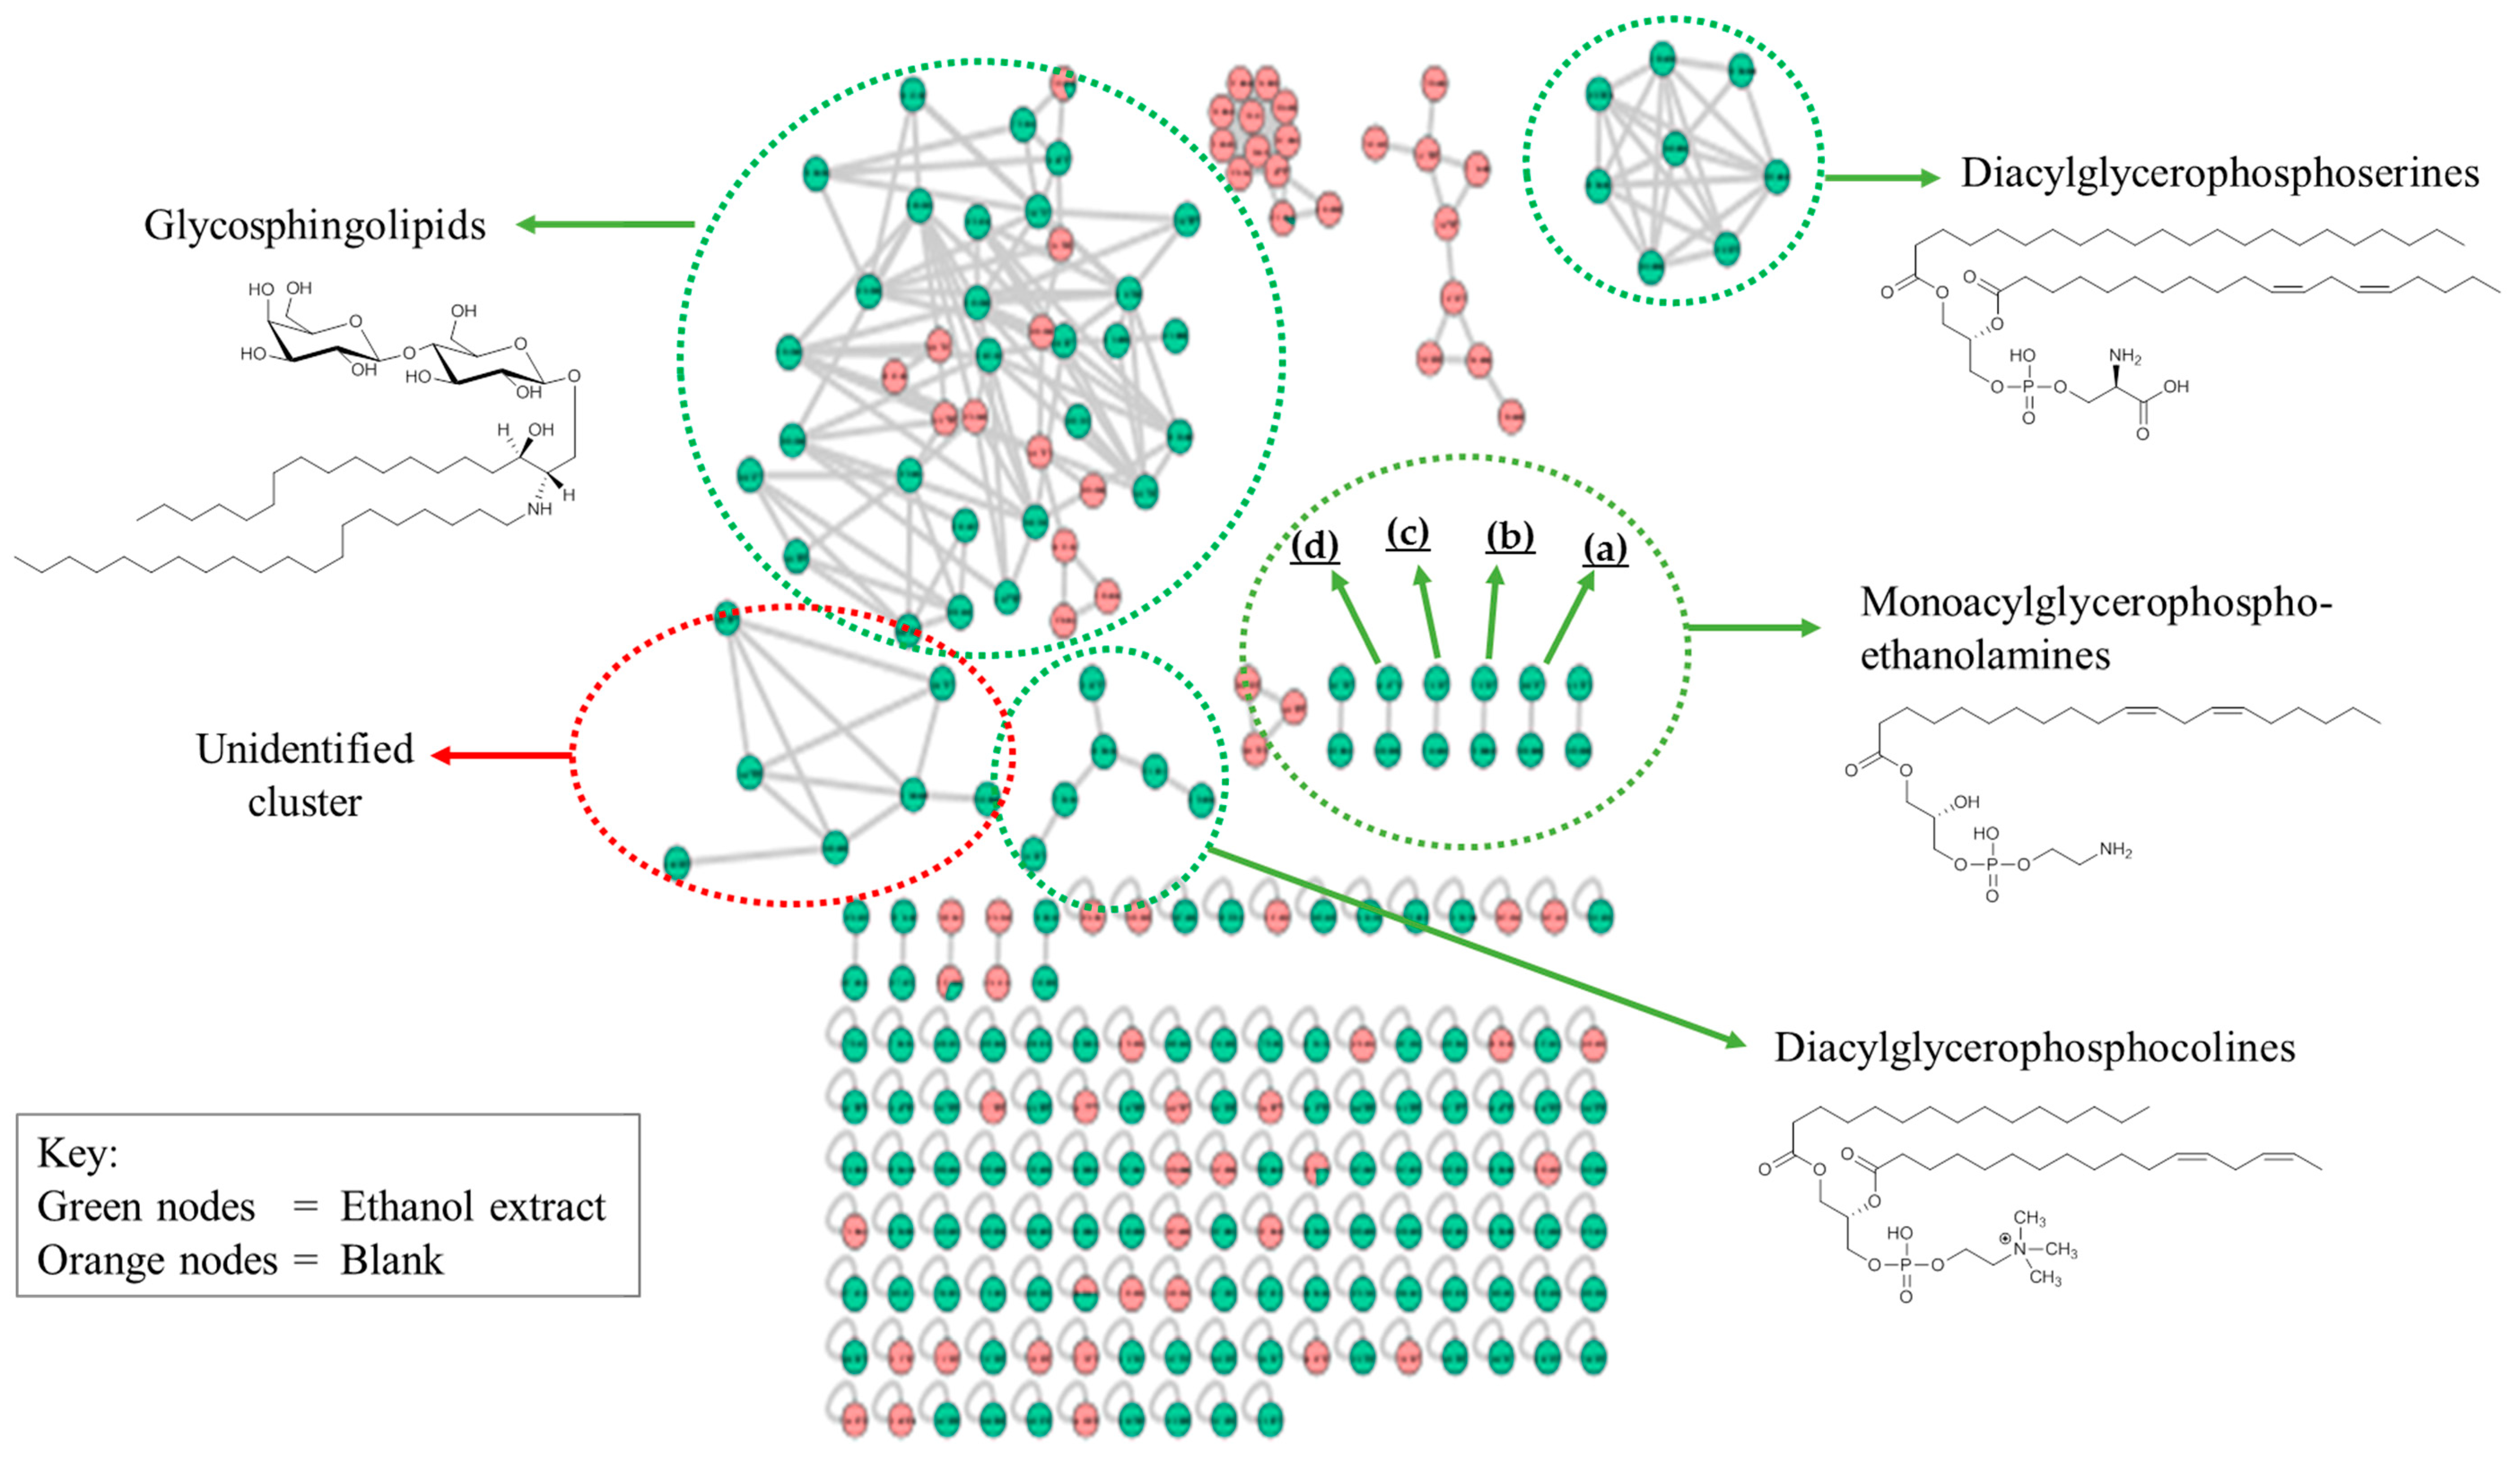
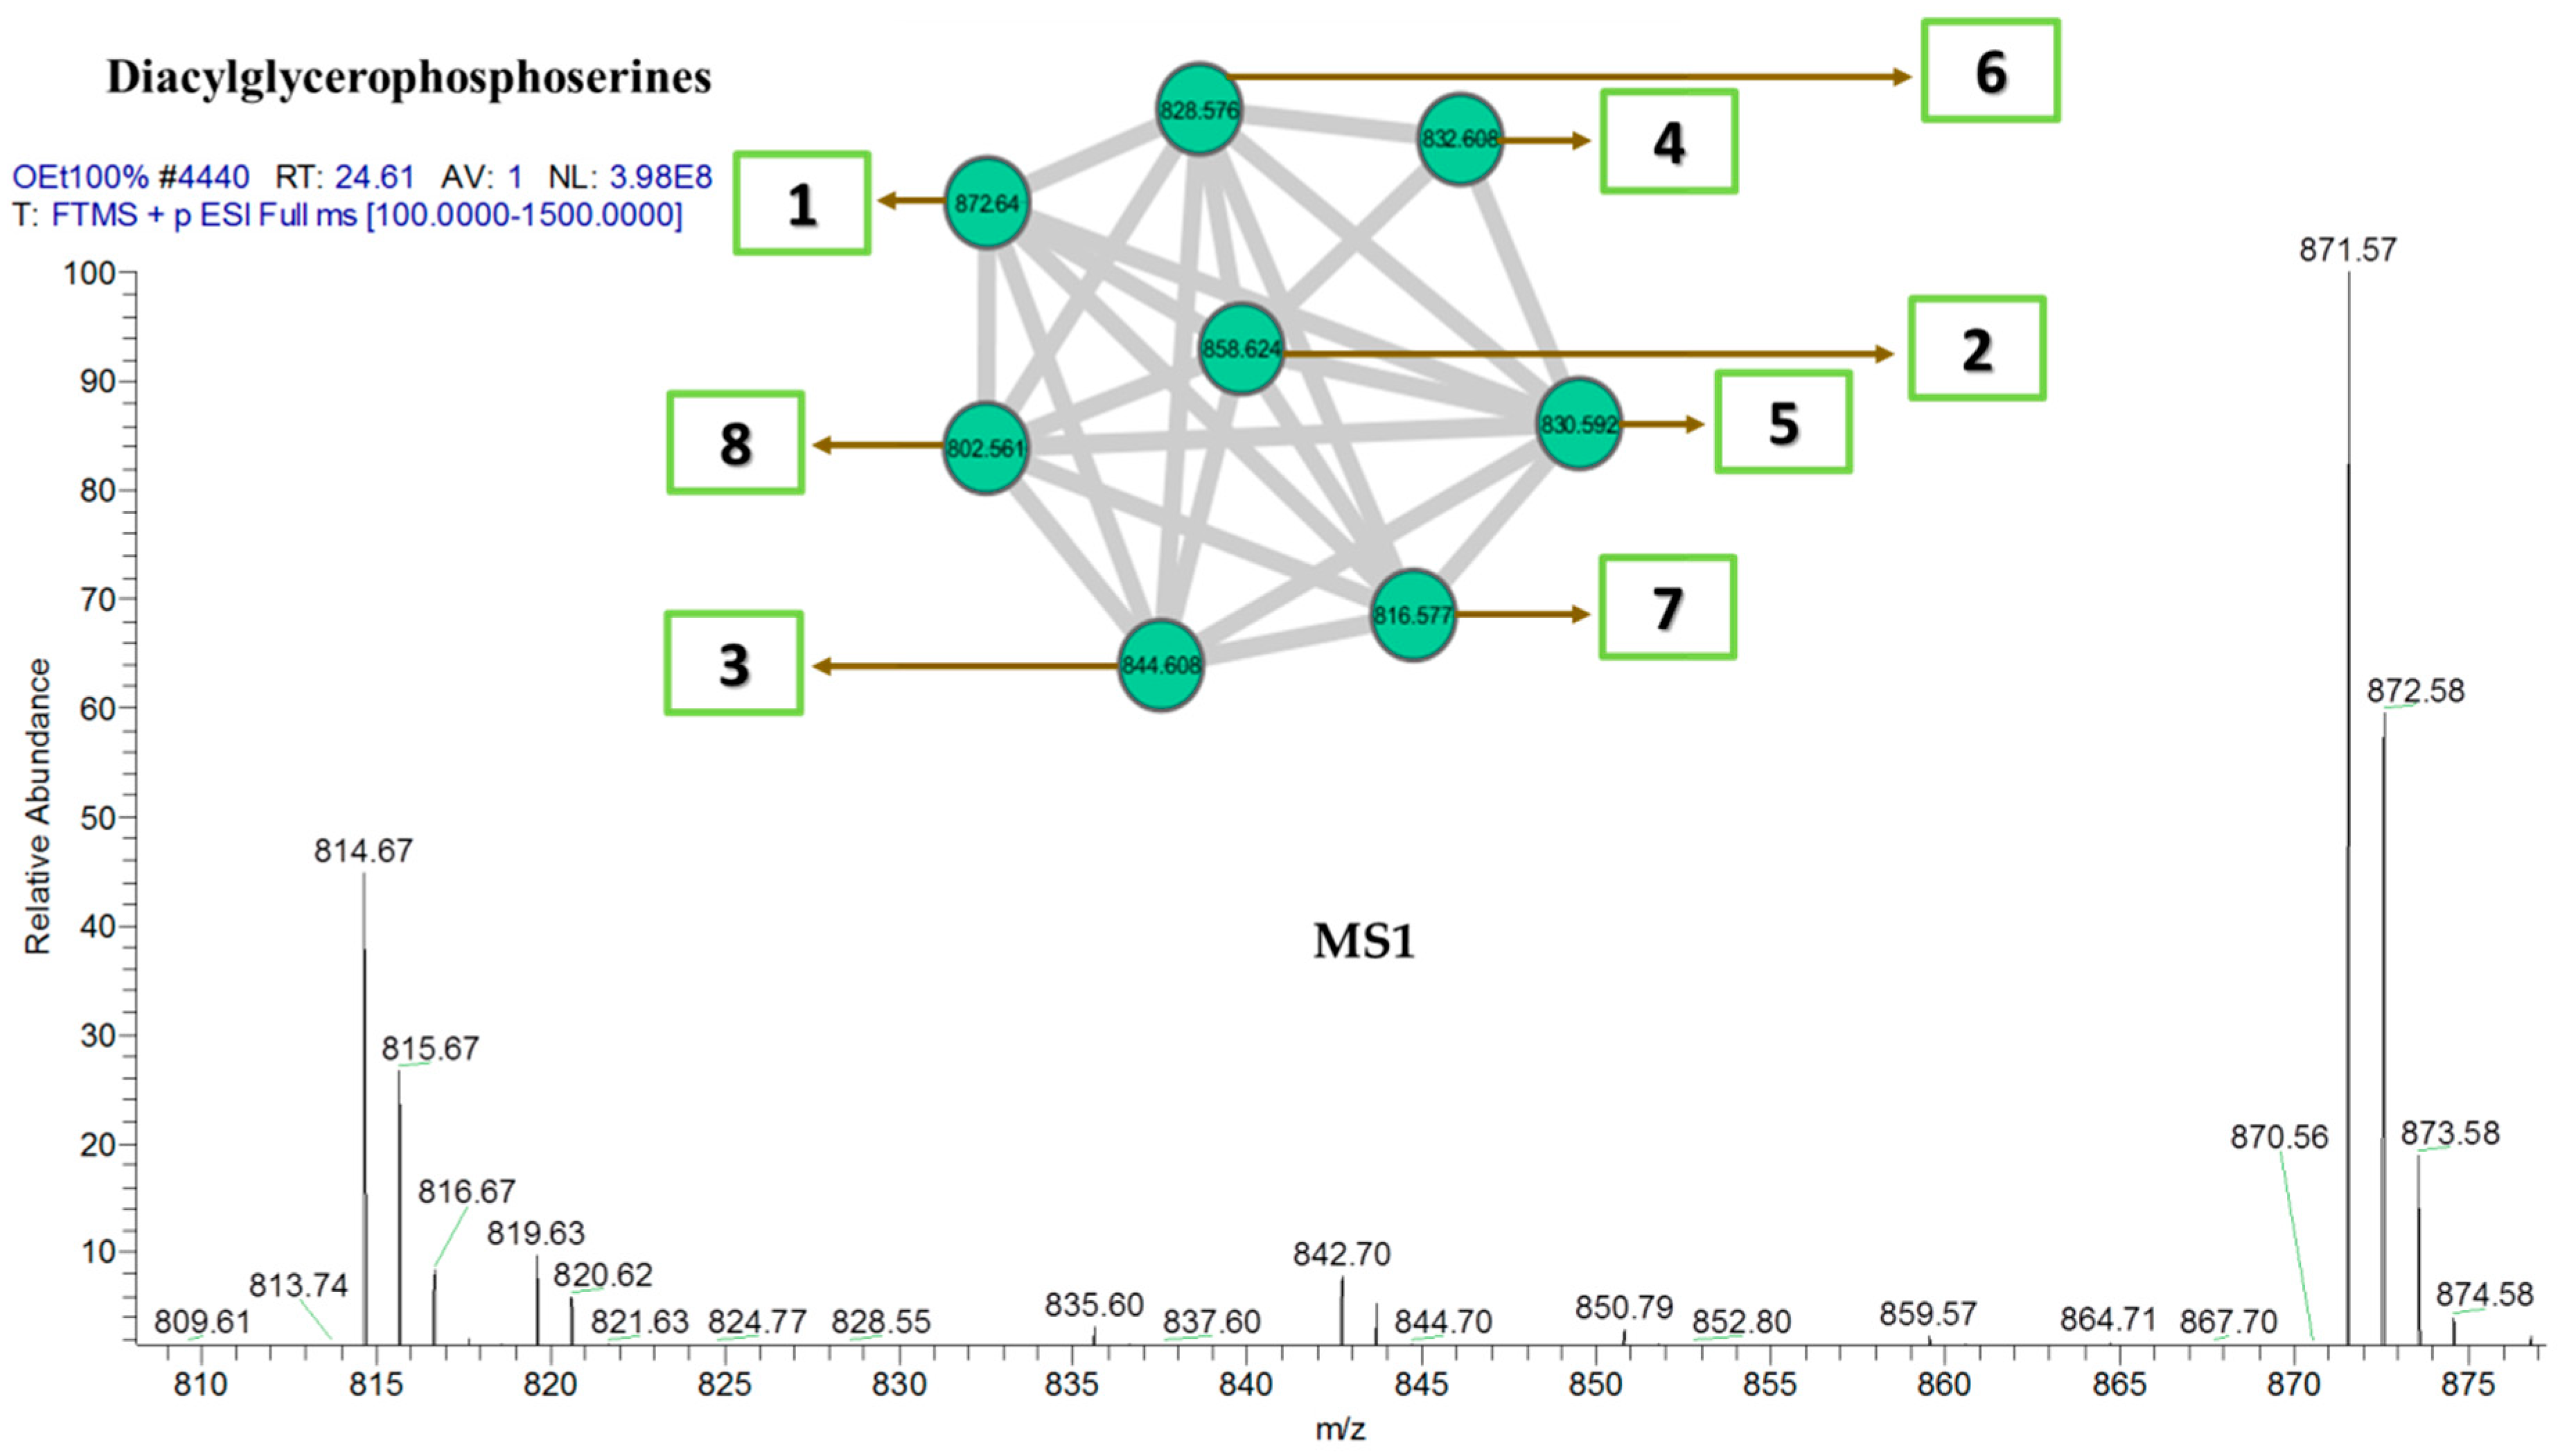
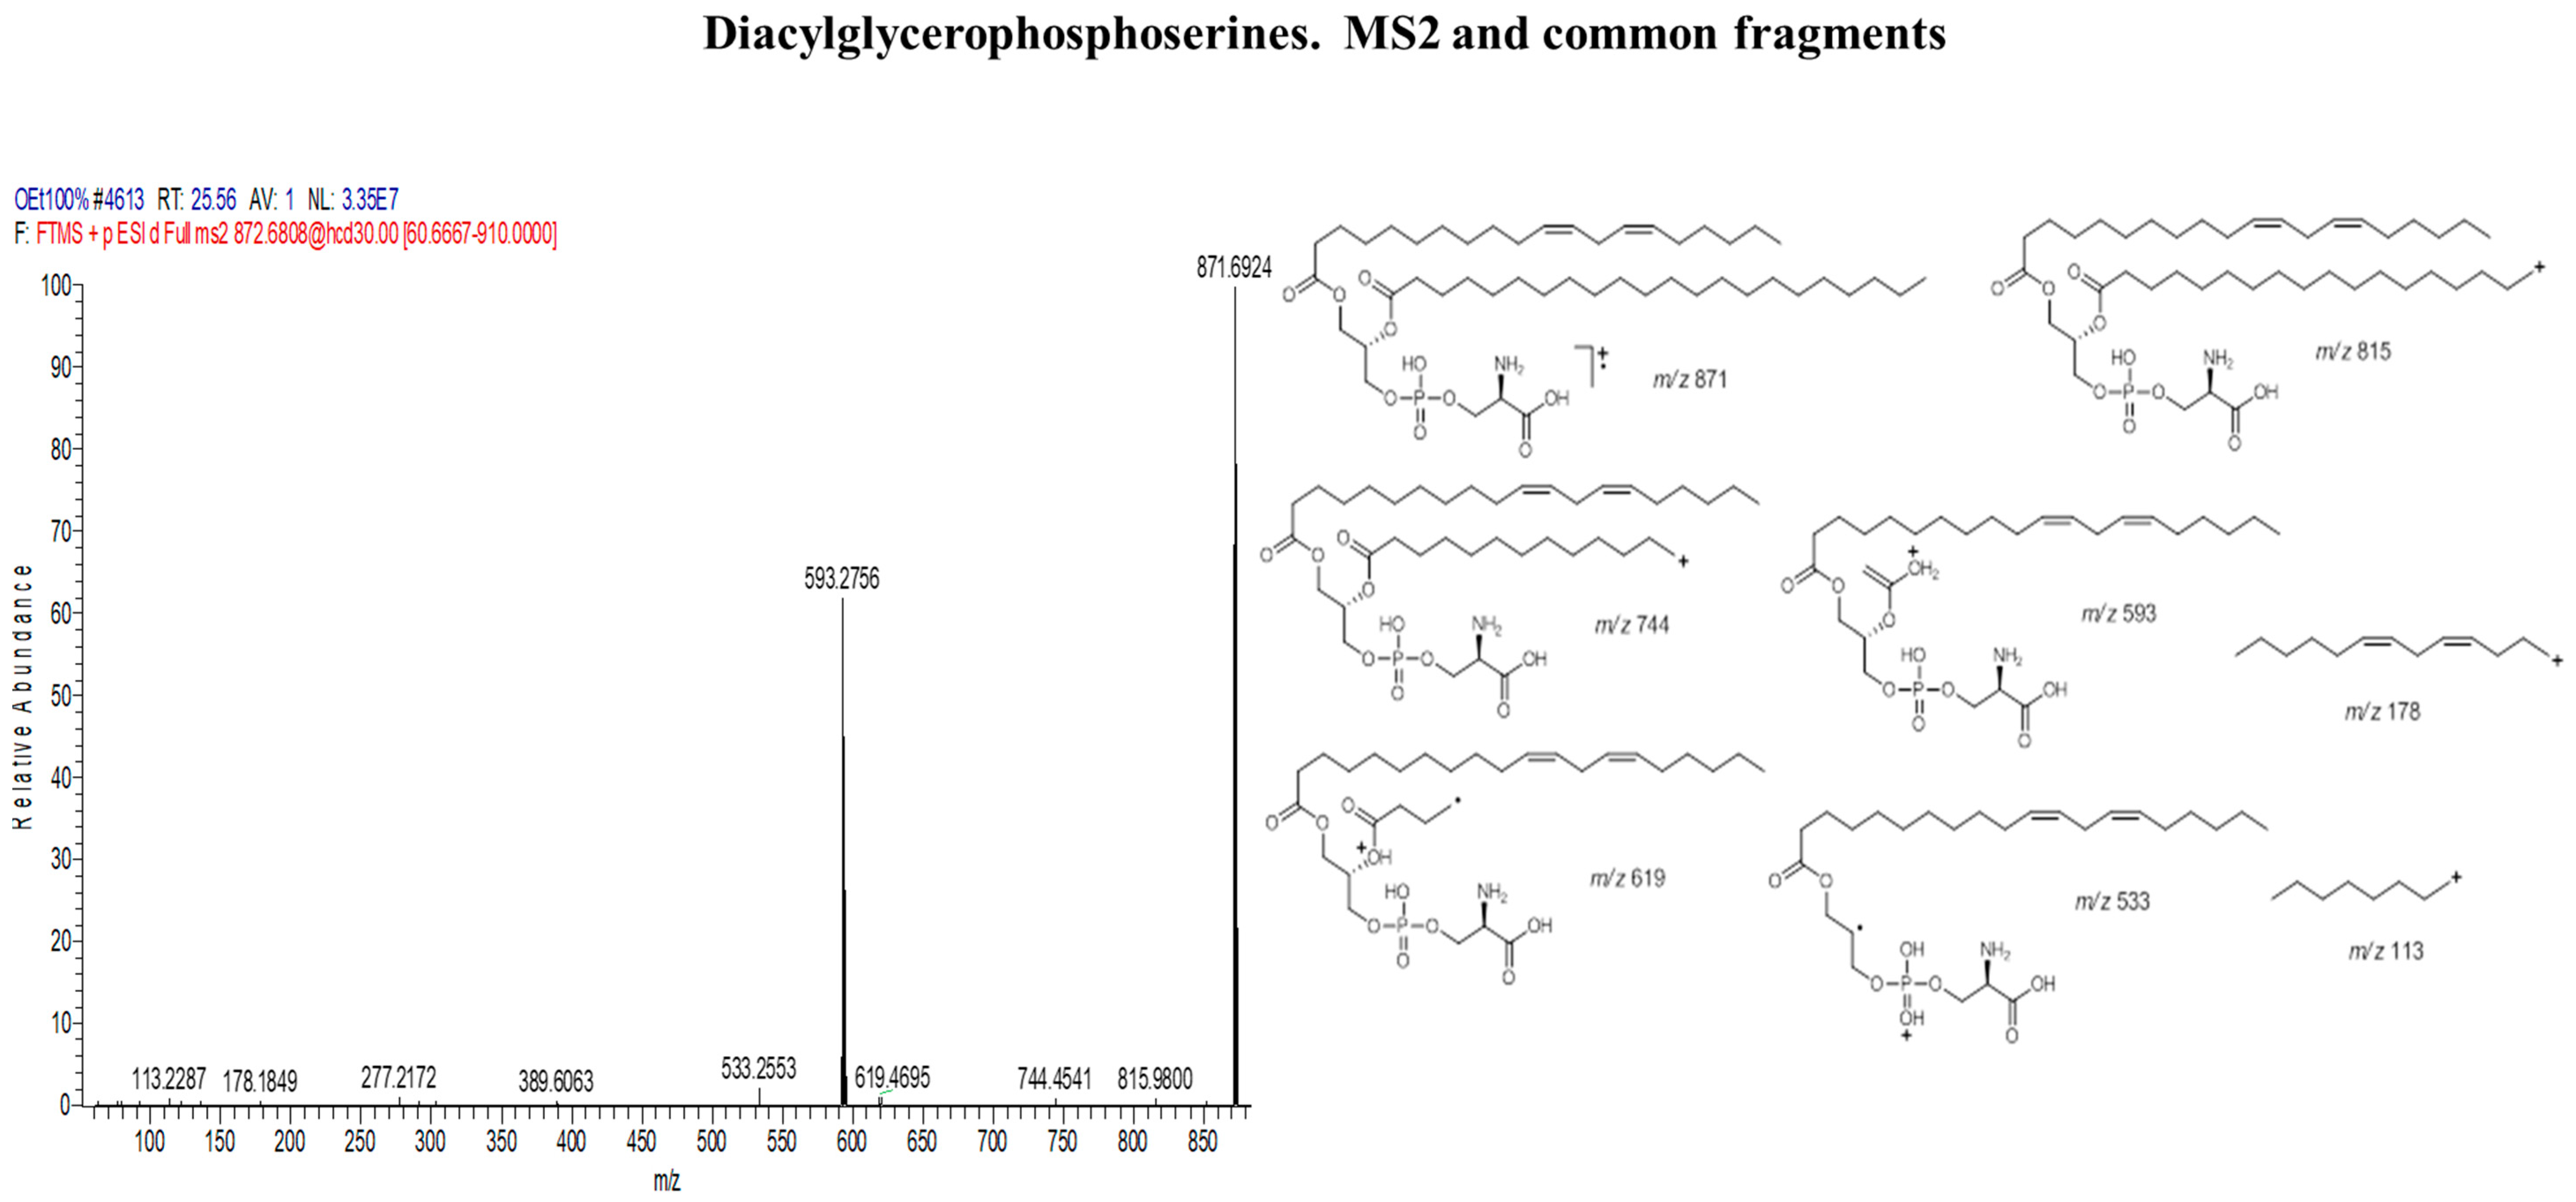
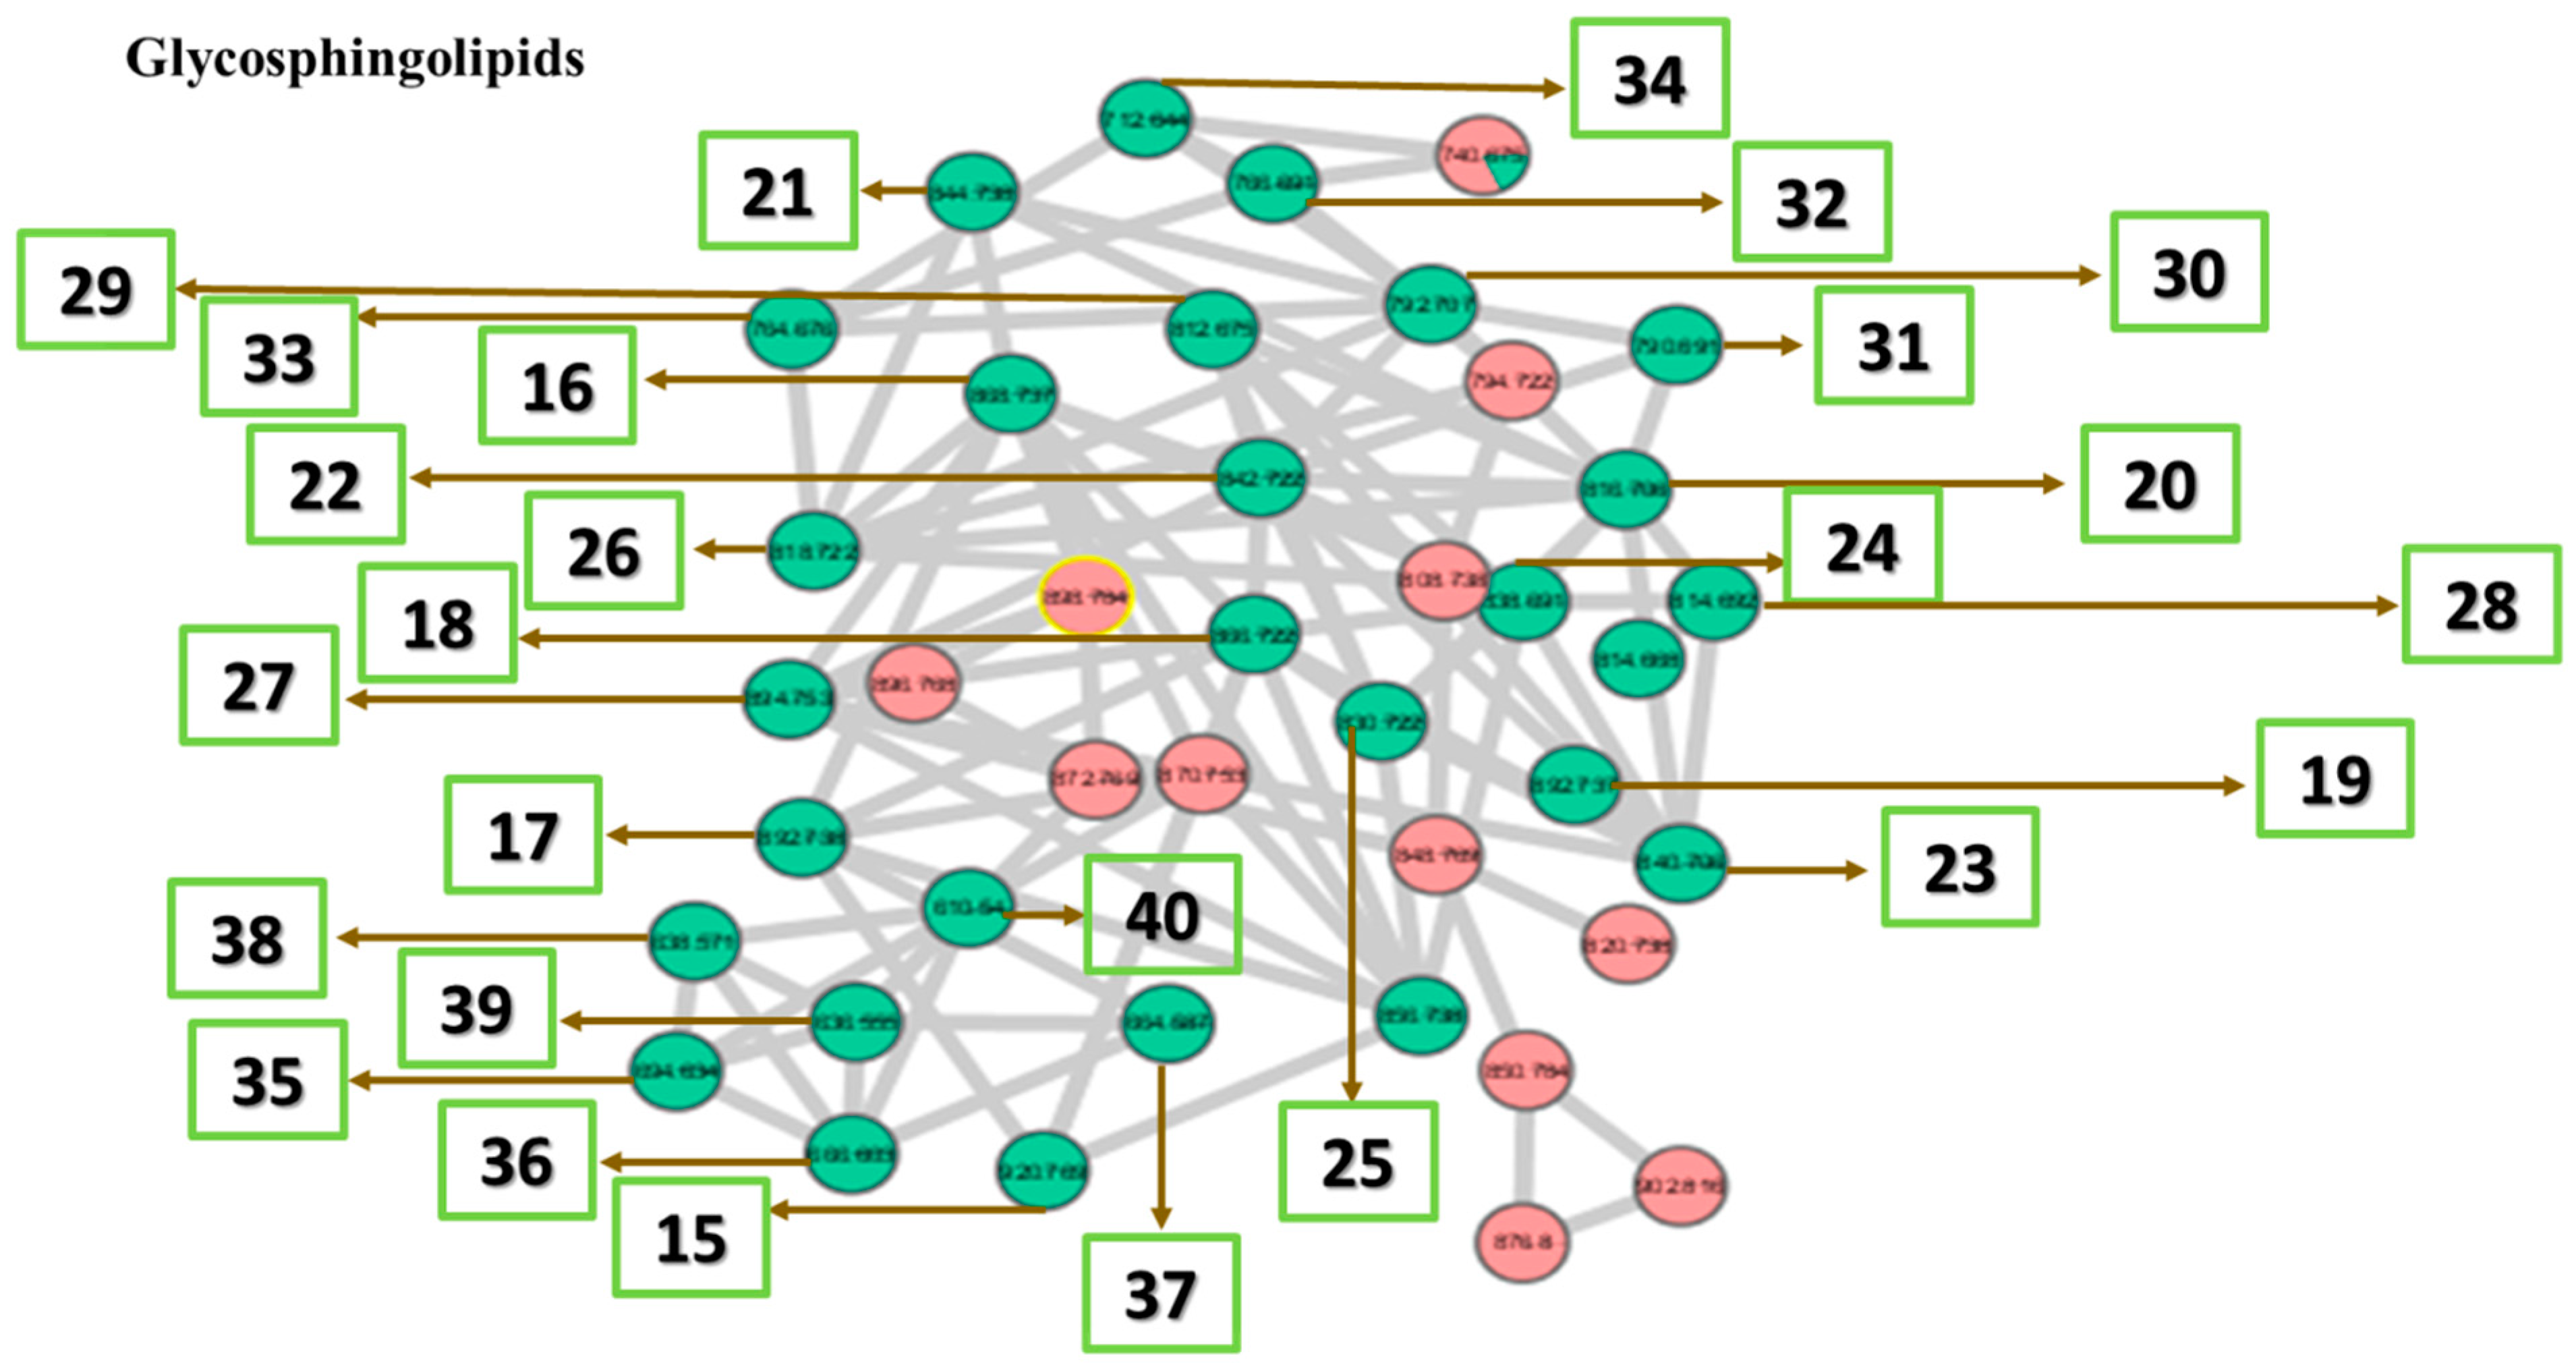
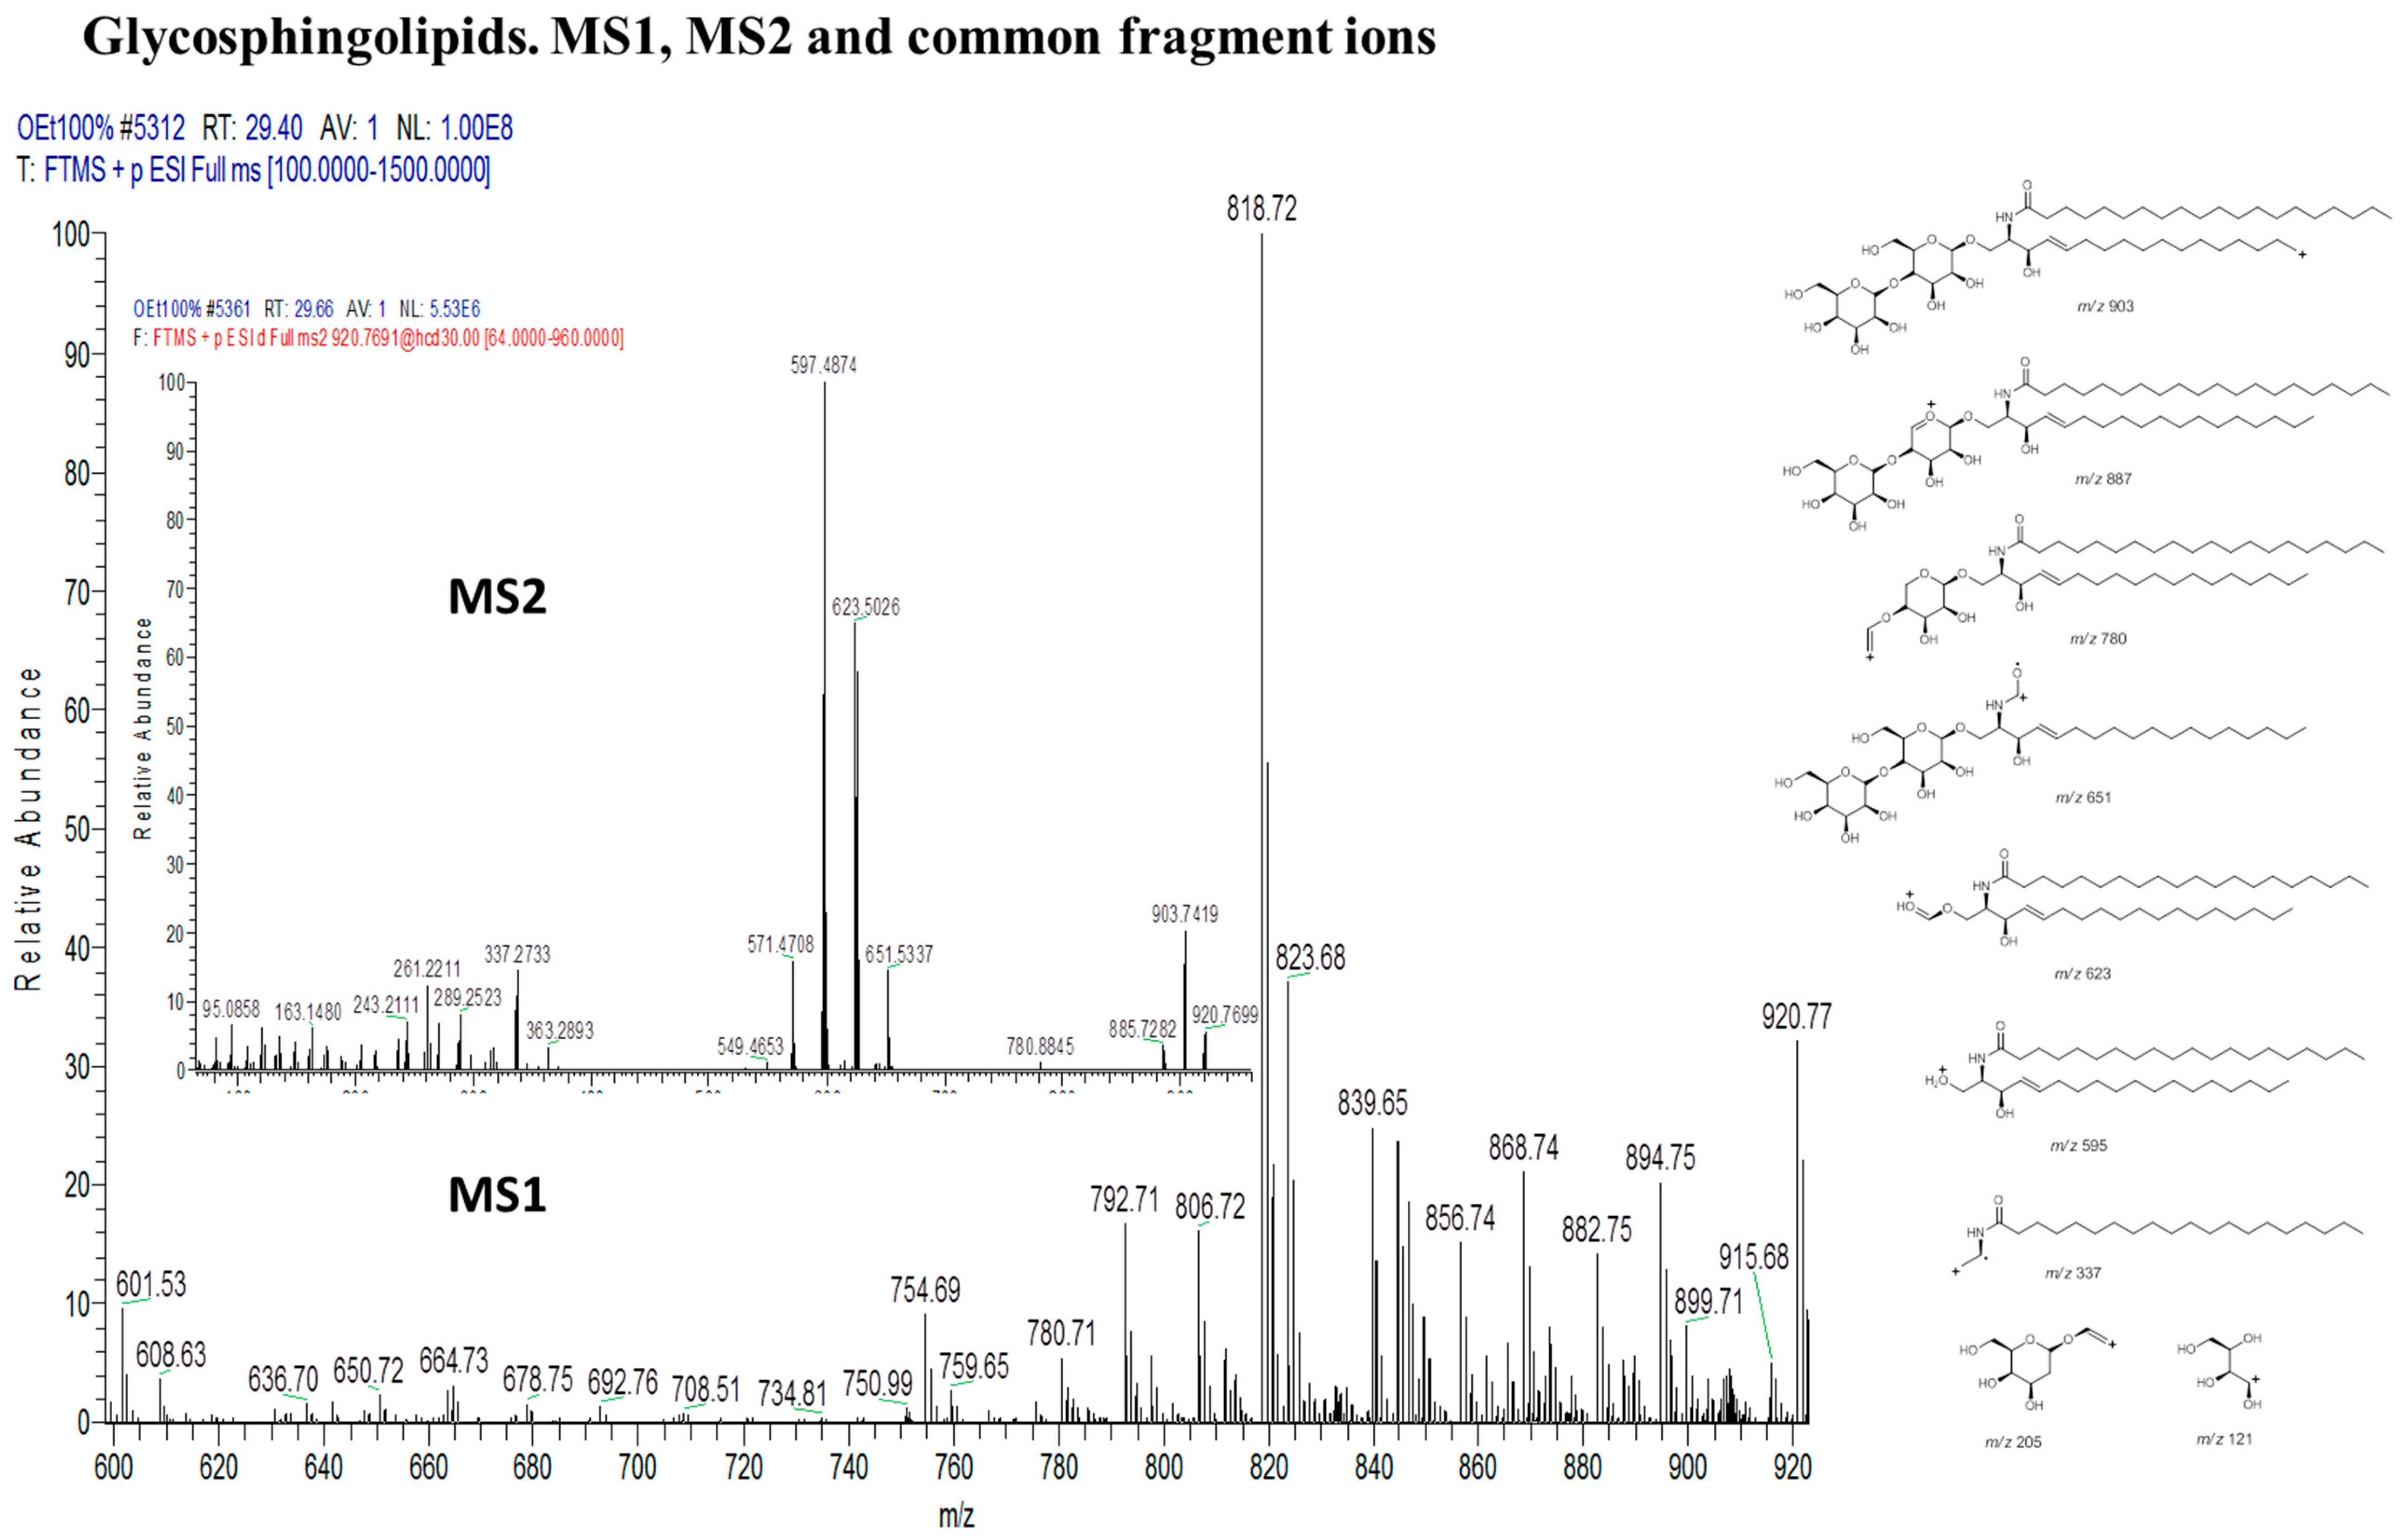
2.2.6. Identification of Lipids via Molecular Networking

Molecular networking (MN) assists in data mining via clustering of the MS/MS spectra based on fragmentation cosine similarities [50,51]. The molecular network of the ethanol extract was generated in order to analyze the lipid content of C. vulgaris more comprehensively, to enrich the information obtained from the fatty acid analysis via GC-MS. Therefore, the typical nature of the lipid content can be fully viewed via a putative annotation of the different lipids that make up the important property of C. vulgaris as a potential candidate for nutrition and biodiesel production using MN. Figure 6 shows the generated MN with the different clusters, each cluster shared some distinct fragments and fragmentation pattern.
The putative annotation was conducted with reference to different mass spectroscopic data bases. Three major and distinct clusters were observed in the network comprising diacylglycerophosphoserines, diacylglycerophosphocholines, and glycosphingolipids clusters. Another cluster comprising several separate sub-clusters of monoacylglycerophosphoethanolamines was also detected. Identification of the metabolites was performed based on the systematic study of the fragmentation pathways and patterns observed from the resulting network. The mass spectrometry-based MN allowed the identification and putative annotation of 48 lipids in the major clusters as shown in Table 7. The MN was capable not only to dereplicate known lipids, but also pointed out related derivatives, described for the first time in C. vulgaris. The resulting annotation from MN conforms with those obtained from GCMS fatty acid analysis in terms of the number and degree of unsaturation; most of the lipids identified from the MN contain the substituent fatty acid carbon ring ranging from C16-C18 which mostly belong to omega 6 fatty acids containing 2–3 degrees of alkene unsaturation.
Visual inspection of the C. vulgaris MN showed that glycosphingolipids clustered in agreement with their substituent’s similarities, i.e., grouped according to the type and size of the attached fatty acids. All the glycosphingolipids identified are mainly disubstituted lipids and mostly contain dialkene with few saturated, mono- and tri-alkene fatty acid substituents. Some phosphoethanolamines which were totally absent in their class cluster, were also seen in this cluster sharing some common fragments with glycosphingolipids. Therefore, the typical nature of the lipid content can be fully viewed via a putative annotation of the different lipids that make up the important property of C. vulgaris as a potential candidate for nutrition and biodiesel production using MN.
Some of the identified lipids agree with previously published results [52,53].
The fragmentation pattern in phosphoserine cluster (Figure 7) is observed by the π-bond dissociation of one of the alkene bonds of the corresponding fatty acid to yield a free radical ion that eventually leads to the elimination of C2H5 or C3H7 via б-bond dissociation. These fragments correspond to a loss of 29 and 43 amu, respectively. The fragment m/z 837 was a result of radical-site rearrangement that led to the elimination of two subsequent H2O molecules via α-bond cleavage corresponding to a loss of 18 amu. In addition, fragment m/z 593 mostly occurred as a result of the complete elimination of one of the fatty acid substituents as a result of γ-charge-site rearrangement. Fragments m/z 178 and m/z 113 were due to б-bond dissociation eliminating two alkene bonds involving 13 C-atoms and or without the alkene bonds involving only 8 C-atoms respectively as seen in Figure 8.
The fragmentation pattern in diacylglycerophosphocholines (Figure 9) is slightly different from the other classes because most of the commonly shared fragments among the lipids of this group contain the phospho-terminal of the lipid molecule. For instance, fragment m/z 189, which was a result of charge-remote rearrangement, contained both the phospho-terminal as well as two hydroxyl groups (OH). Other fragments m/z 137, 125, 99, and 81 contain only the phospho-terminal in different ionic forms which are also products of charge-remote rearrangements, and in few instances, from inductive cleavages, as shown in Figure 10.
The largest cluster of the MN, glycosphingolipids (Figure 11), are mainly characterized by the presence of one or two tetrahydropyran rings within the fragments and the presence of mono-alkene substituted fatty acids, as shown in Figure 12.

3. Materials and Methods

3.1. Fresh Water Microalgae Culture

Chlorella vulgaris was obtained from the Aquatic Laboratory Faculty of Veterinary Medicine, Universiti Putra Malaysia and prepared by raising 200 L of cultured media from 40 milliliters of starter-culture using Bold Basal’s media (BBM). The whole process was conducted in duplicate (100 L each). The upscaling of culture was done via the addition of ten liters of culturing media in three days interval after the growth is checked using hemacytometer under a 400× microscope. The parameter for the algal culture was adopted from the original BBM media with slight modification in temperature which we could not maintain at 28 °C (changes in the range of 25–30 °C). The microalgae biomass production was cultivated in fresh water containing the prepared BBM media having various concentrations of different acids and trace elements autoclaved solutions. The growth medium was adjusted and monitored at pH 7.5. The wet crude product was harvested via centrifugation by employing high-speed Sorvall Evolution RC centrifuge (Thermo Electron Corporation, Asheville, NC, USA) at 12,000 rpm at 25 °C, kept at −80°C for five days, and lyophilized using a freeze drier [48]. Solvent extraction was carried out with ethanol and for LC-MS/MS analysis.

3.2. Solvents and Chemicals

Analytical grade methanol, ethanol, ethyl acetate, chloroform and hexane were purchased from Merck Millipore (Darmstadt, Germany).

3.3. Microalgae Solvent Extraction Procedure

Lyophilized microalgae biomass (100 mg) was dissolved in 50 mL ethanol and vortexed for 5 min. The solution was then extracted via sonication for 30 min using ultrasonic water bath (SK8210HP Shanghai KUDOS Ultrasonic Instrument Co. Ltd., Shanghai, China) at room temperature. The solvent extract was then filtered through Whatman No. 1 filter paper and the procedure is repeated with another 50 mL of ethanol for a second and third round of extraction. The filtered extracts were pooled and evaporated to dryness using a rotary evaporator (Heidolph Instruments GmbH amd Co.KG, Schwabach, Germany) at 30 °C, and stored at −20 °C until further analysis. The ethanol fraction was then used for LC-MS analysis.

3.4. Extraction of Fatty Acids for GC-MS Analysis

Fatty acids in the crude sample of C. vulgaris (~3 mg) were extracted using chloroform and methanol (1:2 v/v) by an ultrasonic device for 10 min. To separate the residue, the mixture was separated by centrifugation at 3000 rpm for 10 min, and the liquid phase was transferred into a glass tube. These extraction steps were repeated three times to obtain maximum extract. After the extraction, several ml of Milli Q water was added, the glass tube was shaken using vortex. Then, to separate impurities (which were dissolved in the water) and the organic solvent phase containing fatty acids, the glass tube was centrifuged at 3000 rpm for 10 min. The water was removed, and the organic solvent phase was dried once. Derivatization into FAMEs were performed with acetyl chloride and methanol (5:100 v/v) [32]. A 10ml acetyl chloride and methanol was added into the dried glass tube, and the derivatization was achieved by reacting under heat at 100 °C for 60 min using a heat block. After cooling at room temperate, the glass tube was added 2 ml of hexane and shake well, and then an aliquot of the upper phase was transferred to a new glass vial. This extraction step was repeated two more times. The final removal of hexane was performed on a 40 °C hot plate with nitrogen stream. Then, the sample was resolved with an accurate amount of hexane (300 µL). Finally, 1 μL of the sample was injected into a GC–MS for fatty acid analysis. Using this method, non-esterified fatty acids were obtained [49]. The identification of FAMEs was assisted by National Institute of Standards and Technology Library (NIST 17 version 2.3) and was confirmed manually. The mono-unsaturated fatty acids were manually detected by the presence of intense peaks of m/z 55 and m/z 69 along with the molecular weight peak. Meanwhile, the di-unsaturated fatty acids were detected by the presence of m/z 55 and m/z 67 intense peaks and m/z 74 and m/z 87 intense peaks were features of saturated fatty acids.

3.5. Sample Preparation for UHPLC-MS/MS Analysis

The ethanol extract (2 mg) was dissolved in LCMS-grade methanol (1 mL). Dissolved extract was vortexed for 10 min, centrifuged for 10 min and filtered through a nylon filter (0.22 µm) into a glass vial for LC-MS/MS analysis [50].

3.6. GC-MS Analysis

The extracted fatty acids were analyzed using a gas chromatography (GC, HP 6890)-mass spectrometry (MS, HP 5973) (Hewlett Packard, Palo Alto, CA, USA). The GC column was set ZB-WAX column, 30 m (length) × 0.25 mm (I.D) × 0.25 μm film thickness. Helium was used as the carrier gas with a flow rate of 1.0 mL/min. The injector was set at 220 °C in split mode. The temperature gradient of the GC oven started with a 70 °C initial temperature, a linear increase to 170 °C at 11 °C /min, a slower linear increase to 175 °C at 0.8 °C /min, followed by an increase to reach 220 °C at 20 °C/min and a final 2.5 min hold. The total run time was 60 min. The MS quadrupole and MS ion source were programmed at 150 °C and 230 °C, respectively. MS data were obtained with scan mode scanning from 20 to 450 amu.
Analysis of MS data for the fatty acids was conducted using enhanced MSD ChemStation E.02.02.143 (Agilent Technologies, Inc. Santa Clara, CA, USA) fitted with NIST Library database (NIST 17 Version 2.3). The compositional rate in fatty acids was calculated from a comparison of each area in the fatty acids taken from the total ion chromatogram.

3.7. UHPLC-MS/MS Analysis

The crude methanol extract was separated using a C18 Reversed-phase Hypersil GOLD aQ column (100 × 2.1 mm ~1.9 µm) (Thermo, Waltham, MA, USA) at 30 °C on Dionex Ultimate 3000 UHPLC with a diode-array DAD-3000 detector (Thermo Fisher Scientific, Waltham, MA, USA). Gradient elution was performed with LC-MS grade Solvent A (0.1% formic acid and 10 mMol ammonium formate in 500 mL methanol (70%) and acetonitrile (30%)) and Solvent B (0.1% formic acid and 10 mMol ammonium formate in 500 mL water) for the following gradient: 20% A in 5 min, and 20–80% A in the next 25 min at a flow rate of 0.2 mL/min. The concentration of sample extract was 1 mg/mL and the injection volume were set to 10 µL and the UV detector was set at 210, 310, 410 and 510 nm. The MS analysis was done on Q-Exactive Focus Orbitrap LC-MS/MS system. The eluent was monitored by ESI-MS under positive and negative switching mode and scanned from m/z 100 to 1500 amu. ESI was conducted using a spray voltage of 4.2 kV. High purity nitrogen gas was used as dry gas at a sheath gas flow rate of 40 (arbitrary units) and aux gas flow rate of 10 (arbitrary units). Capillary temperature was set at 350 °C while aux gas heater temperature was set at 10 °C. The MS data analysis was conducted using ThermoXcalibur 2.2 SP1.48 (Thermo Fisher Inc. Waltham, MA, USA) and literature data. Further, the confirmation of newly identified compounds was supported by its mass error that shows relatively low values indicating the high possibility of correct identification of the newly reported compounds.
The mass spectrometry molecular networks were created using the Global Natural Products Social Molecular Networking (GNPS) platform (http://gnps.ucsd.edu) [51]. The MS data were first converted into mzXML format using MSConvert [51]. Spectral information generated was uploaded on GNPS using FileZilla and was used to generate an MS/MS molecular network using the GNPS Data Analysis Workflow. The precursor ion mass tolerance was set to 0.02 Da and a fragment ion mass tolerance of 0.02 Da. The fragment ions below 10 counts were removed from the MS/MS spectra. The MN were generated using 6 minimum matched peaks and a cosine score of 0.7. The resulting data were downloaded and visualized using Cytoscape 3.7.1 software (Institute of Systems Biology Seattle, Washington D.C., USA) [50].

4. Conclusions

MS-based metabolite profiling of crude sample of C. vulgaris microalgae grown in normal conditions, proved to be efficient in the determination of certain metabolites including carotenoids, amino acids, vitamins and other pigments such as the chlorophylls. The combination of methanol 70% and acetonitrile 30% as the organic solvent used proved to be efficient in determining these compounds. In total, 31 metabolites were successfully determined using LC-MS among which two of them, vulgaxanthin I and R-crypton, were never reported in C. vulgaris before. In addition, 48 lipids were putatively identified via MN. On the other hand, the fatty acid content was best determined using GC-MS via fatty acid analysis due to their volatility and ease of derivatization into FAME, and a total of 20 fatty acids were identified in the derivatized sample with higher percentage of unsaturation and omega-6 being the most dominant. Recent novel bioinformatics approaches such as the MN and in-silico fragmentation tools have emerged and provided a new perspective for early metabolite identification in natural products research. Thus, in this research, an efficient exploitation of datasets was employed for automated data treatment and access to dedicated fragmentation databases during MN. As a result, a larger profile of C. vulgaris was successfully established and many lipids were putatively identified which were not reported before.
The presence of carotenoids, chlorophylls and amino acids suggests that the candidate sample C. vulgaris is a good source of nutrition supported by the presence of omega-6, -7, -9, and -13 fatty acids. Also, the fatty acid profile suggests that C. vulgaris is a good candidate for biodiesel production. More studies need to be carried out in order to determine the correct proportion of nutrient composition in this promising microalga.

Supplementary Materials

The following are available online at https://www.mdpi.com/1660-3397/18/7/367/s1, Figure S1: fragmentation pathway of neoxanthin, Figure S2: fragmentation pathway of violaxanthin, Figure S3: fragmentation pathway of lutein, Figure S4: fragmentation pathway of β-carotene, Figure S5: fragmentation pathway of astaxanthin, Figure S6: Extraction ion chromatogram (EIC) of (peak 26) Astaxanthin, Figure S7: MS/MS of some of the representative pigments: a, pheophytin-a; b, pheophytin-b; c, chlorophyll-a; d, pheophorbide-a; e, pheophorbide-b.

Author Contributions

Conceptualization, K.S.; Data curation, H.A.P. and M.S.A.B.; Formal analysis, H.A.P.; Funding acquisition, K.S.; Investigation, H.A.P.; Project supervision: K.S. and I.S.I.; Validation, K.S.; Visualization, K.S.; Writing—original draft, H.A.P.; Writing—review & editing, S.Y.L., S.M.M.F., M.N. and K.S. All authors have read and agreed to the published version of the manuscript.

Funding

This research was funded by the Japan Science and Technology Agency (JST)/Japan International Cooperation Agency (JICA), Science and Technology Research Partnership for Sustainable Development (SATREPS) <JPMJSA1509> through the project for Continuous Operation System for Microalgae Production Optimized for Sustainable Tropical Aquaculture (COSMOS), and the SATREPS-COSMOS Matching Fund from the Ministry of Higher Education, Malaysia (MOHE).

Acknowledgments

The first author would like to gratefully acknowledge the Tertiary Education Trust Fund (TETFund) of Gombe State University (GSU), Nigeria. We also thank Mohamed Shariff Mohamed Din (Faculty of Veterinary Medicine, UPM) for use of culture facilities. M.N. would like to thank Tatsuki Toda (Soka University), Norio Nagao (UPM), and Minamo Hirahara (Soka University) for making an excellent opportunity for sharing an analytical method that was used in this study at Universiti Putra Malaysia.

Conflicts of Interest

The authors declare no conflict of interest.

References

  1. Tomaselli, L. Biotechnology and phycology. In Handbook of Microalgae Culture, 1st ed.; Richmond, A., Ed.; Blackwell Science: Oxford, UK, 2004; pp. 344–346. [Google Scholar]
  2. Herrero, M.; Mendiola, J. Screening for bioactive compounds from algae. In Advanced Biofuels and Bioproducts, 1st ed.; Lee, J., Ed.; Springer Scince and Business Media: New York, NY, USA, 2013; pp. 3–12. [Google Scholar]
  3. Mobin, S.; Alam, F. Some promising microalgal species for commercial applications: A review. Energy Procedia 2017, 110, 510–517. [Google Scholar] [CrossRef]
  4. Varfolomeev, S.D.; Wasserman, L.A. Microalgae as source of biofuel, food, fodder, and medicines. Appl. Biochem. Microbiol. 2011, 47, 789–807. [Google Scholar] [CrossRef]
  5. Singh, S.P.; Singh, D. Biodiesel production through the use of different sources and characterization of oils and their esters as the substitute of diesel: A review. Renew. Sustain. Energy Rev. 2010, 14, 200–216. [Google Scholar] [CrossRef]
  6. Koirala, K.H.; Mishra, A.K.; D’Antoni, J.M.; Mehlhorn, J.E. Energy prices and agricultural commodity prices: Testing correlation using copulas method. Energy 2015, 81, 430–436. [Google Scholar] [CrossRef]
  7. Satyanarayana, K.G.; Mariano, A.; Vargas, J.V.C. A review on microalgae, a versatile source for sustainable energy and materials. Int. J. Energy Res. 2011, 35, 291–311. [Google Scholar] [CrossRef]
  8. Sørensen, M.; Berge, G.M.; Reitan, K.I.; Ruyter, B. Microalga Phaeodactylum tricornutum in feed for Atlantic salmon (Salmo salar)-Effect on nutrient digestibility, growth and utilization of feed. Aquaculture 2016, 460, 116–123. [Google Scholar] [CrossRef]
  9. Teuling, E.; Schrama, J.W.; Gruppen, H.; Wierenga, P.A. Effect of cell wall characteristics on algae nutrient digestibility in nile tilapia (Oreochromis niloticus) and African catfish (Clarus gariepinus). Aquaculture 2017, 479, 490–500. [Google Scholar] [CrossRef]
  10. Kwak, J.H.; Baek, S.H.; Woo, Y.; Han, J.K.; Kim, B.G.; Kim, O.Y.; Lee, J.H. Beneficial immunostimulatory effect of short-term chlorella supplementation: Enhancement of natural killer cell activity and early inflammatory response (Randomized, double-blinded, placebo-controlled trial). Nutr. J. 2012, 11, 1–8. [Google Scholar] [CrossRef] [Green Version]
  11. Kamat, J.P.; Boloor, K.K.; Devasagayam, T.P.A. Chlorophyllin as an effective antioxidant against membrane damage in vitro and ex vivo. Biochim. Biophys. Acta 2000, 1487, 113–127. [Google Scholar] [CrossRef]
  12. Zahran, E.; Risha, E. Modulatory role of dietary Chlorella vulgaris powder against arsenic-induced immunotoxicity and oxidative stress in Nile tilapia (Oreochromis niloticus). Fish Shellfish Immunol. 2014, 41, 654–662. [Google Scholar] [CrossRef]
  13. FAO. Statistics and Information Branch, Fisheries and Aquaculture Department/FAO. Fishery and Aquaculture Statistics. Global Production by Production Source 1950–2015 (FishStatJ). Rome 2017. Available online: http://www.fao.org/fishery/statistics/software/fishstatj/en (accessed on 29 May 2018).
  14. Schoepp, N.G.; Ansari, W.S.; Dallwig, J.A.; Gale, D.; Burkart, M.D.; Mayfield, S.P. Rapid estimation of protein, lipid, and dry weight in microalgae using a portable LED fluorometer. Algal. Res. 2015, 11, 108–112. [Google Scholar] [CrossRef] [Green Version]
  15. Markou, G.; Nerantzis, E. Microalgae for high-value compounds and biofuels production: A review with focus on cultivation under stress conditions. Biotechnol. Adv. 2013, 31, 1532–1542. [Google Scholar] [CrossRef] [PubMed]
  16. Pakravan, S.; Akbarzadeh, A.; Sajjadi, M.; Hajimoradloo, A.; Noori, F. Chlorella vulgaris meal improved growth performance, digestive enzyme activities, fatty acid composition and tolerance of hypoxia and ammonia stress in juvenile pacific white shrimp Litopenaeus vannamei. Aquac Nutr. 2018, 24, 594–604. [Google Scholar] [CrossRef]
  17. Samuelsen, T.A.; Oterhals, A.; Kousoulaki, K. High lipid microalgae (Schizochytrium sp.) inclusion as a sustainable source of n-3 long-chain PUFA in fish feed—Effects on the extrusion process and physical pellet quality. Anim. Feed Sci. Technol. 2018, 236, 14–28. [Google Scholar] [CrossRef]
  18. Safafar, H.; Nørregaard, P.U.; Ljubic, A.; Møller, P.; Holdt, S.L.; Jacobsen, C. Enhancement of protein and pigment content in two chlorella species cultivated on industrial process water. J. Mar. Sci. Eng. 2016, 4, 84. [Google Scholar] [CrossRef] [Green Version]
  19. Hussein, E.E.S.; Dabrowski, K.; El-Saidy, D.M.S.D.; Lee, B.J. Effect of dietary phosphorus supplementation on utilization of algae in the grow-out diet of Nile tilapia Oreochromis niloticus. Aquac. Res. 2012, 45, 1533–1544. [Google Scholar] [CrossRef]
  20. Sharma, R.; Singh, G.P.; Vijendra, K.S. Comparison of different media formulations on growth, morphology and chlorophyll content of green alga, Chlorella vulgaris. Int. J. Pharm. Biol. Sci. 2011, 2, 509–5016. [Google Scholar]
  21. Maliwat, G.C.; Velasquez, S.; Robil, J.L.; Chan, M.; Traifalgar, R.F.; Tayamen, M.; Ragaza, J.A. Growth and immune response of giant freshwater prawn Macrobrachium rosenbergii (De Man) postlarvae fed diets containing Chlorella vulgaris (Beijerinck). Aquac. Res. 2016, 48, 1–11. [Google Scholar] [CrossRef]
  22. Ahmad, M.T.; Shariff, M.; Yusoff, M.F.; Goh, Y.M.; Banerjee, S. Applications of microalga Chlorella vulgaris in aquaculture. Rev. Aquac. 2018, 1–19. [Google Scholar] [CrossRef]
  23. Arsiya, F.; Sayadi, M.H.; Sobhani, S. Green synthesis of palladium nanoparticles using Chlorella vulgaris. Mater. Lett. 2017, 186, 113–115. [Google Scholar] [CrossRef]
  24. Lee, W.-L.; Chen, T.-Y.; Chang, J.-S.; Chang, H.-Y.; Chen, C.-Y.; Wu, J.-H. Enhancing microalgal oil/lipid production from Chlorella sorokiniana CY1 using deep-sea water supplemented cultivation medium. Biochem. Eng. J. 2013, 77, 74–81. [Google Scholar] [CrossRef]
  25. Azizan, A.; Safwan, M.B.A.; Maulidiani, M.; Shaari, K.; Ismail, I.S.; Nagao, N.; Abas, F. Metabolite profiling of the microalgal diatom chaetoceros calcitrans and correlation with antioxidant and nitric oxide inhibitory activities via1H NMR-based metabolomics. Mar. Drugs 2018, 16, 154. [Google Scholar] [CrossRef] [PubMed] [Green Version]
  26. Sarayloo, E.; Simsek, S.; Unlu, Y.S.; Cevahir, G.; Erkey, C.; Kavakli, I.H. Enhancement of the lipid productivity and fatty acid methyl ester profile of Chlorella vulgaris by two rounds of mutagenesis. Bioresour. Technol. 2018, 250, 764–769. [Google Scholar] [CrossRef] [PubMed]
  27. Safi, C.; Zebib, B.; Merah, O.; Pontalier, P.Y.; Vaca-Garcia, C. Morphology, composition, production, processing and applications of Chlorella vulgaris: A review. Renew. Sustain. Energy Rev. 2014, 35, 265–278. [Google Scholar] [CrossRef] [Green Version]
  28. Duk, C.; Young, J.; Hyun, T.; Jun, S. Astaxanthin biosynthesis from simultaneous N and P uptake by the green alga Haematococcus pluvialis in primary-treated wastewater. Biochem. Eng. J. 2006, 31, 234–238. [Google Scholar]
  29. Ma, N.L.; Aziz, A.; The, K.Y.; Lam, S.S.; Cha, T.S. Metabolites re-programming and physiological changes induced in scenedesmus regularis under nitrate treatment. Sci. Rep. 2018, 8, 1–12. [Google Scholar] [CrossRef]
  30. Machado, M.; Bromke, M.; Domingues, A.P., Jr.; Vieira Vaz, M.M.G.; Rosa, R.M.; Vinson, C.C.; Sabir, J.S.; Rocha, D.I.; Martins, M.A.; Nunes-Nesi, A. Comprehensive metabolic reprograming in freshwater Nitzschia palea strains undergoing nitrogen starvation is likely associated with its ecological origin. Algal. Res. 2016, 18, 116–126. [Google Scholar] [CrossRef]
  31. Tang, D.; Han, W.; Li, P.; Miao, X.; Zhong, J. CO2 biofixation and fatty acid composition of Scenedesmus obliquus and Chlorella pyrenoidosa in response to different CO2 levels. Bioresour. Technol. 2011, 102, 3071–3076. [Google Scholar] [CrossRef]
  32. West, N.; West, S. Notes/methodology. J. Lipid Res. 2009, 29, 227–235. [Google Scholar]
  33. Fernández-Linares, L.C.; Barajas, G.C.; Páramo, D.E.; Corona, B.J.A. Assessment of Chlorella vulgaris and Indigenous microalgae biomass with treated wastewater as growth culture medium. Bioresour. Technol. 2017, 244, 400–406. [Google Scholar] [CrossRef]
  34. Fu, W.; Guomundsson, Ó.; Paglia, G.; Herjólfsson, G.; Andrésson, Ó.S.; Palsson, B.O.; Brynjólfsson, S. Enhancement of carotenoid biosynthesis in the green microalga Dunaliella salina with light-emitting diodes and adaptive laboratory evolution. Appl. Microbiol. Biotechnol. 2013, 97, 2395–2403. [Google Scholar] [CrossRef] [PubMed] [Green Version]
  35. Deli, J.; Gonda, S.; Nagy, L.Z.S.; Szabó, I.; Gulyás-Fekete, G.; Agócs, A.; Marton, K.; Vasas, G. Carotenoid composition of three bloom-forming algae species. Food Res. Int. 2014, 65, 215–223. [Google Scholar] [CrossRef]
  36. Upadhyay, R.K. Plant pigments as dietary anticancer agents. Int. J. Green Pharm. 2018, 12, S93–S107. [Google Scholar]
  37. Sivathanu, B.; Palaniswamy, S. Purification and characterization of carotenoids from green algae Chlorococcum humicola by HPLC-NMR and LC-MS-APCI. Biomed. Prev. Nutr. 2012, 2, 276–282. [Google Scholar] [CrossRef]
  38. Patias, L.D.; Fernandes, A.S.; Petry, F.C.; Mercadante, A.Z.; Jacob-Lopes, E.; Zepka, L.Q. Carotenoid profile of three microalgae/cyanobacteria species with peroxyl radical scavenger capacity. Food Res. Int. 2017, 100, 260–266. [Google Scholar] [CrossRef] [PubMed]
  39. Guedes, A.C.; Amaro, H.M.; Malcata, F.X. Microalgae as sources of carotenoids. Mar. Drugs 2011, 9, 625–644. [Google Scholar] [CrossRef] [PubMed]
  40. Petry, F.C.; Mercadante, A.Z. Composition by LC-MS/MS of new carotenoid esters in mango and citrus. J. Agric. Food Chem. 2016, 64, 8207–8224. [Google Scholar] [CrossRef]
  41. Horai, H.; Arita, M.; Kanaya, S.; Nihei, Y.; Ikeda, T.; Suwa, K.; Naoshige, A.; Takashi, M.; Takahashi, H.; Takeshi, A. Special feature: Tutorial MassBank: A public repository for sharing mass spectral data for life sciences. Int. J. Mass Spectrom. 2010, 45, 703–714. [Google Scholar] [CrossRef]
  42. Rivera, M.S.; Christou, P.; Canela-Garayoa, R. Identification of carotenoids using mass spectrometry. Mass Spectrom. Rev. 2013, 9999, 1–20. [Google Scholar] [CrossRef] [Green Version]
  43. Seyfabadi, J.; Ramezanpour, Z.; Khoeyi, Z.A. Protein, fatty acid, and pigment content of Chlorella vulgaris under different light regimes. J. Appl. Phycol. 2011, 721–726. [Google Scholar] [CrossRef]
  44. Hynstova, V.; Sterbova, D.; Klejdus, B.; Hedbavny, J.; Huska, D.; Adam, V. Separation, identification and quantification of carotenoids and chlorophylls in dietary supplements containing Chlorella vulgaris and Spirulina platensis using high performance thin layer chromatography. J. Pharm. Biomed Anal. 2018, 148, 108–118. [Google Scholar] [CrossRef] [PubMed]
  45. Nakanishi, K.; Deuchi, K. Culture of a high-chlorophyll-producing and halotolerant Chlorella vulgaris. J. Biosci. Bioeng. 2014, 117, 617–619. [Google Scholar] [CrossRef] [PubMed]
  46. Zhang, W.; Tan, N.G.J.; Li, S.F.Y. NMR-based metabolomics and LC-MS/MS quantification reveal metal-specific tolerance and redox homeostasis in Chlorella vulgaris. Mol. Biosyst. 2014, 10, 149–160. [Google Scholar] [CrossRef] [PubMed]
  47. Xie, T.; Xia, Y.; Zeng, Y.; Li, X.; Zhang, Y. Nitrate concentration-shift cultivation to enhance protein content of heterotrophic microalga Chlorella vulgaris: Over-compensation strategy. Bioresour. Technol. 2017, 233, 247–255. [Google Scholar] [CrossRef]
  48. Enyidi, U.D. Chlorella vulgaris as protein source in the diets of african catfish Clarias gariepinus. Fishes 2017, 2, 1. [Google Scholar] [CrossRef] [Green Version]
  49. Bouzabata, A.; Bighelli, A.; Abed, L.; Casanova, J.; Tomi, F. Composition and chemical variability of Eucalyptus bosistoana essential oil from Algerian Sahara. Nat. Prod. Commun. 2014, 9, 701–702. [Google Scholar] [CrossRef] [Green Version]
  50. De Oliveira, G.G.; Carnevale, N.F.; Demarque, D.P.; De Sousa, P.-J.J.A.; Filho, S.P.R.C.; De Melo, S.J.; Guedes da Silva Almeida, J.R.; Callegari Lopes, J.L.; Lopes, N.P. Dereplication of Flavonoid Glycoconjugates from Adenocalymma imperatoris-maximilianii by untargeted tandem mass spectrometry-based molecular networking. Planta Med. 2017, 83, 636–646. [Google Scholar] [CrossRef] [Green Version]
  51. Wang, M.; Carver, J.J.; Phelan, V.V.; Sanchez, L.M.; Garg, N.; Peng, Y.; Nguyen, D.D.; Watrous, J.; Kapono, C.A.; Luzzatto-Knaan, T. Sharing and community curation of mass spectrometry data with global natural products social molecular networking. Nat. Biotechnol. 2016, 34, 828–837. [Google Scholar] [CrossRef] [Green Version]
  52. Hu, Q.; Zeng, R.; Zhang, S.X.; Yang, Z.H.; Huang, H. Production of microalgal lipids as biodiesel feedstock with fixation of CO2 by Chlorella vulgaris. Food Technol. Biotechnol. 2014, 52, 285–291. [Google Scholar]
  53. Converti, A.; Casazza, A.A.; Ortiz, E.Y.; Perego, P.; del Borghi, M. Effect of temperature and nitrogen concentration on the growth and lipid content of Nannochloropsis oculata and Chlorella vulgaris for biodiesel production. Chem. Eng. Process. Process Intensif. 2009, 48, 1146–1151. [Google Scholar] [CrossRef]
Figure 1. (A) Total ion chromatogram of extracted fatty acid methyl esters in Chlorella vulgaris obtained by GC−MS analysis (numbers correspond to peak numbers in Table 1) (B) The percentage composition of saturated and unsaturated fatty acid methyl esters (C) Percentage distribution of individual saturated fatty acids relative to the total saturated fatty acid content (D) Percentage distribution of individual unsaturated fatty acids relative to the total unsaturated fatty acid content.
Marinedrugs 18 00367 g001
Figure 2. (A) Total scan PDA chromatogram and (B) total ion chromatogram (TIC) in positive ion mode of Chlorella vulgaris. The number above each peak represent peak numbers, corresponding to the peak numbers in Table 2, Table 3, Table 4 and Table 5.
Marinedrugs 18 00367 g002
Figure 3. Proposed fragmentation pathway for vulgaxanthin I.
Marinedrugs 18 00367 g003
Figure 4. Proposed fragmentation pathways for neoxanthin and violaxanthin, producing m/z 221 fragment ions.
Marinedrugs 18 00367 g004
Figure 5. Proposed mass fragments resulting from fragmentation of R-cryptone.
Marinedrugs 18 00367 g005
Figure 6. Full molecular network of Chlorella vulgaris ethanol extract showing lipid clusters consisting of diacylglycerophosphoserines, diacylglycerophosphocholines, glycosphingolipids, several small clusters of monoacylglycerophosphoethanolamines (a,b,c,d) and an unidentified cluster. Structures shown are representative examples of the lipids in each cluster.
Marinedrugs 18 00367 g006
Figure 7. Diacylglycerophosphoserine cluster with MS1 showing the nodes. Numbers correspond to lipid number as listed in Table 7.
Marinedrugs 18 00367 g007
Figure 8. Diacylglycerophosphoserines cluster(1); some of the common fragments within the cluster.
Marinedrugs 18 00367 g008
Figure 9. Diacylglycerophosphocholine cluster with MS1 showing the nodes. Numbers correspond to lipid number as listed in Table 7.
Marinedrugs 18 00367 g009
Figure 10. Some common fragments within the diacylglycerophosphocholine cluster based on MS2.
Marinedrugs 18 00367 g010
Figure 11. Glycosphingolipid cluster with MS1 showing the nodes. Numbers correspond to lipid number as listed in Table 7.
Marinedrugs 18 00367 g011
Figure 12. Some common fragments within the glycosphingolipid cluster based on MS1 and MS2.
Marinedrugs 18 00367 g012
Table 1. Fatty acid composition of Chlorella vulgaris. The table shows the peak numbers, the corresponding systematic and trivial names of the fatty acid, designation and percentage composition.
PeakSystematic NameTrivial NameDesignationComposition (%)
1Tetradecanoic acidMyristic acidC141.0
2Pentadecanoic acid-C150.4
3Hexadecanoic acidPalmitic acidC1616.4
49-Hexadecenoic acidPalmitoleic acidC16:1 [n-7]1.5
5Heptadecanoic acidMargaric acidC171.2
67,10-Hexadecadienoic acid-C16:2 [n-6]20.4
7Octadecanoic acidStearic acidC182.8
85-Octadecenoic acid-C18:1 [n-13]0.3
99-Octadecenoic acidOleic acidC18:1 [n-9]4.2
1011-Octadecenoic acid-C18:1 [n-7]2.0
119,12-Octadecadienoic acidLinoleic acidC18:2 [n-6]35.1
12Nonadecanoic acidNonadecylic acidC190.2
139,12,15-Octadecatrienoic acidLinolenic acid C18:3 [n-6]5.2
14Eicosanoic acidArachidic acidC205.7
159-Eicosenoic acid-C20:1 [n-9]0.4
16Eicosadienoic acid-C20:21.3
1711,14,17-Eicosatrienoic acidHomolinolenic acidC20:3 [n-6]0.4
18Heneicosanoic acidHeneicosylic acidC210.2
195,8,11,14-Eicosatetraenoic acidArachidonic acidC20:4 [n-6]0.6
20Docosanoic acidBehenic acidC220.9
Table 2. Carotenoids identified in Chlorella vulgaris. The underlined fragment ion is unique to the corresponding compound. The table shows peak number, name of the carotenoid, retention time in minutes (tR), characteristic absorption frequencies in nanometers (λmax), parent ion [M + H]+ mass per charge ratio, MS/MS mass per charge ratio of fragment ions, and references.
PeakCarotenoidtR (min)λmax (nm)[M + H]+ (m/z)MS/MS (m/z)References
6Vulgaxanthin I3.98424, 476340322 (M + H − 18)+ (20%)
209 (100%), 84 (3%)
Not previously reported
in C. vulgaris
16Neoxanthin14.35414, 436, 462601.4583.4 (M + H − 18)+ (8%)
491.4 (M + H − 92 − 18)+ (10%)
221.2 (100%)
[33,34,36]
17Violaxanthin14.52416, 442601.4583.4 (M + H − 18)+ (6%)
565.4 (M + H − 18 − 18)+ (4%)
509.4 (M + H − 92)+ (4%)
491.4 (M + H − 92 − 18)+ (7%)
221.2 (100%)
[33,34,36,37,38]
18Antheraxanthin14.55–14.60400, 424585.4567.4 (M + H − 18)+ (35%)
475.4 (M + H − 92 − 18)+ (10%)
221.2 (100%)
[35,38]
20Lutein15.35–15.36414, 438, 464569.4551.4 (M + H − 18)+ (25%)
533.4 (M + H − 18 − 18)+ (5%)
[32,33,34,36]
26Astaxanthin19.21372, 436596.6578.6 (M + H − 18)+ (100%)
560.6 (M + H − 18 − 18)+ (10%)
284.3 (50%)
[39]
29β-carotene23.15–23.16412, 440, 468536.4444.4 (M + H − 92)+ (20%)
321.3 (18%)
[33,34,39]
Table 3. Chlorophylic pigments identified in Chlorella vulgaris. The table shows peak number, the corresponding pigment name, retention time in minutes (tR), characteristic absorption frequencies in nanometers (λmax), parent ion [M + H]+ mass per charge ratio, and references.
PeakPigmenttR (min)λmax (nm)[M + H]+ (m/z)References
19Pheophorbide-a14.68268, 474, 536593[34]
27Pheophytin-b21.08222, 436, 528885[34]
28Pheophorbide-b21.37202, 222, 372, 436, 528607[34]
30Pheophytin-a24.28204, 408, 536871[34]
31Chlorophyll-a28.66202, 410, 538894[34]
Table 4. Amino acids, fatty acids, lipids and fatty acyls composition of Chlorella vulgaris. Underlined m/z values indicate intense fragments. The table shows peak numbers, corresponding compound name, retention time in minutes (tR), parent ion [M + H]+ mass per charge ratio and MS/MS mass per charge ratio of fragment ions.
PeakAmino AcidtR (min) [M + H]+ (m/z) MS/MS (m/z)
2Leucine1.44132115, 86, 72, 57
3Phenylalanine2.29166165, 120, 103, 93, 91, 79
5Tryptophan2.72205159, 146, 144, 143, 142, 132, 118, 91, 74
7Lysophosphatidylethanolamine [Lyso-PE]5.44566548, 452, 322, 209, 157, 114, 97, 57
9Disopyramide6.30340322, 306, 212, 196, 114, 74
Fatty acids
13Fatty acid12.22492474, 309, 258, 184, 141, 138, 124, 112, 104, 102, 86, 78, 70, 60
21Nonadecanoyloxyoctadeca-
trienoic acid
15.98575447, 263, 239, 221, 161, 137, 109, 95, 81, 71, 69, 57, 55
121-Acetoxy-2-hydroxy-16-
heptadecyn-4-one
11.70325233, 215, 175, 173, 145, 135, 121, 109, 95, 93, 91, 81, 67
14Hexadecatrienal12.51235226, 211, 173, 153, 133, 119, 111, 109 105, 95, 91, 81, 79, 67, 55 53
Lipids
151-[9Z,12Z-octadecadienoyl]-sn-
glycero -3-phosphocholine
13.44520502, 484, 342, 337, 260, 184, 125, 104, 86, 60
221-hexadecanoyl-2-[5Z,8Z,11Z,
14Z-eicosatetraenoyl]-sn-
glycero-3-phosphocholine
16.35782782, 184, 124, 184, 86
231-tetradecanoyl-2-[11Z,14Z-
eicosadienoyl]-glycero-3-
phosphocholine
16.80758553, 357, 199, 184, 124, 86
241-hexadecanoyl-2-[11Z,14Z-
eicosadienoyl]-glycero-3-
phosphocholine
17.74786688, 552, 501, 474, 215, 184, 125, 104, 87, 86, 60
251-octadecanoyl-2-[11Z,14Z-
eicosadienoyl]-sn-glycero-3-
phosphocholine
18.74814673, 614, 513, 462, 338, 184, 130, 104, 86
Table 5. Composition of vitamins in Chlorella vulgaris. Underlined m/z values indicate intense fragments. The table show peak numbers, corresponding vitamin name, retention time in minutes (tR), parent ion [M + H]+ mass per charge ratio and MS/MS mass per charge ratio of fragment ions.
PeakVitamintR (min) [M + H]+ (m/z) MS/MS (m/z)
1Vitamin B-3
[nicotinic acid]
1.33124123, 80, 78, 53, 45
4Vitamin B-5
[Pantothenic acid]
2.54220142, 116, 103, 90, 87, 86, 73, 72, 70, 57, 55
Table 6. Identified simple sugars and R-cryptone in Chlorella vulgaris. Underlined m/z values indicate intense fragments. The table shows peak numbers, corresponding compound name, retention time in minutes (tR), parent ion [M + H]+mass per charge ratio, MS/MS mass per charge ratio of fragment ions.
PeakCompoundtR (min) [M + H]+ (m/z) MS/MS (m/z)
8(R)-cryptone5.69139138, 111, 83 53
10Glucose6.54181163, 145, 121, 119, 117, 115, 105, 83, 59, 57, 55
11Galactose7.19181163, 145, 135, 133, 121, 119, 117, 115, 105, 103, 91, 87, 73, 59, 57, 55
Table 7. Putative annotation of the lipids from ethanol extract of Chlorella vulgaris. The table shows 48 lipids, their names under each lipid class, molecular formula (MF) and corresponding parent ion [M + H]+ mass per charge ratio.
No.LipidsMFm/z
Diacylglycerophosphoserines
11-[11Z,14Z-eicosadienoyl]-2-docosanoyl-glycero-3-phosphoserineC48H90NO10P872
21-[11Z,14Z-eicosadienoyl]-2-heneicosanoyl-glycero-3-phosphoserineC47H88NO10P858
31-[11Z,14Z-eicosadienoyl]-2-eicosanoyl-glycero-3-phosphoserineC46H86NO10P844
41-[11Z-eicosenoyl]-2-nonadecanoyl-glycero-3-phosphoserineC45H86NO10P832
51-[11Z,14Z-eicosadienoyl]-2-nonadecanoyl-glycero-3-phosphoserineC45H84NO10P830
61-[11Z,14Z-eicosadienoyl]-2-[9Z-nonadecenoyl]-glycero-3-phosphoserineC45H82NO10P828
71-[11Z,14Z-eicosadienoyl]-2-octadecanoyl-glycero-3-phosphoserineC44H82NO10P816
81-[11Z,14Z-eicosadienoyl]-2-heptadecanoyl-glycero-3-phosphoserineC43H80NO10P802
Diacylglycerophosphocholines
91-octadecanoyl-2-[11Z,14Z-eicosadienoyl]-sn-glycero-3-phosphocholineC46H88NO8P814
101-octadecanoyl-2-(5Z,11Z,14Z-eicosatrienoyl)-sn-glycero-3-phosphocholineC46H86NO8P812
111-[9Z-octadecenoyl]-2-[9Z-nonadecenoyl]-glycero-3-phosphocholineC45H86NO8P800
121-octadecanoyl-2-[9Z,12Z-heptadecadienoyl]-glycero-3-phosphocholineC43H82NO8P772
131-[9Z-octadecenoyl]-2-[9Z-pentadecenoyl]-glycero-3-phosphocholineC41H78NO8P744
141-[9Z-octadecenoyl]-2-[9Z-tetradecenoyl]-glycero-3-phosphocholineC40H76NO8P730
Glycosphingolipids
15N-[eicosanoyl]-1-beta-lactosyl-sphinganineC50H97NO13920
16N-[docosanoyl]-eicosasphinganine-1-phospho-[1′-myo-inositol]C48H96NO11P894
17N-[octadecanoyl]-1-beta-lactosyl-sphinganineC48H93NO13892
181-[11Z-eicosenoyl]-2-[13Z,16Z-docosadienoyl]-glycero-3-phosphocholineC50H94NO8P868
19N-[docosanoyl]-sphinganine-1-phospho-[1′-myo-inositol].C46H92NO11P866
20N-[2-hydroxyheptacosanoyl]-1-O-beta-d-glucosyl-15-methylhexadecasphing-4-enineC50H97NO9856
21N-hexacosanoyl-1-O-beta-D-glucosyl-4-hydroxy-15-methylhexadecasphinganineC49H97NO9844
22N-[2-hydroxyhexacosanoyl]-1-O-beta-d-glucosyl-15-methylhexadecasphing-4-enineC49H95NO9842
23N-[2R-hydroxypentacosanoyl]-1-beta-glucosyl-4E,8Z-octadecasphingadienineC49H93NO9840
24N-[17Z-hexacosenoyl]-1-beta-glucosyl-sphing-4-enineC50H95NO8838
25N-pentacosanoyl-1-O-beta-d-glucosyl-4-hydroxy-15-methylhexadecasphinganineC48H95NO9830
261-eicosyl-2-eicosyl-sn-glycero-3-phosphocholineC48H100NO6P818
27N-tetracosanoyl-1-O-beta-d-glucosyl-4-hydroxy-15-methylhexadecasphinganineC47H93NO9816
28N-[2-hydroxytetracosanoyl]-1-O-beta-d-glucosyl-15-methylhexadecasphing-4-enineC47H91NO9814
29N-[15Z-tetracosenoyl]-1-beta-glucosyl-sphinganineC48H93NO8812
301-[3-hydroxyphytanyl]-2-phytanyl-sn-glycero-3-phosphoethanolamineC45H94NO7P792
311-octadecyl-2-docosanoyl-sn-glycero-3-phosphoethanolamineC45H92NO7P790
321-[11Z,14Z-eicosadienoyl]-2-[6Z,9Z,12Z-octadecatrienoyl]-glycero-3-phosphoethanolamineC43H76NO8P766
331-[9Z,12Z,15Z-octadecatrienoyl]-2-[8Z,11Z,14Z-eicosatrienoyl]-glycero-3-phosphoethanolamineC43H74NO8P764
34N-[2-hydroxyhexacosanoyl]-4R-hydroxysphinganineC44H89NO5712
35N-[2-hydroxyheptacosanoyl]-15-methylhexadecasphing-4-enineC44H87NO4694
36N-[2-hydroxypentacosanoyl]-15-methylhexadecasphing-4-enineC42H83NO4666
371,2-Dihexadecyl-sn-glycero-3-phosphoethanolamineC37H78NO6P664
38N-[2-hydroxy-hexacosanoyl]-tetradecasphing-4-enineC40H79NO4638
391,2-ditetradecyl-sn-glycero-3-phospho-N, N-dimethylethanolamineC35H74NO6P636
40N-[2R-hydroxyicosanoyl]-8Z-octadecasphingenineC38H75NO4610
Separate clusters of monoacylglycerophosphoethanolamines and derivatives
41(a)N-[2-hydroxyhexacosanoyl]-sphinganineC44H89NO4696
42N-[2R-hydroxyhexadecanoyl]-4R-hydroxy-20E-hexacosasphingenineC42H83NO5682
43(b)N-[2R,3-dihydroxyhexacosanoyl]-4R-hydroxy-8E-octadecasphingenine.C44H87NO6726
44N-[2-hydroxyhexacosanoyl]-4R-hydroxysphinganineC44H89NO5712
45(c) 1-[11Z,14Z-eicosadienoyl]-2-[9Z-tetradecenoyl]-glycero-3-phospho-[1′-sn-glycerol]C40H73O10P745
461-[11Z,14Z-eicosadienoyl]-2-dodecanoyl-glycero-3-phospho-[1′-sn-glycerol]C38H71O10P719
47(d) 1-[11Z,14Z-eicosadienoyl]-glycero-3-phosphoethanolamineC25H48NO7P506
482-[11Z,14Z,17Z-eicosatrienoyl]-sn-glycero-3-phosphoethanolamineC25H46NO7P504

