Autotrophic and Heterotrophic Growth Conditions Modify Biomolecole Production in the Microalga Galdieria sulphuraria (Cyanidiophyceae, Rhodophyta)

 , ,
, ,  , ,
, ,  , , , , and
Abstract
:1. Introduction
2. Results
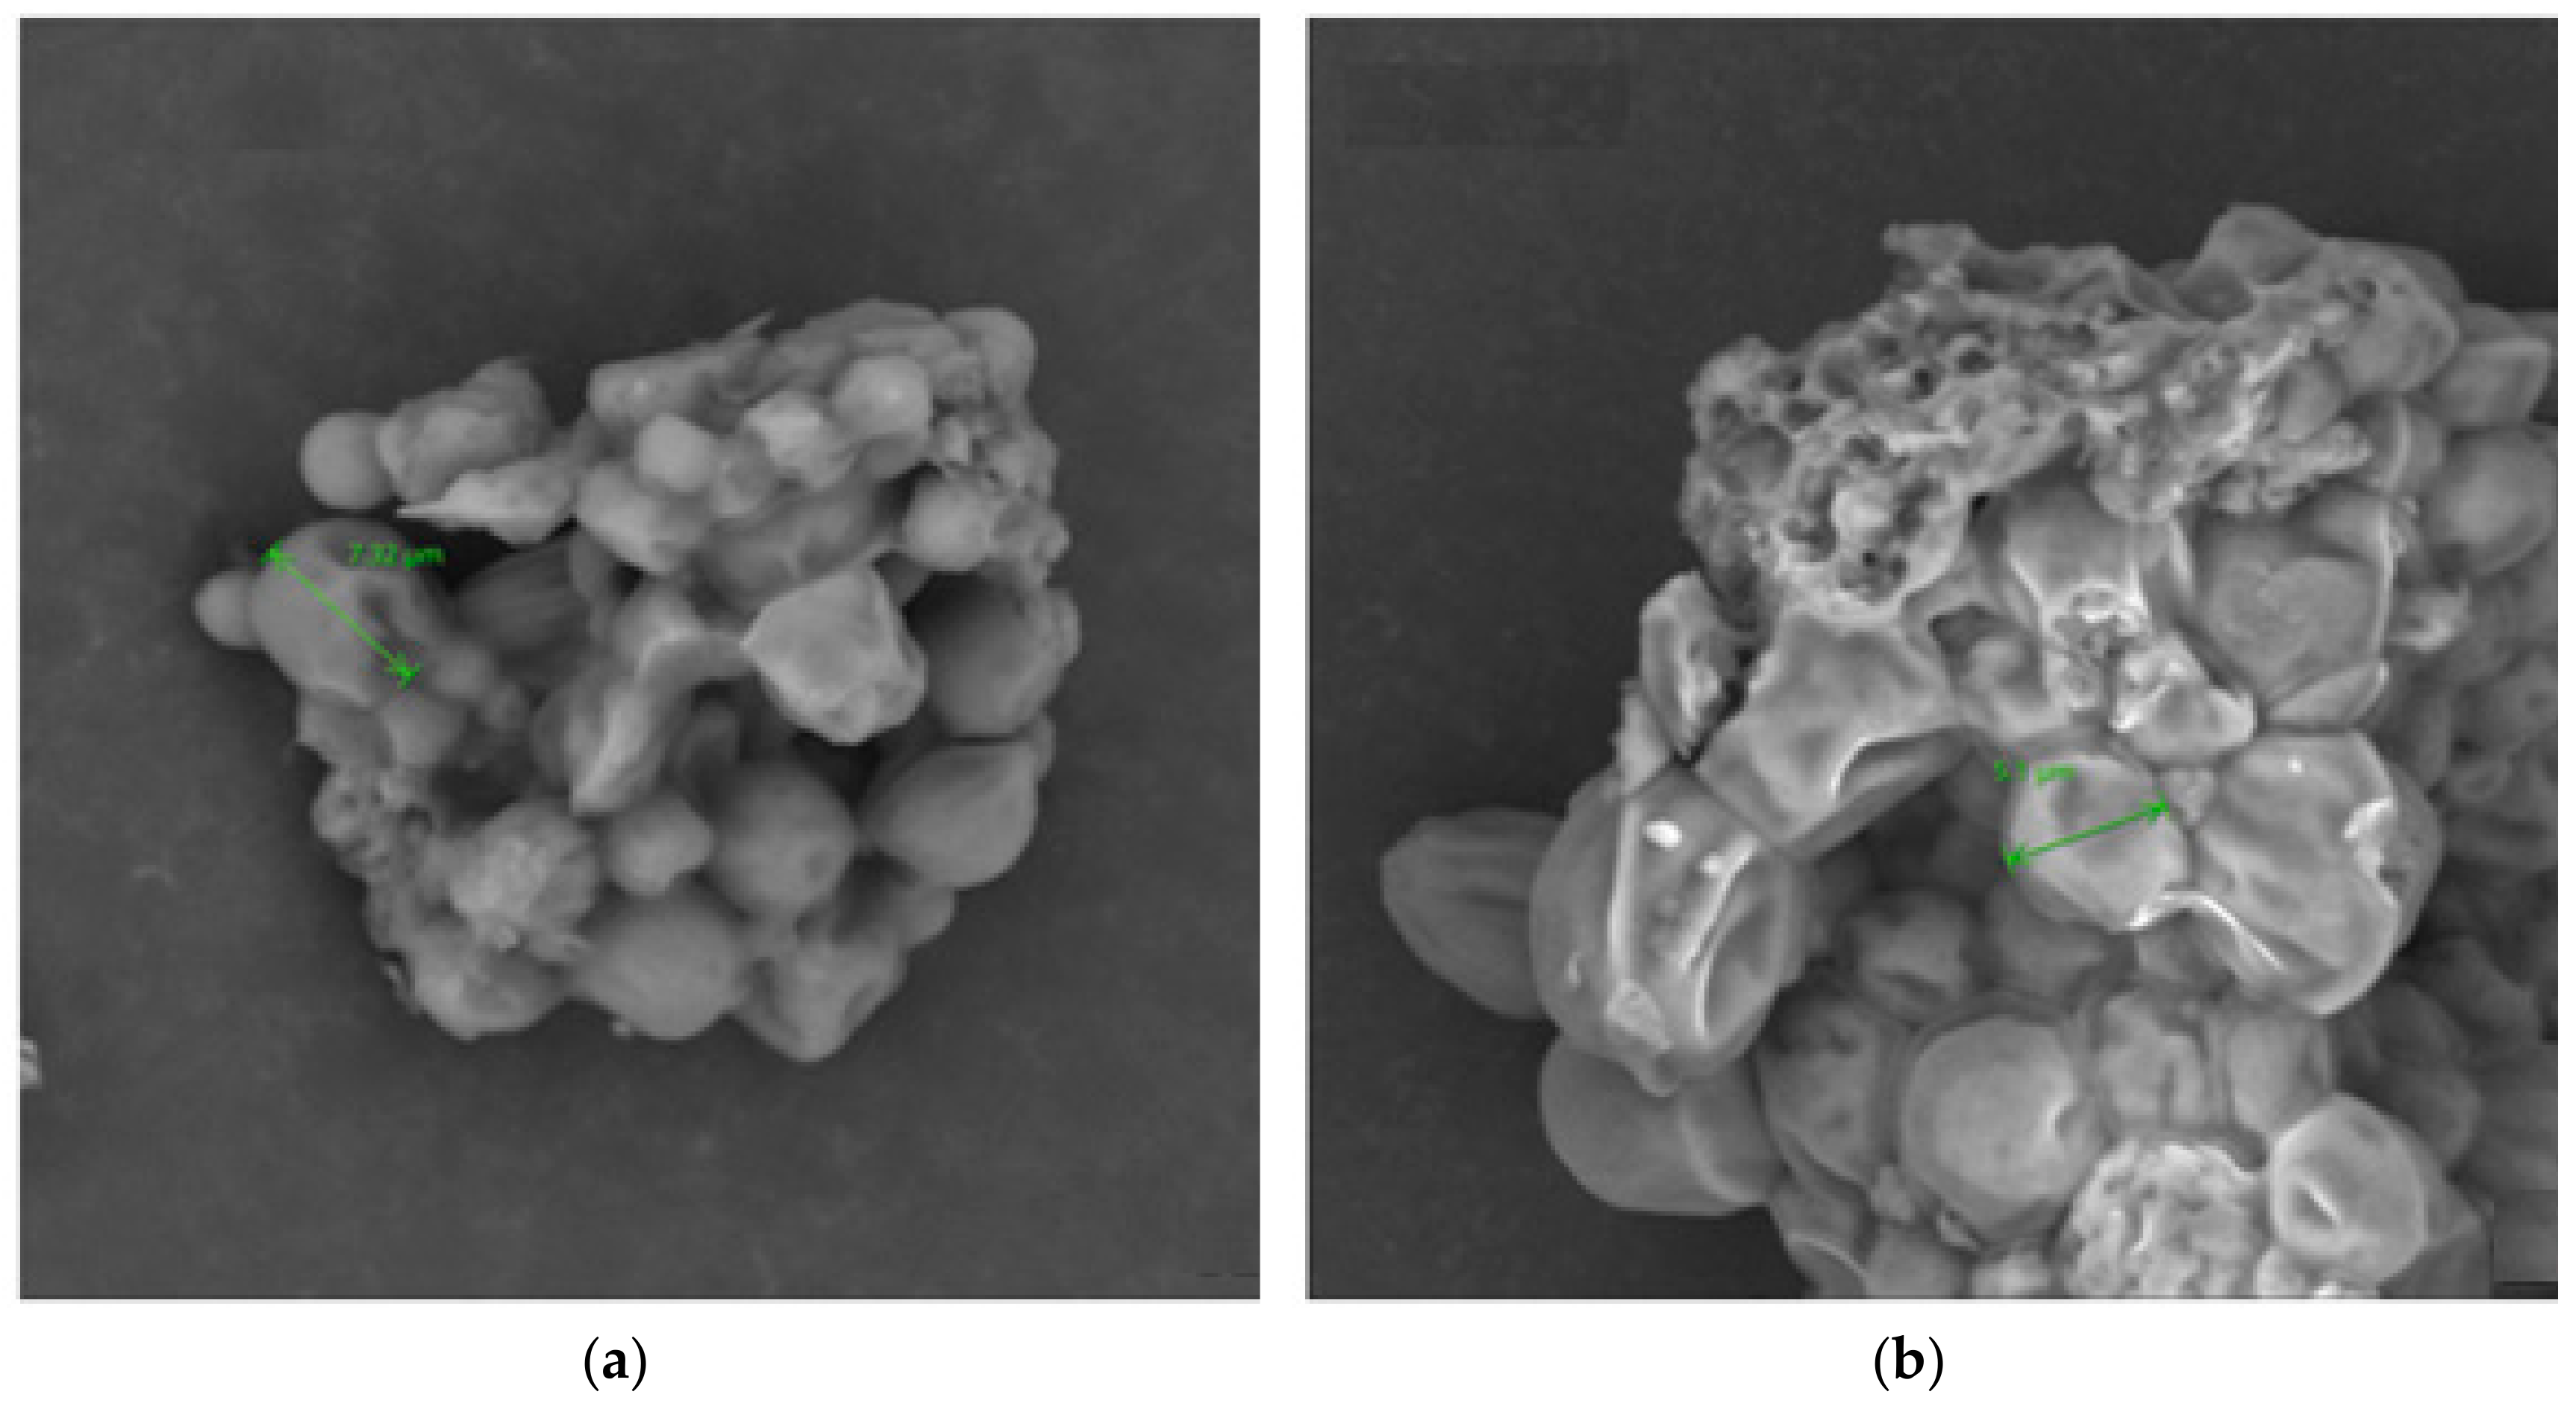
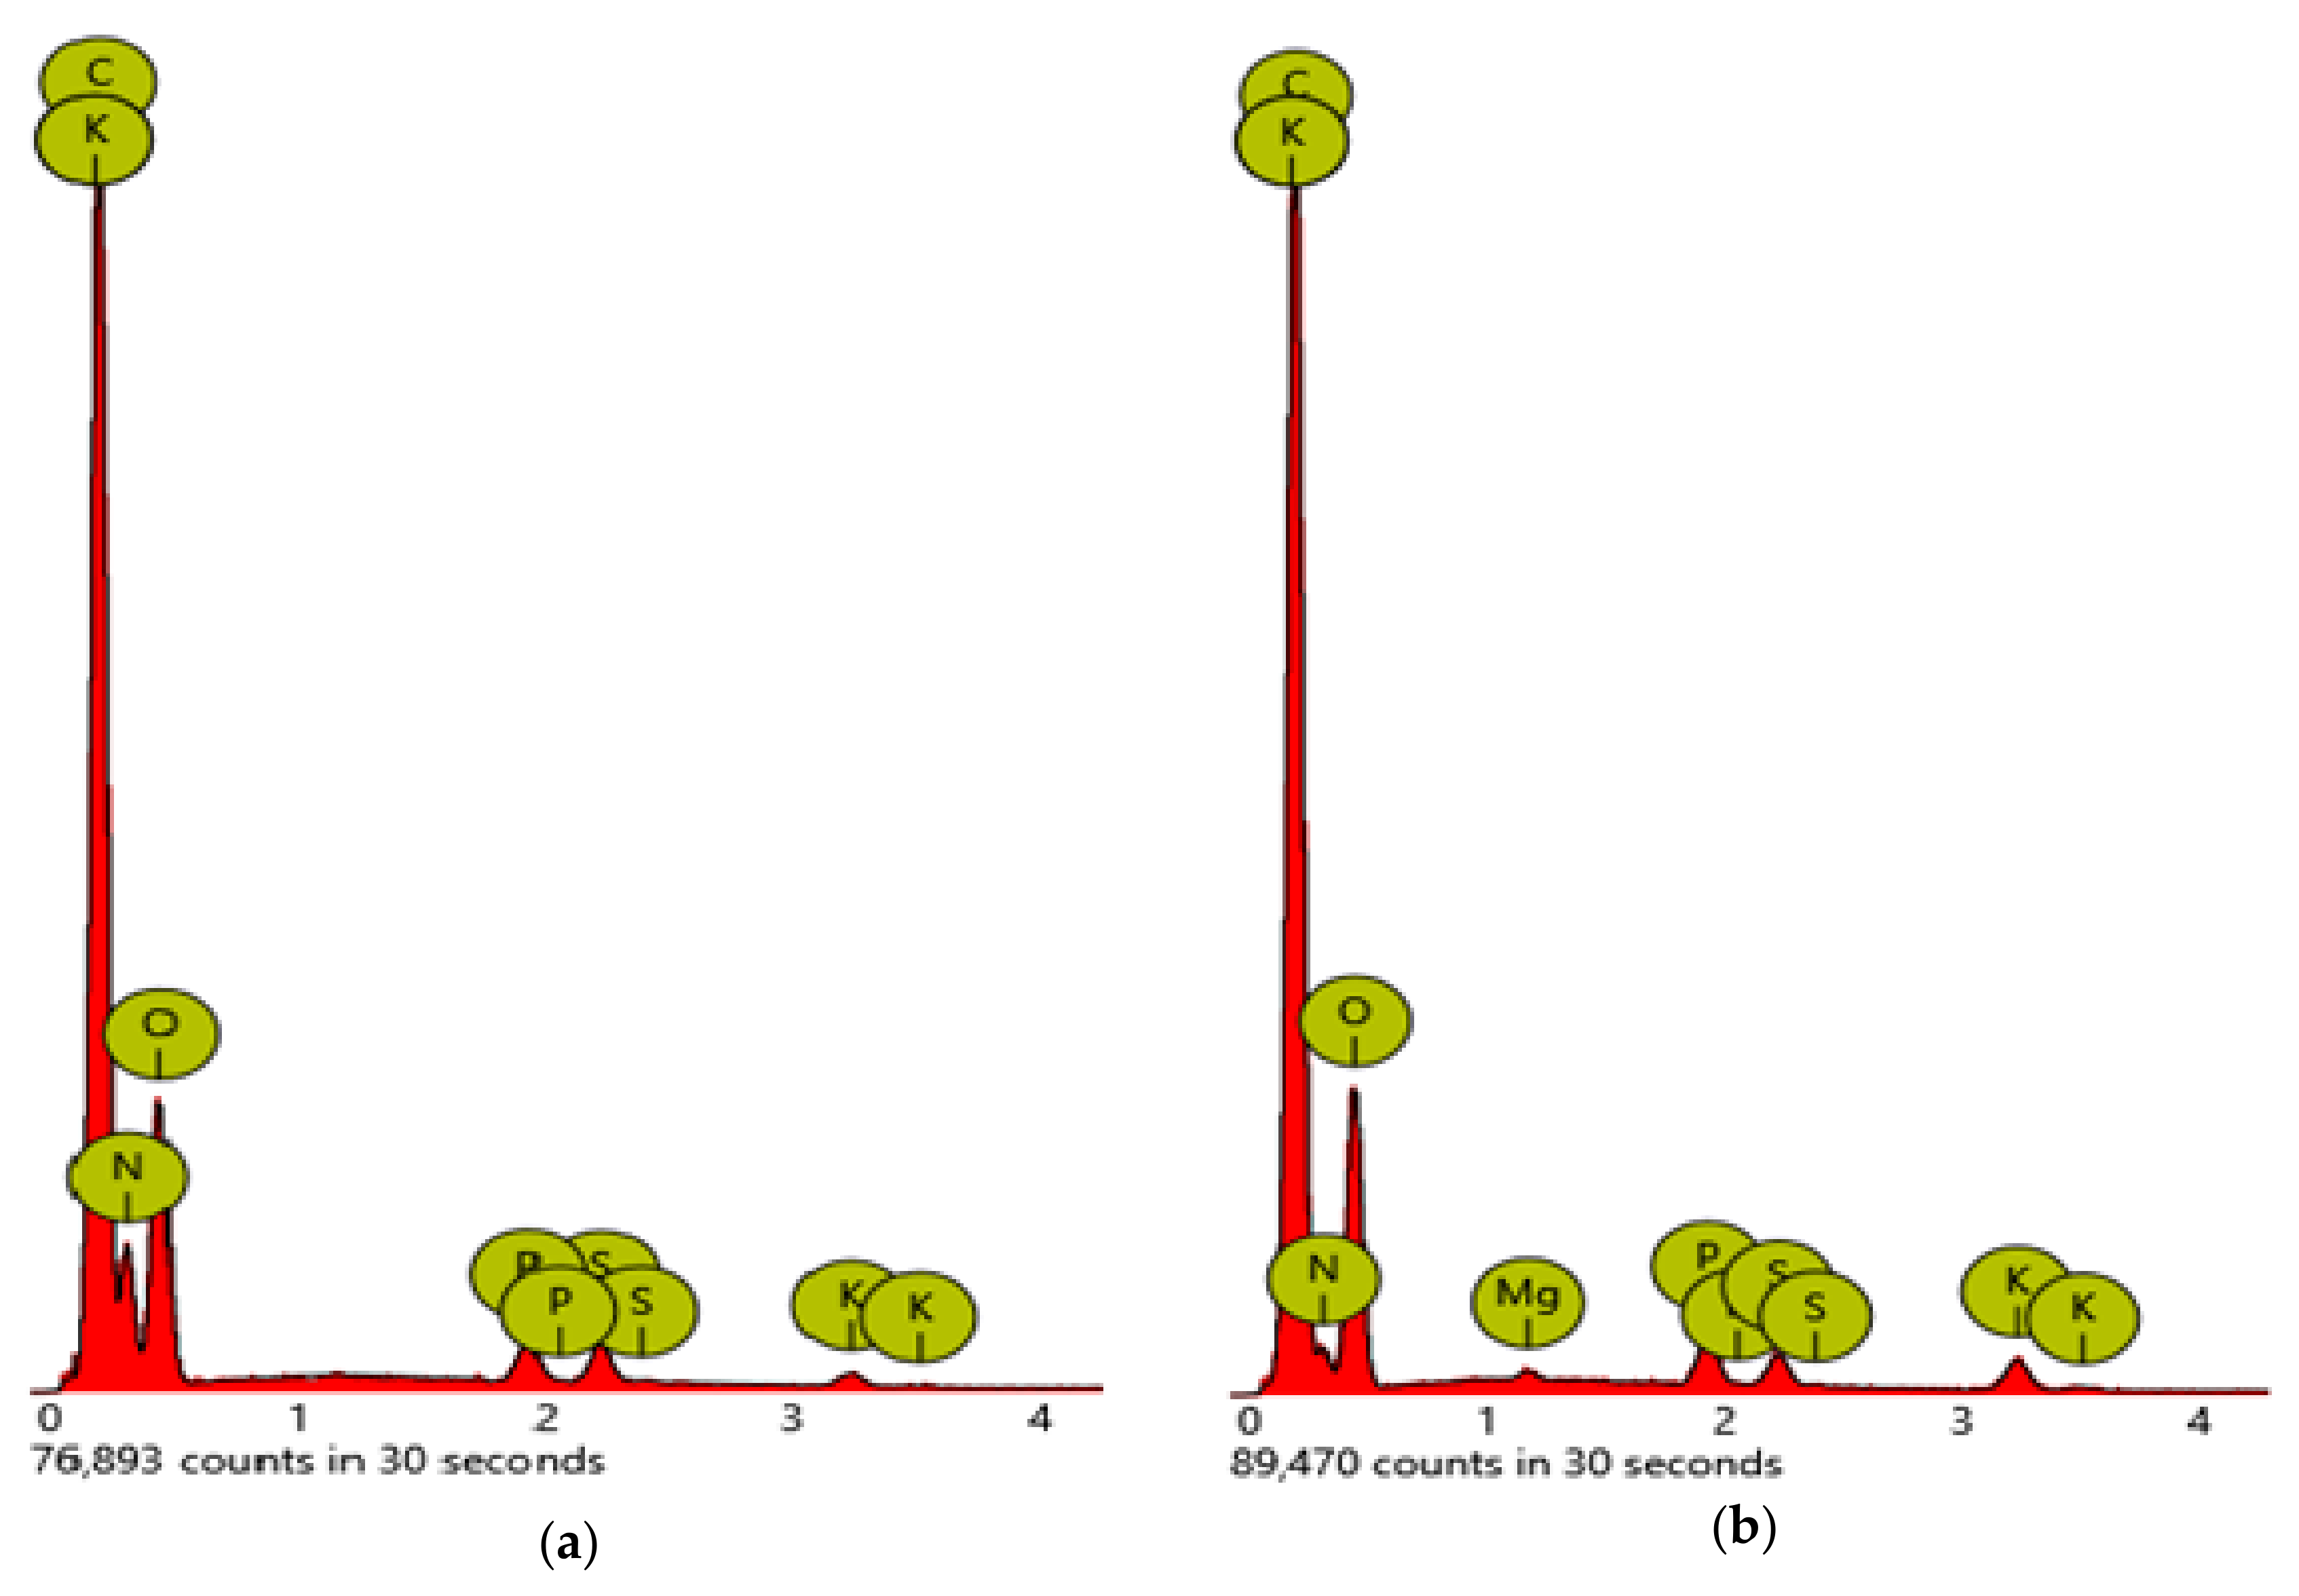
2.1. Scanning Electron Microscopy
2.2. GC-MS Analysis
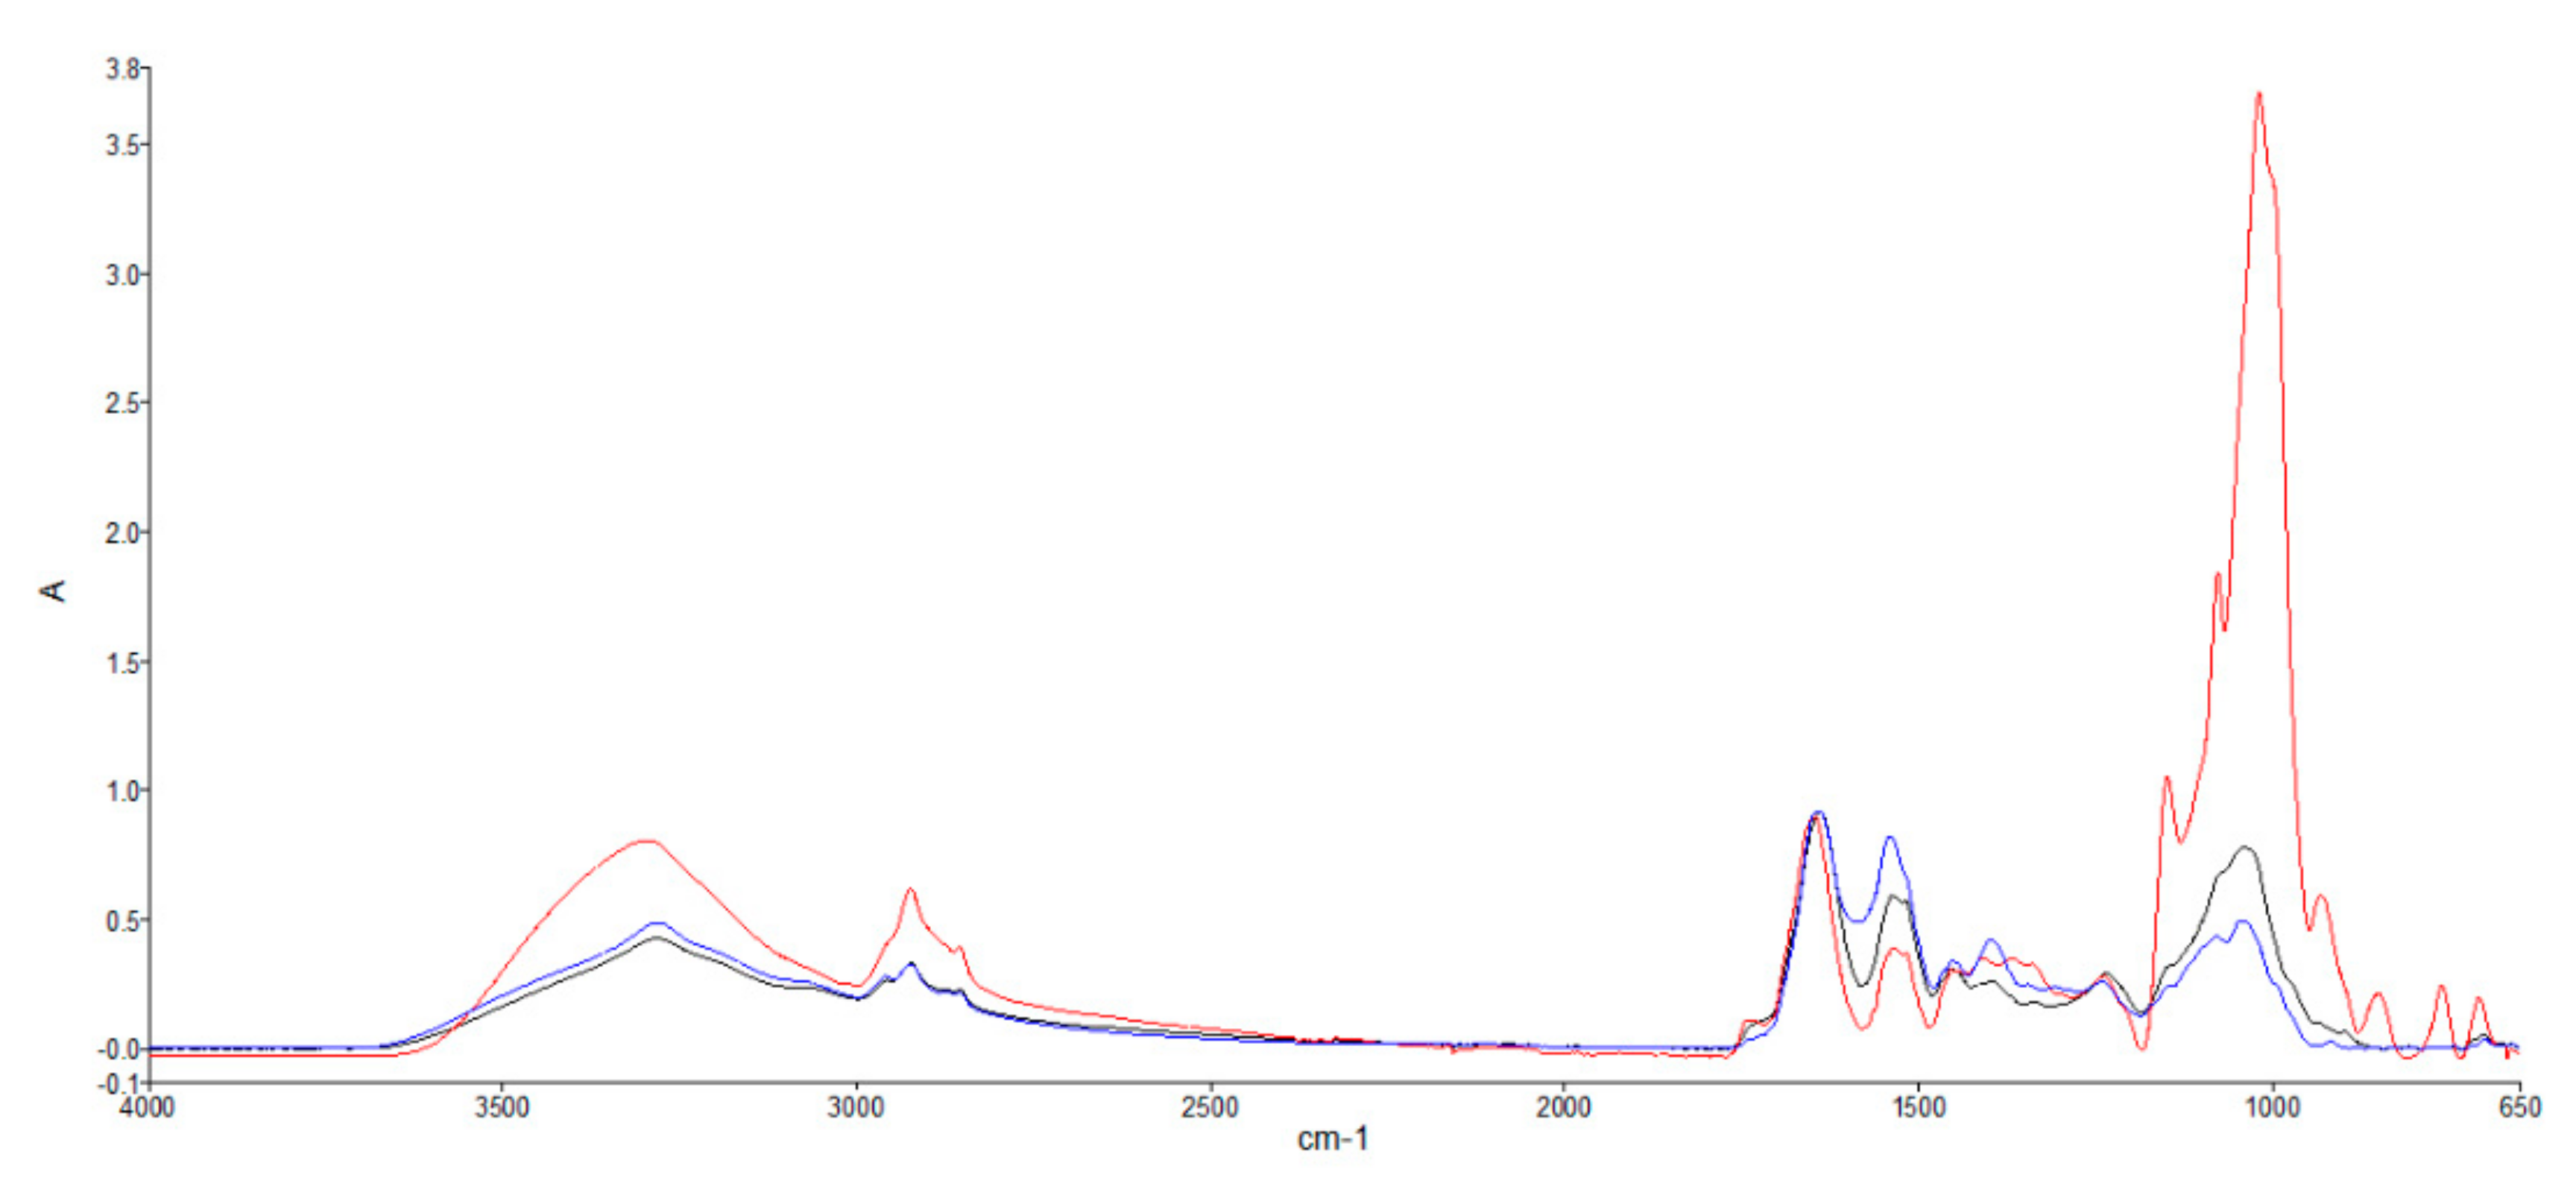
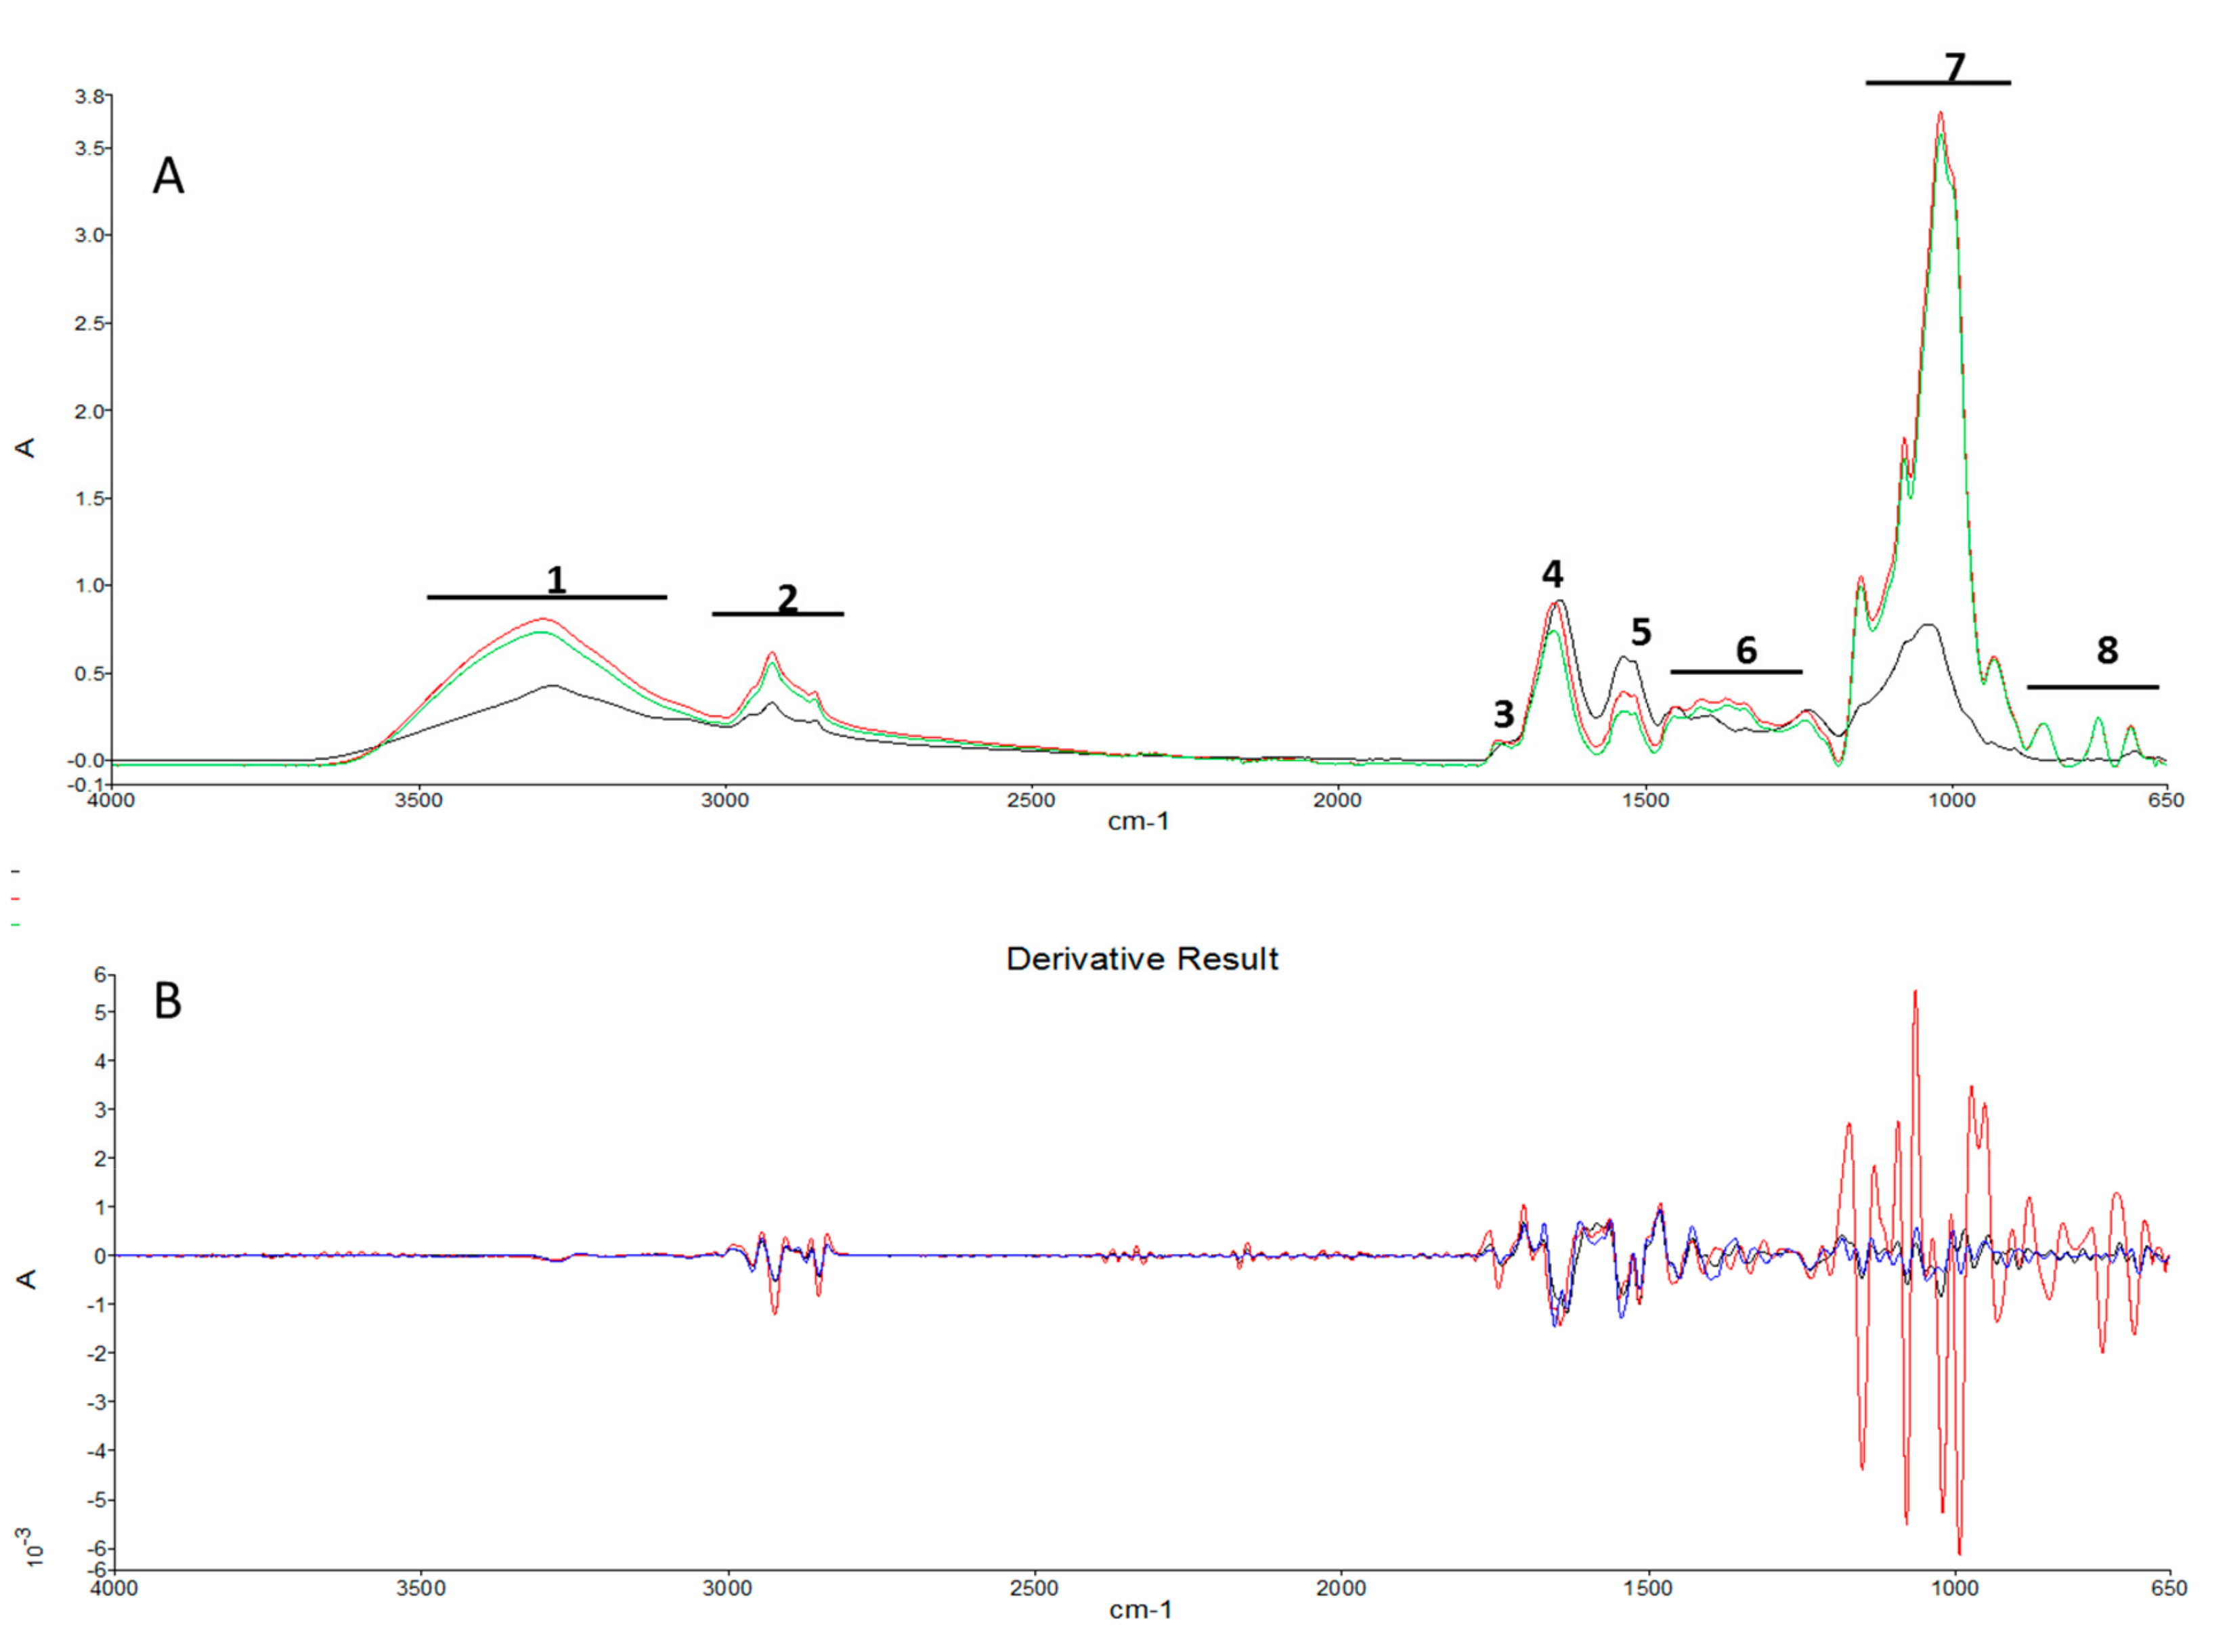
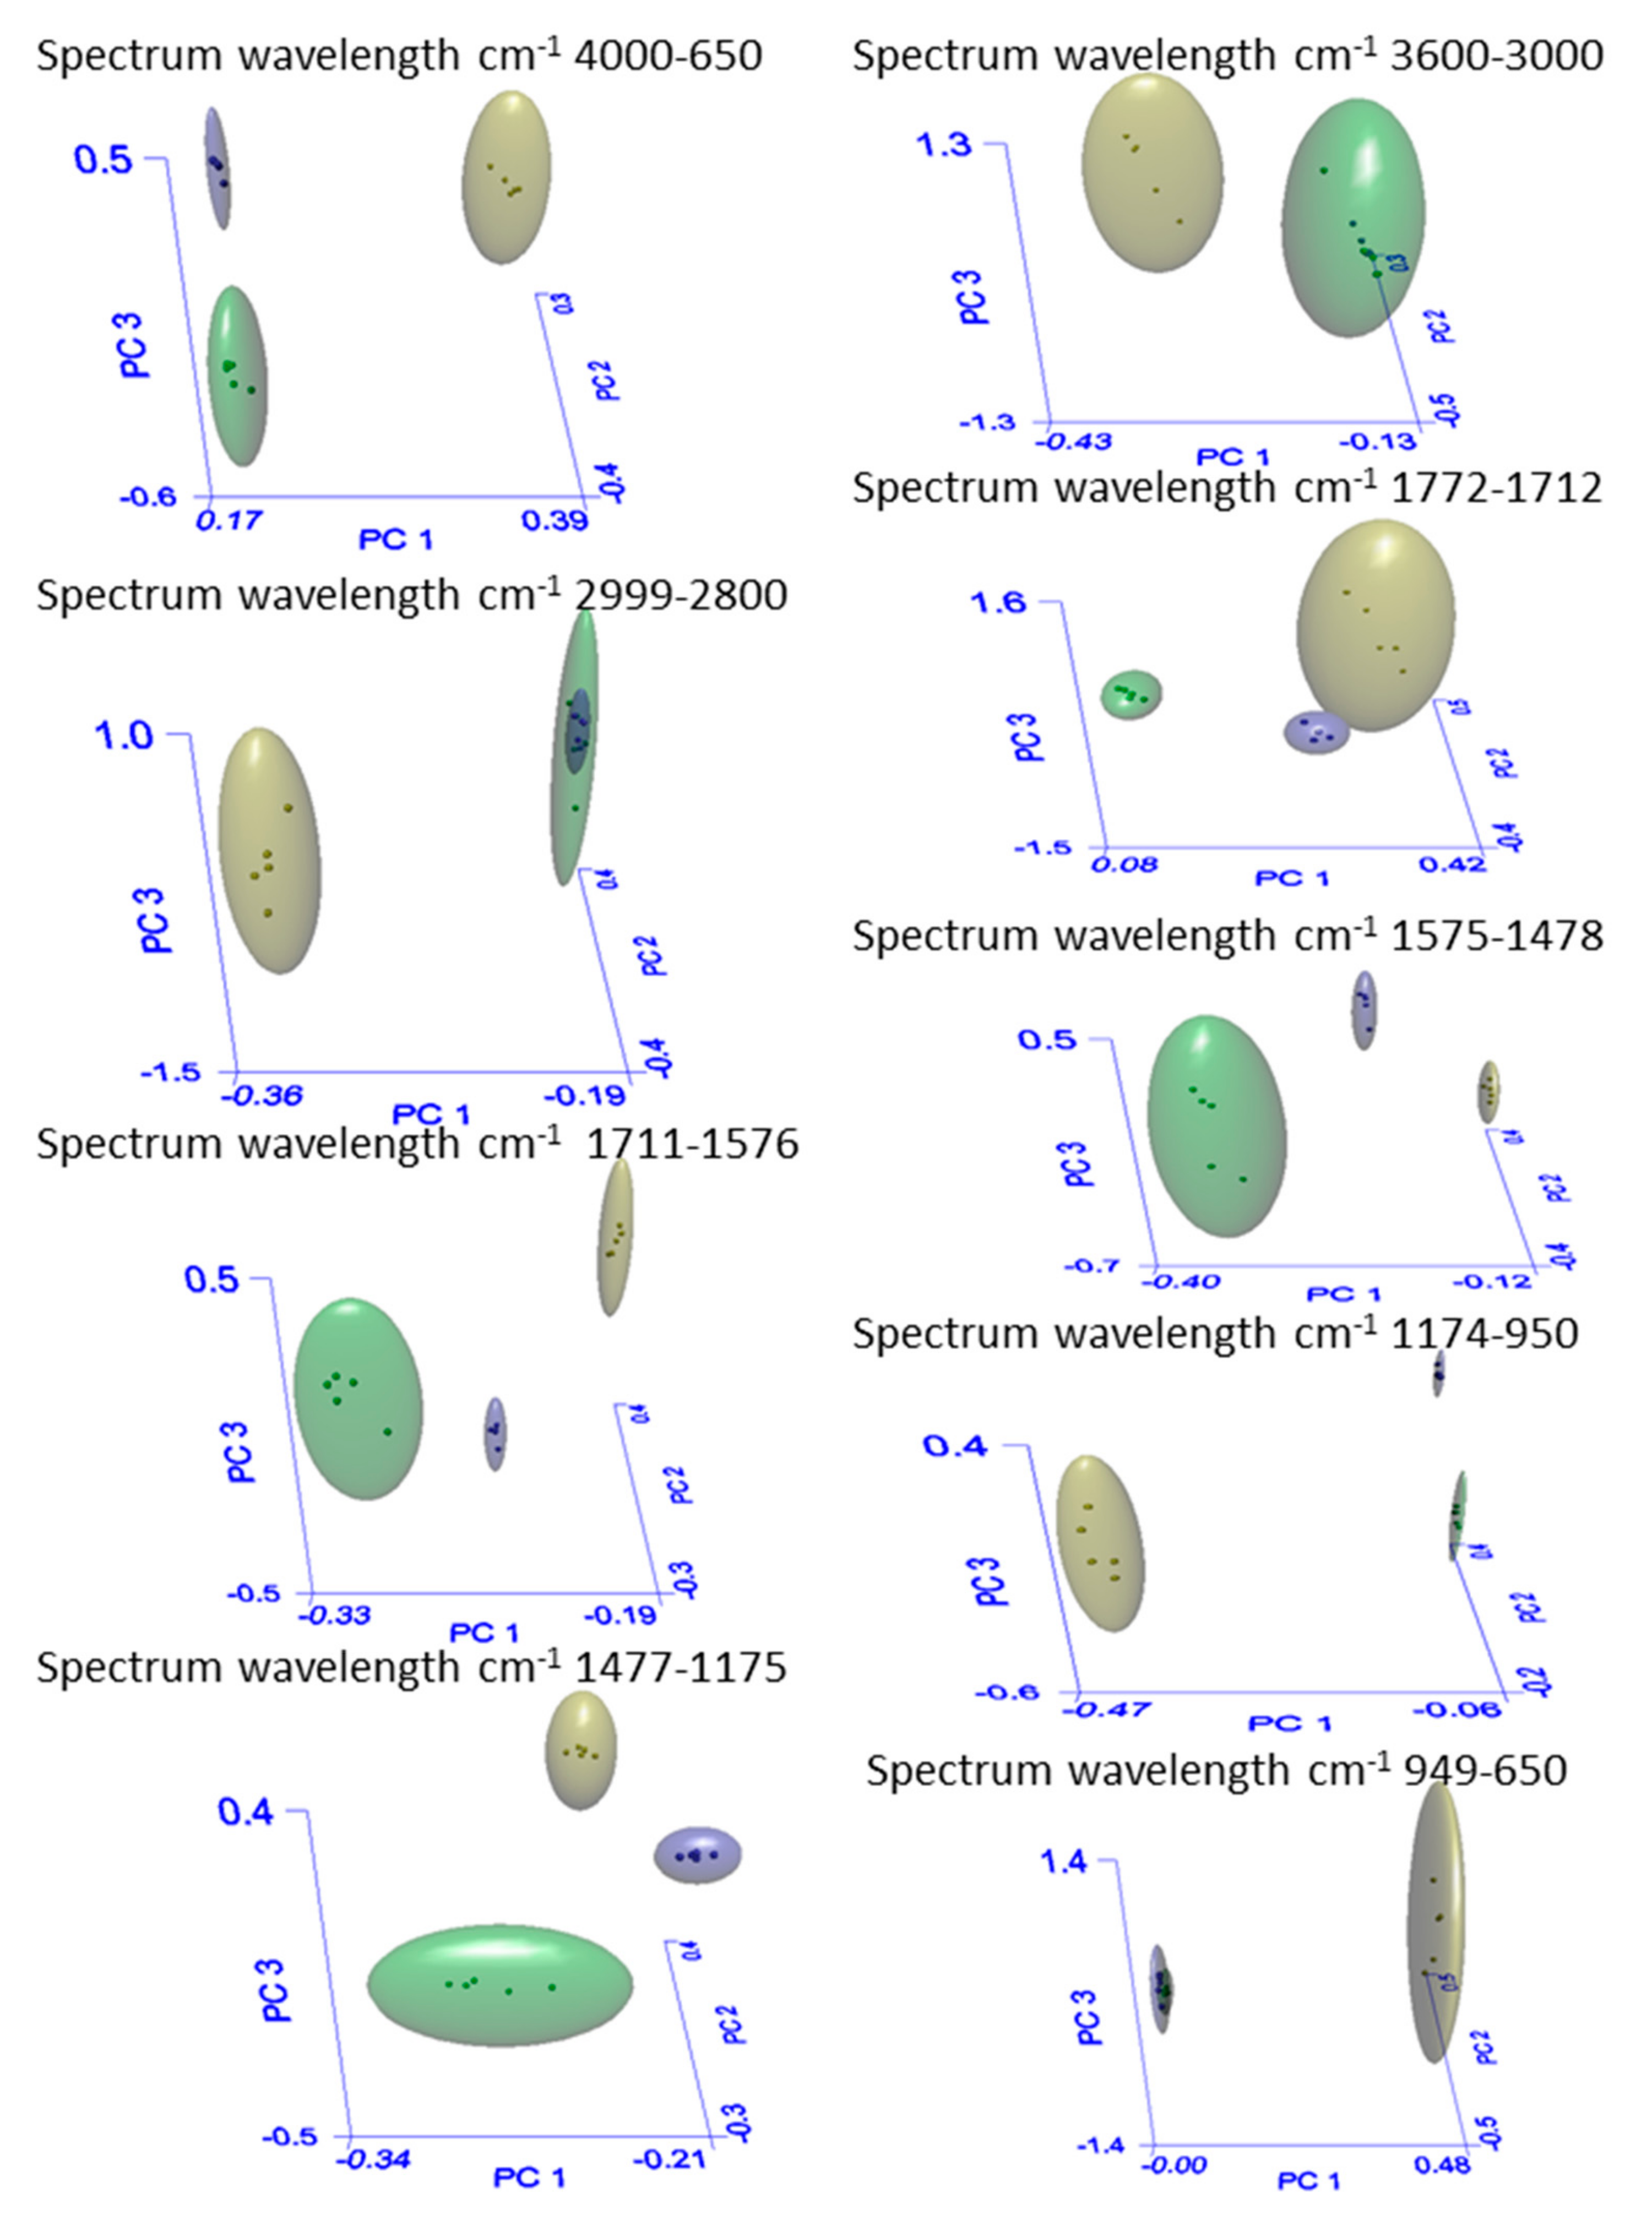
2.3. ATR-FTIR
3. Discussion
3.1. Scanning Electron Microscopy
3.2. GC-MS Analysis
3.3. Infrared Spectrophotometry
4. Materials and Methods
4.1. Strain and Growth Medium
4.2. Growth Conditions
4.3. Scanning Electron Microscopy
4.4. Lipid Extraction
4.5. GC-MS Analysis
4.6. ATR-FTIR Analysis
4.7. Statistical Analysis
5. Conclusions
Author Contributions
Funding
Conflicts of Interest
Abbreviations
References
- Afonin, S.A.; Barinova, S.S.; Krassilov, V.A. A bloom of Tympanicysta Balme (green algae of zygnematalean affinities) at the Permian-Triassic boundary. Geodiversitas 2001, 23, 481–487. [Google Scholar]
- Sharma, N.K.; Rai, A.K. Biodiversity and biogeography of microalgae: Progress and pitfalls. Environ. Rev. 2011, 19, 1–15. [Google Scholar] [CrossRef]
- Khan, M.I.; Shin, J.H.; Kim, J.D. The promising future of microalgae: Current status, challenges, and optimization of a sustainable and renewable industry for biofuels, feed, and other products. Microb. Cell Fact. 2018, 17, 36. [Google Scholar] [CrossRef] [PubMed]
- de Freitas Coêlho, D.; Tundisi, L.L.; Cerqueira, K.S.; da Silva Rodrigues, J.R.; Mazzola, P.G.; Tambourgi, E.B.; de Souza, R.R. Microalgae: Cultivation Aspects and Bioactive Compounds. Braz. Arch. Biol. Technol. 2019, 62. [Google Scholar] [CrossRef]
- Barkia, I.; Saari, N.; Schonna, R. Manning Microalgae for High-Value Products Towards Human Health and Nutrition. Mar. Drugs 2019, 17, E304. [Google Scholar] [CrossRef] [Green Version]
- Ku, C.S.; Pham, T.X.; Park, Y.; Kim, B.; Shin, M.S.; Kang, I.; Lee, J. Edible blue-green algae reduce the production of pro-inflammatory cytokines by inhibiting NF-κB pathway in macrophages and splenocytes. BBA 2013, 1830, 2981–2988. [Google Scholar] [CrossRef] [Green Version]
- Pham, T.X.; Lee, Y.; Bae, M.; Hu, S.; Kang, H.; Kim, M.B.; Park, Y.K.; Lee, J.Y. Spirulina supplementation in a mouse model of diet-induced liver fibrosis reduced the pro-inflammatory response of splenocytes, reduced the pro-inflammatory response of splenocytes. Br. J. Nutr. 2019, 121, 748–755. [Google Scholar] [CrossRef] [PubMed]
- Samuels, R.; Mani, U.V.; Iyer, U.M.; Nayak, U.S. Hypocholesterolemic effect of spirulina in patients with hyperlipidemic nephrotic syndrome. J. Med. Food 2002, 5, 91–96. [Google Scholar] [CrossRef]
- Yang, C.; Hua, Q.; Shimizu, K. Energetics and carbon metabolism during growth of microalgal cells under photoautotrophic, mixotrophic and cyclic light-autotrophic/dark-heterotrophic conditions. Biochem. Eng. 2000, 6, 87–102. [Google Scholar] [CrossRef]
- Kim, S.; Park, J.; Cho, Y.B.; Hwang, S.Y. Growth rate, organic carbon and nutrient removal rates of Chlorella sorokiniana in autotrophic, heterotrophic and mixotrophic conditions. Bioresour. Technol. 2013, 144, 8–13. [Google Scholar] [CrossRef]
- Perez Garcia, O.; De Bashan, L.E.; Hernandez, J.P.; Bashan, Y. Efficiency of growth and nutrient uptake from wastewater by heterotrophic, autotrophic and mixotrophic cultivation of Chlorella vulgaris immobilized with Azospirillum brasilense. J. Phycol. 2010, 46, 800–812. [Google Scholar] [CrossRef]
- Liang, Y.; Sarkany, N.; Cui, Y. Biomass and lipid productivities of Chlorella vulgaris under autotrophic, heterotrophic and mixotrophic growth conditions. Biotechnol. Lett. 2009, 31, 1043–1049. [Google Scholar] [CrossRef] [PubMed]
- Yoon, H.S.; Ciniglia, C.; Wu, M.; Comeron, J.M.; Pinto, G.; Bhattacharya, D. Establishment of endolithic populations of extremophilic Cyanidiales (Rhodophyta). BMC Evol. Biol. 2006, 6, 78. [Google Scholar] [CrossRef] [PubMed] [Green Version]
- Reeb, V.; Bhattacharya, D. The Thermo-Acidophilic Cyanidiophyceae (Cyanidiales). In Red Algae in the Genomic Age, Cellular Origin, Life in Extreme Habitats and Astrobiology; Seckbach, J., Chapman, D.J., Eds.; Springer: Dordrecht, The Netherlands, 2010; Volume 13, pp. 409–426. [Google Scholar]
- da Silva, T.L.; Reis, A. Scale-up Problems for the Large Scale Production of Algae. In Algal Biorefinery: An Integrated Approach; Das, D., Ed.; Capital Publishing Company: Kolkata, West Bengal, India, 2015; pp. 125–149. [Google Scholar]
- Graziani, G.; Schiavo, S.; Nicolai, M.A.; Buono, S.; Fogliano, V.; Pinto, G.; Pollio, A. Microalgae as human food: Chemical and nutritional characteristics of the thermo-acidophilic microalga Galdieria sulphuraria. Food Funct. 2013, 4, 144–152. [Google Scholar] [CrossRef]
- Stadnichuk, I.N.; Rakhimberdieva, M.G.; Bolychevtseva, Y.V.; Yurina, N.P.; Karapetyan, N.V.; Selyakh, I.O. Inhibition by glucose of chlorophyll a and phycocyanobilin biosynthesis in the unicellular red alga Galdieria partita at the stage of coproporphyrinogen III formation. Plant Sci. 1998, 1, 11–23. [Google Scholar] [CrossRef]
- Rigano, C.; Fuggi, A.; Di Martino Rigano, V.; Aliotta, G. Studies on utilization of 2-ketoglutarate, glutamate and other amino acids by the unicellular alga Cyanidium caldarium. Arch. Microbiol. 1976, 107, 133–138. [Google Scholar] [CrossRef]
- Rigano, C.; Aliotta, G.; Rigano, V.D.; Fuggi, A.; Vona, V. Heterotrophic growth patterns in the unicellular alga Cyanidium caldarium. A possible role for threonine dehydrase. Arch. Microbiol. 1977, 113, 191–196. [Google Scholar] [CrossRef]
- Gross, W.; Schnarrenberger, C. Purification and characterization of a galactose-1-phosphate: UDP-glucose uridyltransferase from the red alga Galdieria sulphuraria. Eur. J. Biochem. 1995, 234, 258–263. [Google Scholar] [CrossRef]
- Gross, W.; Lenze, D.; Nowitzki, U.; Weiske, J.; Schnarrenberger, C. Characterization, cloning, and evolutionary history of the chloroplast and cytosolic class I aldolases of the red alga Galdieria sulphuraria. Gene 1999, 230, 7–14. [Google Scholar] [CrossRef]
- Chandra, R.; Iqbal, H.M.N.; Vishal, G.; Lee, H.S.; Nagra, S. Algal biorefinery: A sustainable approach to valorize algal-based biomass towards multiple product recovery. Bioresour. Technol. 2019, 278, 346–359. [Google Scholar] [CrossRef] [PubMed]
- Dhivya, R.; Manimegalai, K. Preliminary Phytochemical Screening and GC- MS Profiling of Ethanolic Flower Extract of Calotropis gigantea Linn. (Apocynaceae). J. Pharmacogn. Phytochem. 2013, 2, 28–32. [Google Scholar]
- Russell, E.; Lewis Pharm, D. Current Concepts in Antifungal Pharmacology. Mayo Clin. Proc. 2011, 86, 805–817. [Google Scholar]
- Montes D’Oca, M.G.; Viêgas, C.V.; Lemões, J.S.; Miyasaki, K.E.; Morón-Villarreyes, J.A.; Primel, E.G.; Abreu, P.C. Production of FAMEs from several microalgal lipidic extracts and direct transesterification of the Chlorella pyrenoidosa. Biomass Bioenergy 2011, 35, 1533–1538. [Google Scholar] [CrossRef] [Green Version]
- Movasaghi, Z.; Rehman, S.; Rehman, I. Fourier transform infrared (FTIR) spectroscopy of biological tissues. Appl. Spectrosc. Rev. 2008, 43, 134–179. [Google Scholar] [CrossRef]
- Malek, K.; Wood, B.R.; Bambery, K.R. FTIR imaging of tissues: Techniques and methods of analysis. In Optical Spectroscopy and Computational Methods in Biology and Medicine; Springer: Dordrecht, The Netherlands, 2013; pp. 419–473. [Google Scholar]
- Hirschmugl, C.J.; Bayarri, Z.E.; Bunta, M.; Holt, J.B.; Giordano, M. Analysis of the nutritional status of algae by Fourier transform infrared chemical imaging. Infrared Phys. Technol. 2006, 49, 57–63. [Google Scholar] [CrossRef]
- He, J.; Rodriguez-Saona, L.E.; Giusti, M.M. Mid infrared spectroscopy for juice authentications rapid differentiation of commercial juices. J. Agric. Food Chem. 2007, 55, 4443–4452. [Google Scholar] [CrossRef]
- Jun, T.D.; Chao, W.; Yubin, M.; Chen, S.Z. Two-step in situ biodiesel production from microalgae with high free fatty acid content. Bioresour. Technol. 2013, 136, 8–15. [Google Scholar]
- Anjai, P.A.; Singh, V.B.N. Biodiesel production by esterification of free fatty acid over sulfated zirconia. Renew. Energy 2013, 51, 227–233. [Google Scholar]
- Olivieri, G.; Marzocchella, A.; Andreozzi, R.; Pinto, G.; Pollio, A. Biodiesel production from Stichococcus strains at laboratory scale. J. Chem. Technol. Biot. 2011, 86, 776–783. [Google Scholar] [CrossRef]
- Islam, M.T.; de Alencar, M.V.; da Conceição Machado, K.; da Conceição Machado, K.; de Carvalho Melo-Cavalcante, A.A.; de Sousa, D.P.; de Freitas, R.M. Phytol in a pharma-medico-stance. Chem. Biol. Interact 2015, 240, 60–73. [Google Scholar] [CrossRef]
- Netscher, T. Synthesis of vitamin E. Vitam. Horm. 2007, 76, 155–202. [Google Scholar] [PubMed]
- Daines, A.M.; Payne, J.R.; Humphries, M.E.; Abell, A.D. The synthesis of naturally occurring Vitamin K and Vitamin K analogues. Curr. Org. Chem. 2003, 7, 1625–1634. [Google Scholar] [CrossRef] [Green Version]
- Rodrigues, M.L. The Multifunctional Fungal Ergosterol. mBio 2018, 9, e01755-18. [Google Scholar] [CrossRef] [PubMed] [Green Version]
- Luo, X.; Su, P.; Zhang, W. Advances in Microalgae-Derived Phytosterols for Functional Food and Pharmaceutical Applications. Mar. Drugs 2015, 13, 4231–4254. [Google Scholar] [CrossRef] [PubMed]
- Sankaran, M.; Isabella, S.; Amaranth, K.S. Anti proliferative Potential of Ergosterol: A Unique Plant Sterol on Hep2 Cell Line. Int. J. Pharm. Sci. Rev. Res. 2017, 5, 1736–1742. [Google Scholar]
- Kobori, K.; Yoshida, M.; Ohnishi-Kameyama, M.; Shinmoto, H. Ergosterol peroxide from an edible mushroom suppresses infiammatory responses in RAW264.7 macrophages and growth of HT29 colon adenocarcinoma cells. Br. J. Pharmacol. 2007, 150, 209–219. [Google Scholar] [CrossRef] [Green Version]
- Kim, S.K.; Ta, Q.V. Potential beneficial effects of marine algal sterols on human health. Food Nutr. Res. 2011, 64, 191–198. [Google Scholar]
- Shimizu, T.; Kawai, J.; Ouchi, K.; Kikuchi, H.; Osima, Y.; Hidemi, R. Agarol, an ergosterol derivative from Agaricus blazei, induces caspase-independent apoptosis in human cancer cells. Int J Oncol. 2016, 48, 1670–1678. [Google Scholar] [CrossRef] [Green Version]
- Chen, S.; Yong, T.; Zhang, Y.; Su, J.; Jiao, C.; Xie, Y. Anti-tumor and anti-angiogenic Ergosterols from Ganoderma lucidum. Front. Chem. 2017, 5, 85. [Google Scholar] [CrossRef] [Green Version]
- Allman-Farinelli, M.A.; Gomes, K.; Favaloro, E.J.; Petocz, P.A. Diet rich in high-oleic-acid sunflower oil favorably alters low-density lipoprotein cholesterol, triglycerides, and factor VII coagulant activity. J. Am. Diet Assoc. 2005, 105, 1071–1079. [Google Scholar] [CrossRef]
- Saini, R.K.; Keum, Y.S. Omega-3 and omega-6 polyunsaturated fatty acids: Dietary sources, metabolism, and significance. A review. Life Sci. 2018, 203, 255–267. [Google Scholar] [CrossRef] [PubMed]
- Tocher, D.R. Metabolism and Functions of Lipids and Fatty Acids in Teleost Fish. Rev. Fish. Sci. 2003, 11, 107–184. [Google Scholar] [CrossRef]
- Hunter, J.E.; Zhang, J.; Kris-Etherton, P.M. Cardiovascular disease risk of dietary stearic acid compared with trans, other saturated, and unsaturated fatty acids: A systematic review. Am. J. Clin. Nutr. 2009, 91, 46–63. [Google Scholar] [CrossRef] [Green Version]
- Baker, M.J.; Trevisan, J.; Bassan, P.; Bhargava, R.; Butler, H.J.; Dorling, K.M.; Fielden, P.M.; Fogarty, S.W.; Fullwood, N.J.; Heys, K.A.; et al. Using Fourier transform IR spectroscopy to analyze biological materials. Nat. Protoc. 2014, 9, 1771–1791. [Google Scholar] [CrossRef] [PubMed] [Green Version]
- Corte, L.; Tiecco, M.; Roscini, L.; Germani, R.; Cardinali, G. FTIR analysis of the metabolomic stress response induced by N-alkyltropinium bromide surfactants in the yeasts Saccharomyces cerevisiae and Candida albicans. Colloid. Surf. B Biointerfaces 2014, 116, 761–771. [Google Scholar] [CrossRef]
- Mayers, J.J.; Flynn, K.J.; Shields, R.J. Rapid determination of bulk microalgal biochemical composition by Fourier-Transform Infrared spectroscopy. Bioresour. Technol. 2013, 148, 215–220. [Google Scholar] [CrossRef] [Green Version]
- Bartosova, A.; Blinova, L.; Gerulova, K. Characterisation of Polysacharides and Lipids from Selected Green Algae Species by FTIR-ATR Spectroscopy. Fac. Mater. Sci. Technol. Trnava Slovak Univ. Technol. Bratisl. 2015, 23, 97–102. [Google Scholar] [CrossRef] [Green Version]
- Rafiqul, I.M.; Jalal, K.C.A.; Alam, M.Z. Environmental Factors for Optimisation of Spirulina Biomass in Laboratory Culture. Biotechnology 2005, 4, 19–22. [Google Scholar]
- Duygu, D. Fourier transform infrared (FTIR) spectroscopy for identification of Chlorella vulgaris Beijerinck 1890 and Scenedesmus obliquus (Turpin) Kützing 1833. Afr. J. Biotechnol. 2012, 11, 3817–3824. [Google Scholar]
- Koo, T.K.; Da, P.; Li, M.Y. A Guideline of Selecting and Reporting Intraclass Correlation Coefficients for Reliability Research. J. Chiropr. Med. 2016, 15, 155–163. [Google Scholar] [CrossRef] [Green Version]
- Allen, M.M.; Stanier, R.Y. Grow than division of some unicellular blue-greenalgae. J. Gen. Microbiol. 1968, 51, 199–202. [Google Scholar] [CrossRef] [PubMed] [Green Version]
- De Luca, P.; Taddei, R. Crescita comparata di due forme di Cyanidium caldarium dei Campi Flegrei (Napoli) in presenza di diverse fonti di azoto. Delpinoa 1972, 12, 3–8. [Google Scholar]
- Wang, S.K.; Stiles, A.R.; Guo, C.; Liu, C.Z. Microalgae cultivation in photobioreactors: An overview of light characteristics. Eng. Life Sci. 2014, 14, 550–559. [Google Scholar] [CrossRef] [Green Version]
- Lee, J.Y.; Yoo, C.; Jun, S.Y.; Ahn, C.Y.; Oh, H.M. Comparison of several methods for effective lipid extraction from microalgae. Bioresour. Technol. 2010, 101, S75–S77. [Google Scholar] [CrossRef]
- Bligh, E.G.; Dyer, W.J. A rapid method of total lipid extraction and purification. Can. J. Biochem. Physiol. 1959, 37, 911–917. [Google Scholar] [CrossRef] [Green Version]
- Carreau, J.P.; Dubacq, J.P. Adaptation of a macro-scale method to the micro-scale for fatty acid methyl transesterification of biological lipid extracts. J. Chromatogr. A 1978, 151, 384–390. [Google Scholar] [CrossRef]
- Lall, R.K.; Proctor, A.; Jain, V.P. A rapid, micro FAME preparation method for vegetable oil fatty acid analysis by gas chromatography. J. Am. Oil Chem. Soc. 2009, 86, 309–314. [Google Scholar] [CrossRef]
- Rieppo, L.; Saarakkala, S.; Närhi, T.; Helminen, H.J.; Jurvelin, J.S.; Rieppo, J. Application of second derivative spectroscopy for increasing molecular specificity of fourier transform infrared spectroscopic imaging of articular cartilage. Osteoarthr. Cartil. 2012, 20, 451–459. [Google Scholar] [CrossRef] [Green Version]
- Mach, H.; Thomson, J.A.; Middaugh, C.R. Quantitative analysis of protein mixtures by second derivative absorption spectroscopy. Anal. Biochem. 1989, 181, 79–85. [Google Scholar] [CrossRef]
- Baldassarre, M.; Li, C.; Eremina, N.; Goormaghtigh, E.; Barth, A. Simultaneous Fitting of Absorption Spectra and Their Second Derivatives for an Improved Analysis of Protein Infrared Spectra. Molecules 2015, 20, 12599–12622. [Google Scholar] [CrossRef] [Green Version]
- Wrede, D.; Taha, M.; Miranda, A.F.; Kadali, K.; Stevenson, T.; Ball, A.S.; Mouradov, A. Co-Cultivation of Fungal and Microalgal Cells as an Efficient System for Harvesting Microalgal Cells, Lipid Production and Wastewater Treatment. PLoS ONE 2014, 9, e113497. [Google Scholar] [CrossRef] [PubMed] [Green Version]


| Element Number | Element Symbol | Element Name | Atomic Conc. HGS | Weight Conc. HGS (%) | Atomic Conc. AGS | Weight Conc. AGS (%) |
|---|---|---|---|---|---|---|
| 6 | C | Carbon | 63.81 | 57.16 | 51.79 | 46.03 |
| 8 | O | Oxygen | 23.74 | 28.33 | 21.20 | 25.11 |
| 7 | N | Nitrogen | 11.40 | 11.90 | 26.40 | 27.37 |
| 15 | P | Phosphorus | 0.38 | 0.89 | 0.24 | 0.55 |
| 19 | K | Potassium | 0.32 | 0.93 | 0.11 | 0.31 |
| 16 | S | Sulfur | 0.27 | 0.64 | 0.26 | 0.62 |
| 12 | Mg | Magnesium | 0.08 | 0.15 | 0.00 | 0.00 |
| Molecular Formula | Peak | RT (min) | Compound | AGS | HGS | Sp |
|---|---|---|---|---|---|---|
| C8:0 | 1 | 7.53 | Caprylic acid C8:0 | 0.060 ± 0.01 | - | 0.04 ± 0.03 |
| C13:0 | 2 | 10.26 | Tridecanoic acid | 0.35+0.01 | - | 0.50 ± 0.02 |
| C14:0 | 3 | 11.28 | Myristic acid C14:0 | 1.74 ± 0.14a | 1.90 ± 0.12a | 0.13 ± 0.01b |
| C14:1 | 4 | 12.41 | Myristoleic acid C14:1 | 0.10 ± 0.03 | - | 0.05 ± 0.04 |
| C15:0 | 5 | 12.54 | Pentadecanoic acid C15:0 | 0.61 ± 0.09 a | 0.36 ± 0.09 a | 0.03 ± 0.01b |
| C16:0 | 6 | 14.28 | Palmitic acid C16:0 | 27.19 ± 0.12b | 21.15 ± 0.31c | 22.51 ± 0.27 a |
| C16:1 | 7 | 15.96 | Palmitoleic acid C16:1 | 0.32 ± 0.09b | 0.33 ± 0.16b | 4.74 ± 0.41 a |
| C17:0 | 8 | 16.50 | Heptadecanoic acid C17:0 | 0.27 ± 0.06 a | 0.31 ± 0.07 a | 0.16 ± 0.08ab |
| C17:1 | 9 | 18.62 | cis-10-Heptadecenoic acid | 0.26 ± 0.02ab | 0.21 ± 0.08b | 0.32 ± 0.04 a |
| C18:0 | 10 | 19.43 | Stearic acid | 1.04 ± 0.11b | 2.96 ± 0.06 a | 0.72 ± 0.11c |
| C18:1 n9t | 11 | 21.07 | Elaidic acid | 0.15 ± 0.08 a | 0.17 ± 0.01 a | 0.04 ± 0.01b |
| C18:1 n9c | 12 | 21.82 | Oleic acid | 20.91 ± 0.14b | 30.07 ± 0.16 a | 2.95 ± 0.09c |
| C18:3 n3 | 13 | 24.01 | Linolenic acid | 5.90 ± 0.27 a | 3.31 ± 0.18ab | 0.10 ± 0.03c |
| C18:3 n6 | 14 | 25.58 | γ-Linolenic acid | - | - | 13.15 ± 0.09 |
| C18:2 n6c | 15 | 26.13 | Linoleic acid | 18.91 ± 0.13 a | 14.31 ± 0.62ab | 19.06 ± 0.51 a |
| C20:0 | 16 | 28.25 | Arachidic acid | 0.05 ± 0.01 | 0,10 ± 0.07 | 0.04 ± 0.01 |
| C28H44O | 17 | 28.47 | Ergosterol | - | 10.21 ± 0.13a | 2.93 ± 0.21b |
| C20H40O | 18 | 29.75 | Phytol | 15.34 ± 0.14b | 6.05 ± 0.09c | 16.07 ± 0.76a |
| C15H13N | 19 | 30.01 | 4’methyl-2-phenylindole | - | 7.01 ± 0.03a | 2.86 ± 0.04b |
| C17H36 | 20 | 33.47 | n-Heptadecene | 5.72 ± 0.35b | - | 12.92 ± 0.47a |
| C20:1 | 21 | 33.61 | cis-11-Eicosenoic acid | 0.26 ± 0.11b | 0.53 ± 0.02a | 0.01 ± 0.01c |
| C20:2 | 22 | 34.08 | cis-11,14-Eicosadienoic | 0.57 ± 0.08 a | 0.65 ± 0.03a | 0.25 ± 0.16b |
| C20:3 n6 | 23 | 34.12 | cis-8,11,14-Eicosatrienoic acid | - | - | 0.28 ± 0.07 |
| C20:3 n3 | 24 | 35.03 | cis-11,14,17- Eicosatrienoic acid | 0.14 ± 0.05 | 0.28 ± 0.01 | - |
| C24:1 | 25 | 35.97 | Nervonic acid | 0.11 ± 0.02 | 0.09 ± 0.01ab | 0.14 ± 0.08a |
| C19H34O2 | N.P.A. | Methyl linoleate | 07.85 ± 0.16a | 3.47 ± 0.03b | - | |
| C17H34O2 | Methyl palmytate | 11.41 ± 0.73a | 6.21 ± 0.03b | 4.01 ± 0.62b | ||
| C16H32O2 | Hexadecanoic acid, methyl ester | 9.47 ± 0.49a | - | 6.23 ± 0.31b | ||
| ∑-FATTY ACIDS | ∑-FAME | 28.73 ± 0.74a | 9.68 ± 0.03b | - | ||
| ∑-SFA | 34.10 ± 0.21b | 31.56 ± 0.03c | 40.02 ± 0.26a | |||
| ∑-MUFA | 30.11 ± 0.47b | 38.54 ± 0.03a | 8.25 ± 0.07c | |||
| ∑-PUFA | 31.52 ± 0.83b | 27.43 ± 0.61c | 35.82 ± 0.62a | |||
| Spectral Ranges Analyzed with SIMCA | Peak Wavelength (cm-1) | Peak Assignment | Macromolecules | ||
|---|---|---|---|---|---|
| AGS | HGS | Sp | |||
| 3600–3000 | 3298 | v(N-H) stretching of amide A | Proteins | ||
| 3284 | 3282 | ||||
| 2999–2800 | 2959 | vas(CH2) and vs(CH2) stretching | Lipids, triglycerides, fatty acids, carbohydrates | ||
| 2924 | 2924 | 2925 | |||
| 2854 | 2855 | ||||
| 1772–1712 | 1743 | v(C=O) stretching of esters | Cellulose–fatty acids | ||
| 1711–1576 | 1640 | 1646 | 1641 | Amide I v(C=O) stretching | Proteins |
| 1575–1478 | 1538 | 1537 | 1541 | Amide II δ(N-H) bending and v(C-N) stretching | Proteins |
| 1477–1175 | 1453 | 1453 | 1452 | δas(CH2) and δas(CH3) bending of methyl | Proteins, lipids |
| 1394 | 1411 | 1399 | δs(CH2) and δs(CH3) bending of methyl; vs(C-O) of COO- groups; δs(N(CH3)3) bending of methyl | Proteins and lipids | |
| 1368 | |||||
| 1336 | |||||
| 1308 | Amide III | Proteins | |||
| 1236 | 1238 | 1240 | Vas (>P=O) stretching of phosphodiesters | Nucleic acids and phospholipids | |
| 1174–950 | 1148 | v(C-O-C) | Carbohydrates (including glucose, fructose, glycogen, etc.), polysaccharides | ||
| 1077 | 1079 | ||||
| 1039 | 1043 | ||||
| 1018 | |||||
| 949–650 | 806 | 931 | 916 | Fingerprint region | |
| 763 | 850 | 880 | |||
| 700 | 760 | 743 | |||
| 662 | |||||
| Spectral Ranges (cm-1) | |||
|---|---|---|---|
| FTr | Start | End | ∆HGS-AGS |
| 1 | 3600 | 3000 | 2.23 (18.63%) |
| 2 | 2999 | 2800 | 1.16 (9.69%) |
| 3 | 1772 | 1712 | 0.20 (1.67%) |
| 4 | 1711 | 1576 | 1.62 (13.53%) |
| 5 | 1575 | 1478 | 1.09 (9.11%) |
| 6 | 1477 | 1175 | 1.78 (14.87%) |
| 7 | 1174 | 950 | 2.60 (21.72%) |
| 8 | 949 | 650 | 1.29 (10.78%) |
| Spectrum Wavelength cm−1 4000–650 | ||||
| Groups | Recognition (%)a | Rejection (%)b | Interclass Distancec | |
| AGS | 100(5/5) | 100(10/10) | AGS–HGS | 26.2 |
| HGS | 100(5/5) | 100(10/10) | HGS-Sp | 36.3 |
| Sp | 100(5/5) | 100(10/10) | Sp-AGS | 12.2 |
| Spectrum Wavelength cm−1 3600–3000 | ||||
| Groups | Recognition (%)a | Rejection (%)b | Interclass Distancec | |
| AGS | 100(5/5) | 100(10/10) | AGS–HGS | 21.9 |
| HGS | 100(5/5) | 100(10/10) | HGS-Sp | 21.2 |
| Sp | 100(5/5) | 100(10/10) | Sp-AGS | 6.56 |
| Spectrum Wavelength cm−1 2999–2800 | ||||
| Groups | Recognition (%)a | Rejection (%)b | Interclass Distancec | |
| AGS | 100(5/5) | 100(10/10) | AGS–HGS | 24.8 |
| HGS | 100(5/5) | 100(10/10) | HGS-Sp | 23.9 |
| Sp | 100(5/5) | 100(10/10) | Sp-AGS | 4.94 |
| Spectrum Wavelength cm−1 1772–1712 | ||||
| Groups | Recognition (%)a | Rejection (%)b | Interclass Distancec | |
| AGS | 100(5/5) | 100(10/10) | AGS–HGS | 15.3 |
| HGS | 100(5/5) | 100(10/10) | HGS-Sp | 14.2 |
| Sp | 100(5/5) | 100(10/10) | Sp-AGS | 6.5 |
| Spectrum Wavelength cm−1 1711–1576 | ||||
| Groups | Recognition (%)a | Rejection (%)b | Interclass Distancec | |
| AGS | 100(5/5) | 100(10/10) | AGS–HGS | 15.4 |
| HGS | 100(5/5) | 100(10/10) | HGS-Sp | 36.5 |
| Sp | 100(5/5) | 100(10/10) | Sp-AGS | 20.8 |
| Spectrum Wavelength cm−1 1575–1478 | ||||
| Groups | Recognition (%)a | Rejection (%)b | Interclass Distancec | |
| AGS | 100(5/5) | 100(10/10) | AGS–HGS | 15.5 |
| HGS | 100(5/5) | 100(10/10) | HGS-Sp | 24.2 |
| Sp | 100(5/5) | 100(10/10) | Sp-AGS | 21.7 |
| Spectrum Wavelength cm−1 1477–1175 | ||||
| Groups | Recognition (%)a | Rejection (%)b | Interclass Distancec | |
| AGS | 100(5/5) | 100(10/10) | AGS–HGS | 22.5 |
| HGS | 100(5/5) | 100(10/10) | HGS-Sp | 14.7 |
| Sp | 100(5/5) | 100(10/10) | Sp-AGS | 17.7 |
| Spectrum Wavelength cm−1 1174–950 | ||||
| Groups | Recognition (%)a | Rejection (%)b | Interclass Distancec | |
| AGS | 100(5/5) | 100(10/10) | AGS–HGS | 78.3 |
| HGS | 100(5/5) | 100(10/10) | HGS-Sp | 88.2 |
| Sp | 100(5/5) | 100(10/10) | Sp-AGS | 13.9 |
| Spectrum Wavelength cm−1 949–650 | ||||
| Groups | Recognition (%)a | Rejection (%)b | Interclass Distancec | |
| AGS | 100(5/5) | 100(10/10) | AGS–HGS | 26.7 |
| HGS | 100(5/5) | 100(10/10) | HGS-Sp | 27.9 |
| Sp | 100(5/5) | 100(10/10) | Sp-AGS | 6.22 |
| Components | g/L | Oligoelements | g/L |
|---|---|---|---|
| NaNO3 | 1.7 | MnCl2 ∙4H2O | 0.02 |
| MgSO4∙7H2O | 0.3 | CuSO4∙5H2O | 0.0001 |
| K2HPO4 | 0.6 | CoCl2∙H2O | 0.00005 |
| KH2PO4 | 0.3 | Na2MoO4∙2H2O | 0.00005 |
| CaCl2∙2H2O | 0.02 | ZnCl2 | 0.00014 |
| NaCl | 0.05 | H2SO4 | 0.30 |
| FeSO4∙7H2O | 0.1 |
| Area | Height | |||||
|---|---|---|---|---|---|---|
| Peak | LOD (ng/mL) | LOQ (ng/mL) | r2 | LOD (ng/mL) | LOQ (ng/mL) | r2 |
| 1 | 0.21 | 0.63 | 0.9994 | 0.36 | 1.11 | 0.9987 |
| 2 | 0.19 | 0.57 | 0.9978 | 0.26 | 0.86 | 0.9986 |
| 3 | 0.30 | 0.90 | 0.9819 | 0.18 | 0.62 | 0.9956 |
| 4 | 0.14 | 0.42 | 0.9973 | 0.24 | 0.79 | 0.9996 |
| 5 | 0.15 | 0.46 | 0.9983 | 0.23 | 0.78 | 0.9983 |
| 6 | 0.19 | 0.58 | 0.9967 | 0.65 | 2,08 | 0.9972 |
| 7 | 0.20 | 0.61 | 0.9978 | 0.47 | 1.50 | 0.9998 |
| 8 | 0.33 | 0.97 | 0.9977 | 0.40 | 1.33 | 0.9996 |
| 9 | 0.22 | 0.68 | 0.9972 | 0.46 | 1.35 | 0.9988 |
| 10 | 0.19 | 0.59 | 0.9951 | 0.31 | 1.01 | 0.9986 |
| 11 | 0.14 | 0.43 | 0.9894 | 0.43 | 1.27 | 0.9991 |
| 12 | 0.16 | 0.47 | 0.9978 | 0.24 | 0.83 | 0.9980 |
| 13 | 0.21 | 0.63 | 0.9965 | 0.27 | 0.85 | 0.9899 |
| 14 | 0.23 | 0.69 | 0.9994 | 0.37 | 1.16 | 0.9996 |
| 15 | 0.18 | 0.56 | 0.9989 | 0.72 | 2.36 | 0.9881 |
| 16 | 0.16 | 0.48 | 0.9976 | 0.23 | 0.75 | 0.9893 |
| 17 | 0.22 | 0.70 | 0.9995 | 0.41 | 1.38 | 0.9957 |
| 18 | 0.21 | 0.63 | 0.9945 | 0.43 | 1.43 | 0.9995 |
| 19 | 0.24 | 0.73 | 0.9971 | 0.37 | 1.25 | 0.9992 |
| 20 | 0.27 | 0.81 | 0.9996 | 0.27 | 0.83 | 0.9948 |
| 21 | 0.21 | 0.64 | 0.9961 | 0.38 | 1.24 | 0.9996 |
| 22 | 0.25 | 0.76 | 0.9897 | 0.34 | 1.11 | 0.9982 |
| 23 | 0.18 | 0.54 | 0.9979 | 0.41 | 1.35 | 0.9993 |
| 24 | 0.17 | 0.50 | 0.9987 | 0.43 | 1.39 | 0.9975 |
| 25 | 0.19 | 0.59 | 0.9919 | 0.56 | 1.85 | 0.9967 |
© 2020 by the authors. Licensee MDPI, Basel, Switzerland. This article is an open access article distributed under the terms and conditions of the Creative Commons Attribution (CC BY) license (http://creativecommons.org/licenses/by/4.0/).
Share and Cite
Barone, R.; De Napoli, L.; Mayol, L.; Paolucci, M.; Volpe, M.G.; D’Elia, L.; Pollio, A.; Guida, M.; Gambino, E.; Carraturo, F.; et al. Autotrophic and Heterotrophic Growth Conditions Modify Biomolecole Production in the Microalga Galdieria sulphuraria (Cyanidiophyceae, Rhodophyta). Mar. Drugs 2020, 18, 169. https://doi.org/10.3390/md18030169
Barone R, De Napoli L, Mayol L, Paolucci M, Volpe MG, D’Elia L, Pollio A, Guida M, Gambino E, Carraturo F, et al. Autotrophic and Heterotrophic Growth Conditions Modify Biomolecole Production in the Microalga Galdieria sulphuraria (Cyanidiophyceae, Rhodophyta). Marine Drugs. 2020; 18(3):169. https://doi.org/10.3390/md18030169
Chicago/Turabian StyleBarone, Roberto, Lorenzo De Napoli, Luciano Mayol, Marina Paolucci, Maria Grazia Volpe, Luigi D’Elia, Antonino Pollio, Marco Guida, Edvige Gambino, Federica Carraturo, and et al. 2020. "Autotrophic and Heterotrophic Growth Conditions Modify Biomolecole Production in the Microalga Galdieria sulphuraria (Cyanidiophyceae, Rhodophyta)" Marine Drugs 18, no. 3: 169. https://doi.org/10.3390/md18030169