Article

New Ophiobolins from the Deep-Sea Derived Fungus Aspergillus sp. WHU0154 and Their Anti-Inflammatory Effects

1
International Cooperative Laboratory of Traditional Chinese Medicine Modernization and Innovative Drug Development of Chinese Ministry of Education (MOE), Institute of Traditional Chinese Medicine and Natural Products, College of Pharmacy, Jinan University, Guangzhou 510632, China
2
Key Laboratory of Combinatorial Biosynthesis and Drug Discovery, Ministry of Education, School of Pharmaceutical Sciences, Wuhan University, Wuhan 430071, China
3
Case Comprehensive Cancer Center, Department of Pharmacology, School of Medicine, Case Western Reserve University, Cleveland, OH 44106, USA
*
Authors to whom correspondence should be addressed.
These authors contributed equally to this work.
Mar. Drugs 2020, 18(11), 575; https://doi.org/10.3390/md18110575
Submission received: 21 October 2020 / Revised: 16 November 2020 / Accepted: 18 November 2020 / Published: 20 November 2020

Abstract

:
Deep-sea fungi have become a new arsenal for the discovery of leading compounds. Here five new ophiobolins 15, together with six known analogues 611, obtained from a deep-sea derived fungus WHU0154. Their structures were determined by analyses of IR, HR-ESI-MS, and NMR spectra, along with experimental and calculated electronic circular dichroism (ECD) analysis. Pharmacological studies showed that compounds 4 and 6 exhibited obvious inhibitory effects on nitric oxide (NO) production induced by lipopolysaccharide (LPS) in murine macrophage RAW264.7 cells. Mechanical study revealed that compound 6 could inhibit the inducible nitric oxide synthase (iNOS) level in LPS-stimulated RAW264.7 cells. In addition, compounds 6, 9, and 10 could significantly inhibit the expression of cyclooxygenase 2 (COX 2) in LPS-induced RAW264.7 cells. Preliminary structure-activity relationship (SAR) analyses revealed that the aldehyde group at C-21 and the α, β-unsaturated ketone functionality at A ring in ophiobolins were vital for their anti-inflammatory effects. Together, the results demonstrated that ophiobolins, especially for compound 6, exhibited strong anti-inflammatory effects and shed light on the discovery of ophiobolins as new anti-inflammatory agents.

Graphical Abstract

1. Introduction

Deep-sea fungi, living under extreme environmental conditions such as high salinity, intensely high pressure, absence of sunlight, and deficiency of nutrients, are considered to be a new reservoir for drug discovery. Recently, a multitude of structurally unique and diverse natural products with promising pharmacological activities have been discovered from deep-sea fungi, which has attracted more attention of researchers for exploring new lead compounds from this type of extreme-environment microorganism [1,2,3,4,5]. Ophiobolins are a group of sesterterpene compounds which are characterized by an intricate 5-8-5 fused ring system. Since Orsenigo isolated ophiobolin A from Bipolaris oryzae as a phytotoxin in 1957, around 70 ophiobolin analogues have been discovered from different fungi up to now [6,7,8,9,10,11,12]. Ophiobolins showed a broad spectrum of biological activities including anti-tumor [7,10,11,13], antimicrobial activity [14], anti-inflammatory [12], and calmodulin inhibitory effects [15]. Ophiobolins have attracted more attention of synthetic chemists and pharmacologists due to their structurally and biologically diversity, which show great promising for the development new agents for human diseases treatment [16].
As part of our ongoing efforts to search for new bioactive metabolites from marine microorganisms [17,18], we cultured a nonsporulating deep-sea derived fungus WHU0154. Eleven ophiobolins (compounds 111), including five new analogues 15, were obtained from the ethyl acetate (EtOAc) extract of the fungus WHU0154. Here we report the isolation and structural elucidation of the new compounds. Meanwhile, the anti-inflammatory activities of these isolated compounds were evaluated and the structure-activity relationship (SAR) was discussed.

2. Results

The EtOAc extract of fermentation cultures of the fungus strain WHU0154 was subjected to various chromatographic methods, to yield five new and six known ophiobolin-type sesterterpenoids (Figure 1). Based on comparison of MS, NMR, and specific rotation data with those reported in the corresponding literature, the known compounds were identified as 6-epi-ophiobolin G (6) [7], asperophiobolin E (7) [12], (6α)-21,21-O-dihydroophiobolin G (8) [8], (6α)-18,19,21,21-O-tetrahydro-18,19-dihydroxyophiobolin G (9) [8], asperophiobolins G (10) [12] and (6α)-18,19-O-dihydroxyophiobolin K (11) [12], respectively.

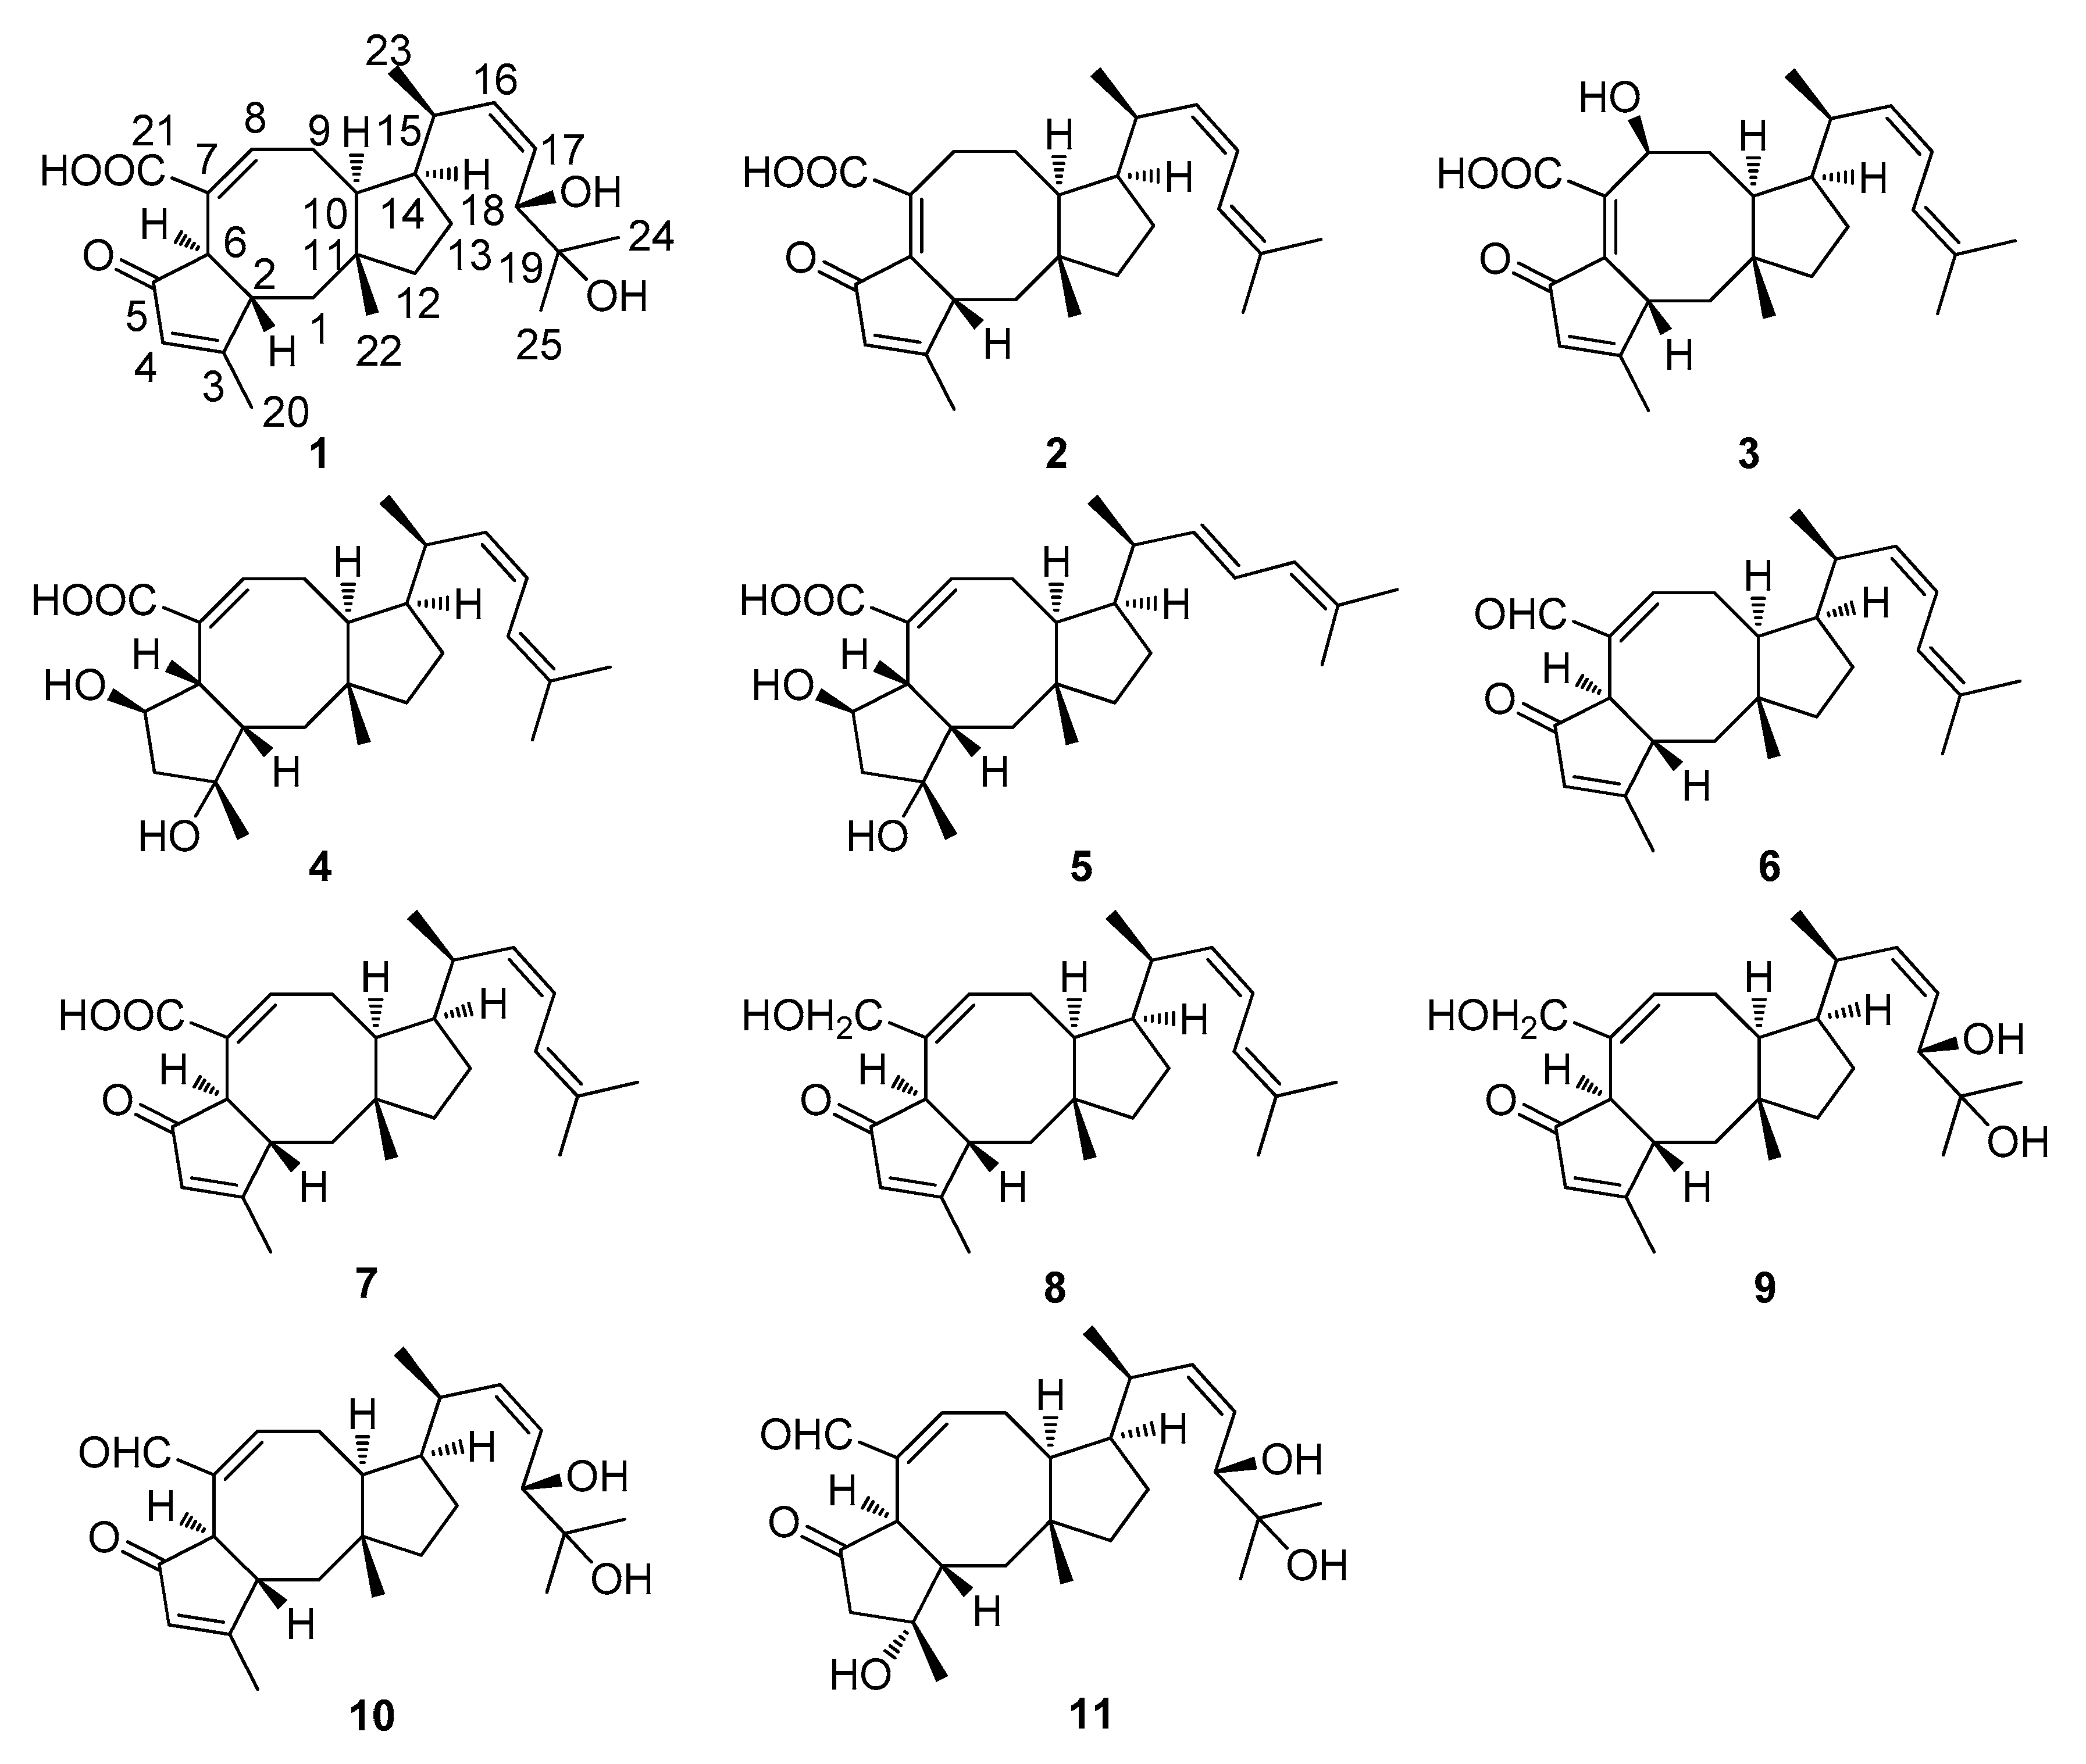
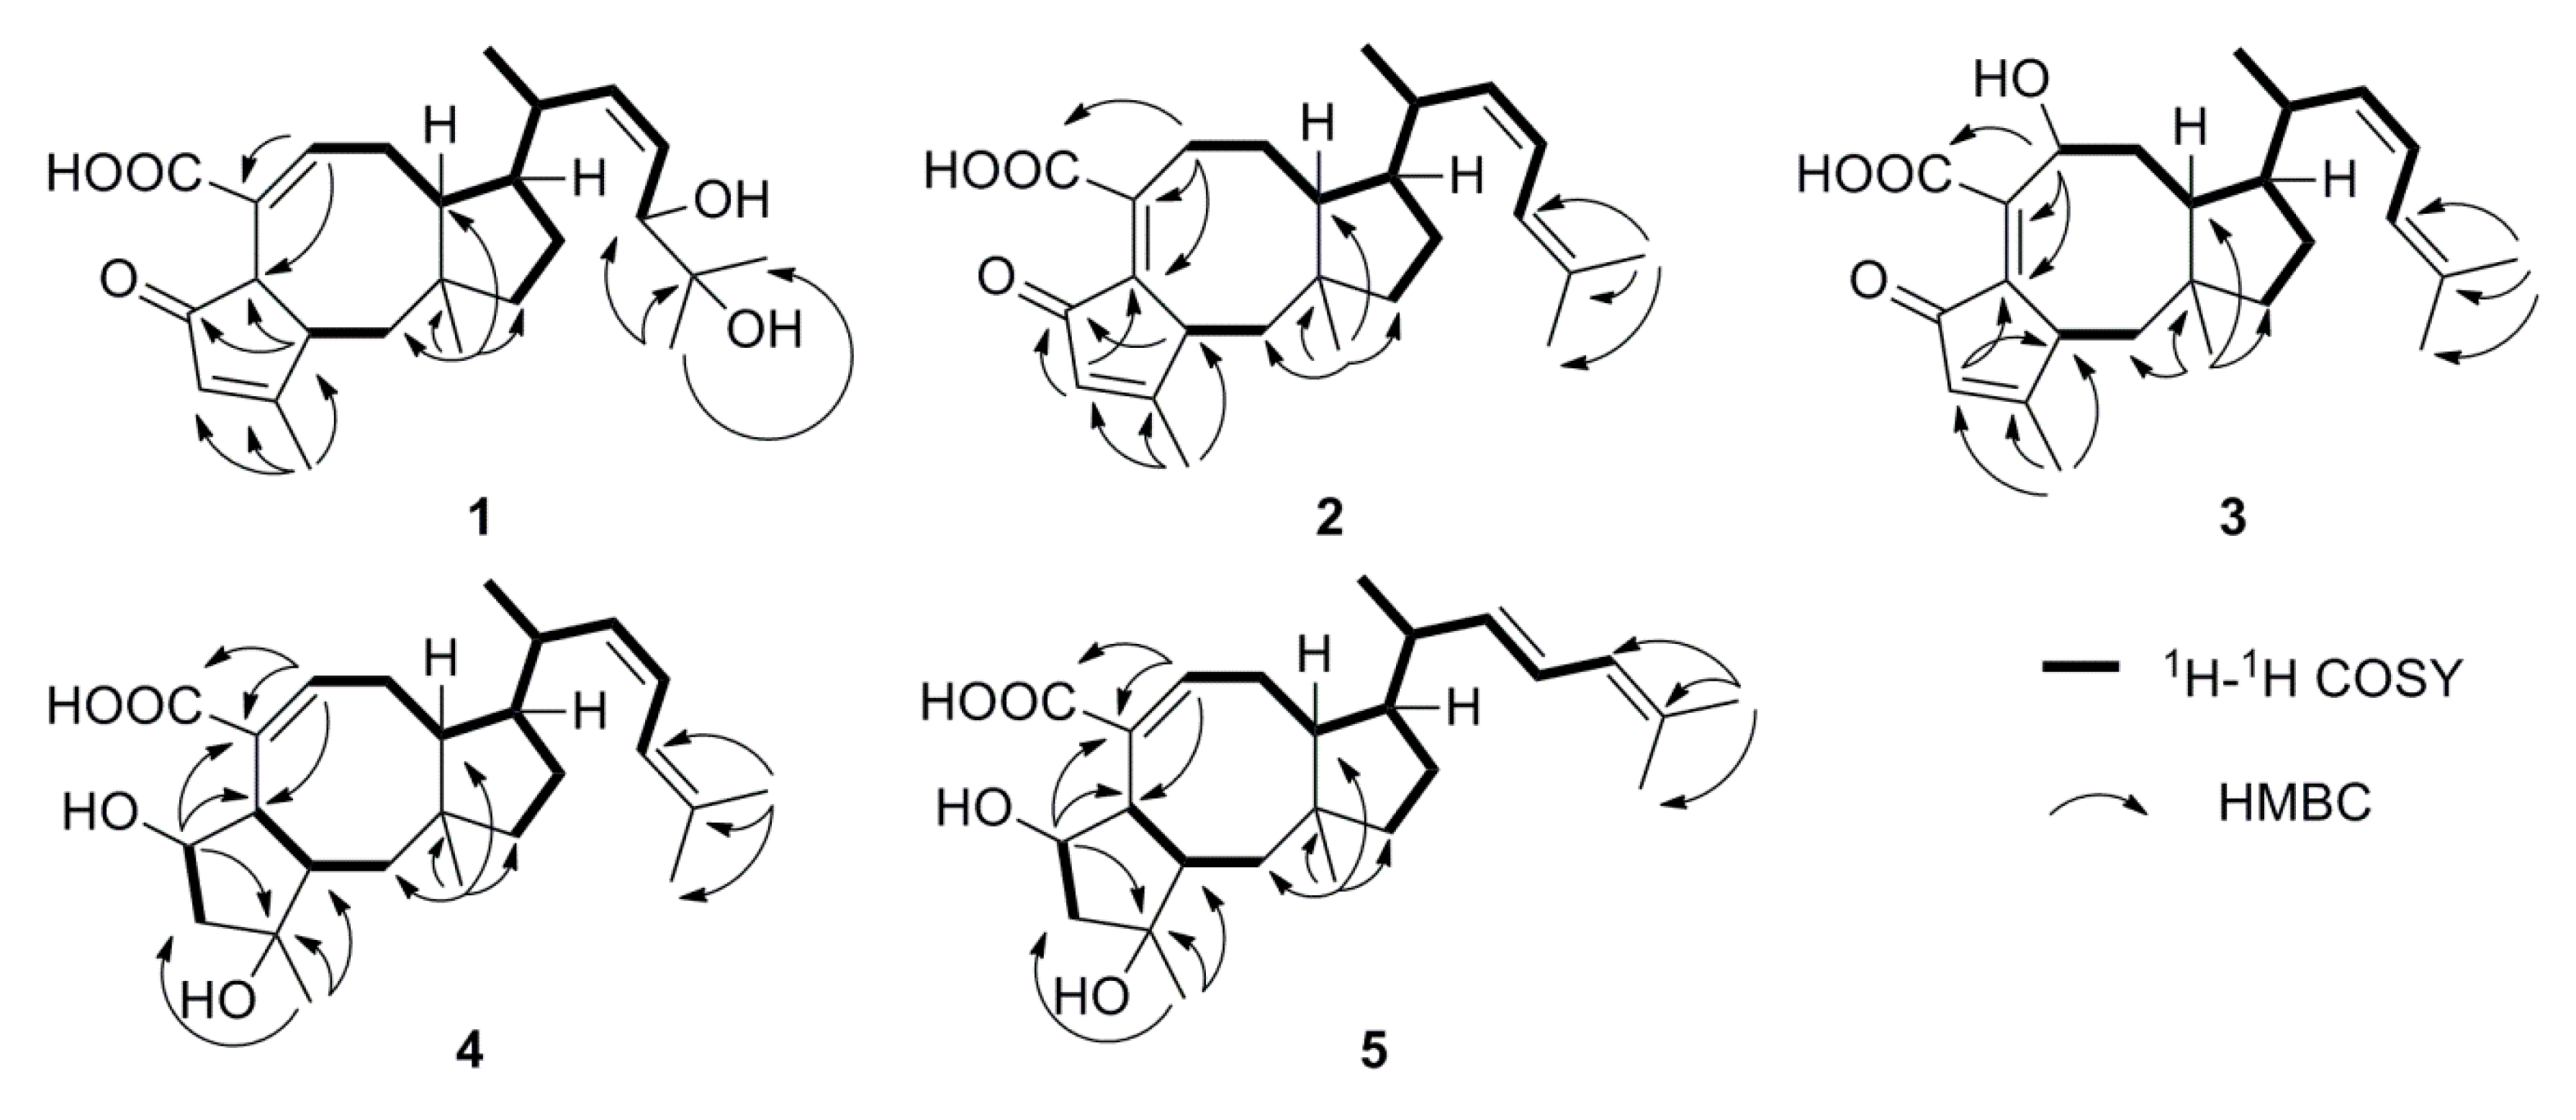
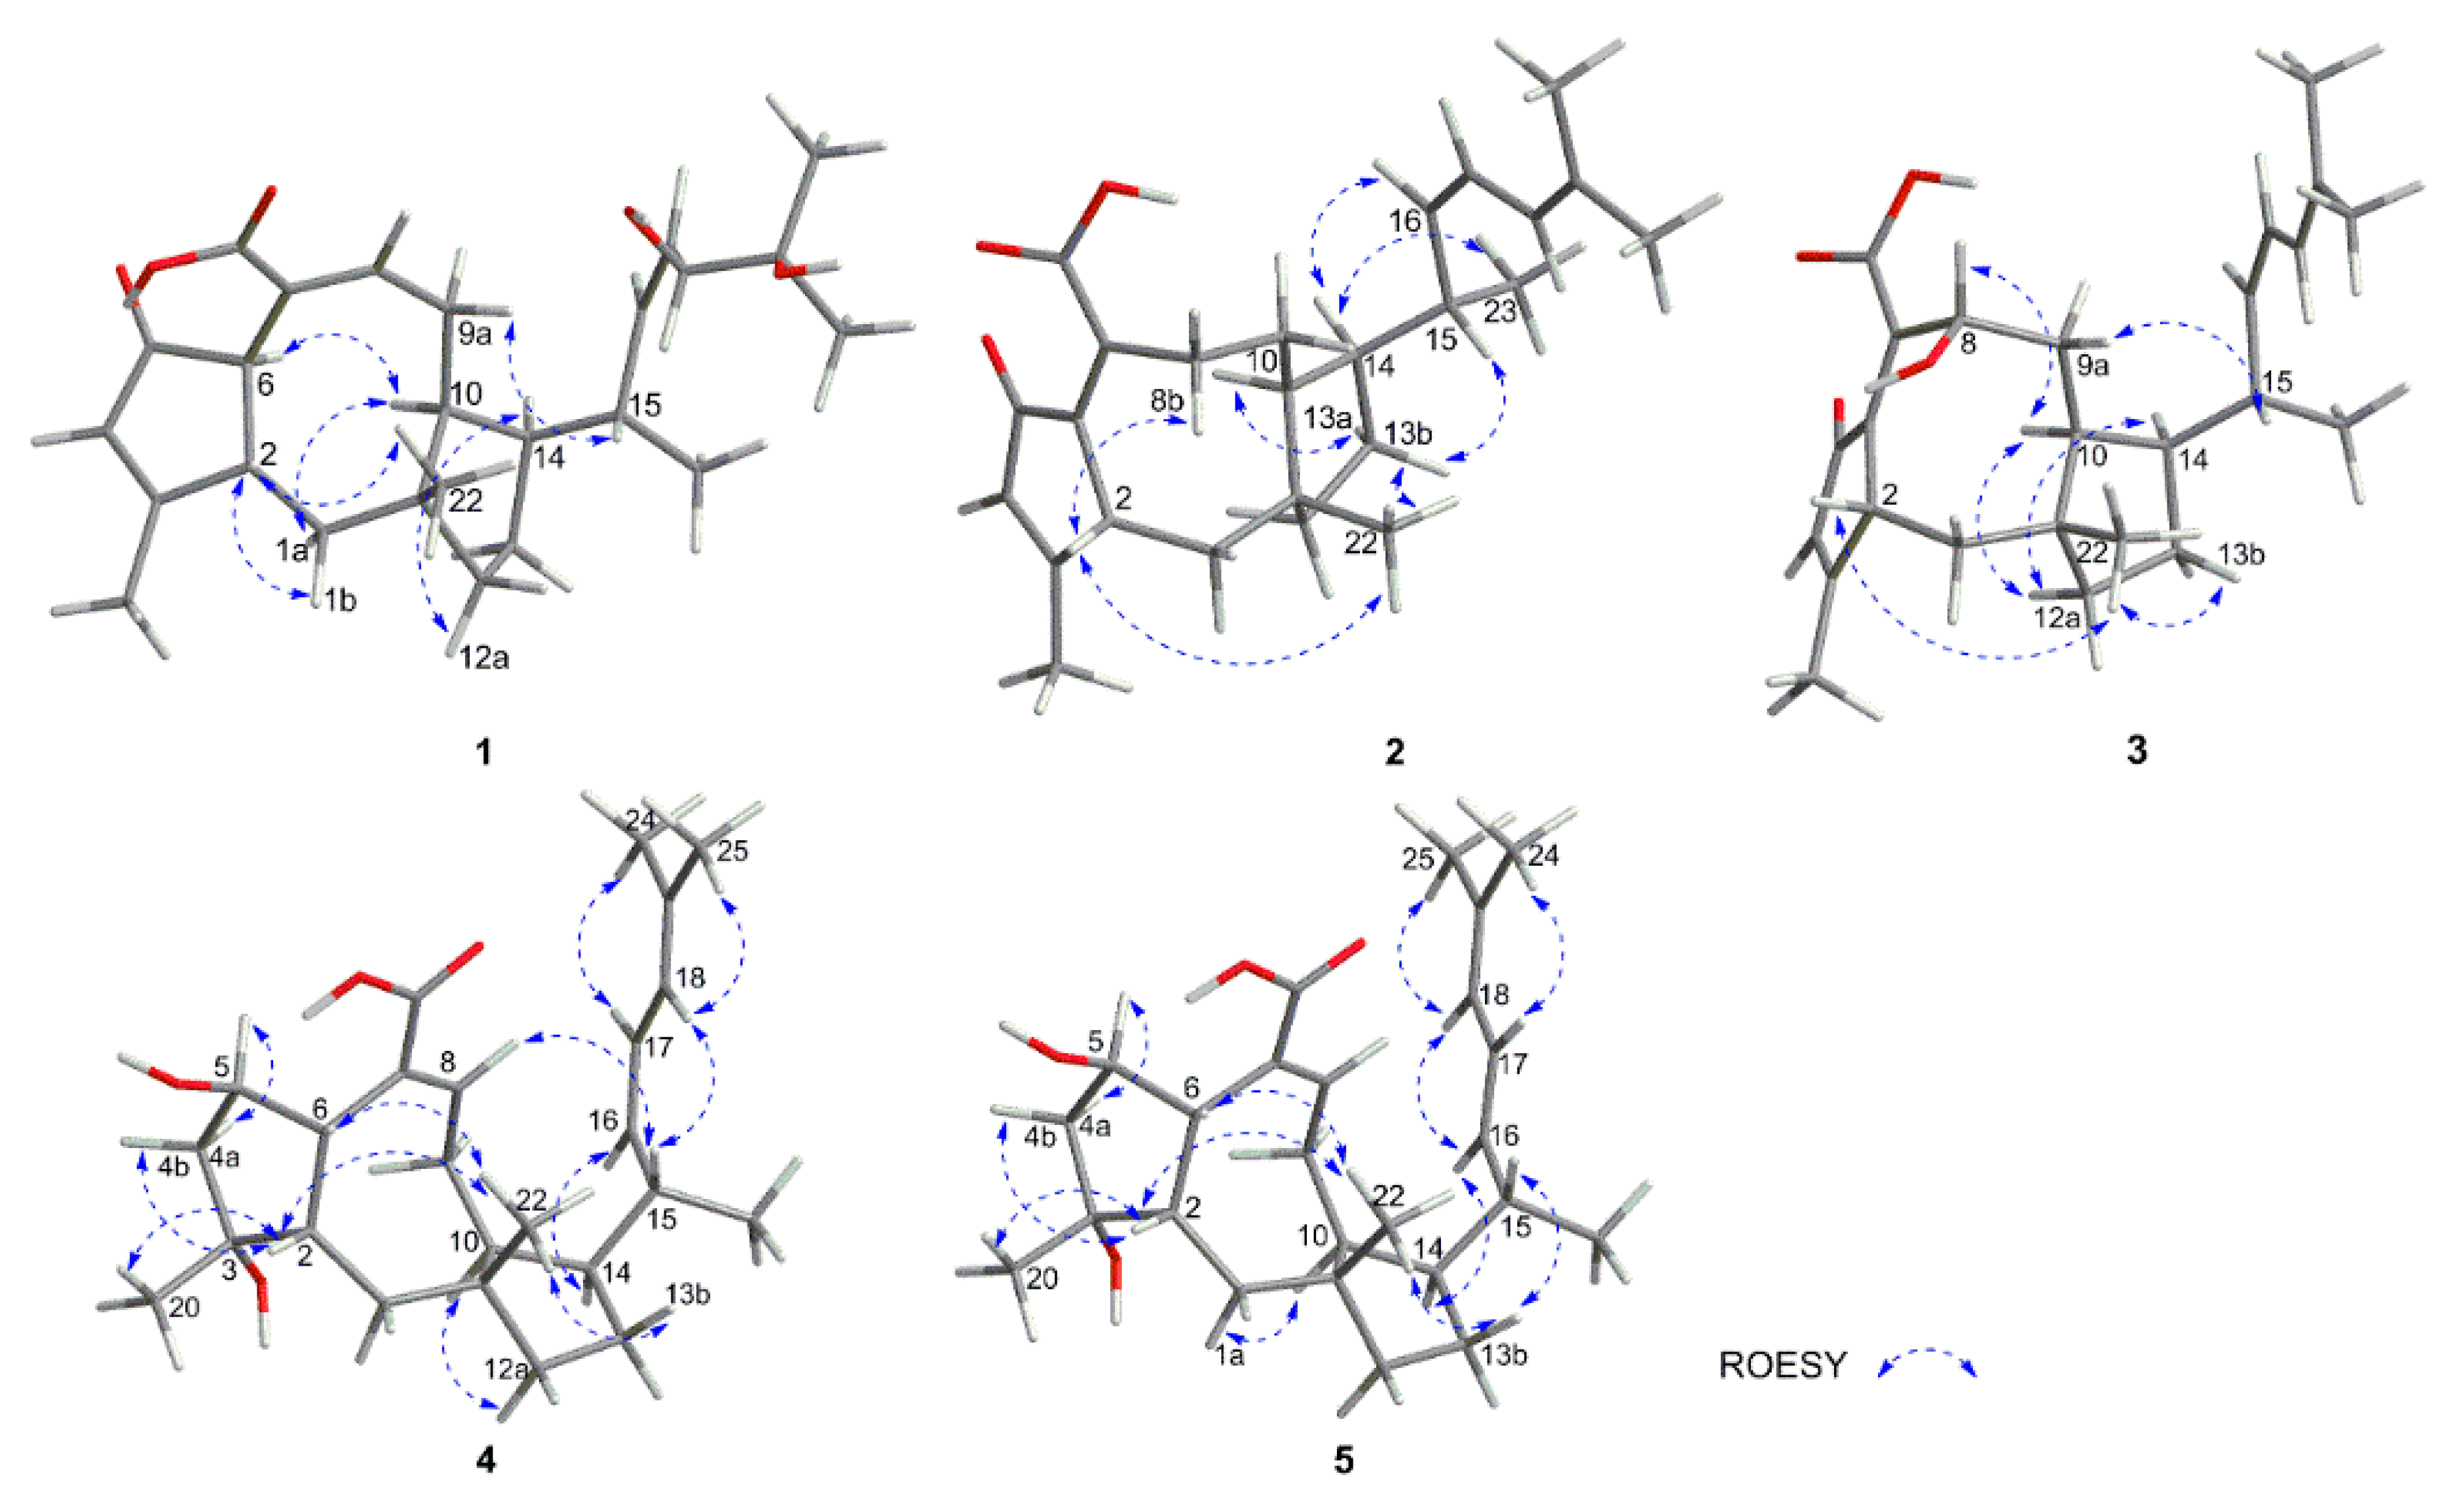
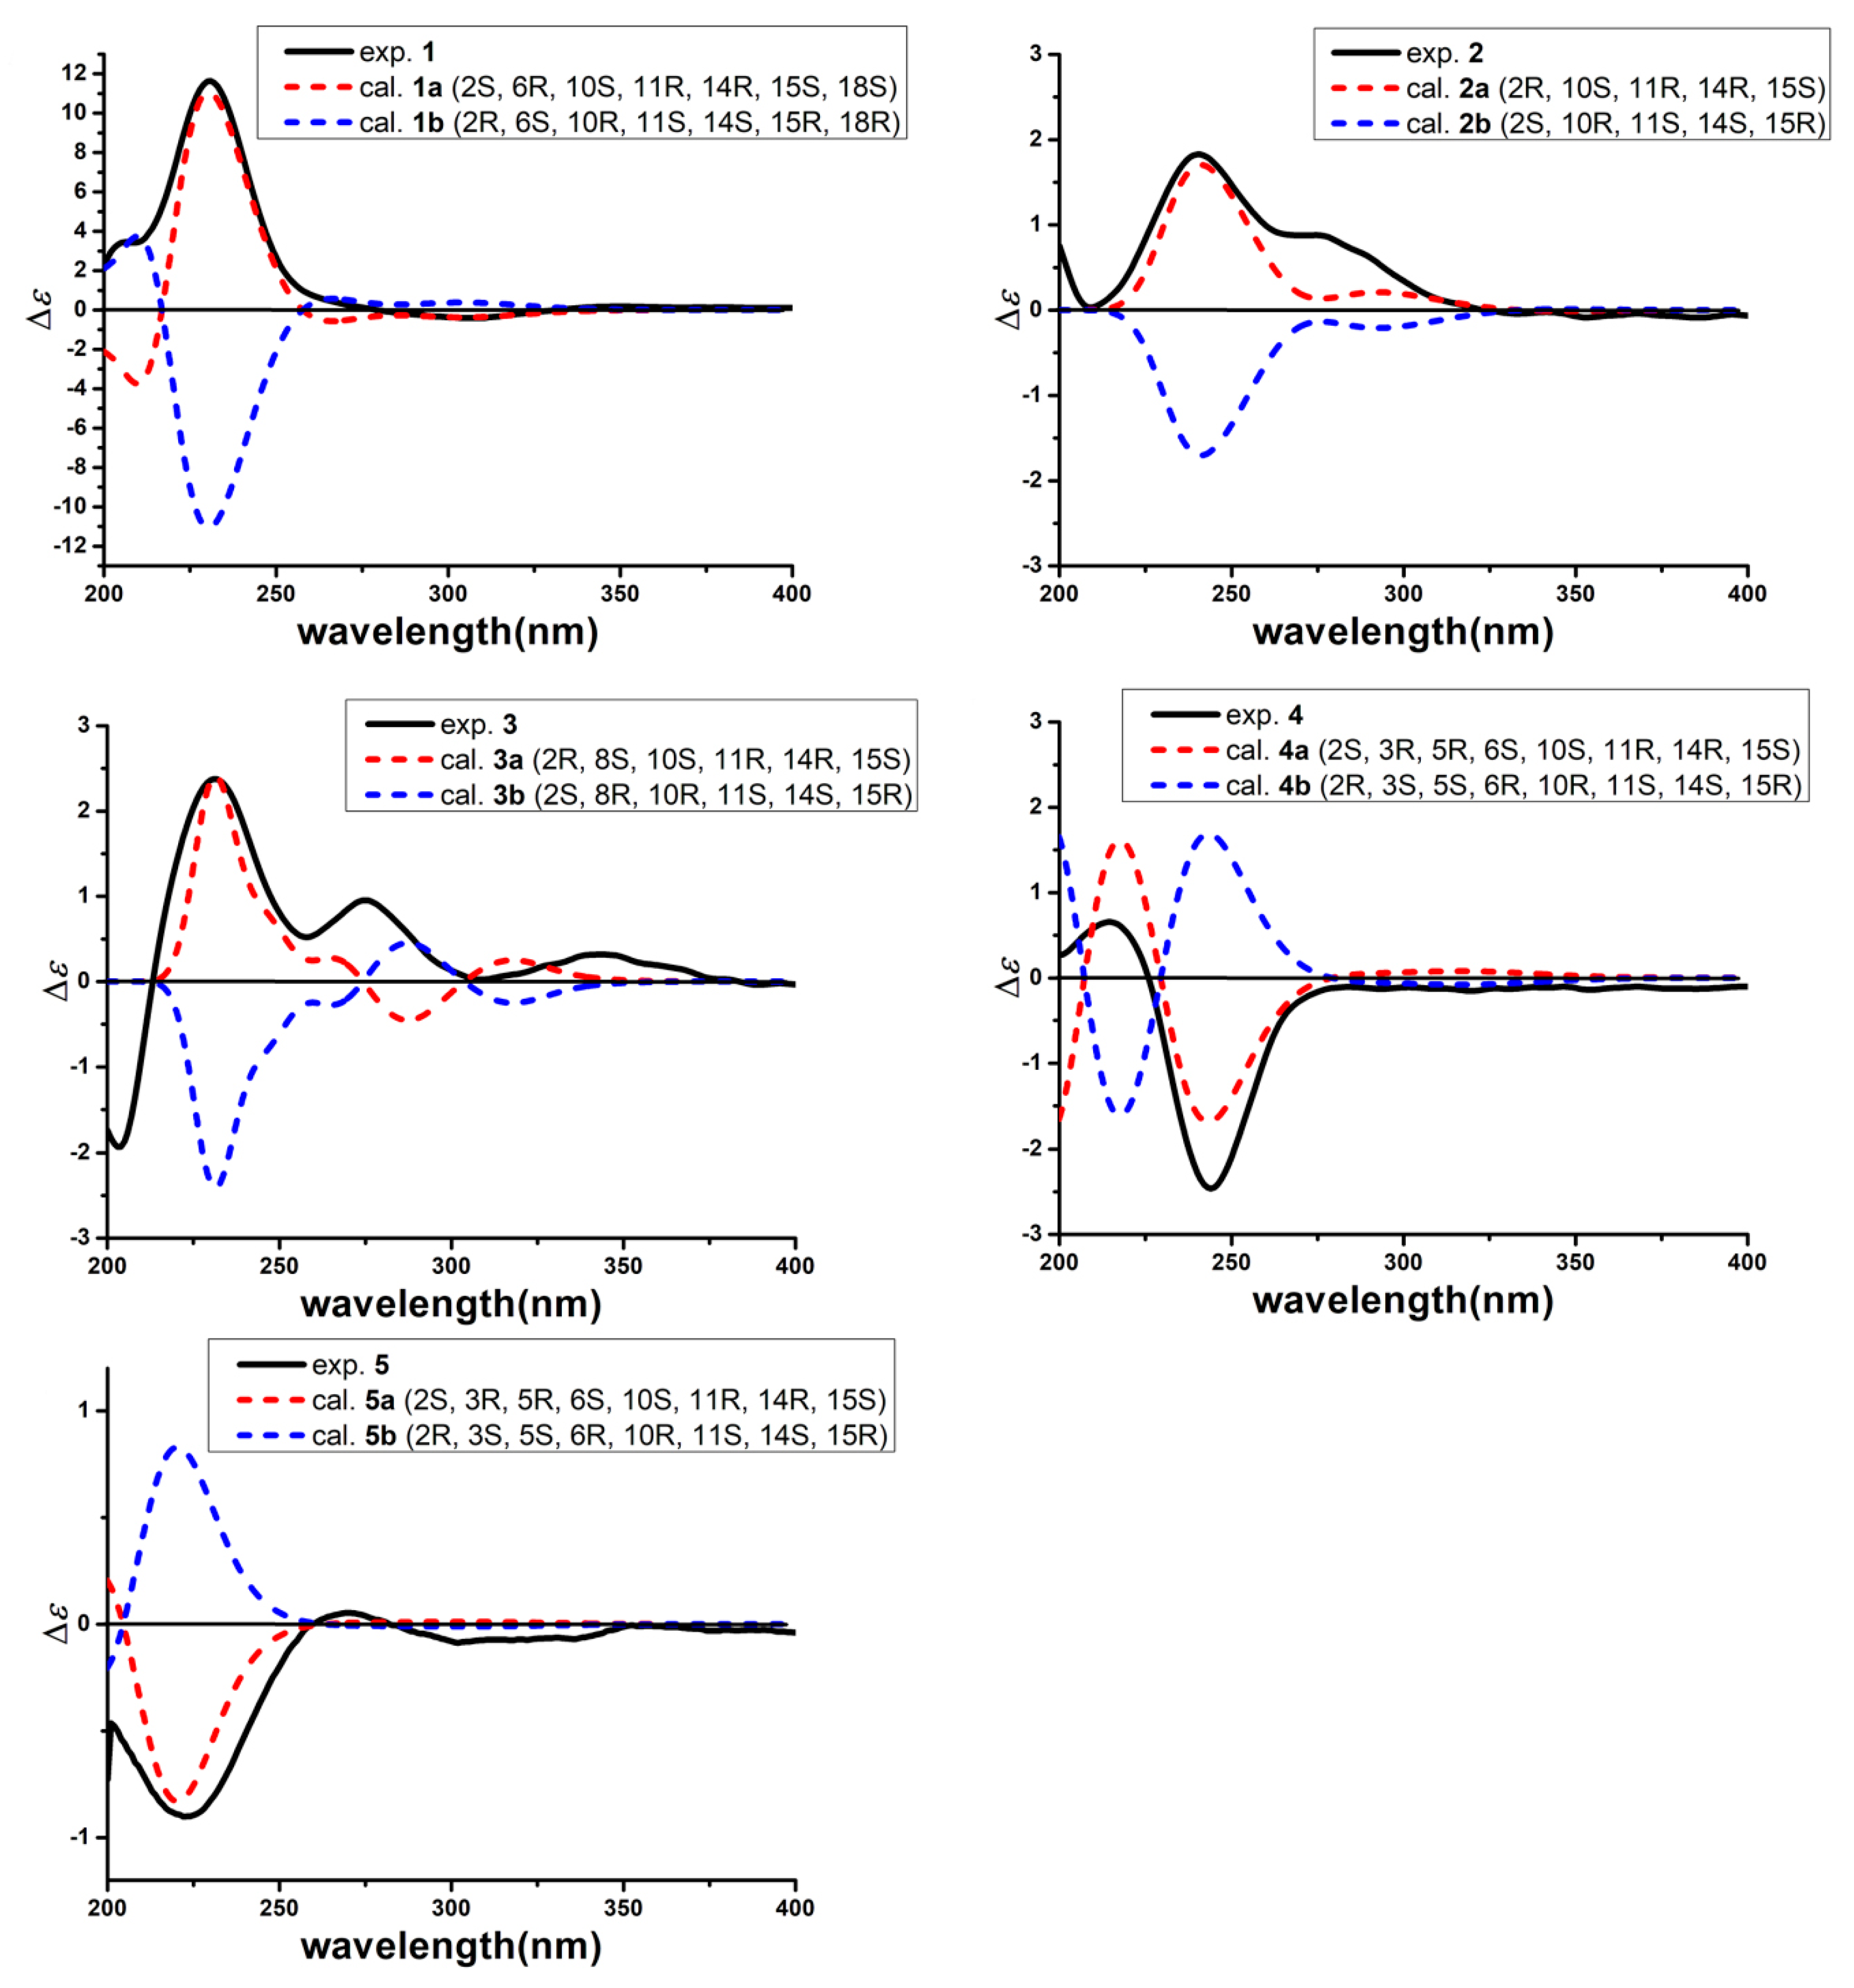
2.1. Structure Elucidation

Compound 1 was obtained as a white amorphous powder. The HR ESI-Q-TOF MS spectrum displayed a pseudomolecular ion at m/z 417.2645 [M + H] +, corresponding to the molecular formula of C25H36O5 (calcd. 417.2641), indicating eight degrees of unsaturation. The 1H-NMR spectrum showed the resonances for five methyl protons at δH 2.11 (3H, s), δH 1.19 (3H, s), δH 1.17 (3H, s), δH 0.99 (3H, s) and δH 0.99 (3H, d, J = 6.0 Hz) and four olefinic protons at δH 7.00 (1H, s), δH 5.93 (1H, s), δH 5.48 (1H, m) and δH 5.41 (1H, m). The 13C-NMR data along with the DEPT 135 spectrum of 1 displayed a total of 25 carbon signals including two carbonyl carbons at δC 211.6 and 172.0, two oxygenated carbons at δC 75.3 and 73.6, two olefinic carbons at δC 181.7 and 130.6, and five methyl carbons at δC 26.2, 24.9, 23.1, 21.5 and 17.3. Five indices of hydrogen deficiency are attributed to three double bonds and two carbonyls, and the remaining indices of hydrogen deficiency required three additional rings. The 1H- and 13C-NMR data of 1 closely resembled those of asperophiobolin G (10) [12], with the presence of a carbonyl signal at δC 172.0 in 1 instead of an aldehyde signal at δC/H 194.7/9.24 seen in 10. The key HMBC correlations of H-8 (δH 7.00) to C-21 (δC 172.0), C-6 (δC 52.9) and C-7 (δC 130.6) confirmed that the aldehyde in asperophiobolin G (10) was oxidized to a carboxylic acid in 1. The key 1H-1H COSY and HMBC correlations confirmed the planar structure of 1 (Figure 2).
The relative configuration of 1 was deduced from a ROESY experiment (Figure 3) as well as by comparing the NMR data with that of 10. The ROESY correlations of H-2 (δH 2.88) with H3-22 (δH 0.99), H-1β (δH 2.16) and of H-6 (δH 3.44) with H-1α (δH 1.20) indicated the trans-fused A/B ring which was confirmed by the 13C resonance of C-1 at δC 47.1 and C-22 at δC 23.1 since the 13C resonance signals of C-1 and C-22 usually resonate at higher field when the A/B ring are cis rather than trans [7]. The ROESY correlations of H-1α (δH 1.20) with H-6 (δH 3.44), H-10 (δH 2.65) and H-14 (δH 1.95), along with of H-1β (δH 2.16) with H3-22 (δH 0.99) indicated that B/C ring was also trans-fused and H-14 was α-oriented. In addition, the correlations of H-14 (δH 1.95) with H-15 (δH 2.64) in the ROESY spectrum revealed that H-15 should be also α-oriented. The ROESY correlation of H-15 (δH 2.64) and H-18 (δH 4.17), along with the relatively small J16,17 value (9.1 Hz), supported the Z-configuration of the Δ16,17-double bond. The absolute configuration of the 18,19-diol moiety was identified by the induced ECD spectrum of its in situ complex with Mo2(OAc)4 in DMSO solution [12,19]. On the basis of the empirical helicity rule relating the sign of the Cotton effect of the diagnostic O-C-C-O moiety, the negative Cotton effect at 310 nm indicated an 18R configuration. Finally, the absolute configuration of compound 1 was determined by experimental and calculated electronic circular dichroism (ECD) analysis (Figure 4). Thus, the structure of compound 1 was determined and named 18,19-dihydro-18,19-dihydroxyasperophiobolin E. Full assignments of the 1H- and 13C-NMR data were achieved by analyses of 1D- and 2D-NMR spectra (Table 1, Supplementary Figure S1–S10).
Compound 2 was obtained as a white amorphous powder. The molecular formula was deduced as C25H34O3 on the basis of HR ESI-Q-TOF MS and 13C-NMR data, indicating nine degrees of unsaturation. The 1H-NMR spectrum provided the resonances for five methyl groups and four olefinic protons, while the 13C-NMR spectrum exhibited two carbonyl carbons for keto at δC 196.7 and carboxylic acid group at δC 174.7 and eight olefinic carbons for four double bonds. Comparison of the NMR data with those of asperophiobolin E (7) [12] revealed that they had similar structures, establishing an ophiobolin-based sesterterpenoid nucleus. The double bond at C-6 and C-7 in 2 was identified by HMBC correlations from H-2 (δH 3.37) to C-6 (δC 140.8) and from H-8 (δH 2.52, 2.40) to C-6 (δC 140.8), C-7 (δC 139.5) and C-21 (δC 174.7). Thus, the planar structure of 2 was determined, which was confirmed by key 1H-1H COSY and HMBC correlations (Figure 2). The relative configuration of compound 2 was determined by ROESY experiments. In the ROESY spectrum, H-2 (δH 3.37) correlated with H-22 (δH 1.20), indicating that they were in the same orientation; while H-14 (δH 1.94) correlated with H-10 (δH 2.07) and H-15 (δH 2.64), indicating that they had the same orientation. This demonstrated that the B/C ring was trans-fused while the C-14 side chain was β- oriented. Moreover, the coupling constant between H-16 and H-17 (J16,17 = 9.6 Hz) and ROESY correlation of H-15 (δH 2.64)/H-18 (δH 6.06) supported the Z-configuration of the Δ16,17-double bond. The absolute configuration of compound 2 was determined by experimental and calculated electronic circular dichroism (ECD) analysis (Figure 4). Thus, the structure of compound 2 was identified and named Δ16,17-8-dehydroxy-ophiobolin D. Full assignments of the 1H- and 13C-NMR data were achieved by analyses of 1D- and 2D-NMR spectra (Table 1, Supplementary Figure S11–S20).
Compound 3 was obtained as a white amorphous powder and had a molecular formula of C25H34O4, as determined by the HR ESI-Q-TOF MS and 13C-NMR data, requiring nine indices of hydrogen deficiency. The 1H- and 13C-NMR spectra showed the characteristic signals of ophiobolin sesterterpenoid: five methyl groups at δH/C 1.40/ 25.5, δH/C 1.19/26.3, δH/C 1.17/ 24.9, δH/C 1.01/ 21.5, and δH/C 0.90/ 23.7, eight olefinic carbons for four double bonds, and two carbonyl carbons for keto at δC 198.0 and carboxylic acid group at δC 175.0. Comparison of the 1H- and 13C-NMR data with those of 2 suggested that they had the similar structures and the difference between them lay in the chemical shift of C-8. The 13C resonance of C-8 at δC 73.4 in 3, but not δC 32.3 in 2, indicated that compound 3 was a hydroxylated product of 2. The key 1H-1H COSY and HMBC correlations confirmed the deduction mentioned above (Figure 2). The relative configuration of compound 3 was identified by analysis of ROESY data and comparison of the NMR data with that of 2 (Figure 3). The key ROESY correlation between H-8 (δH 4.39) and H-10 (δH 1.91) indicated that the hydroxyl group of C-8 was β orientation in 3. The Z-configuration of Δ16,17 was identified by the ROESY correlation of H-15 (δH 2.64) and H-18 (δH 6.09). The absolute configuration of compound 3 was determined by experimental and calculated electronic circular dichroism (ECD) analysis (Figure 4). Thus, the structure of compound 3 was identified and named Δ16,17-ophiobolin D. Full assignments of the 1H- and 13C-NMR data were achieved by analyses of 1D- and 2D-NMR spectra (Table 1, Supplementary Figure S21–S30).
Compound 4 was isolated as a white amorphous powder. It had the molecular formula of C25H38O8 based on analyses of the HR ESI-Q-TOF MS and 13C-NMR data, indicating seven degrees of unsaturation. The 1H- and 13C-NMR spectra showed great similarity to those of ophiobolin U [9], suggested that they had the similar structures. The difference between them was found in the NMR data of C-21. The 1H and 13C resonance of C-21 changed from δ 9.24/194.7 in ophiobolin U to δC 174.7 in 4, indicating that the aldehyde group at C-21 in ophiobolin U was oxidized to carboxylic acid in 4. Thus, the planar structure of compound 4 was determined, which was confirmed by key 1H-1H COSY and HMBC correlations (Figure 2). The cis-fused A/B ring system was established by the key ROESY correlation of H-2 (δH 2.31) with H-6 (δH 3.17) and the 13C resonance of C-1 at δC 36.7 and C-22 at δC 19.1 [7]. The other key ROESY correlations in compound 4 matched with those of ophiobolin U, indicating the same stereochemistry. The absolute configuration of compound 4 was determined by experimental and calculated electronic circular dichroism (ECD) analysis (Figure 4). Thus, the structure of compound 4 was identified and named asperophiobolin L. Full assignments of the 1H- and 13C-NMR data were achieved by analyses of 1D- and 2D-NMR spectra (Table 1, Supplementary Figure S31–S40).
Compound 5 were isolated as a white amorphous powder. It had a molecular formula of C25H38O8 based on the HR ESI-Q-TOF MS and 13C-NMR data, the same as that of 4. The 1H- and 13C-NMR data of compound 5 was almost identical with those of 4. The planar structure of compound 5 was confirmed by 1H-1H COSY and HMBC correlations (Figure 2). Detailed examination of the NMR data revealed that the difference between them lay in the side chain configuration of the double bond. The ROESY correlations of H-17 (δH 6.03)/H-24 (δH 1.72) and H-18 (δH 6.03)/H-25 (δH 1.79) supported the Z-configuration of the Δ16,17-double bond in compound 4; while the E-configuration of the Δ16,17-double bond in compound 5 can be deduced by the key ROESY correlations of H-16 (δH 5.22) /H-17 (δH 6.03) /H-25 (δH 1.79) and of H-18 (δH 6.03) /H-24 (δH 1.72) (Figure 3). The absolute configuration of compound 5 was determined by experimental and calculated electronic circular dichroism (ECD) analysis (Figure 4). Thus, the structure of compound 5 was identified and named (16E)-asperophiobolin L. Full assignments of the 1H- and 13C-NMR data were achieved by analyses of 1D- and 2D-NMR spectra (Table 1, Supplementary Figure S41–S50).

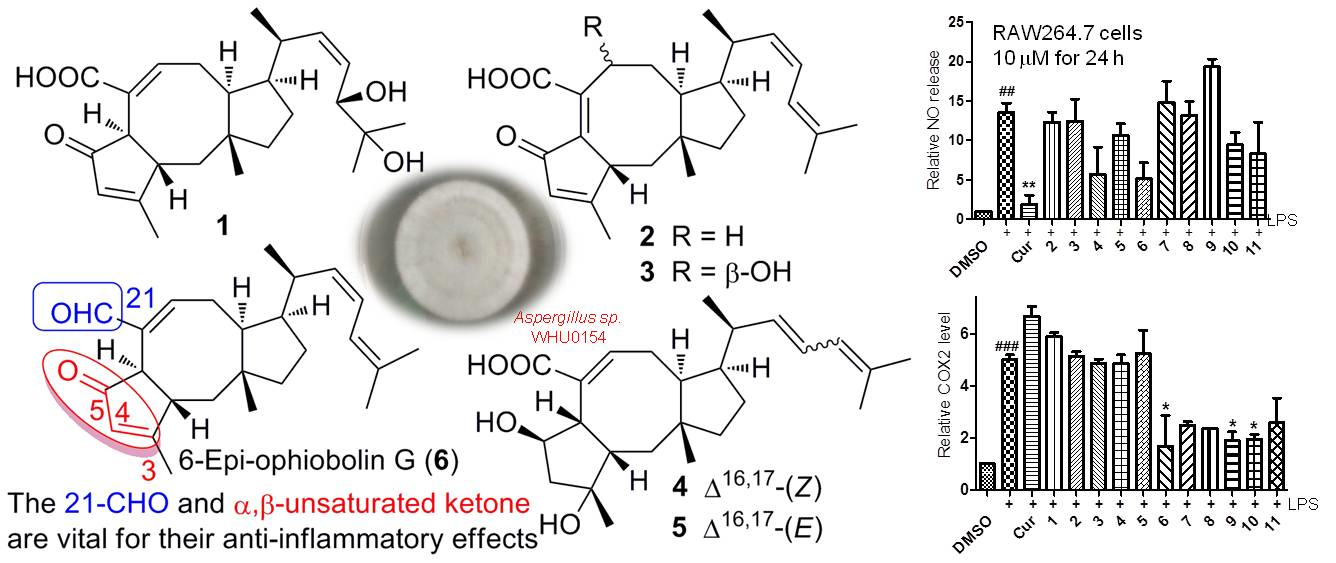
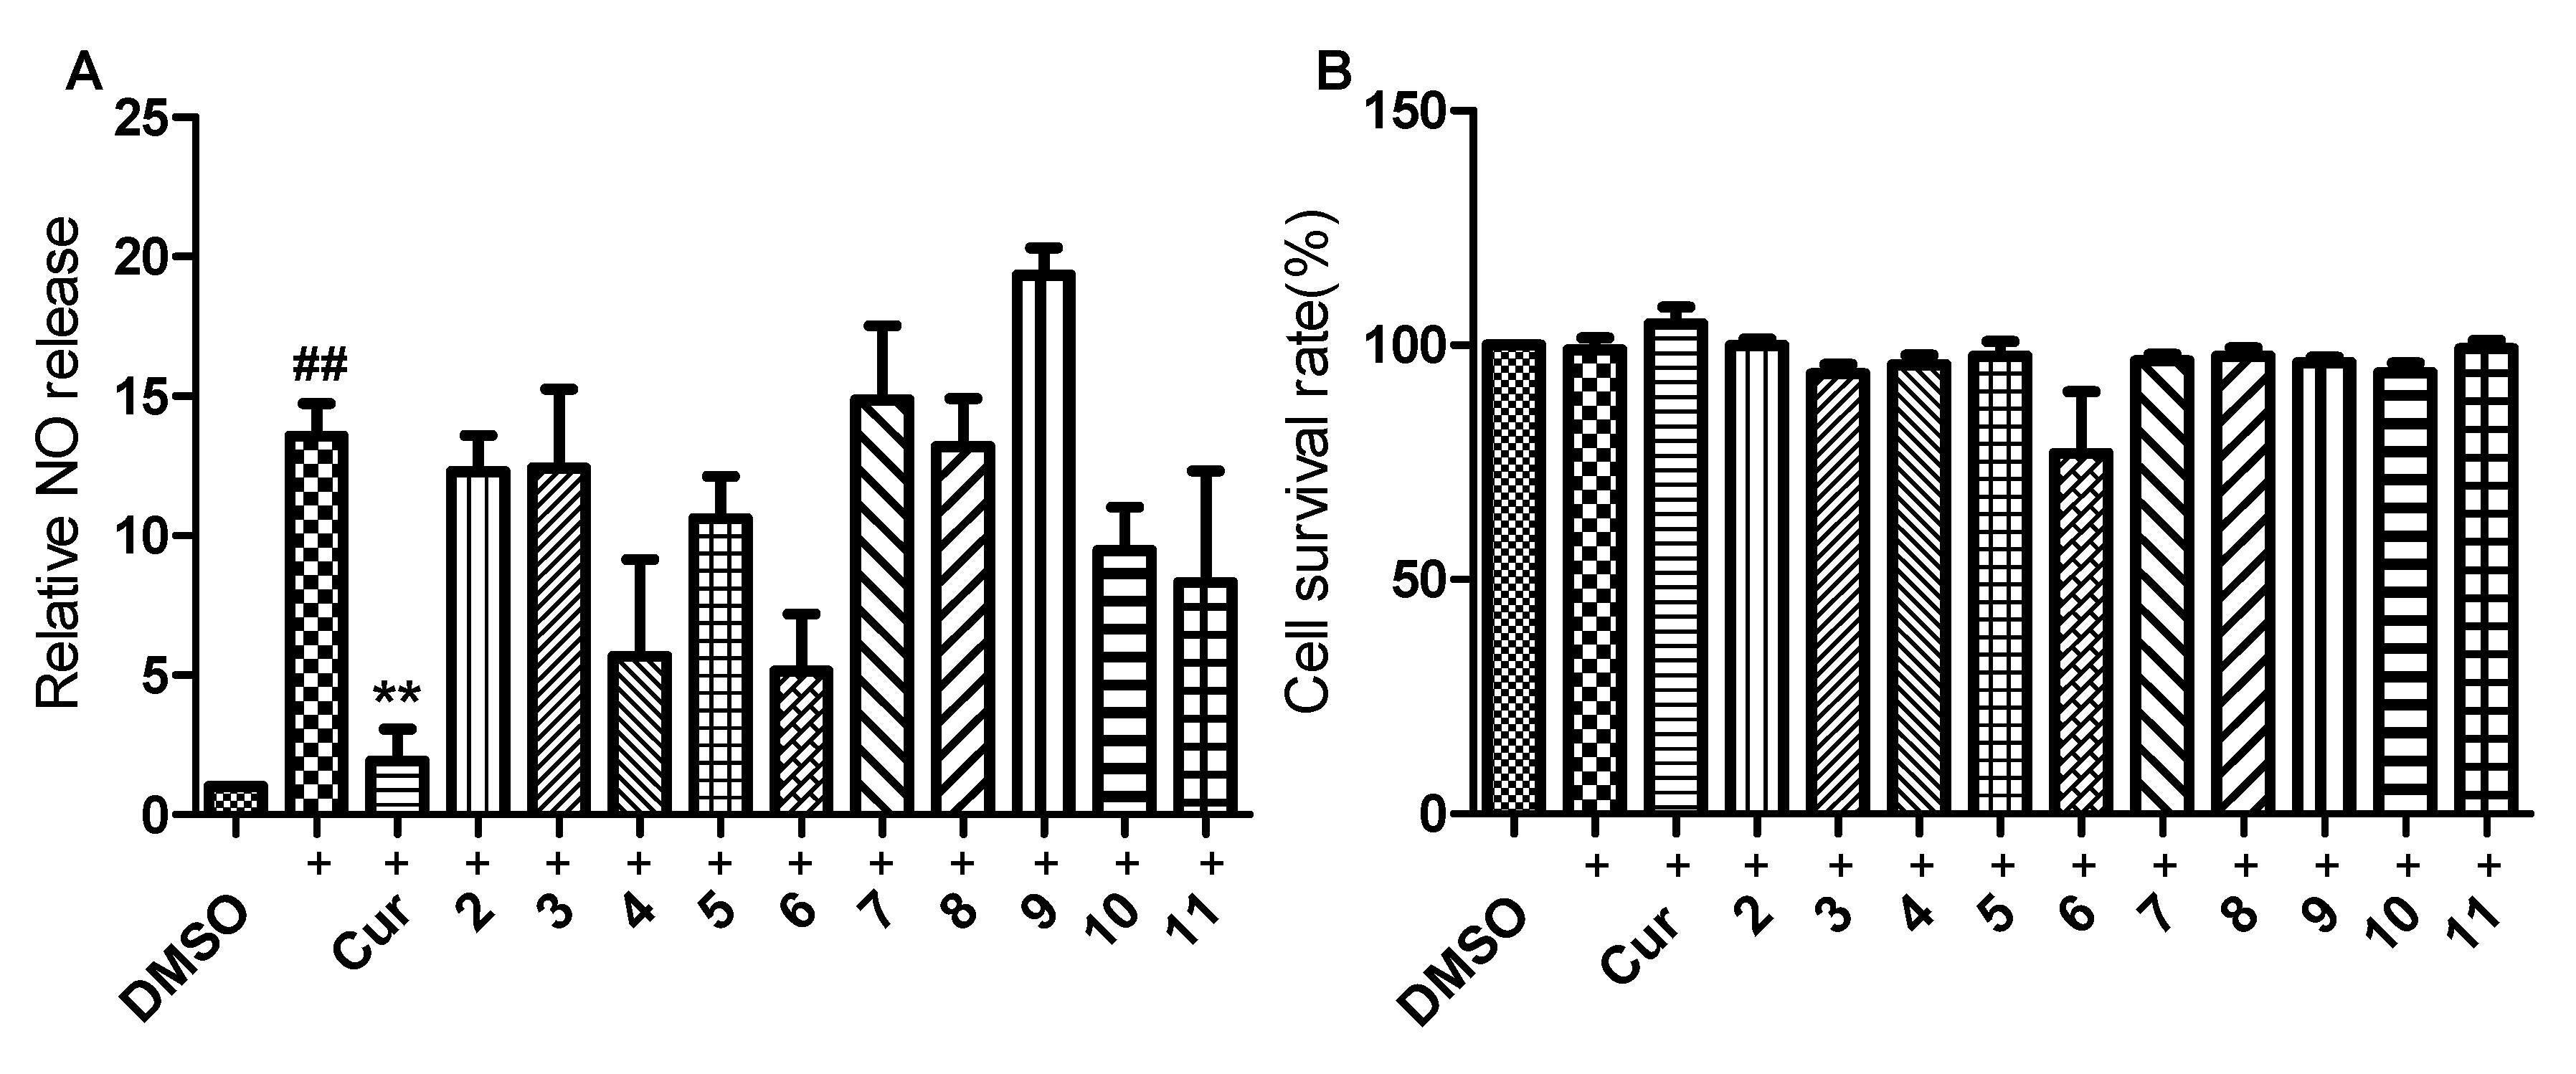
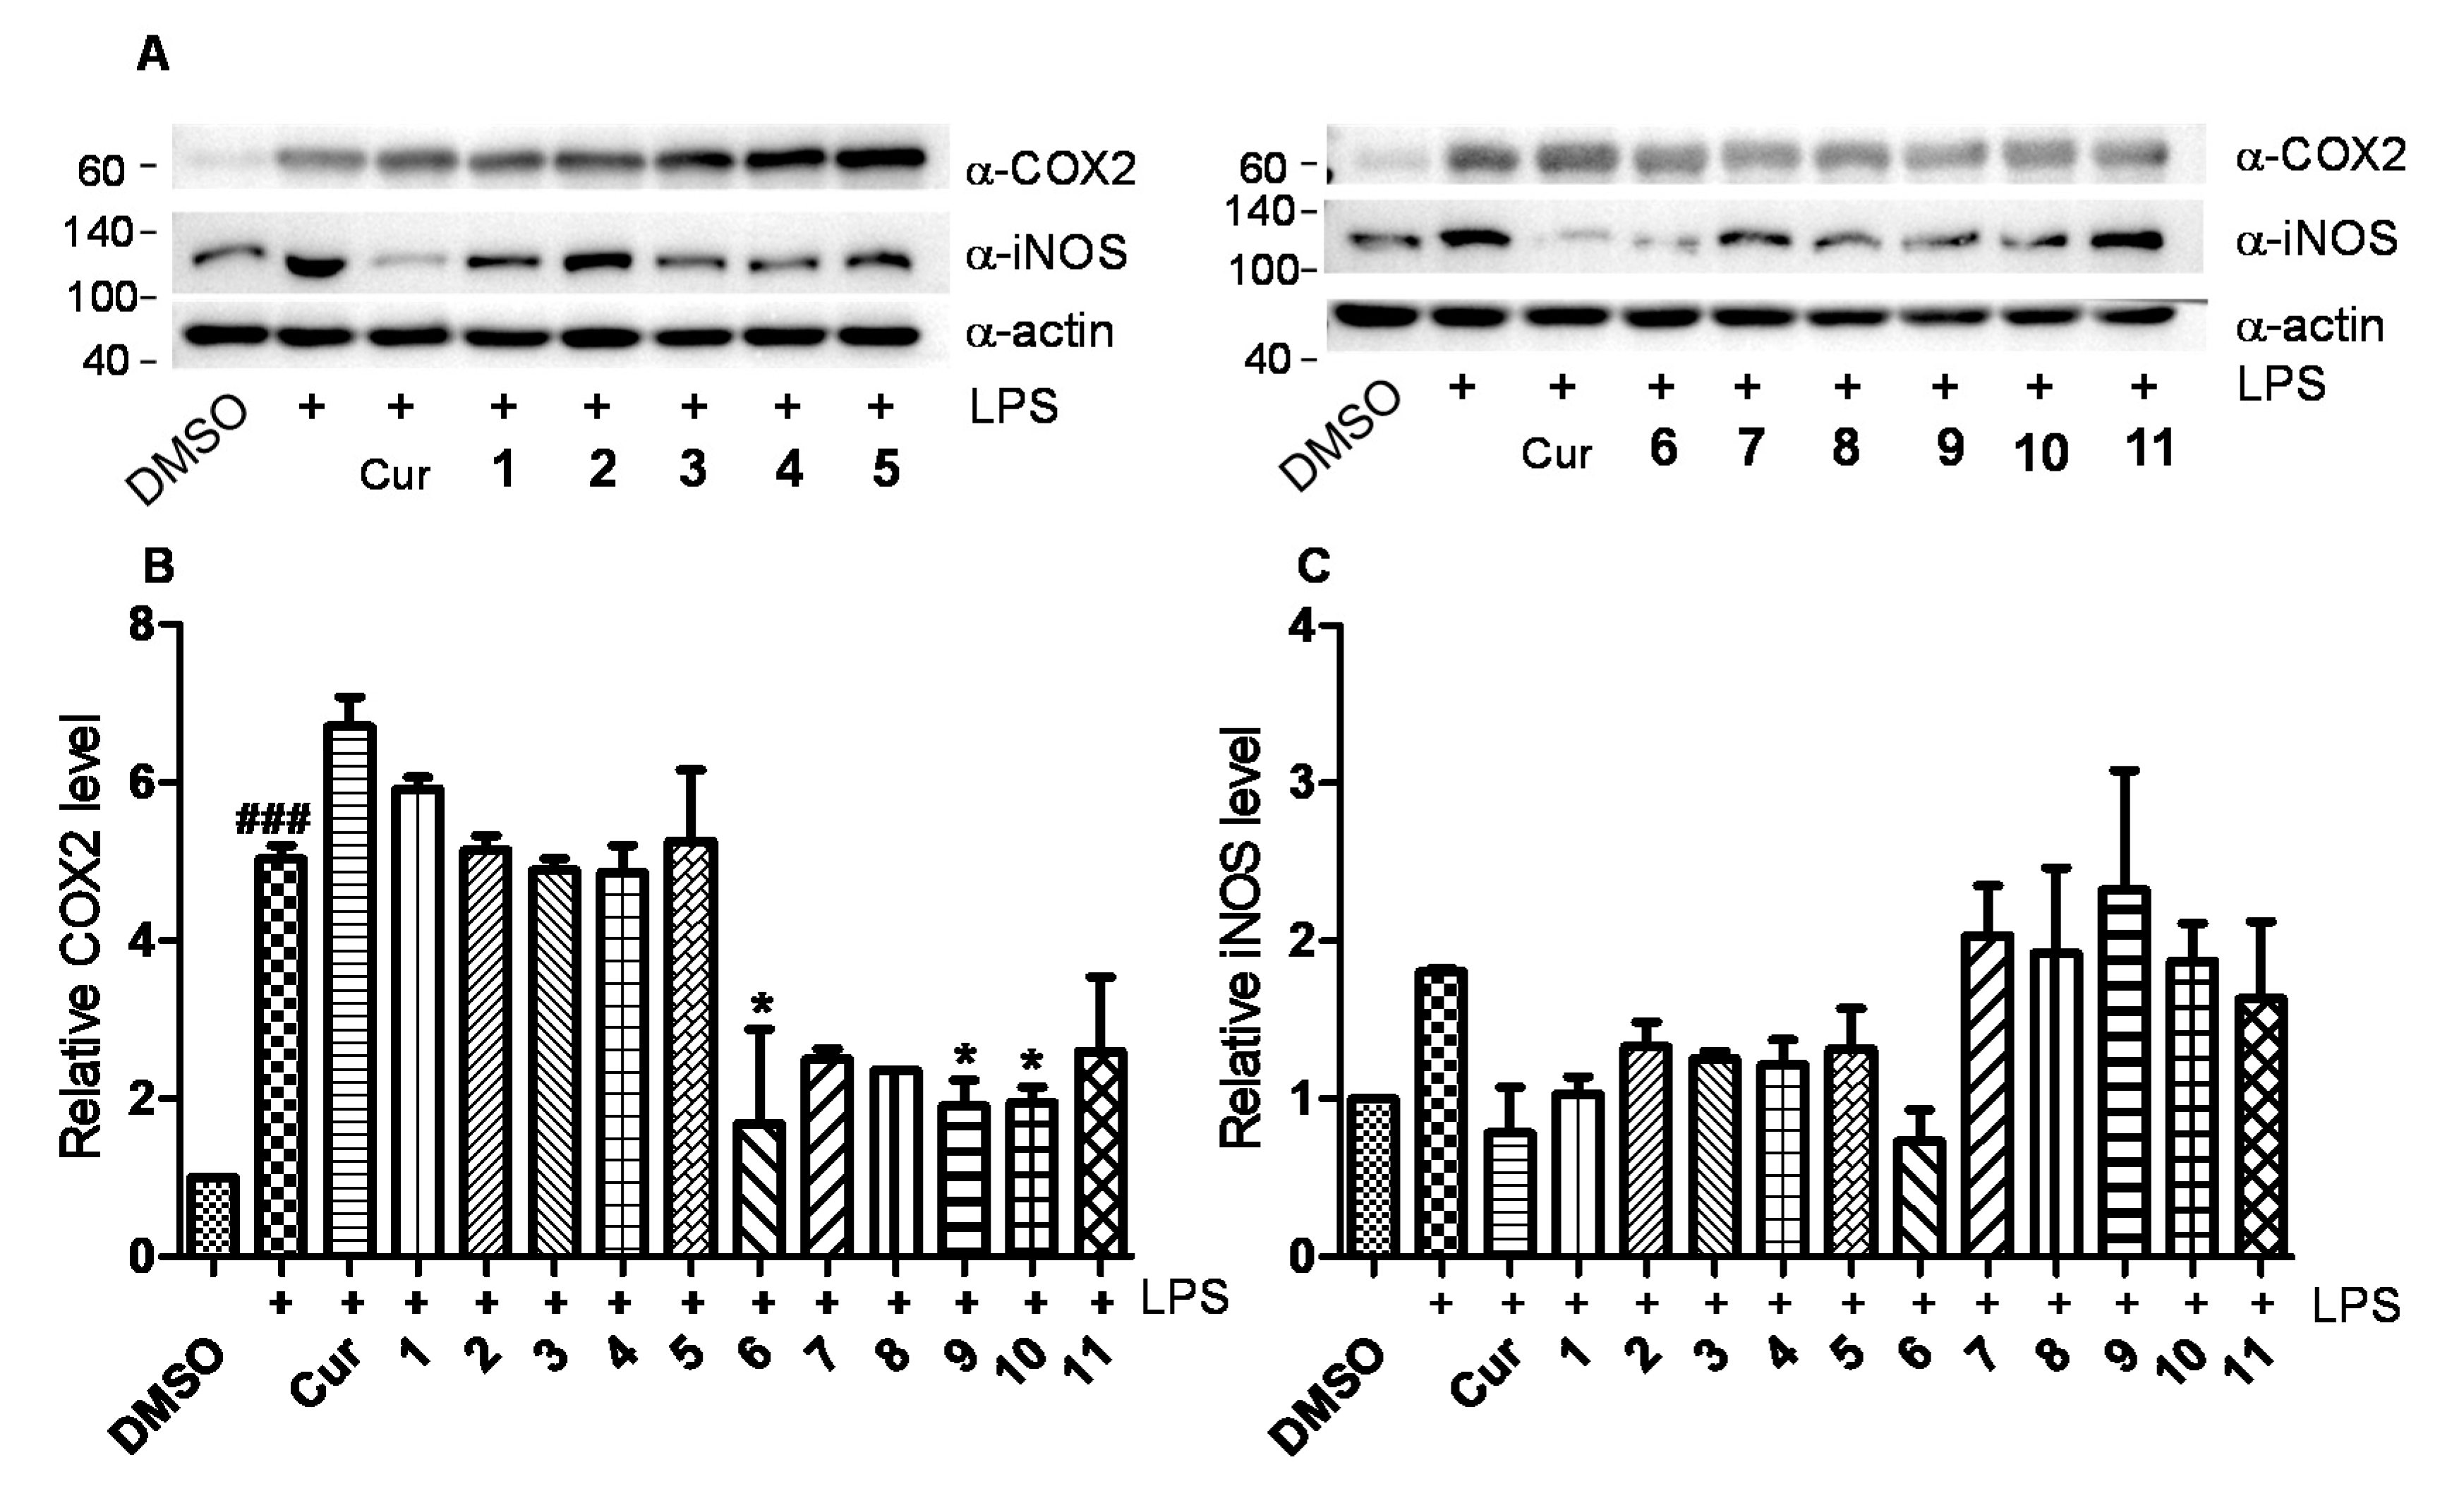
2.2. Anti-Inflammatory Bioactivities

The anti-inflammatory effects of ophiobolins 211 were first evaluated by detecting the NO production induced by LPS in murine macrophage RAW264.7 cells. Curcumin was used as positive control. Results showed that compounds 4 and 6 exhibited obvious inhibitory effects on NO production induced by LPS in RAW264.7 cells although no statistical significance was observed (Figure 5A). Meanwhile, these compounds except 6 had no cytotoxicity at all toward RAW264.7 cells at indicated concentrations (Figure 5B). Even though compound 6 reduced the cell survival rate to ~77 ± 18%, there was no statistical difference between control and compound 6 (Figure 5B). Therefore, these compounds did not significantly affect cell survival.
Mechanical sudies revealed that compound 6 could obviously inhibit the expression of iNOS induced by LPS in RAW264.7 cells (Figure 6A–C). Also, compounds 6, 9, and 10 could inhibit the expression of COX 2 induced by LPS in RAW264.7 cells (Figure 6A,B). Preliminary structure-activity relationship (SAR) analysis revealed that the aldehyde group at C21 in ophiobolins is vital for their anti-inflammatory activities since compounds 13 and 7 didn’t show obvious bioactivities. Also, α,β-unsaturated ketone in A ring may also be crucial for their anti-inflammatory effects since compound 11 didn’t exhibit obvious anti-inflammatory effect.
Together, our studies demonstrated that ophiobolin 6 could inhibit the NO production induced by LPS in RAW264.7 cells by suppressing the expression of iNOS. Also, compounds 6, 9, and 10 could exhibit anti-inflammatory effect by inhibiting the expression of COX 2. These results have broaden the application of ophiobolins.

3. Discussion

Ophiobolins are widely distributed in fungus secondary metabolites, produced by the pathogenic plant fungi [6,20,21], mangrove endophytic fungi [12,22], and fungi from marine sediments [7,21]. Here we first reported the discovery of ophiobolins from deep-sea fungus from around 3200 m depth of the South China Sea. Previous studies were mainly focus on the phytotoxin, anti-bacterial and anticancer activities of this kind of compounds [7,10,11,13,14,20,21,22,23]. Scattered reports were involved in the anti-inflammatory effects of this type of compounds [12,24]. Aniko et al., reported that treatment of male Wistar rats with 1.0 mg/kg of ophiobolin A could promote systemic inflammation by elevating the concentration of interleukin-6 (IL-6) and tumor necrosis factor-alpha (TNF-α) as well as the activity of heme oxygenase (HO) and myeloperoxidase (MPO) in plasma [24]. Cai et al., reported that some ophiobolins could inhibit the production of NO induced by LPS in RAW264.7 macrophage cells [12]. Our results were line with that reported by cai et al., The contradictory results may be explained by different models of assessment and treatment dose and time point.
In addition, here we first discussed the preliminary SAR analysis of the anti-inflammatory effects of ophiobolins and their underlying mechanisms. Combined with previous report [12], we can conclude that the aldehyde group at C-21 and the α,β-unsaturated ketone functionality at A ring in ophiobolins were indeed crucial for their anti-inflammatory effects. In addition, compound 6 only slightly affected the cell survive with no statistical significance was observed, which indicated us to assess its cytotoxicity while evaluating its anti-inflammatory. To sum up, our results provide critical information for further medicinal chemistry research of ophiobolins and help for the discovery of more potent anti-inflammatory agents.

4. Materials and Methods

4.1. General Experimental Procedure

1D- and 2D-NMR data were determined with a Bruker AV 600 instrument (Bruker, Bremen, Germany) using solvent signal (CD3OD: δH 3.31/δC 49.0) as an internal reference. A JASCO FT/IR-480 plus spectrometer (JASCO International Co. Ltd., Tokyo, Japan) was used to measure the IR spectra. The UV/vis spectra were obtained using a JASCO V-550 UV/Vis (JASCO International Co. Ltd., Tokyo, Japan) and HR-ESI-MS spectra were acquired on a Waters Synapt G2 mass spectrometer (Waters, Manchester, UK). HPLC analyses were carried out on an LC-20AB Liquid Chromatography system equipped with a SPD-M20A DAD detector (Shimadzu, Kyoto, Japan) using a Cosmosil-Triart C18 column (5 µm, φ 4.6 × 250 mm, NacalaiTesque, Kyoto, Japan). The semi-preparative HPLC was performed on a Shimadzu LC-20AT Liquid Chromatography system (Shimadzu, Kyoto, Japan) with a SPD-20A UV/Vis detector (Shimadzu, Kyoto, Japan) using a Cosmosil-Pack ODS-A column (5 μm, φ 10 × 250 mm, NacalaiTesque, Kyoto, Japan).
MeOH and acetonitrile (CH3CN) for HPLC were purchased from BCR International Co. Ltd. (Shanghai, China) and Merck (Darmstadt, Germany), respectively. Silica gel (200–300 mesh, Qingdao Marine Chemical Ltd., Shandong, China), and octadecylsilanized (ODS) (12 nm, 50 μm, YMC Ltd., Tokyo, Japan) were used for column chromatography (CC). Pre-coated silica gel plates (SGF254, 0.2 mm, Yantai Chemical Industry Research Institute, Shandong, China) were used for the TLC analyses.
DMSO and methyl thiazolyl tetrazolium (MTT) were purchased from Aladdin Reagent Co., Ltd. (Shanghai, China). NO assay kit was purchased from Beyotime Institute of Biotechnology (Shanghai, China). Antibodies for iNOS (#13120S) and COX 2 (#12282T) were purchased from Cell Signaling Technology (Beverly, MA, USA). Antibody for β-action (#AP0060) was purchased from Bioworld Technology Inc (Louis Park, MN, USA). HRP-conjugated secondary anti-rabbit (#GTX213110-01) and anti-mouse (#GTX213111-01) antibodies were acquired from GeneTex Inc (Irvine, CA, USA).

4.2. Fungal Material and Identification

Strain WHU0154 was isolated from a deep sea sample at 117°51.41′E, 19°50.71′N and 3197 m depth, South China Sea, on Thayer-Martin agar (glucose 10 g, peptone 5 g, KH2PO4 1 g, MgSO4 0.5 g, Rose Bengal 0.03 g, sea salts 15 g, agar 20 g, ddH2O 1L). The strain was first selected by antibacterial activities against Staphylococcus aureus ATCC 5165 of its culture crude extracts. It was identified as Aspergillus sp. according to the morphological characteristics of typical Aspergillus conidia structure (Supplementary Figure S51) and the internal transcribed spacer (ITS) sequence (GeneBank accession number MW228045), which is 98.85% similarity to Aspergillus asper NRRL 35910 (NCBI Reference Sequence: NR_151788.1), and is stored at −80 °C in School of Pharmaceutical Sciences, Wuhan University, China.

4.3. Cultivation, Extraction and Isolation

The initial cultures were maintained on the potato dextrose agar PDA (200 g of potato, 20 g of glucose, 20 g of agar, 1 L of pure water, pH natural) solid medium plates for 3 or 4 days. Matured spores were aseptically inoculated into 15 conical flasks (500 mL), each containing one-third of the PDA liquid medium (200 g of potato, 20 g of glucose, 1 L of pure water, pH natural), and continued to be cultured as seed solution for 7 days. Then the seed solution was aseptically inoculated into 500 mL/1L/3L conical flasks, each containing one-third of the liquid medium, the fermentation was performed on PDA liquid medium and statically cultured at 25 °C for 27 days.

4.4. Extraction and Isolation

The whole fermentation broth (16 L) was filtered by Buchner filter to separate the mycelia and the filtrate. The filtrate was extracted with an equal volume of ethyl acetate (EtOAc) for three times. The combined organic layer was concentrated under reduced pressure to afford 3.7 g of extract. The EtOAc extract (3.7 g) was subjected to silica gel (200–300 mesh) column chromatography using a petroleum ether-EtOAc gradient (from 1: 0 to 0: 1) and EtOAc-MeOH (0: 1) to obtain 10 fractions (Fr.1 to Fr.10). Fraction 6 (0.53 g) was applied to an open ODS column chromatography eluted with stepwise gradient of 20–100% MeOH-H2O to get ten subfractions (Fr.6-1 to Fr.6-10). The subfraction 6-9 (0.2528 g) was further chromatographed by a silica gel (200–300 mesh) column chromatography using a Petroleum ether-EtOAc (95:5/9:1/8:2/1:1/0:1) and EtOAc-MeOH (0: 1) to give six subfractions (Fr.6-9-1 to Fr.6-9-6). The subfraction 6-9-2 (32.6 mg) was purified by semipreparative reversed-phase (RP) HPLC [65% MeCN-H2O (0.1% CH3COOH)] to yield compounds 2 (1.7 mg) and 6 (2.6 mg). The subfraction 6–10 (58.5 mg) was subjected to RP-HPLC (80% MeOH-H2O) to obtain compounds 7 (1.9 mg) and 8 (1.6 mg). The fraction 7 (1.20 g) was subjected to an ODS column chromatography by stepwise gradient elution of 20−100% MeOH-H2O to get 10 subfractions (Fr.7-1 to Fr.7-10). The subfraction 7–5 (127.0 mg) was purified by semipreparative RP-HPLC [28% MeCN-H2O (0.1% CH3COOH)] to obtain compound 10 (13.1 mg). The subfraction 7–6 (0.56 g) was applied to silica gel CC eluted with gradient Petroleum ether-EtOAc (9: 1/8: 2/7: 3/1: 1/0: 1) and EtOAc-MeOH (0: 1) to get seven subfractions (Fr.7-6-1 to Fr.7-6-7). The subfraction 7-6-4 (111.5 mg) was purified by RP-HPLC [45% MeOH-H2O (0.1% CH3COOH)] to obtain compound 11 (4.5 mg). The subfraction 7-6-5 (82.6 mg) was subjected to RP-HPLC (65% MeOH-H2O) to obtain compounds 1 (2.4 mg) and 9 (3.3 mg). The subfraction 7–8 was subjected to RP-HPLC eluted with 80% MeOH-H2O to afford compounds 3 (5.3 mg), 4 (25.1 mg), and 5 (2.6 mg).
18,19-Dihydro-18,19-dihydroxyasperophiobolin E (1): White amorphous powder; [α ] D 35 + 70.7 (c 1.3, MeOH); UV(MeOH)(logε) λmax 230(2.59); IR (KBr) νmax 3434, 2965, 2927, 2666, 1681, 1617, 1553, 1455, 1379, 1316, 1261, 1220, 1187, 1156, 1049, 1017, 962, 904, 858, 797, 756 cm−1; CD (MeOH) (∆ε) 306 (−0.42), 230 (+11.6); 1H- and 13C-NMR data, see Table 1; HRESIMS m/z 417.2645 [M + H]+ (calcd for C25H37O5, 417.2641).
Δ16,17-8-Dehydroxyophiobolin D (2): White amorphous powder; [α ] D 35 + 77.1 (c 0.45, MeOH); UV(MeOH)(logε) λmax 241(1.43); IR (KBr) νmax 2965, 2863, 2730, 1605, 1455, 1385, 1127, 1080 cm−1; CD (MeOH) (∆ε) 283 (+0.72), 242 (+1.73), 208(−0.89); 1H- and 13C-NMR data, see Table 1; HRESIMS m/z 383.2595 [M + H]+ (calcd for C25H34O3, 383.2586).
Δ16,17-Ophiobolin D (3): White amorphous powder; [α ] D 35 + 112.5 (c 2.4, MeOH); UV (MeOH) (logε) λmax 241(2.81); IR (KBr) νmax 3428, 2930, 1687, 1608, 1382, 1135 cm−1; CD (MeOH) (∆ε) 351 (+0.39), 275 (+0.99), 233(+1.87), 205(−4.4); 1H- and 13C-NMR data, see Table 1; HRESIMS m/z 399.2537 [M + H]+ (calcd for C25H35O4, 399.2535).
Asperophiobolin L (4): White amorphous powder; [α ] D 35 + 24.5 (c 1.7, MeOH); UV(MeOH)(logε) λmax 238(2.87); IR (KBr) νmax 2944, 1643, 1452, 1376, 1267, 1194, 1098, 1057, 666 cm−1; CD (MeOH) (∆ε) 244 (−3.45), 218 (−0.96), 207 (−1.74); 1H- and 13C-NMR data, see Table 1; HRESIMS m/z 805.5614 [2M + H]+ (calcd for C50H77O8, 805.5618).
(16E)-Asperophiobolin L (5): White amorphous powder; [α ] D 35 + 7.6 (c 1.95, MeOH); UV (MeOH) (logε) λmax 221(1.75); IR (KBr) νmax 2962, 2857, 2736, 1678, 1631, 1449, 1385, 1200, 1141 cm−1; CD (MeOH) (∆ε) 302(−0.08), 270 (−0.05), 223 (−0.9); 1H- and 13C-NMR data, see Table 1; HRESIMS m/z 805.5621 [2M + H]+ (calcd for C50H77O8, 805.5618).

4.5. Quantum Chemical ECD Calculations of 1–5

The electronic circular dichroism (ECD) spectra of each conformer for 15 were calculated by the TDDFT methodology with MeOH as solvent. Firstly, the SMILES codes of molecules of 1a (2S, 6R, 10S, 11R, 14R, 15S, 18S), 2a (2R, 10S, 11R, 14R, 15S), 3a (2R, 8S, 10S, 11R, 14R, 15S), 4a (2S, 3R, 5R, 6S, 10S, 11R, 14R, 15S) and 5a (2S, 3R, 5R, 6S, 10S, 11R, 14R, 15S) were acquired before the initial 3D structures were generated with CORINA version 3.4 (https://www.mn-am.com/online_demos/corina_demo). Subsequently, CONFLEX version 7.0 (http://www.conflex.net/) was used to acquire the conformer databases via the MMFF94s force-field, during which, an energy window of 5 kcal mol−1 for 14 and 3 kcal mol1 for 5, above the ground state, for acceptable conformers (ewindow), a maximum number of conformations per molecule (maxconfs) of 100, and an RMSD cutoff (rmsd) of 0.5Å were considered. Then, all the acceptable conformers were optimized with HF/6-31G(d) method in Gaussian 09, respectively, and subsequent further optimization at the B3LYP/6-31G(d) level with MeOH led the dihedral angles to be got. After that, stable conformers, 74 for 1a, 9 for 2a, 23 for 3a, 48 for 4a and 42 for 5a, were obtained. The optimized conformers were taken for the ECD calculations by Gaussian 09 at the B3LYP/TZVP level. The solvent effect was taken into account by the polarizable-conductor calculation model (IEFPCM, MeOH as the solvent) [25]. Then, the electronic circular dichroism (ECD) spectra of 1b (2R, 6S, 10R, 11S, 14S, 15R, 18R), 2b (2S, 10R, 11S, 14S, 15R), 3b (2S, 8R, 10R, 11S, 14S, 15R), 4b (2R, 3S, 5S, 6R, 10R, 11S, 14S, 15R) and 5b (2R, 3S, 5S, 6R, 10R, 11S, 14S, 15R) were also calculated as the same method. Finally, the software SpecDis (Version 1.70, Berlin, Germany). was used to compare the experimental and calculated spectra of 15, during which, a UV shift to the ECD spectra, Gaussian broadening of the excitations, and Boltzmann weighting of the spectra were considered [26].

4.6. Cell Culture

The murine macrophage RAW264.7 cells were obtained from the American Type Culture Collection (ATCC, Rockefeller, MD, USA). The cells were grown in Dulbecco’s modified Eagle’s medium (DMEM) medium with 10% FBS (ExCell bio, Shanghai, China) at 37 °C in a 98% humidified incubator with 5% CO2 and 95% air. The cells were routinely split once every 1–2 days.

4.7. Measurement of Cell Viability

MTT assay was used to determine the effects of ophiobolins on the viability of RAW264.7 cells. All compounds were dissolved in DMSO at 10 mM stock concentration and stored at −20 °C. DMSO was used as blank control. The final concentration of DMSO kept below 0.1% in cell culture throughout the biological study. The cells were seeded in a 96-well plate (1.5 × 10⁴ cells/well) overnight and treated with compounds (10 μM) and LPS (500 ng/mL) for 24 h. Then, 20 μL of MTT (5 mg/mL) was added to each well for an additional 4 h. The resulting formazan crystals after aspiration of the culture medium were dissolved in DMSO (150 μL/well) and the optical densities (OD, Synergy HT, BioTek, VT, USA) were measured at 570 nm. The data was presented as means ± SEM of three independent experiments.

4.8. NO Assay

The Griess method was used to measure NO concentrations in culture supernatants. Cells were seeded into 96-well plates at a density of 1.5 × 10⁴ cells/well. After adhesion, the cells were treated with 10 μM of compounds and LPS (500 ng/mL) for 24 h. Nitrite release in the culture media was determined using the Griess reaction and presumed to reflect the NO levels. Briefly, the samples were mixed with equal volume of Griess reagent (1% sulfanilamide in 5% phosphoric acid and 0.1% naphthylethylenediamine dihydrochloride) and then incubated at room temperature for 10 min. The absorbance was measured at 540 nm on a microplate reader (Synergy HT, BioTek, VT, USA). And the NO concentration was determined at 540 nm using NaNO2 as a standard. The data was presented as means ± SEM of three independent experiments

4.9. Western Blot

Briefly, 2 × 10⁶ cells/well were seeded in a 6-well flat-bottomed plate, grown at 37 °C for 24 h, and treated with ophiobolin derivatives(10 μM) and LPS (100 ng/mL) for 24 h. Total cell lysates were harvested in lysis buffer (Beyotime Inst. Biotech, Shanghai, China) containing 1 mM phenylmethylsulfonyl fluoride (Beyotime Inst. Biotech). The protein concentration was measured using the Pierce® BCA Protein Assay Kit (#23225, Pierce, Thermo, MA, USA). Equal amount of total proteins (~40 μg) were separated on 6–15% polyacrylamide gelelectrophoresis (SDS-PAGE) and transferred to poly(vinylidene fluoride) (PVDF) membranes (#IPVH00010, Millipore, Billerica, MA, USA). The membranes were blocked with 5% skim milk and probed with primary antibodies specific for iNOS, COX 2 and β-actin overnight at 4 °C followed by horseradish peroxidase conjugated secondary antibodies for 1 h, reacted with Pierce® ECL Western Blotting Substrate (Thermo Fisher Scientific, Franklin, MA, USA) and detected by an ECL detection imaging system (BioTanon, Shanghai, China). The data was presented as means ± SEM of three independent experiments

4.10. Statistical Analysis

The statistical analyses were performed by using GraphPad Prism software version 5 (GraphPad Software, Inc., San Diego, CA, USA). Each experiment was performed at least three replicates and the results were presented as mean ± SEM. Multiple comparisons were carried out by one-way ANOVA, followed by Tukey’s test. p < 0.05 was considered statistically significant.

Supplementary Materials

The HR-ESI-Q-TOF-MS, UV, IR, and 1D-, 2D-NMR spectra of compounds 15, along with cultural and microscopic morphology of strain WHU0154, are available online at https://www.mdpi.com/1660-3397/18/11/575/s1.

Author Contributions

W.D., F.W., C.U. investigation, formal analysis, validation, data curation; Y.X., N.W., L.H., M.C. investigation, formal analysis; D.T., software, formal analysis, validation; Y.Z. supervision, writing—review and editing; J.T., K.H. conceptualization, resources, supervision, writing—original draft preparation, writing—review and editing, funding acquisition. All authors have read and agreed to the published version of the manuscript.

Funding

This research was funded by grants from National Key Research and Development Program of China (Grant Numbers: 2018YFC0311002).

Acknowledgments

We are grateful to P. Lin for the HR-ESI-MS measurement and Lvshan Yu, Qinyu Li, Ruihan Li for their help on strain isolation. This work was also supported by The High Performance Public Computing Service Platform of Jinan University.

Conflicts of Interest

The authors declare no conflict of interest.

References

  1. Arifeen, M.Z.; Ma, Y.N.; Xue, Y.R.; Liu, C.H. Deep-sea fungi could be the new arsenal for bioactive molecules. Mar. Drugs 2020, 18, 9. [Google Scholar] [CrossRef] [Green Version]
  2. Sun, C.X.; Shah, M.; Zhang, Z.Z.; Feng, Y.Y.; Chang, Y.M.; Che, Q.; Gu, Q.Q.; Zhu, T.J.; Zhang, G.J.; Li, D.H. Secondary metabolites from deep-sea derived microorganisms. Curr. Med. Chem. 2019, 27, 6244–6273. [Google Scholar] [CrossRef]
  3. Skropeta, D.; Wei, L.Q. Recent advances in deep-sea natural products. Nat. Prod. Rep. 2014, 31, 999–1025. [Google Scholar] [CrossRef] [PubMed]
  4. Daletos, G.; Ebrahim, W.; Ancheeva, E.; El-Neketi, M.; Song, W.G.; Lin, W.H.; Proksch, P. Natural products from deep-sea-derived fungi-a new source of novel bioactive compounds? Curr. Med. Chem. 2018, 25, 186–207. [Google Scholar] [CrossRef] [PubMed]
  5. Ogaki, M.B.; Coelho, L.C.; Vieira, R.; Neto, A.A.; Zani, C.L.; Alves, T.M.A.; Junior, P.A.S.; Murta, S.M.F.; Barbosa, E.C.; Oliveira, J.G.; et al. Cultivable fungi present in deep-sea sediments of Antarctica: Taxonomy, diversity, and bioprospecting of bioactive compounds. Extremophiles 2020, 24, 227–238. [Google Scholar] [CrossRef] [PubMed]
  6. Au, T.K.; Chick, W.S.H.; Leung, P.C. The biology of ophiobolins. Life Sci. 2000, 67, 733–742. [Google Scholar] [CrossRef]
  7. Hong, W.; Takuya, I.; Masahiro, K.; Yasuhide, N.; Mineko, K.; Motomasa, K. Cytotoxic sesterterpenes, 6-epi-ophiobolin G and 6-epi-ophiobolin N, from marine derived fungus Emercella variecolor GF10. Tetrahedron 2004, 60, 6015–6019. [Google Scholar]
  8. Liu, H.B.; Edrada-Ebel, R.; Ebel, R.; Wang, Y.; Schulz, B.; Draeger, S.; Muller, W.E.G.; Wray, V.; Lin, W.H.; Proksch, P. Ophiobolin Sesterterpenoids and Pyrrolidine Alkaloids from the Sponge-Derived Fungus Aspergillus ustus. Helv. Chim. Acta 2011, 94, 623–631. [Google Scholar] [CrossRef]
  9. Bladt, T.J.; Durr, C.; Knudsen, P.B.; Kildgaard, S.; Frisvad, J.C.; Gotfredsen, C.H.; Seiffert, M.; Larsen, T.O. Bio-activity and dereplication-based discovery of ophiobolins and other fungal secondary metabolites targeting leukemia cells. Molecules 2013, 18, 14629–14650. [Google Scholar] [CrossRef] [Green Version]
  10. Zhu, T.H.; Lu, Z.Y.; Fan, J.; Wang, L.P.; Zhu, G.L.; Wang, Y.; Li, X.; Hong, K.; Piyachaturawat, P.; Chairoungdua, A.; et al. Ophiobolins from the mangrove fungus Aspergillus ustus. J. Nat. Prod. 2018, 81, 2–9. [Google Scholar] [CrossRef]
  11. Choi, B.K.; Trinh, P.T.H.; Lee, H.S.; Choi, B.W.; Kang, J.S.; Ngoc, N.T.D.; Van, T.T.T.; Shin, H.J. New ophiobolin derivatives from the marine fungus Aspergillus flocculosus and their cytotoxicities against cancer cells. Mar. Drugs 2019, 17, 346. [Google Scholar] [CrossRef] [PubMed] [Green Version]
  12. Cai, R.L.; Jiang, H.M.; Mo, Y.L.; Guo, H.X.; Li, C.Y.; Long, Y.H.; Zang, Z.M.; She, Z.G. Ophiobolin-type sesterterpenoids from the mangrove endophytic fungus Aspergillus sp. ZJ-68. J. Nat. Prod. 2019, 82, 2268–2278. [Google Scholar] [CrossRef] [PubMed]
  13. Zhao, Y.; Zhao, C.X.; Lu, J.; Wu, J.; Li, C.H.; Hu, Z.Y.; Tian, W.; Yang, L.; Xiang, J.; Zhou, H.B.; et al. Sesterterpene MHO7 suppresses breast cancer cells as a novel estrogen receptor degrader. Pharmacol. Res. 2019, 146, 104294. [Google Scholar] [CrossRef] [PubMed]
  14. Li, E.G.; Clark, A.M.; Rotella, D.P.; Hufford, C.D. Microbial metabolites of ophiobolin A and antimicrobial evaluation of ophiobolins. J. Nat. Prod. 1995, 58, 74–81. [Google Scholar] [CrossRef]
  15. Leung, P.C.; Taylor, W.A.; Wang, J.H.; Tipton, C.L. Role of calmodulin inhibition in the mode of action of ophiobolin A. Plant Physiol. 1985, 77, 303–308. [Google Scholar] [CrossRef] [Green Version]
  16. Brill, Z.G.; Grover, H.K.; Maimone, T.J. Enantioselective synthesis of an ophiobolin sesterterpene via a programmed radical cascade. Science 2016, 352, 1078–1082. [Google Scholar] [CrossRef] [Green Version]
  17. Chen, Y.P.; Liu, Q.; Gao, H.; Lin, H.P.; Tian, H.Y.; Hong, K.; Li, J.; Jiang, R.W.; Yao, X.S.; Tang, J.S. Streptospirodienoic acids A and B, 6,6-spiroketal polyketides from Streptomyces sp. RSC Adv. 2014, 4, 63324–63327. [Google Scholar] [CrossRef]
  18. Gou, X.S.; Jia, J.; Xue, Y.X.; Ding, W.J.; Dong, Z.T.; Tian, D.M.; Chen, M.; Bi, H.K.; Hong, K.; Tang, J.S. New pyrones and their analogs from the marine mangrove-derived Aspergillus sp. DM94 with antibacterial activity against Helicobacter pylori. Appl. Microbiol. Biotechnol. 2020, 104, 7971–7978. [Google Scholar] [CrossRef]
  19. Bari, L.D.; Pescitelli, G.; Pratelli, C.; Pini, D.; Salvadori, P. Determination of absolute configuration of acyclic 1,2-diols with Mo2(OAc)4. 1. Snatzke’s method revisited. J. Org. Chem. 2001, 66, 4819–4825. [Google Scholar] [CrossRef]
  20. Liu, X.H.; Miao, F.P.; Qiao, M.F.; Cichewicz, R.H.; Ji, N.Y. Terretonin, ophiobolin, and drimane terpenes with absolute configurations from an algiconus Aspergillus ustus. RSC Adv. 2013, 3, 588–595. [Google Scholar] [CrossRef]
  21. Masayoshi, A.; Hiroki, N.; Motomasa, K. Marine-derived fungal sesterpenes, ophiobolins, inhibit biofilm formation of Mycobacterium species. J. Nat. Med. 2013, 67, 271–275. [Google Scholar]
  22. Xiao, J.Z.; Tsuda, M.; Doke, N.; Nishimura, S. Phytotoxins produced by germinating spores of Bipolaris oryzae. Phytopathology 1991, 81, 58–64. [Google Scholar] [CrossRef]
  23. Antonio, E.; Anna, A.; Alessio, C.; Maurizio, V.; Mariano, F.; Raghavan, C.; Andrea, M. Ophiobolin E and 8-epi-ophiobolin J produced by Drechslera gigantean, a potential mycoherbicide of weedy grasses. Phytochemistry 2006, 67, 2281–2287. [Google Scholar]
  24. Zhang, J.; Zhao, S.S.; Xie, J.; Yang, J.; Chen, G.D.; Hu, D.; Zhang, W.G.; Wang, C.X.; Yao, X.S.; Gao, H. N-methoxy-β-carboline alkaloids with inhibitory activities against Aβ42 aggregation and acetylcholinesterase from the stems of Picrasma quassioides. Bioorg. Chem. 2020, 101, 104043. [Google Scholar] [CrossRef] [PubMed]
  25. Torsten, B.; Anu, S.; Yasmin, H.; Gerhard, B. SpecDics: Quantifying the comparison of calculated and experimental electronic circular dichroism spectra. Chirality 2013, 25, 243–249. [Google Scholar]
  26. Pósa, A.; Szabó, R.; Szalai, Z.; Kupai, K.; Deim, Z.; Murlasits, Z.; Bencsik, O.; Szekeres, A.; Vágvölgyi, C.; Laszlo, B.; et al. The effect of acute ophiobolin A treatment on HO-mediated inflammatory processes. Hum. Exp. Toxicol. 2016, 36, 594–602. [Google Scholar] [CrossRef] [PubMed]
Figure 1. Structures of ophiobolins 1–11 from the fungus strain WHU0154.
Marinedrugs 18 00575 g001
Figure 2. Key 1H-1H COSY and HMBC correlations of new compounds 15.
Marinedrugs 18 00575 g002
Figure 3. Key ROESY correlations of new compounds 15.
Marinedrugs 18 00575 g003
Figure 4. Experimental and calculated electronic circular dichroism (ECD) spectra of compounds 15.
Marinedrugs 18 00575 g004
Figure 5. Effects of ophiobolins 211 on NO production induced by LPS (A) and their cytotoxicity (B) in murine macrophage RAW 264.7 cells. Cells were pretreated with LPS (500 ng/mL) and then treated with compounds or curcumin at a concentration of 10 µM for 24 h. The data was presented as means ± SEM of three independent experiments. ## p < 0.01 vs. control group; ** p < 0.01 vs. LPS group.
Marinedrugs 18 00575 g005
Figure 6. Effect of ophiobolins 111 on COX 2 and iNOS protein levels in LPS-stimulated murine macrophage RAW 264.7 cells. Cells were pretreated with LPS (100 ng/mL) and then treated with compounds (10 µM) or curcumin (20 µM) for 24 h. The total protein levels were analyzed by western blot. (A) The expression of COX 2 and iNOS protein levels. (B) The quantification histogram of COX 2 and iNOS (C). ### p < 0.001 vs. control group; * p < 0.05 vs.LPS group.
Marinedrugs 18 00575 g006
Table 1. 1H- and 13C-NMR data assignments of ophiobolins 1-5 (600 MHz for 1H and 150 MHz for 13C in CD3OD).
12345
δCδH (J in Hz)δCδH (J in Hz)δCδH (J in Hz)δCδH (J in Hz)δCδH (J in Hz)
147.12.16(1H,m)
1.20(1H,m)
50.72.12(1H,m);
0.99(1H,dd, 15.4, 10.5)
49.82.06(1H,d, 12.3);
0.94(1H)
36.71.54(1H,dd, 12.1, 8.7);
1.11(1H,t, 13.5)
371.58(1H,m) 1.13;
(1H,ddd, 16.0, 13.6, 9.0)
251.22.88(1H,d,12.9)47.23.37(1H,d,12.3)45.13.95(1H,d, 11.1)51.82.31(1H,m)51.92.35(1H,m)
3181.7 180.9 181.5 82.9 82.9
4130.35.93(1H,s)131.56.03(1H,m)130.56.06(1H,s)53.12.44(1H,dd,14.9, 7.8); 1.79(1H,m)53.22.46(1H,dd,14.9, 7.8);
1.81(1H,m)
5211.6 196.7 198 75.14.52(1H,m)75.24.55(1H,m)
652.93.44(1H,d, 3.4)140.8 138.7 52.33.07(1H,d, 10.1)52.33.11(1H,d, 10.1)
7130.6 139.5 139.7 134 134.4
8146.57.00(1H,s)32.32.52(1H,td,13.2, 6.1);
2.40 (1H,dd,12.1, 5.1)
73.44.39(1H,t,6.5)147.76.88(1H,t,8.8)147.16.89(1H,t,8.7)
930.93.00(1H,d,19.8) 2.20(1H,m)26.91.58(1H,m)
2.01(1H,m)
32.32.24(1H,ddd,15.0, 5.9,3.7); 1.85 (1H,dd,14.9, 7.4)25.72.68(1H,ddd,15.1, 13.5, 5.8)
2.07(1H,m)
26.92.53 (1H,dd,12.9, 8.4);
2.09 (1H,dd,11.7,10.3)
1045.22.65(1H,m)45.22.07(1H,m)45.41.91(1H,m)55.51.54(1H,dd,12.1, 8.7)55.71.58(1H,m)
1146.4 44.9 44.7 44.9 44.8
1245.31.54(1H,m)
1.48(1H,m)
46.11.52(1H,m)
1.38(1H,m)
44.31.55(1H,m)
1.29(1H,m)
43.91.40(2H,m)44.11.43(2H,dd,9.5, 4.4)
1328.61.68(1H,m)
1.36(1H,m)
29.31.59(1H,m)
1.47(1H,m)
29.31.68(1H,m)
1.55(1H,m)
27.71.60(1H,m)
1.40(1H,m)
27.51.58(2H,m)
1453.21.95(1H,m)52.31.94(1H,dd,17.3,8.2)50.52.06(1H,d, 12.3)48.62.07(1H,m)48.62.18(1H,ddd,25.8, 12.2, 6.9)
1533.82.63(1H,m)34.12.64(1H,dd,16.0, 9.2)35.42.64(1H,m)37.22.74(1H,ddd,15.1, 13.5, 5.8)42.92.36(1H,m)
16141.95.48(1H,m)138.95.20(1H,t,9.8)138.05.21(1H,m)138.75.22(1H,m)140.35.47(1H,dd, 15.1, 8.6)
17127.75.41(1H,m)123.46.03(1H,m)123.86.09(1H,m)123.26.03(1H,m)125.96.16(1H,dd, 15.1, 10.8)
1875.34.17(1H,d,9.6)121.76.03(1H,m)121.66.09(1H,m)121.56.03(1H,m)126.55.77(1H,d, 10.7)
1973.6 135.7 136.2 136 133.3
2017.32.11(3H,s)17.62.17(3H,s)17.52.17(3H,s)26.51.22(3H,s)26.51.24(3H,s)
21172 174.7 174.5 174.7 175.2
2223.10.99(3H,s)21.91.20(3H,s)22.41.19(3H,s)19.10.99(3H,s)19.30.99(3H,s)
2321.50.99(3H,d,6.0)21.20.91(3H,d,6.5)20.70.95(3H,d,6.5)20.80.89(3H,d,6.6)210.96(3H,d,6.6)
2424.91.17(3H,s)18.11.75(3H,s)18.11.75(3H,s)18.11.72(3H,s)18.21.74(3H,s)
2526.21.19(3H,s)26.51.82(3H,s)26.51.82(3H,s)26.51.79(3H,s)261.76(3H,s)
Publisher’s Note: MDPI stays neutral with regard to jurisdictional claims in published maps and institutional affiliations.

