
Evaluation of Anti-Obesity and Antidiabetic Activities of Orostachys japonicus in Cell and Animal Models

 ,
,  , and
, and
Abstract
: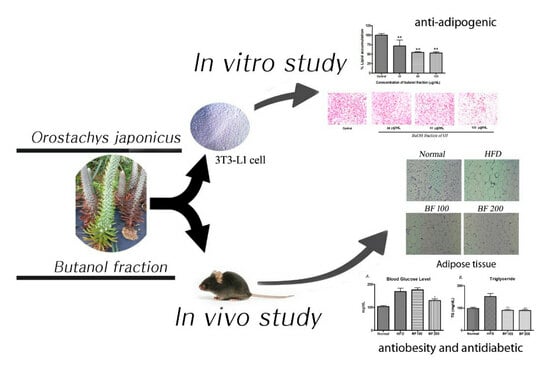
1. Introduction
2. Results
2.1. In Vitro α-Glucosidase Inhibition Assay
2.2. Cell Viability and Glucose Uptake Study
2.3. Inhibition of Lipid Production in 3T3-L1 Cells
2.4. Inhibition of Adipogenic-Markers in 3T3-L1 Cells
2.5. Animal Experiment: Body Weight Gain, Food Intake and Organ Weight
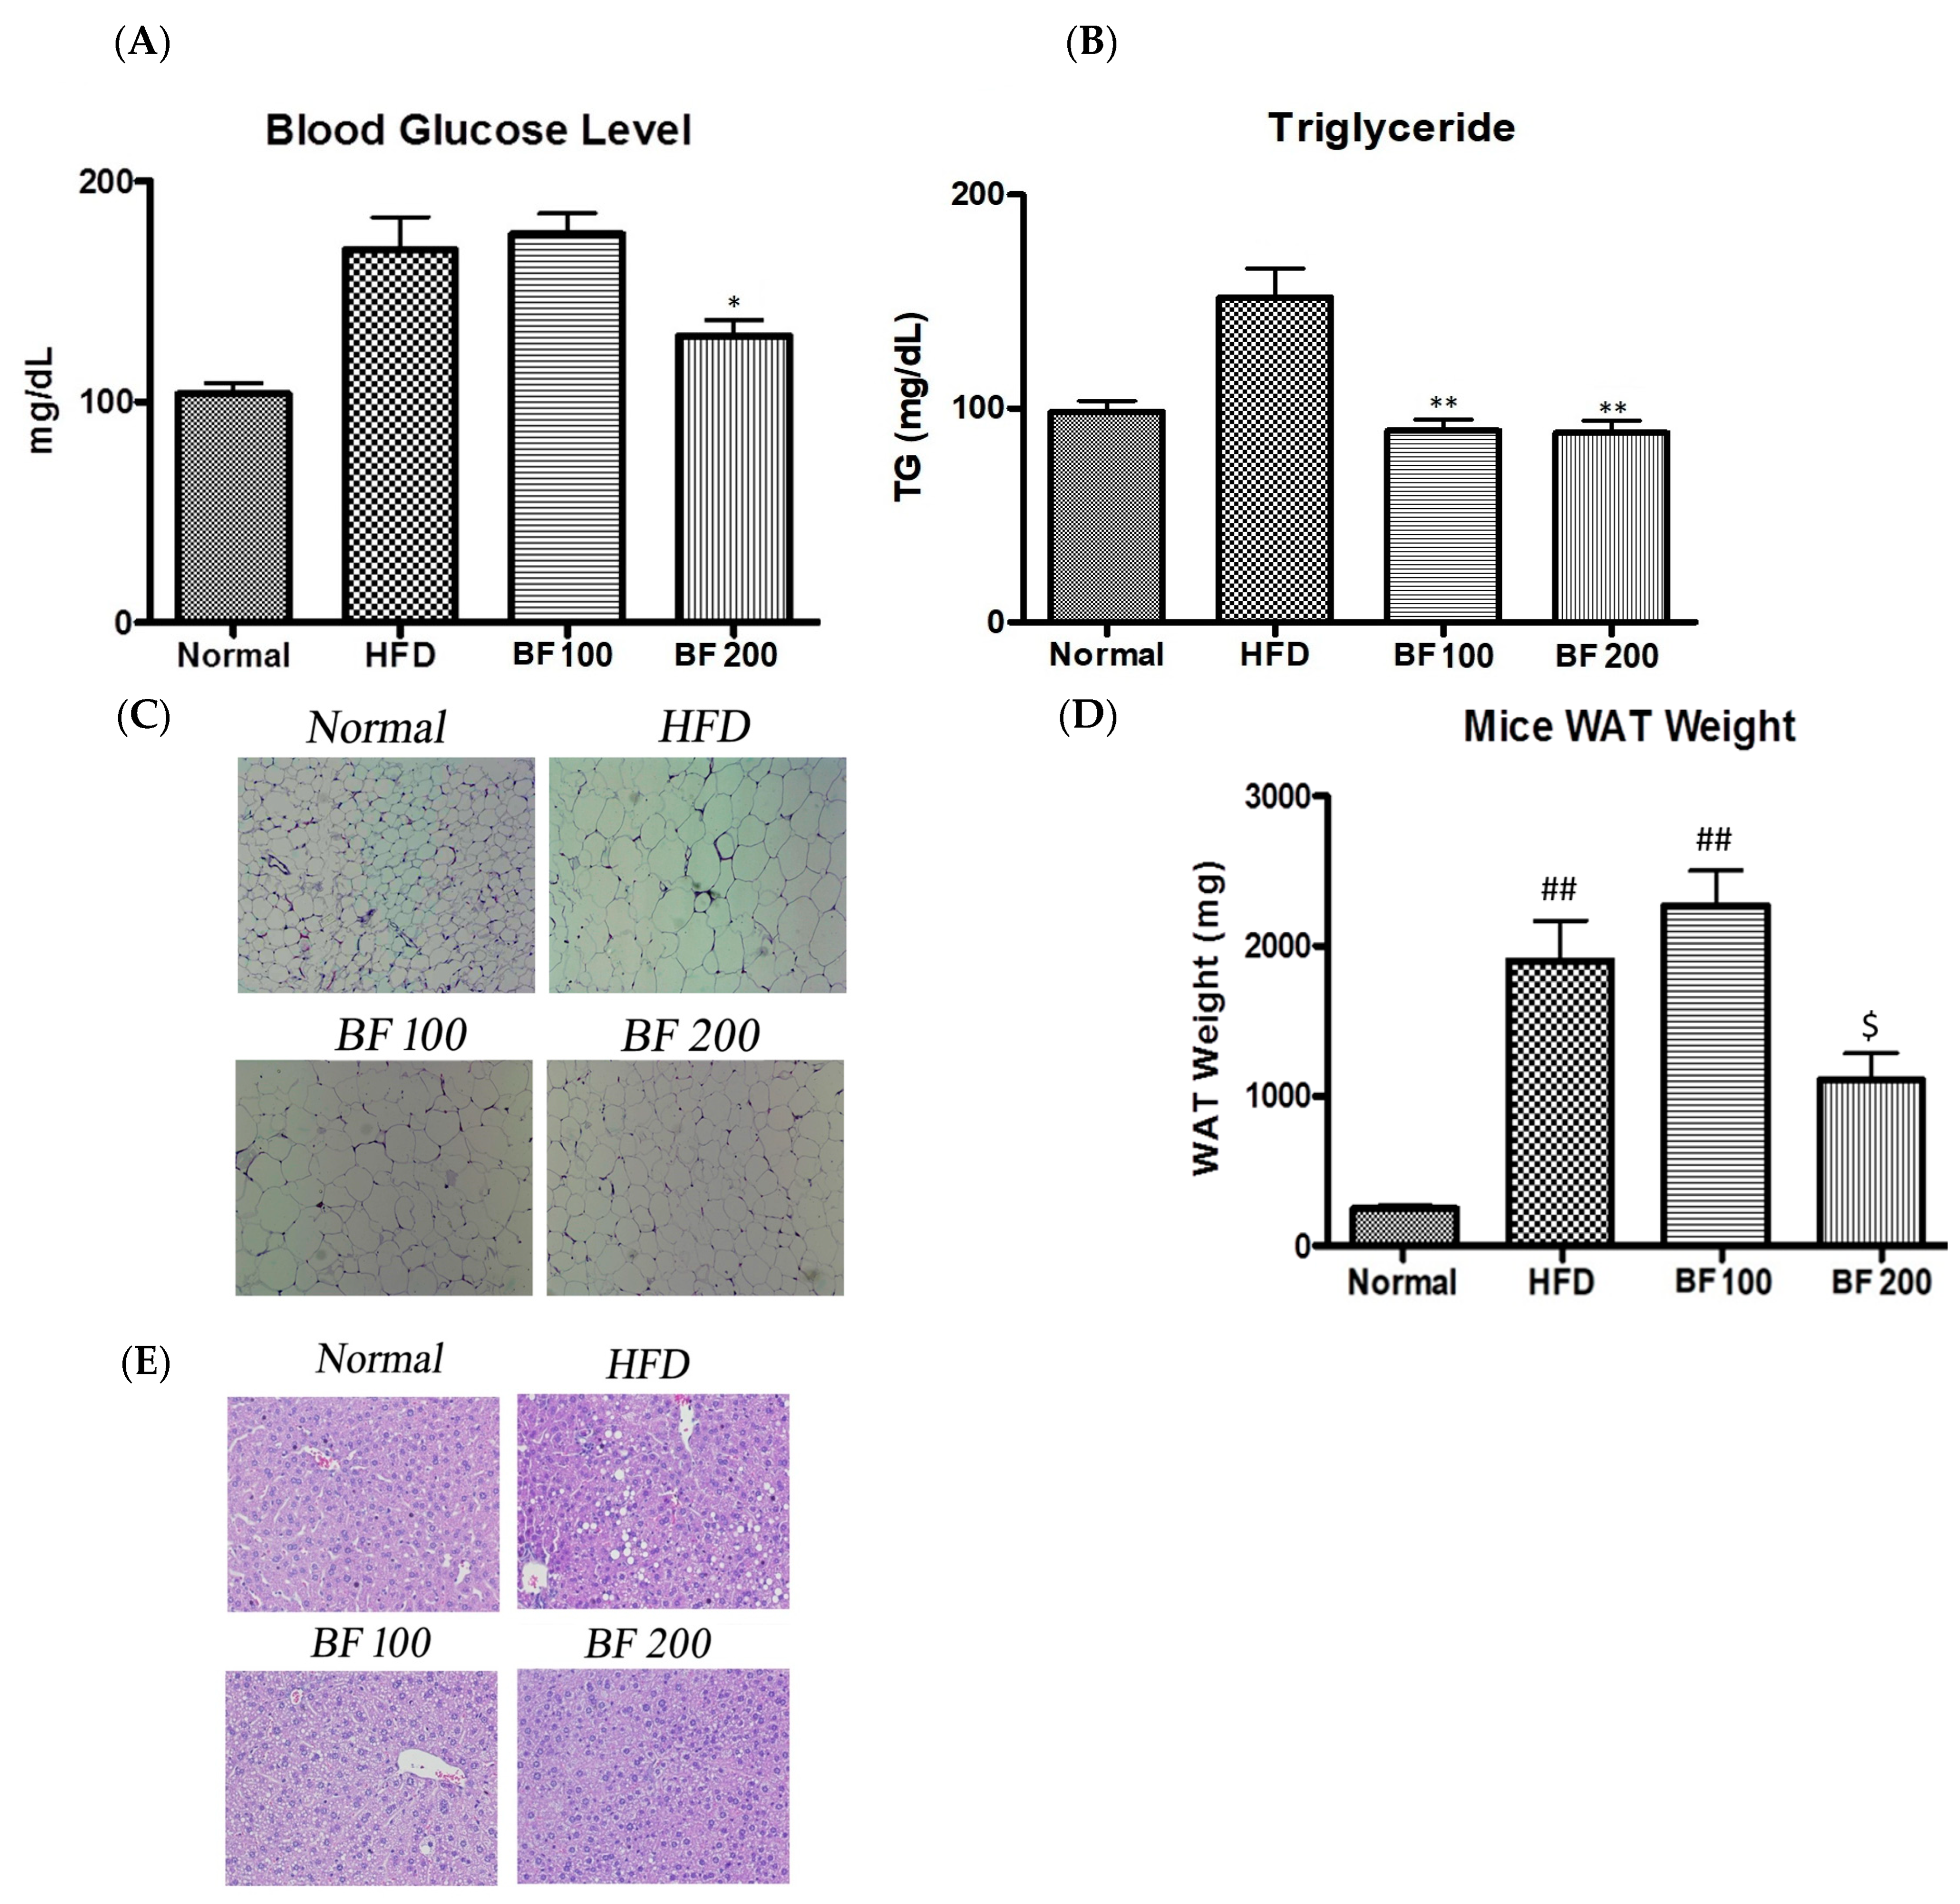
2.6. Blood Glucose, Serum Lipid and Accumulation of Lipid in White Adipose Tissue and Liver
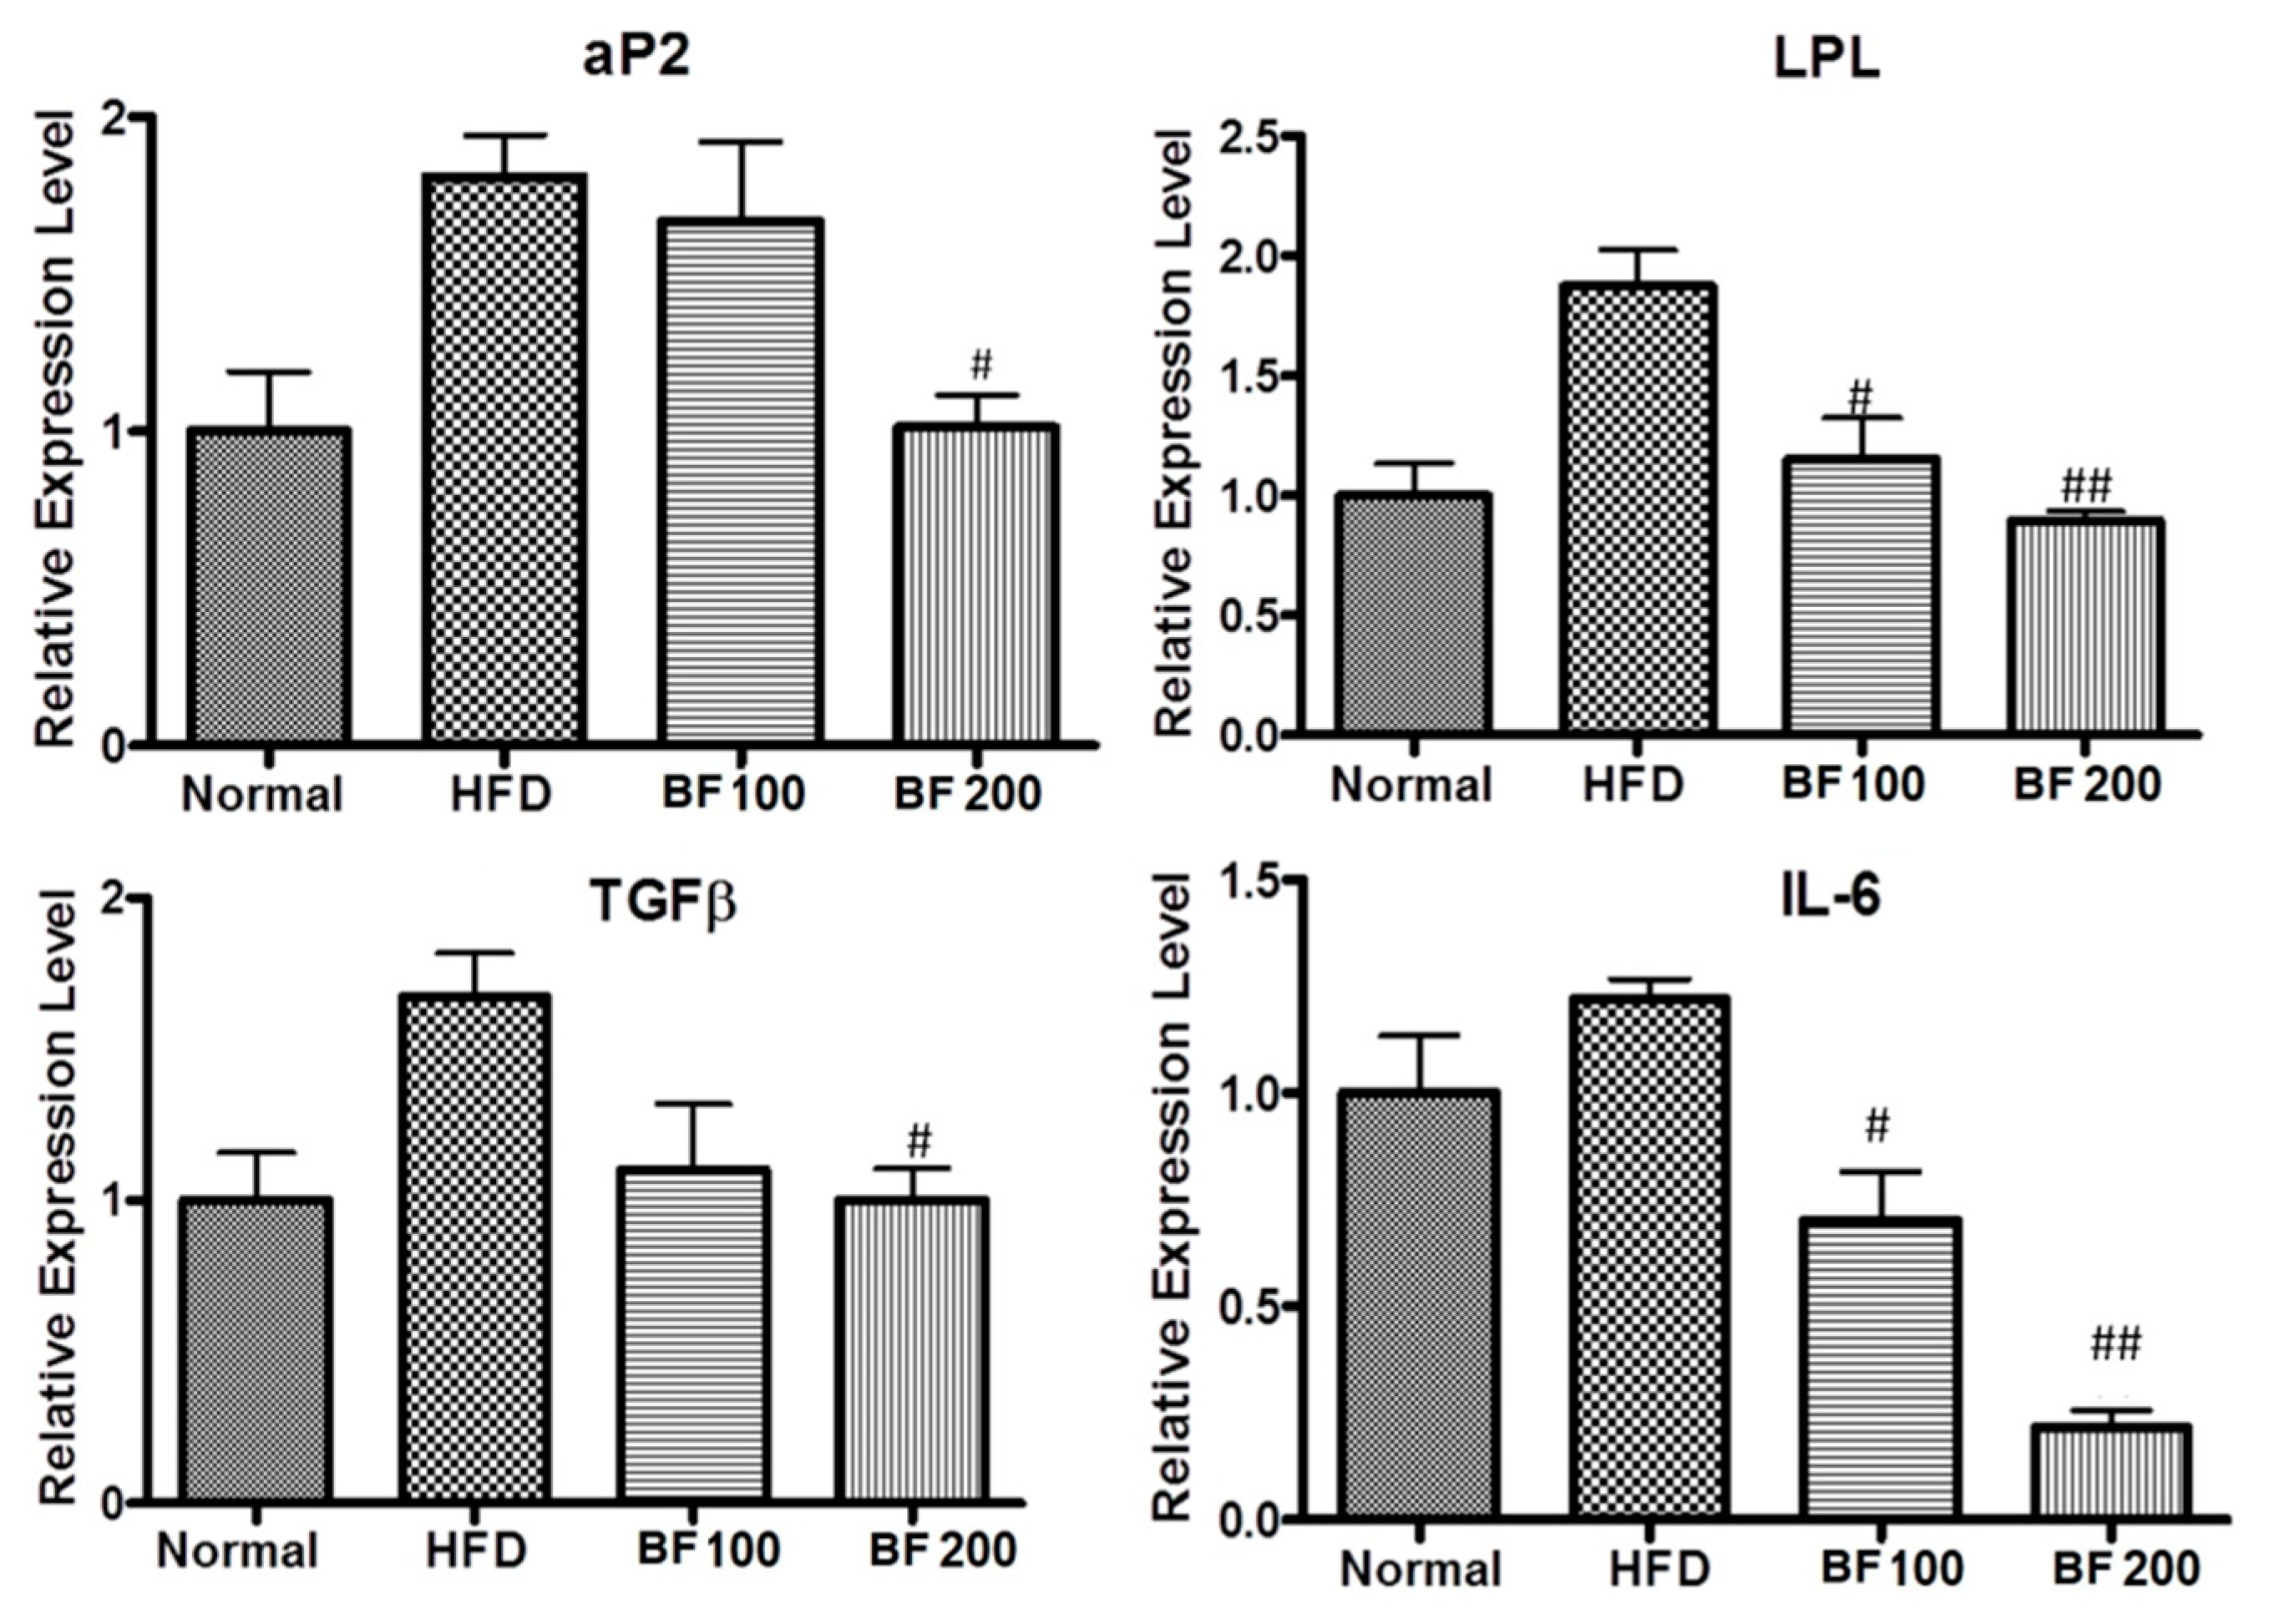
2.7. Adipokine and Fibrosis Markers Expression in Liver
3. Discussion
4. Materials and Methods
4.1. Materials
4.2. Extraction and Fractionation
4.3. In Vitro α-Glucosidase Inhibition Assay
4.4. Cell Viability
4.5. Glucose Uptake Assay in Normal Myotubes
4.6. Glucose Uptake Assay in Insulin-Resistance Induced Myotubes
4.7. Differentiation of 3T3-L1 Cells
4.8. Oil Red O (ORO) Staining
4.9. Western Blotting
4.10. Quantitative Real-Time PCR
4.11. In Vivo Biological Studies (Anti-Obesity Study)
4.12. Histology
4.13. Statistical Analysis
5. Conclusions
Author Contributions
Funding
Institutional Review Board Statement
Informed Consent Statement
Data Availability Statement
Conflicts of Interest
List of Abbreviations
| aP2 | Adipose fatty acid binding protein |
| LPL | Lipoprotein lipase |
| IL-6 | Interleukin 6 |
| TGFβ | Transforming growth factor β |
| DMSO | Dimethyl Sulfoxide |
| SREBP-1c | Sterol regulatory element binding protein 1c |
| C/EBPα | CCATT/enhancer binding protein alpha |
| PPARγ | Peroxisome proliferators–activated receptor gamma |
References
- Anderson, E.; Durstine, J.L.; Science, H. Physical activity, exercise, and chronic diseases: A brief review. Sports Med. 2019, 1, 3–10. [Google Scholar] [CrossRef]
- Scully, T.; Ettela, A.; LeRoith, D.; Gallagher, E.J. Obesity, type 2 diabetes, and cancer risk. Front. Oncol. 2021, 10, 615375. [Google Scholar] [CrossRef]
- WHO. Consideration of the Evidence on Childhood Obesity for the Commission on Ending Childhood Obesity: Report of the Ad Hoc Working Group on Science and Evidence for Ending Childhood Obesity; WHO: Geneva, Switzerland, 2016. [Google Scholar]
- Wang, Y.; Beydoun, M.A.; Liang, L.; Caballero, B.; Kumanyika, S.K. Will all Americans become overweight or obese? Estimating the progression and cost of the US obesity epidemic. Obesity 2008, 16, 2323–2330. [Google Scholar] [CrossRef]
- Centers for Disease Control and Prevention (CDC). Prevalence of overweight and obesity among adults with diagnosed diabetes--United States, 1988–1994 and 1999–2002. MMWR. Morb. Mortal. Wkly. Rep. 2004, 53, 1066. [Google Scholar]
- Torres-Fuentes, C.; Schellekens, H.; Dinan, T.G.; Cryan, J.F. A natural solution for obesity: Bioactives for the prevention and treatment of weight gain. A review. Nutr. Neurosci. 2015, 18, 49–65. [Google Scholar] [CrossRef]
- Bloomer, R.J.; Canale, R.E.; Blankenship, M.M.; Hammond, K.G.; Fisher-Wellman, K.H.; Schilling, B.K. Effect of the dietary supplement Meltdown on catecholamine secretion, markers of lipolysis, and metabolic rate in men and women: A randomized, placebo controlled, cross-over study. Lipids Health Dis. 2009, 8, 32. [Google Scholar] [CrossRef]
- Shapiro, K.; Gong, W.C. Natural products used for diabetes. J. Am. Pharm. Assoc. 2002, 42, 217–226. [Google Scholar] [CrossRef]
- Park, M.-J.; Han, J.-S. Antioxidant activity of medicinal plant extracts used as folk remedies by diabetic patients. Prev. Nutr. Food Sci. 2004, 9, 167–173. [Google Scholar] [CrossRef]
- Kim, J.; Park, J.; Lee, K. Diabetes and traditional medicine: Effect of several traditional drugs on the plasma glucose levels in streptozotocin-induced diabetic rats. J. Korean Diabetes Assoc. 1994, 18, 377–380. [Google Scholar]
- Han, H.-K.; Yoon, S.-J.; Kim, G.-H. Effects of compositae plants on plasma glucose and lipid level in streptozotocin induced diabetic rats. J. Korean Soc. Food Sci. Nutr. 2009, 38, 674–682. [Google Scholar] [CrossRef]
- Yoon, J.-A.; Son, Y.-S. Effects of Opuntia ficus-indica complexes B (OCB) on blood glucose and lipid metabolism in streptozotocin-induced diabetic rats. Korean J. Food Nutr. 2009, 22, 48–56. [Google Scholar]
- Hu, D.; Su, F.; Yang, G.; Wang, J.; Zhang, Y. Purification, Structural Characterization, and Anti-Inflammatory Effects of a Novel Polysaccharide Isolated from Orostachys fimbriata. Molecules 2021, 26, 7116. [Google Scholar] [CrossRef] [PubMed]
- Kim, J.H.; Nam, G.S.; Kim, S.H.; Ryu, D.S.; Lee, D.S. Orostachys japonicus exerts antipancreatic cancer activity through induction of apoptosis and cell cycle arrest in PANC-1 cells. Food Sci. Nutr. 2019, 7, 3549–3559. [Google Scholar] [CrossRef]
- Jin, J. Korean Plant Ecology Trace. Nat. Ecol. Seoul Korea 2013, 1063–1064. [Google Scholar]
- Kim, S.-G.; Choi, J.-W.; Park, H.-J.; Lee, S.-M.; Jung, H.-J. Anti-hyperlipidemic effects of the flavonoid-rich fraction from the methanol extract of orostachy japonicus in rats. Korean J. Pharmacogn. 2009, 40, 51–58. [Google Scholar]
- Lee, S.J.; Zhang, G.F.; Sung, N.J. Hypolipidemic and hypoglycemic effects of Orostachys japonicus A. Berger extracts in streptozotocin-induced diabetic rats. Nutr. Res. 2011, 5, 301–307. [Google Scholar]
- Koppula, S.; Yum, M.-J.; Kim, J.-S.; Shin, G.-M.; Chae, Y.-J.; Yoon, T.; Chun, C.-S.; Lee, J.-D.; Song, M. Anti-fibrotic effects of Orostachys japonicus A. Berger (Crassulaceae) on hepatic stellate cells and thioacetamide-induced fibrosis in rats. Nutr. Res. Pract. 2017, 11, 470–478. [Google Scholar] [CrossRef]
- Kwon, J.-H.; Kim, J.-H.; Ryu, D.-S.; Lee, H.-J.; Lee, D.-S. Anticancer effect of the ethyl acetate fraction from Orostachys japonicus on MDA-MB-231 human breast cancer cells through extensive induction of apoptosis, cell cycle arrest, and antimetastasis. Evid. -Based Complement. Altern. Med. 2019, 2019, 8951510. [Google Scholar] [CrossRef]
- Kim, S.-G.; Poudel, A.; Kim, D.-K.; Choi, J.-W.; Park, H.-J.; Lee, Y.-S.; Lee, H.-S.; Min, B.-S.; Jung, H.-J. Anti-obesitic effect of Orostachys japonicus in rats model fed a hyperlipidemic diet. Nat. Prod. Sci. 2011, 17, 117–122. [Google Scholar]
- Shin, J.-H.; Lee, S.-J.; Seo, J.-K.; Lee, H.-J.; Ju, J.-C.; Sung, N.-J. Effect of a combined extract of Orostachys japonicus with medicinal plants on the lipid composition of the liver and kidney from streptozotocin-induced diabetic rats. J. Korean Soc. Food Sci. Nutr. 2012, 41, 510–518. [Google Scholar] [CrossRef]
- Bahmani, M.; Eftekhari, Z.; Saki, K.; Fazeli-Moghadam, E.; Jelodari, M.; Rafieian-Kopaei, M. Obesity phytotherapy: Review of native herbs used in traditional medicine for obesity. J. Evid. -Based Complement. Altern. Med. 2016, 21, 228–234. [Google Scholar] [CrossRef]
- Pang, G.-M.; Li, F.-X.; Yan, Y.; Zhang, Y.; Kong, L.-L.; Zhu, P.; Wang, K.-F.; Zhang, F.; Liu, B.; Lu, C. Herbal medicine in the treatment of patients with type 2 diabetes mellitus. Chin. Med. J. 2019, 132, 78. [Google Scholar] [CrossRef]
- Karri, S.; Sharma, S.; Hatware, K.; Patil, K. Natural anti-obesity agents and their therapeutic role in management of obesity: A future trend perspective. Biomed. Pharmacother. 2019, 110, 224–238. [Google Scholar] [CrossRef]
- Ganesan, K.; Rana, M.B.M.; Sultan, S. Oral Hypoglycemic Medications. 2018. Available online: https://europepmc.org/article/NBK/nbk482386 (accessed on 25 July 2022).
- Kornmueller, K.; Amri, E.-Z.; Scheideler, M.; Prassl, R. Delivery of miRNAs to the adipose organ for metabolic health. Adv. Drug Deliv. Rev. 2022, 181, 114110. [Google Scholar] [CrossRef] [PubMed]
- The Pharmacopoeia of the People's Republic of China (PPRC) (Ed.) Pharmacopoeia of the People’s Republic of China; China Medical Science Press: Beijing, China, 2015. [Google Scholar]
- Kim, S.-H.; Lee, H.-S. The Lipid Efflux Effects of Dichloromethane Extract from Orostachys japonicus in 3T3-L1 Adipocyte Cells. Korean J. Clin. Lab. Sci. 2019, 51, 514–520. [Google Scholar] [CrossRef]
- Chen, C.; Yang, J.-S.; Lu, C.-C.; Chiu, Y.-J.; Chen, H.-C.; Chung, M.-I.; Wu, Y.-T.; Chen, F.-A. Effect of quercetin on dexamethasone-induced C2C12 skeletal muscle cell injury. Molecules 2020, 25, 3267. [Google Scholar] [CrossRef]
- Smith, A.G.; Muscat, G.E. Skeletal muscle and nuclear hormone receptors: Implications for cardiovascular and metabolic disease. Int. J. Biochem. Cell Biol. 2005, 37, 2047–2063. [Google Scholar] [CrossRef]
- Iyer, A.; Fairlie, D.P.; Prins, J.B.; Hammock, B.D.; Brown, L. Inflammatory lipid mediators in adipocyte function and obesity. Nat. Rev. Endocrinol. 2010, 6, 71. [Google Scholar] [CrossRef] [PubMed]
- Naowaboot, J.; Chung, C.H.; Pannangpetch, P.; Choi, R.; Kim, B.H.; Lee, M.Y.; Kukongviriyapan, U. Mulberry leaf extract increases adiponectin in murine 3T3-L1 adipocytes. Nutr. Res. 2012, 32, 39–44. [Google Scholar] [CrossRef]
- Rosen, E.D.; Spiegelman, B.M. Adipocytes as regulators of energy balance and glucose homeostasis. Nature 2006, 444, 847–853. [Google Scholar] [CrossRef]
- Rosen, E.; Walkey, C.; Puigserver, P.; Spiegelman, B.M. Transcriptional regulation of adipogenesis. Genes Dev. 2000, 14, 1293–1307. [Google Scholar] [CrossRef] [PubMed]
- Rosen, E.D.; Hsu, C.-H.; Wang, X.; Sakai, S.; Freeman, M.W.; Gonzalez, F.J.; Spiegelman, B.M. C/EBPα induces adipogenesis through PPARγ: A unified pathway. Genes Dev. 2002, 16, 22–26. [Google Scholar] [CrossRef] [PubMed]
- Wu, Z.; Rosen, E.D.; Brun, R.; Hauser, S.; Adelmant, G.; Troy, A.E.; McKeon, C.; Darlington, G.J.; Spiegelman, B.M. Cross-regulation of C/EBPα and PPARγ controls the transcriptional pathway of adipogenesis and insulin sensitivity. Mol. Cell 1999, 3, 151–158. [Google Scholar] [CrossRef] [PubMed]
- Ntambi, J.M.; Young-Cheul, K. Adipocyte differentiation and gene expression. J. Nutr. 2000, 130, 3122S–3126S. [Google Scholar] [CrossRef] [PubMed]
- Clarke, S.L.; Robinson, C.E.; Gimble, J.M. CAAT/enhancer binding proteins directly modulate transcription from the peroxisome proliferator-activated receptor γ2 promoter. Biochem. Biophys. Res. Commun. 1997, 240, 99–103. [Google Scholar] [CrossRef]
- Wu, Z.; Xie, Y.; Bucher, N.; Farmer, S.R. Conditional ectopic expression of C/EBP beta in NIH-3T3 cells induces PPAR gamma and stimulates adipogenesis. Genes Dev. 1995, 9, 2350–2363. [Google Scholar] [CrossRef] [PubMed]
- Park, M.-Y.; Seo, D.-W.; Lee, J.-Y.; Sung, M.-K.; Lee, Y.-M.; Jang, H.-H.; Choi, H.-Y.; Kim, J.-H.; Park, D.-S. Effects of Panicum miliaceum L. extract on adipogenic transcription factors and fatty acid accumulation in 3T3-L1 adipocytes. Nutr. Res. Pract. 2011, 5, 192–197. [Google Scholar] [CrossRef]
- Spiegelman, B.; Green, H. Control of specific protein biosynthesis during the adipose conversion of 3T3 cells. J. Biol. Chem. 1980, 255, 8811–8818. [Google Scholar] [CrossRef]
- Hotamisligil, G.S.; Johnson, R.S.; Distel, R.J.; Ellis, R.; Papaioannou, V.E.; Spiegelman, B.M. Uncoupling of obesity from insulin resistance through a targeted mutation in aP2, the adipocyte fatty acid binding protein. Science 1996, 274, 1377–1379. [Google Scholar] [CrossRef]
- Morrison, R.F.; Farmer, S.R. Insights into the transcriptional control of adipocyte differentiation. J. Cell. Biochem. 1999, 75, 59–67. [Google Scholar] [CrossRef]
- Storch, J.; Thumser, A.E. The fatty acid transport function of fatty acid-binding proteins. Biochim. Biophys. Acta (BBA)-Mol. Cell Biol. Lipids 2000, 1486, 28–44. [Google Scholar] [CrossRef]
- Coe, N.R.; Bernlohr, D.A. Physiological properties and functions of intracellular fatty acid-binding proteins. Biochim. Biophys. Acta (BBA)-Lipids Lipid Metab. 1998, 1391, 287–306. [Google Scholar] [CrossRef]
- Yu, Y.-H.; Zhu, H. Chronological changes in metabolism and functions of cultured adipocytes: A hypothesis for cell aging in mature adipocytes. Am. J. Physiol.-Endocrinol. Metab. 2004, 286, E402–E410. [Google Scholar] [CrossRef] [PubMed]
- DeFuria, J.; Bennett, G.; Strissel, K.J.; Perfield, J.W.; Milbury, P.E.; Greenberg, A.S.; Obin, M.S. Dietary blueberry attenuates whole-body insulin resistance in high fat-fed mice by reducing adipocyte death and its inflammatory sequelae. J. Nutr. 2009, 139, 1510–1516. [Google Scholar] [CrossRef] [PubMed]
- Song, E.; Ouyang, N.; Hörbelt, M.; Antus, B.; Wang, M.; Exton, M.S. Influence of alternatively and classically activated macrophages on fibrogenic activities of human fibroblasts. Cell. Immunol. 2000, 204, 19–28. [Google Scholar] [CrossRef] [PubMed]
- Fu, Y.; Luo, N.; Klein, R.L.; Garvey, W.T. Adiponectin promotes adipocyte differentiation, insulin sensitivity, and lipid accumulation. J. Lipid Res. 2005, 46, 1369–1379. [Google Scholar] [CrossRef] [PubMed]
- Kubota, H.; Kojima-Yuasa, A.; Morii, R.; Huang, X.; Norikura, T.; Rho, S.-N.; Matsui-Yuasa, I. Anti-obesity effect of Blumea balsamifera extract in 3T3-L1 preadipocytes and adipocytes. Am. J. Chin. Med. 2009, 37, 843–854. [Google Scholar] [CrossRef]
- Campbell, L.K.; White, J.R.; Campbell, R.K. Acarbose: Its role in the treatment of diabetes mellitus. Ann. Pharmacother. 1996, 30, 1255–1262. [Google Scholar] [CrossRef]
- Mo, Z.; Li, L.; Yu, H.; Wu, Y.; Li, H. Coumarins ameliorate diabetogenic action of dexamethasone via Akt activation and AMPK signaling in skeletal muscle. J. Pharmacol. Sci. 2019, 139, 151–157. [Google Scholar] [CrossRef]
- Feng, X.-T.; Wang, T.-Z.; Leng, J.; Chen, Y.; Liu, J.-B.; Liu, Y.; Wang, W.-J. Palmitate contributes to insulin resistance through downregulation of the Src-mediated phosphorylation of Akt in C2C12 myotubes. Biosci. Biotechnol. Biochem. 2012, 72, 1356–1361. [Google Scholar] [CrossRef]
- Lamichhane, R.; Kim, S.-G.; Kang, S.; Lee, K.-H.; Pandeya, P.R.; Jung, H.-J. Exploration of underlying mechanism of anti-adipogenic activity of sulfuretin. Biol. Pharm. Bull. 2017, 40, 1366–1373. [Google Scholar] [CrossRef] [PubMed]
- Pandeya, P.R.; Lamichhane, G.; Lamichhane, R.; Luo, J.; Li, X.-J.; Rhee, S.-j.; Xiangqian, L.; Jung, H.-J.J.B.R.I. Antiobesity activity of two polyherbal formulations in high-fat diet-induced obese C57BL/6J mice. BioMed Res. Int. 2022, 2022, 9120259. [Google Scholar] [CrossRef] [PubMed]


| Sample | IC50 (µg/mL) |
|---|---|
| BuOJ | 12.13 ± 0.06 |
| Acarbose | 132.59 ± 7.14 |
| Group | Initial BW | Final BW | BW Gain | Food Intake (g/day) | FER |
|---|---|---|---|---|---|
| Normal | 22.56 ± 1.3 | 27.20 ± 2.1 | 4.63 ± 0.9 a | 5.12 ± 0.2 a | 0.90 ± 0.1 a |
| HFD | 22.27 ± 2.1 | 33.02 ± 1.9 | 10.74 ± 0.7 b | 2.56 ± 0.6 b | 4.19 ± 0.9 c |
| BF 100 | 22.30 ± 1.5 | 32.39 ± 1.2 | 10.08 ± 0.9 b | 2.54 ± 0.3 b | 3.95 ± 0.7 b |
| BF 200 | 21.79 ± 1.8 | 30.44 ± 2.3 | 8.651 ± 0.5 c | 2.50 ± 0.5 b | 3.45 ± 0.2 b |
| Gene | Forward Primer 5′-3′ | Reverse Primer 3′-5′ |
|---|---|---|
| PPARγ | GTG AAG CCC ATC GAG GAC | TGG AGC ACC TTG GCG AAC A |
| C/EBPα | GCG GGA ACG CAA CAA CAT C | GTC ACT GGT CAA CTC CAG 214 CAC |
| SREBP-1c | GGT TTT GAA CGA CAT CGA AGA217 | CGG GAA GTC ACT GTC TTG GT |
| Leptin | GCC AGG CTG CCA GAA TTG | CTG CCC CCC AGT TTG ATG |
| aP2 | AGG CTC ATA GCA CCC TCC TGT | CAG GTT CCC ACA AAG GCA TCA C |
| LPL | TGT ACC AAT CTG GGC TAT GAG ATC AAC | TGC TTG CCA TCC TCA GTC CC |
| IL-6 | GGA AAT CGT GGA AAT GAG | TGC TTG CCA TCC TCA GTC CC |
| TGFβ | GGA GCA GAG CTG CTG AAA CT | CTT CTC TCC ATC CCT GAC GC |
| GAPDH | CAA TGA ATA CGG CTA CAG CAA C | AGG GAG ATG CTC AGT GTT GG |
| β-actin | GTG ACG TTG 220 ACA TCC GTA AAG A | GCC GGA CTC ATC GTA CTC C |
| Group | Diet | Dose |
|---|---|---|
| Normal | Normal diet | Blank PBS |
| HFD | High-fat diet | Blank PBS |
| BF 100 | High-fat diet | BuOH fraction 100 mg/kg |
| BF 200 | High-fat diet | BuOH fraction 200 mg/kg |
Disclaimer/Publisher’s Note: The statements, opinions and data contained in all publications are solely those of the individual author(s) and contributor(s) and not of MDPI and/or the editor(s). MDPI and/or the editor(s) disclaim responsibility for any injury to people or property resulting from any ideas, methods, instructions or products referred to in the content. |
© 2024 by the authors. Licensee MDPI, Basel, Switzerland. This article is an open access article distributed under the terms and conditions of the Creative Commons Attribution (CC BY) license (https://creativecommons.org/licenses/by/4.0/).
Share and Cite
Lamichhane, R.; Pandeya, P.R.; Lee, K.-H.; Lamichhane, G.; Cheon, J.-Y.; Park, H.S.; Tuan, N.Q.; Jung, H.-J. Evaluation of Anti-Obesity and Antidiabetic Activities of Orostachys japonicus in Cell and Animal Models. Pharmaceuticals 2024, 17, 357. https://doi.org/10.3390/ph17030357
Lamichhane R, Pandeya PR, Lee K-H, Lamichhane G, Cheon J-Y, Park HS, Tuan NQ, Jung H-J. Evaluation of Anti-Obesity and Antidiabetic Activities of Orostachys japonicus in Cell and Animal Models. Pharmaceuticals. 2024; 17(3):357. https://doi.org/10.3390/ph17030357
Chicago/Turabian StyleLamichhane, Ramakanta, Prakash Raj Pandeya, Kyung-Hee Lee, Gopal Lamichhane, Jae-Young Cheon, Hyo Shin Park, Nguyen Quoc Tuan, and Hyun-Ju Jung. 2024. "Evaluation of Anti-Obesity and Antidiabetic Activities of Orostachys japonicus in Cell and Animal Models" Pharmaceuticals 17, no. 3: 357. https://doi.org/10.3390/ph17030357