

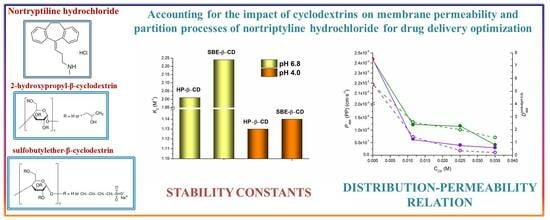
Cyclodextrin’s Effect on Permeability and Partition of Nortriptyline Hydrochloride

Abstract
:
1. Introduction
2. Results and Discussion
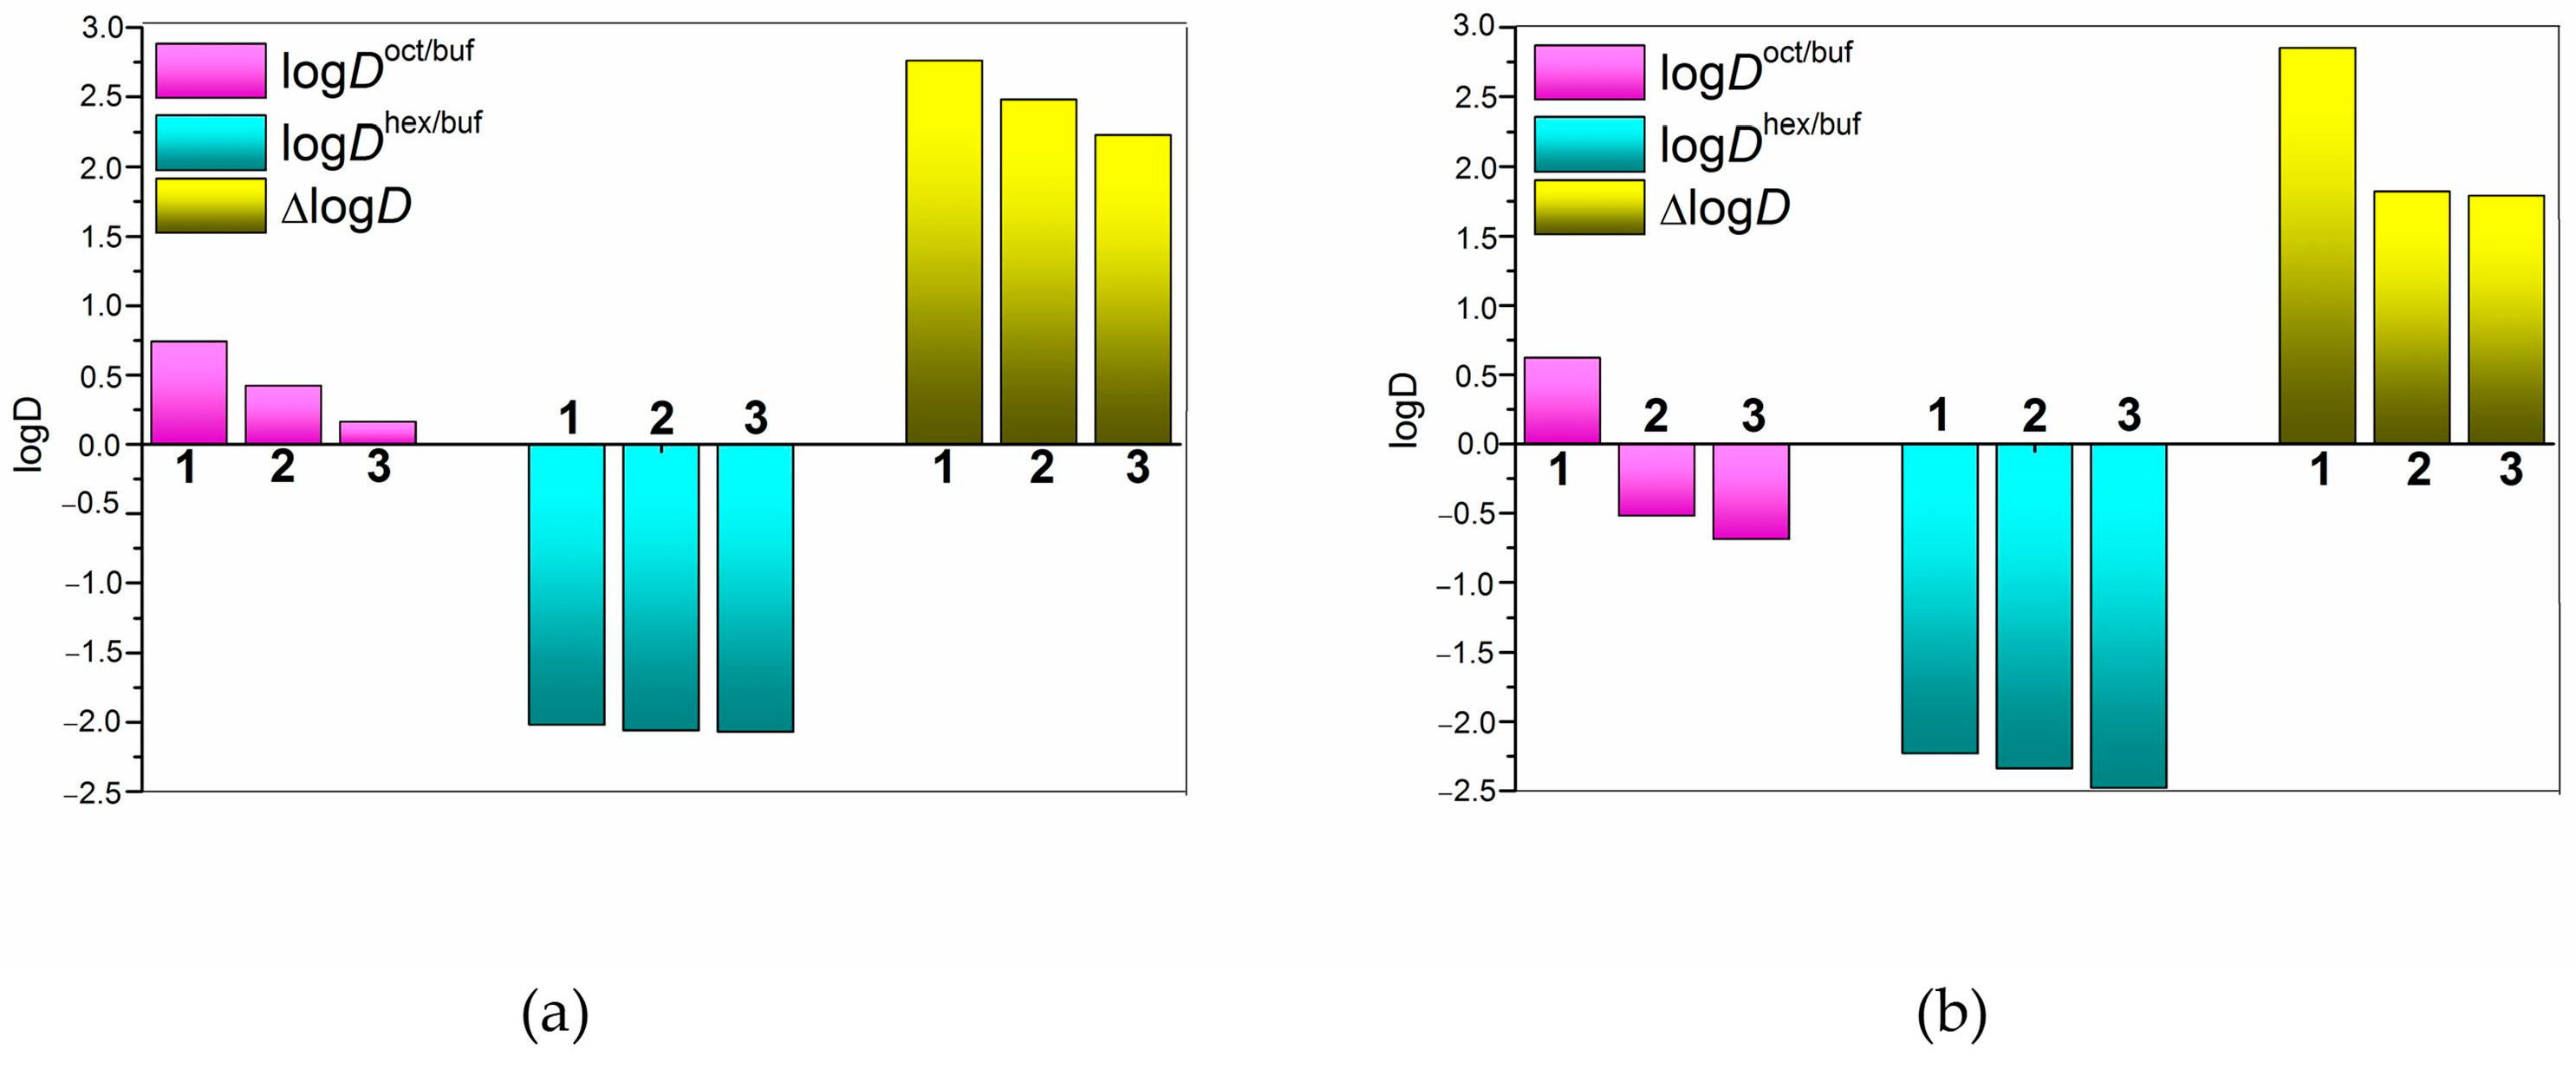
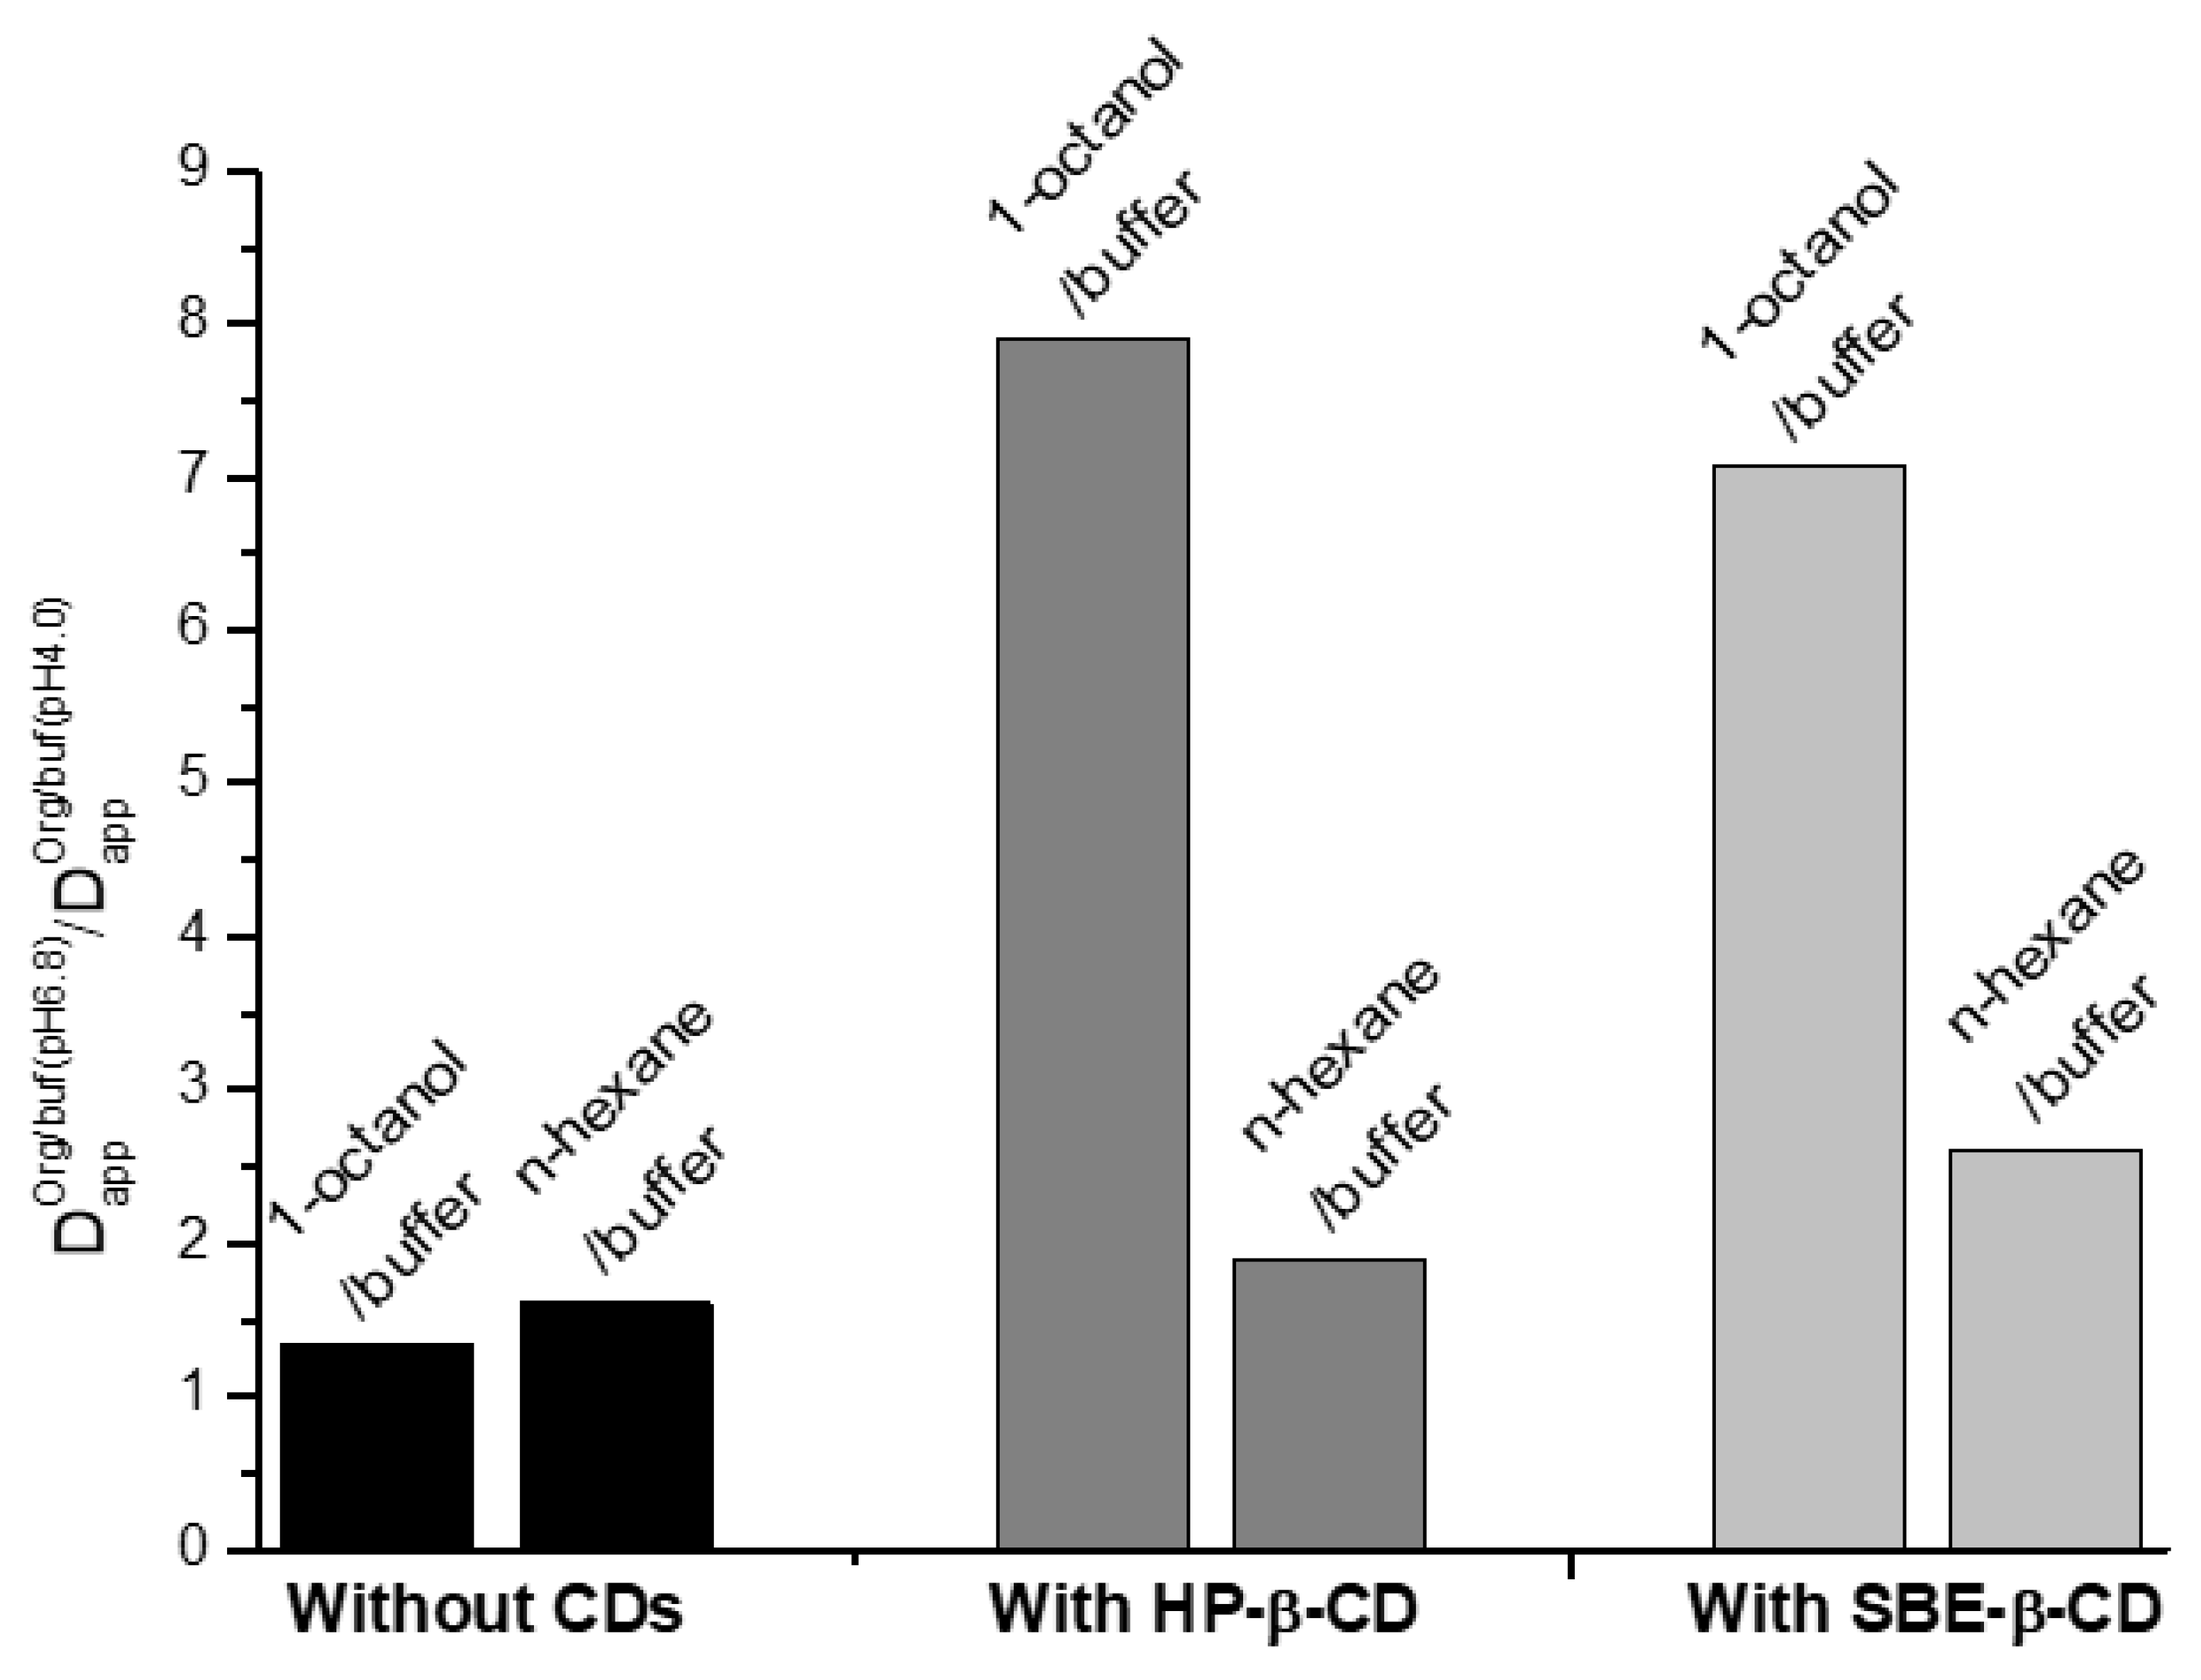
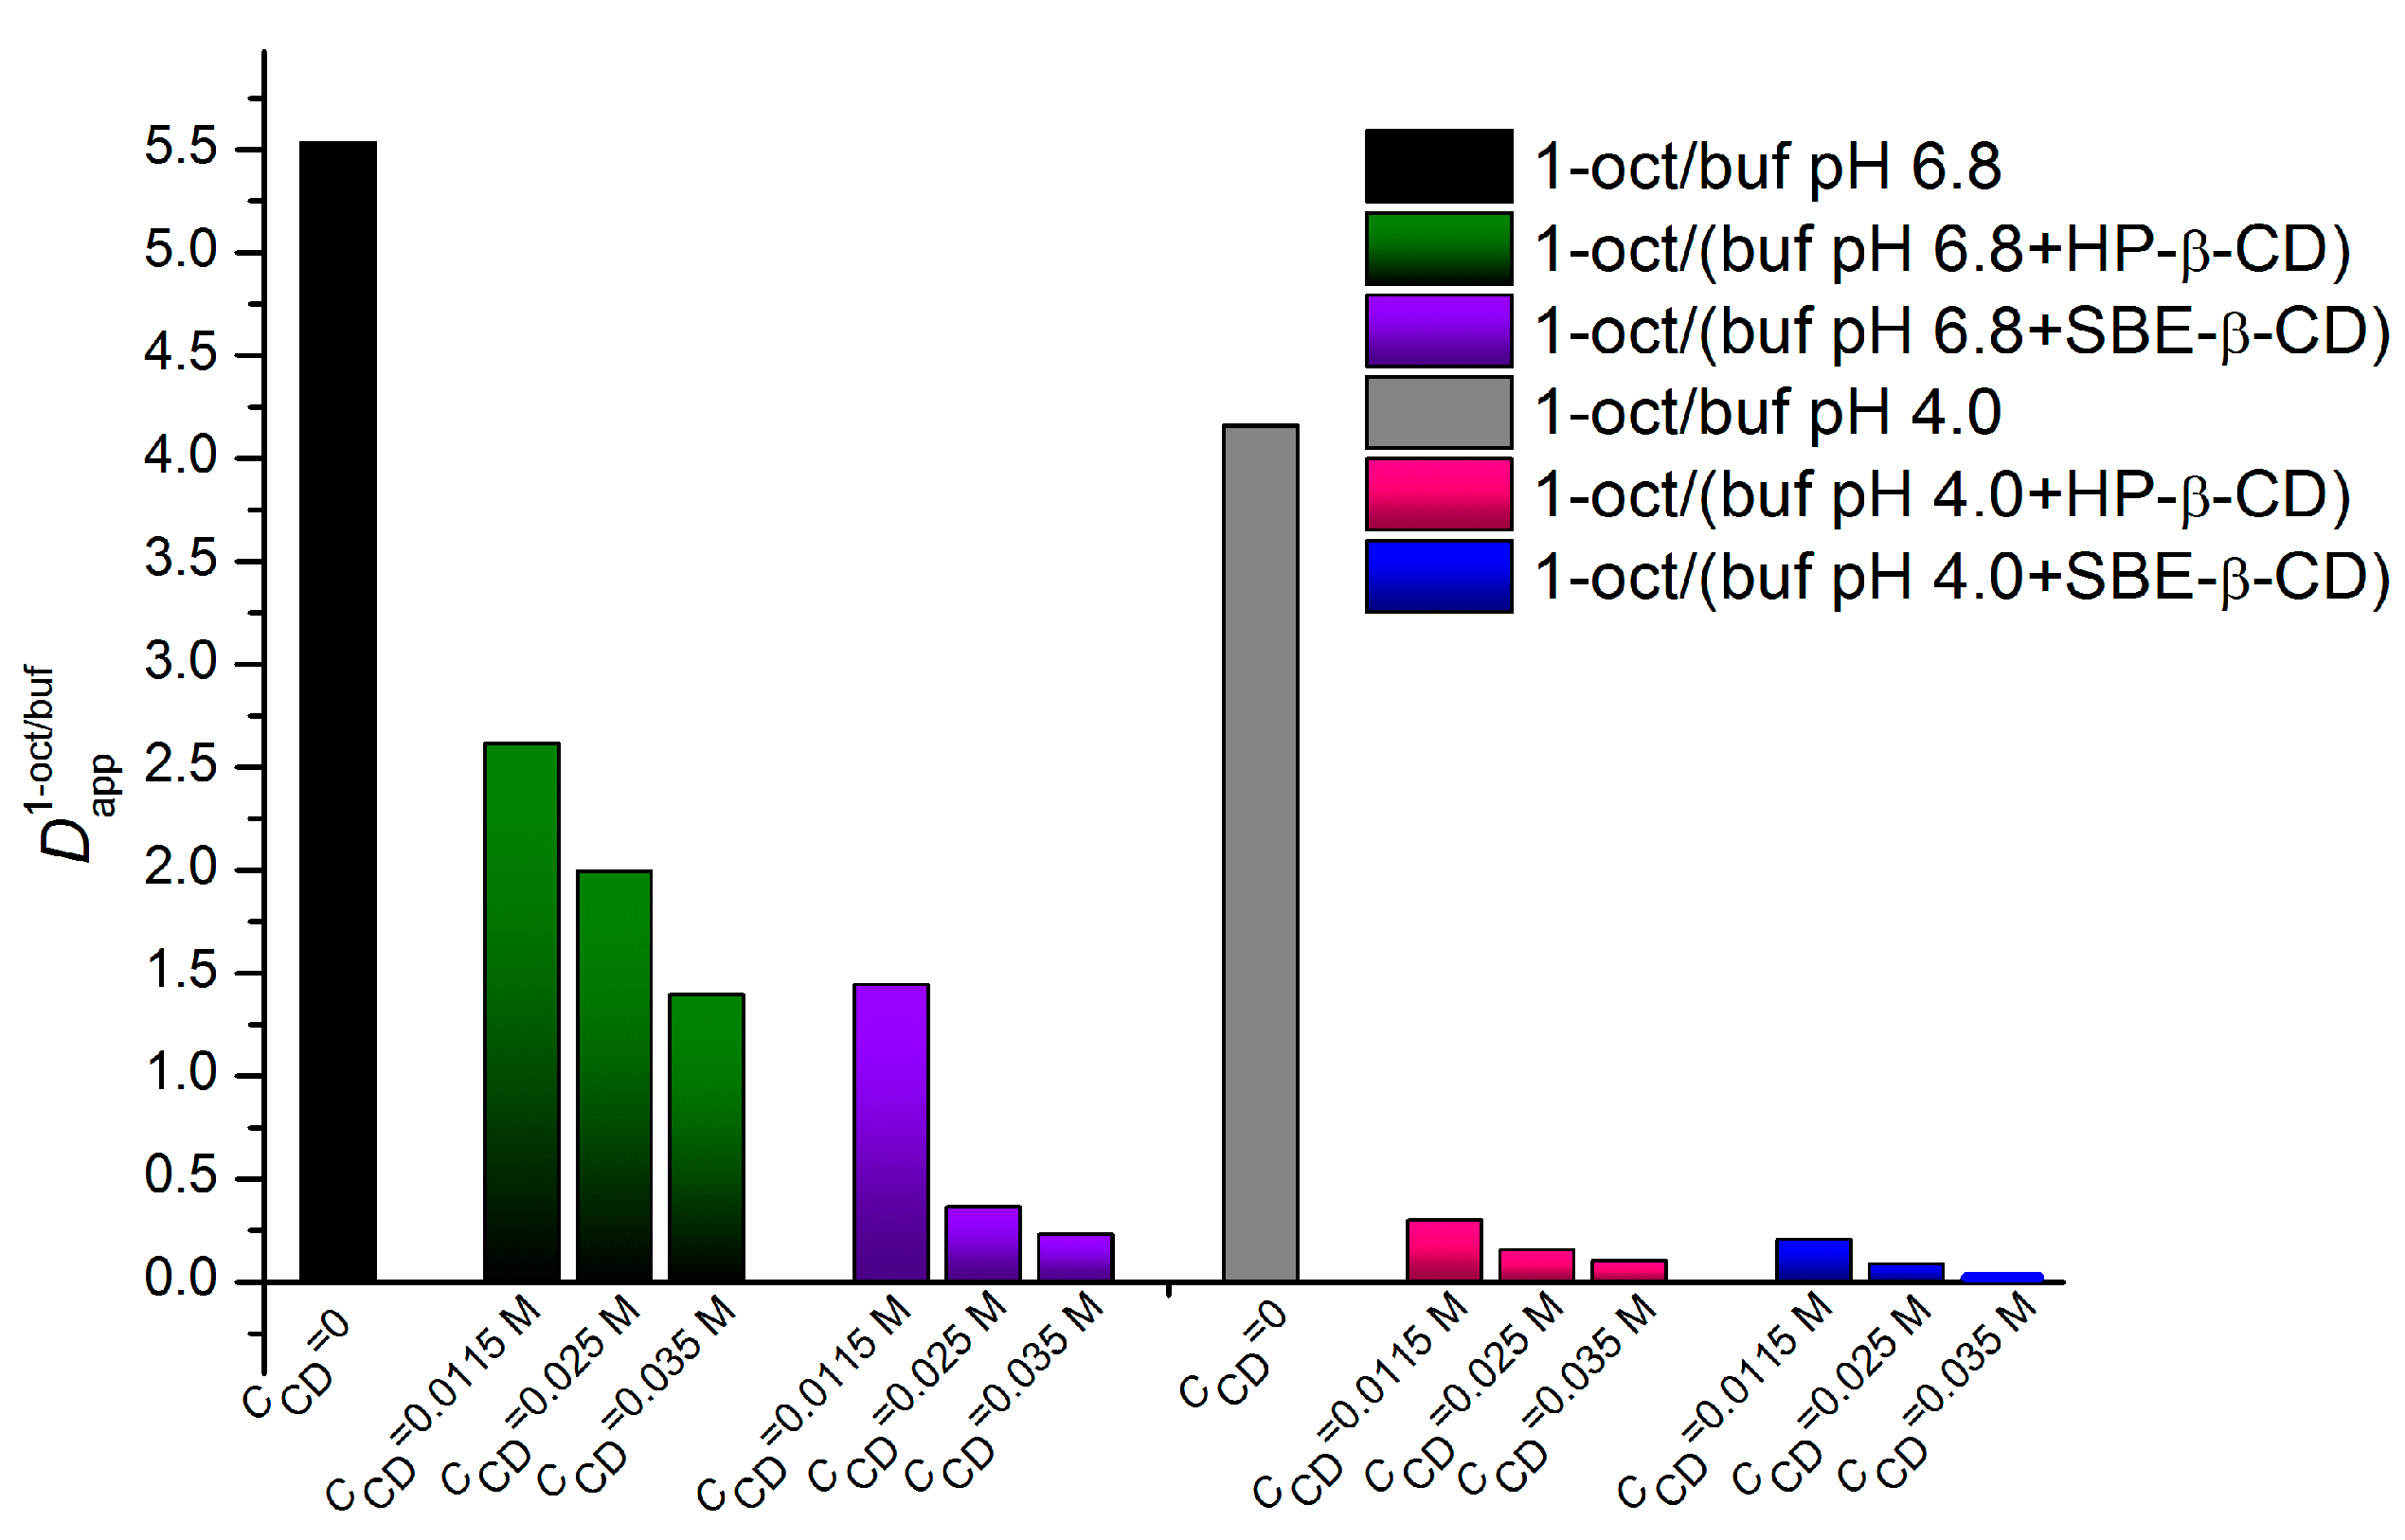
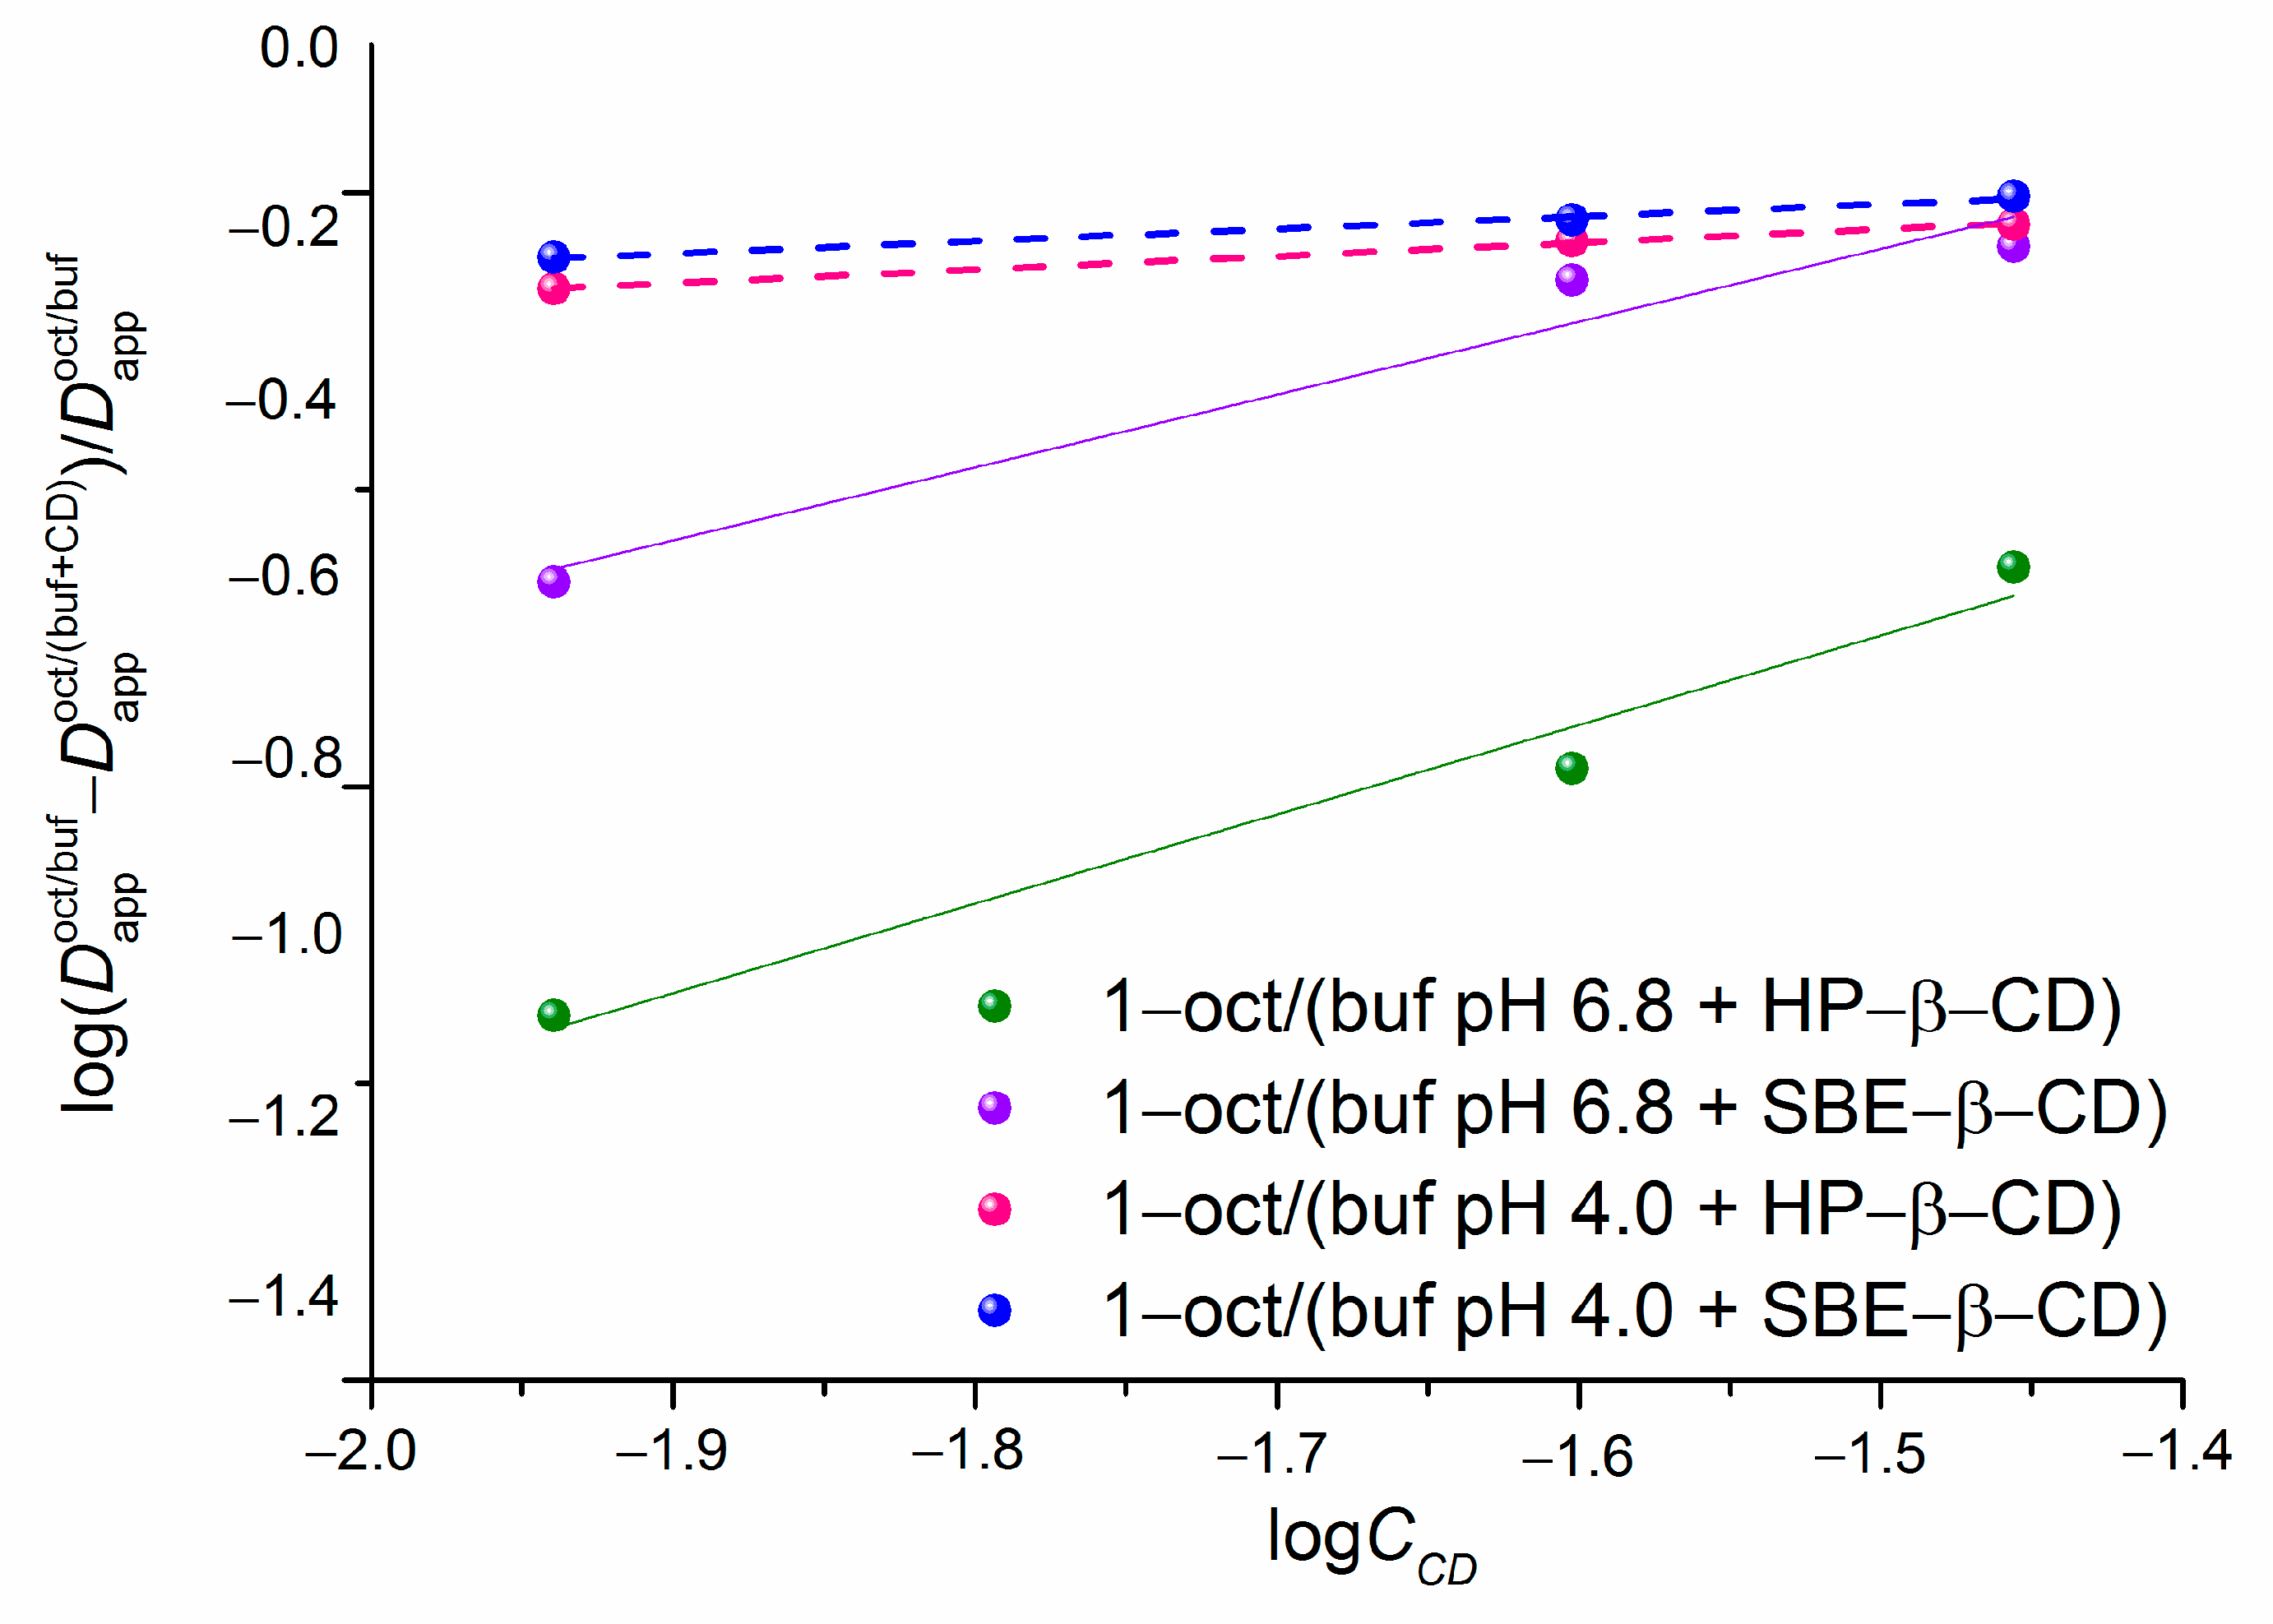
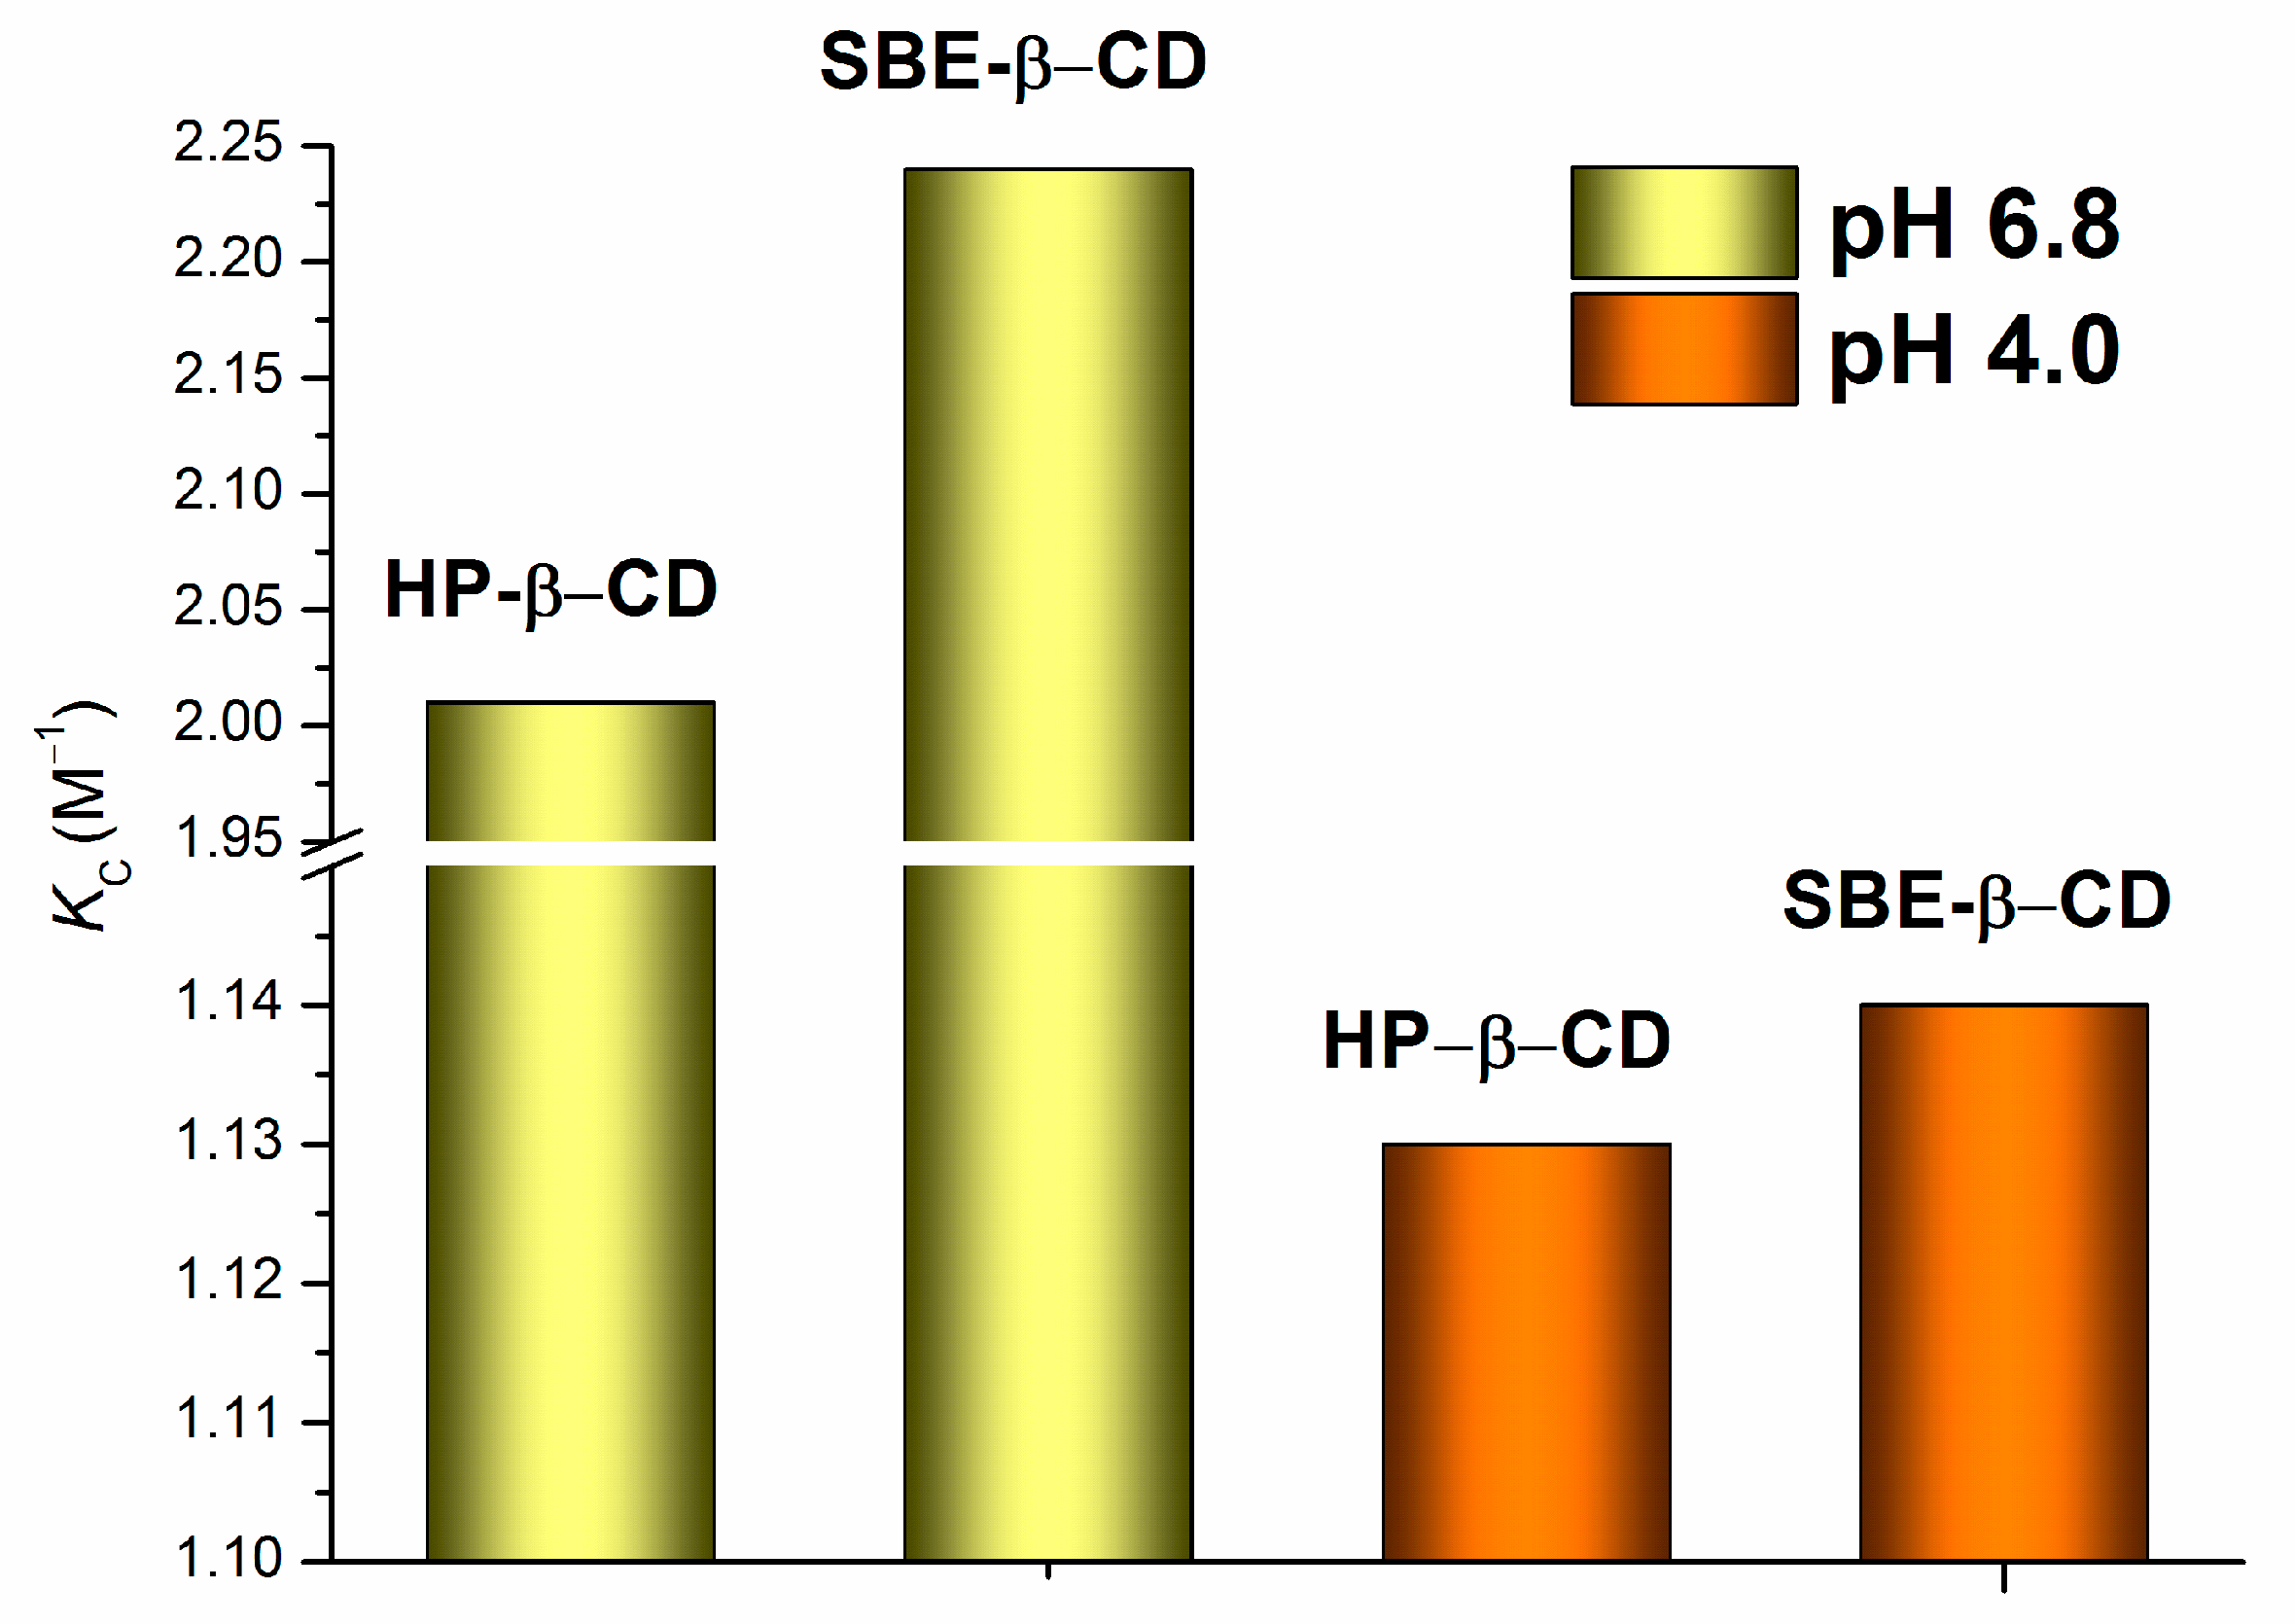
2.1. Effect of HP-β-CD and SBE-β-CD on the Distribution of NTT•HCl
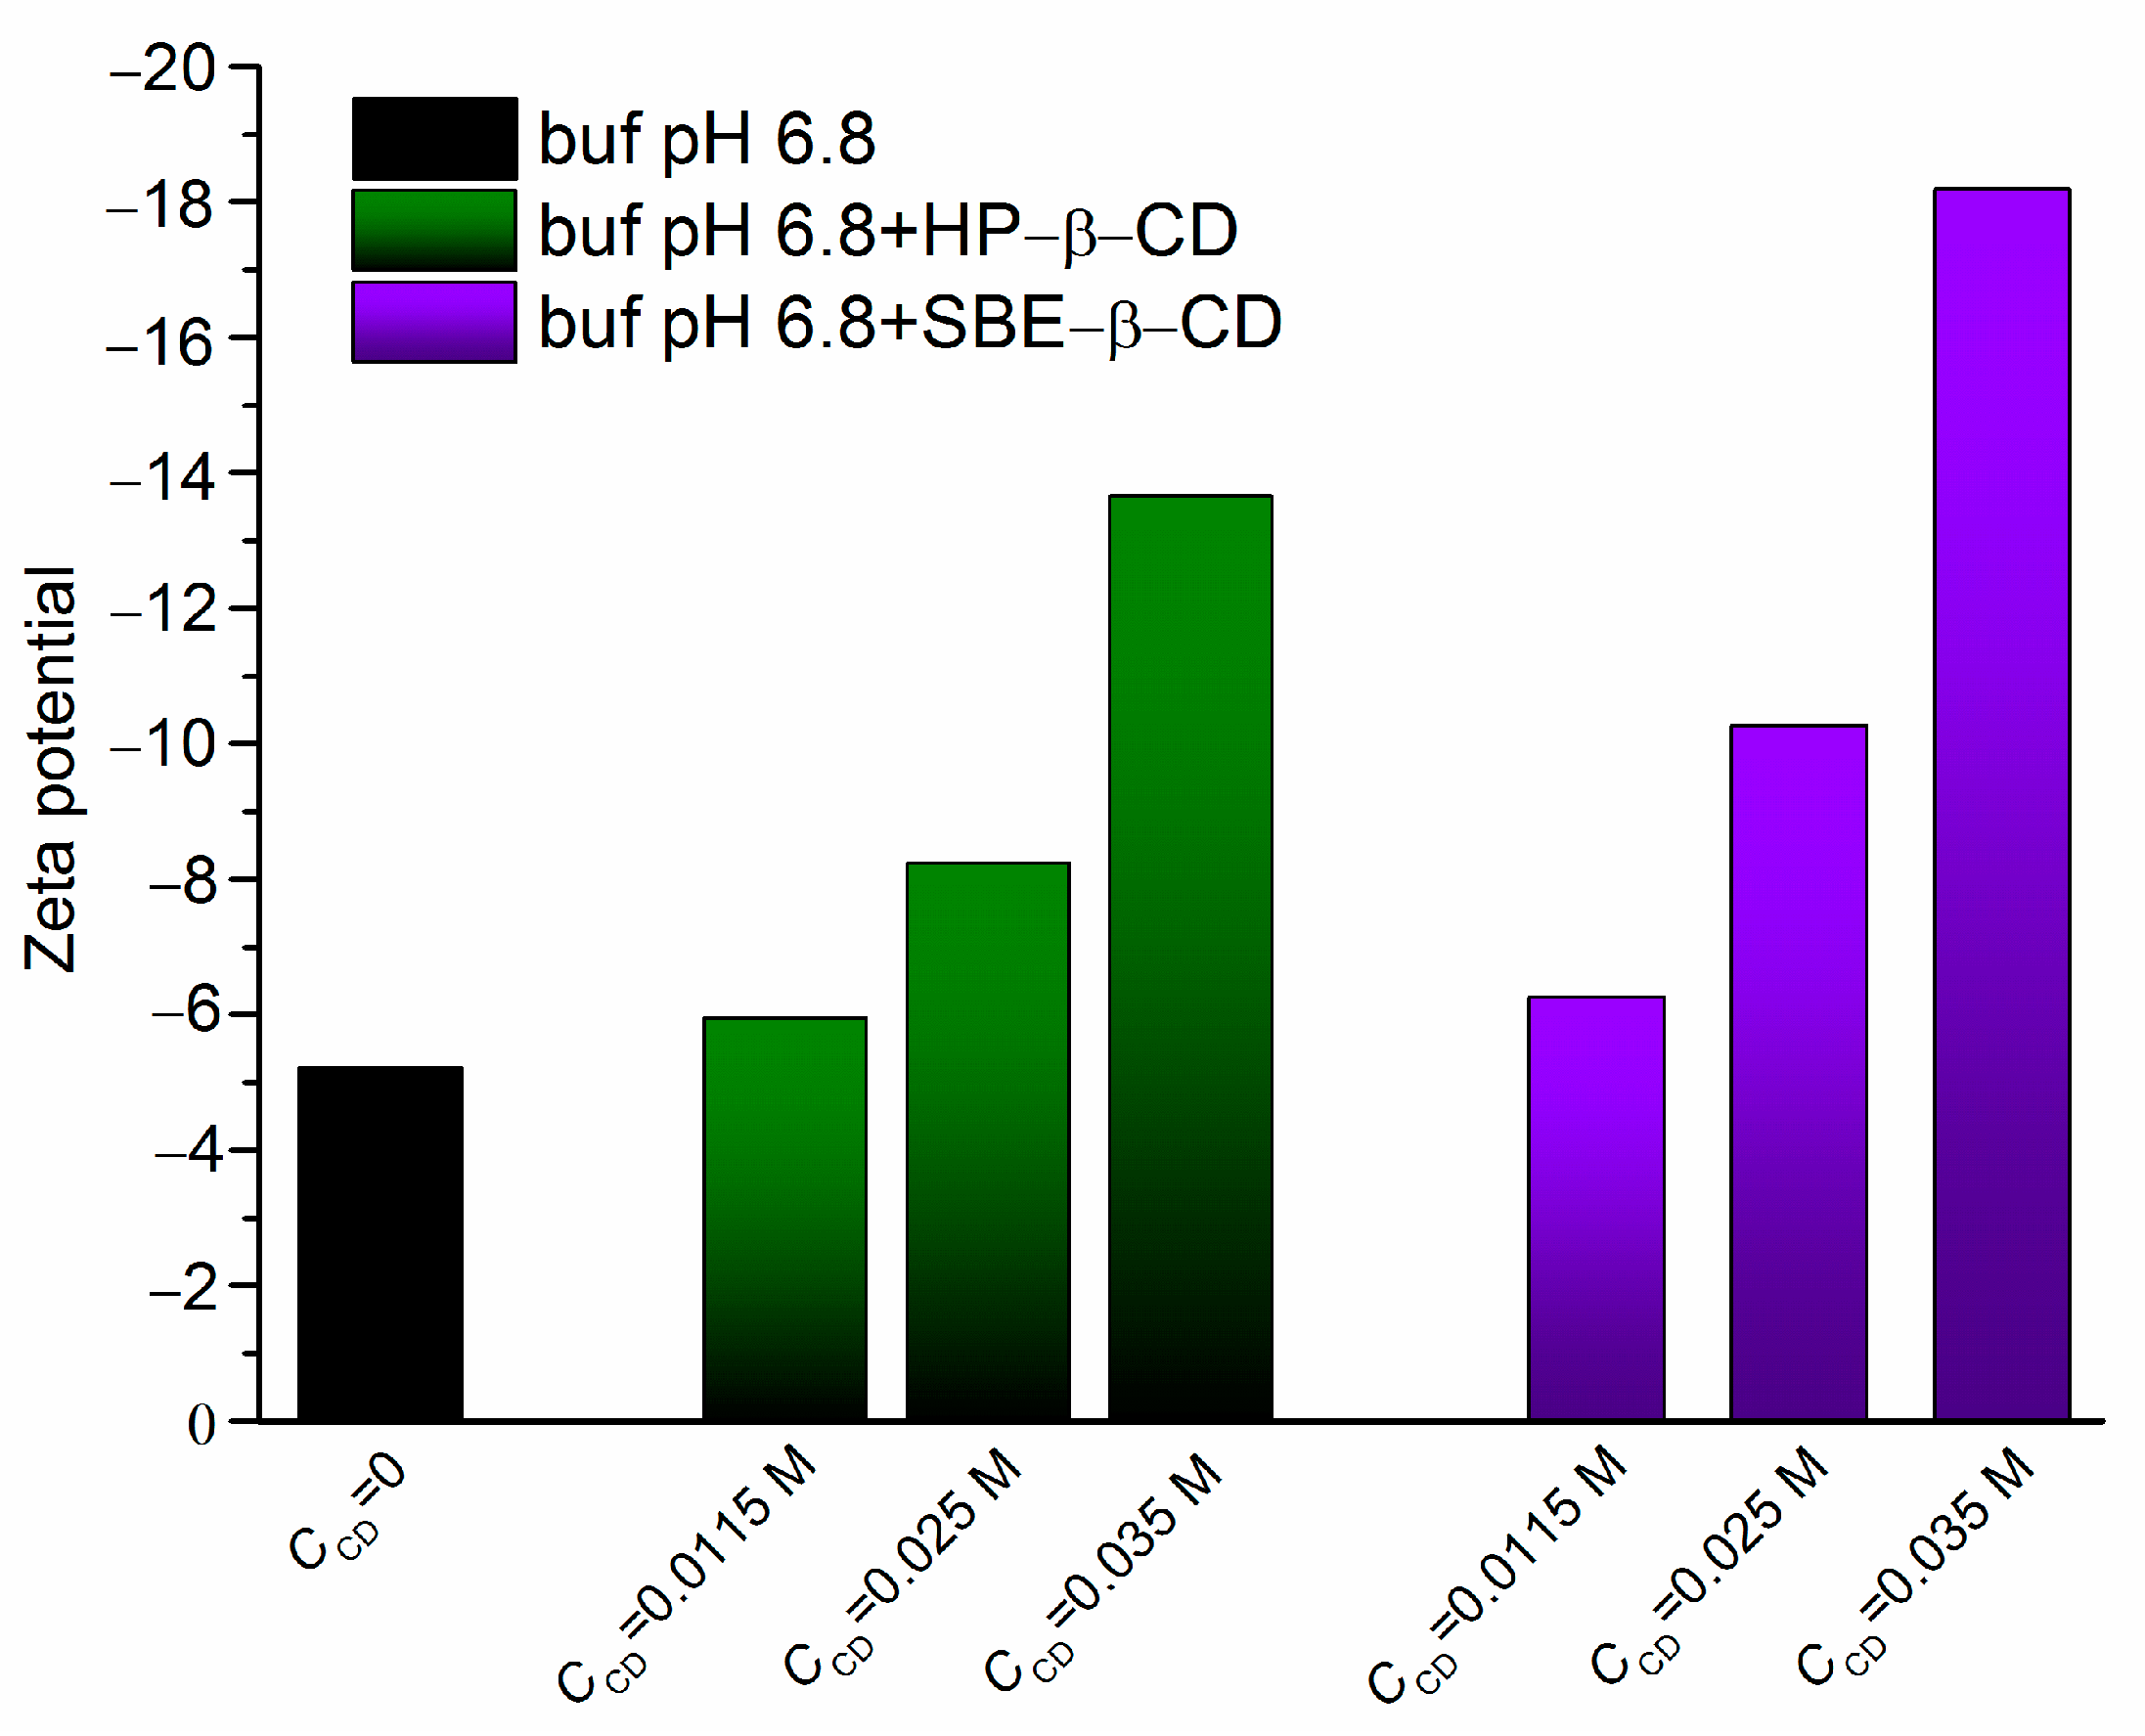
2.2. Zeta Potential Evaluation
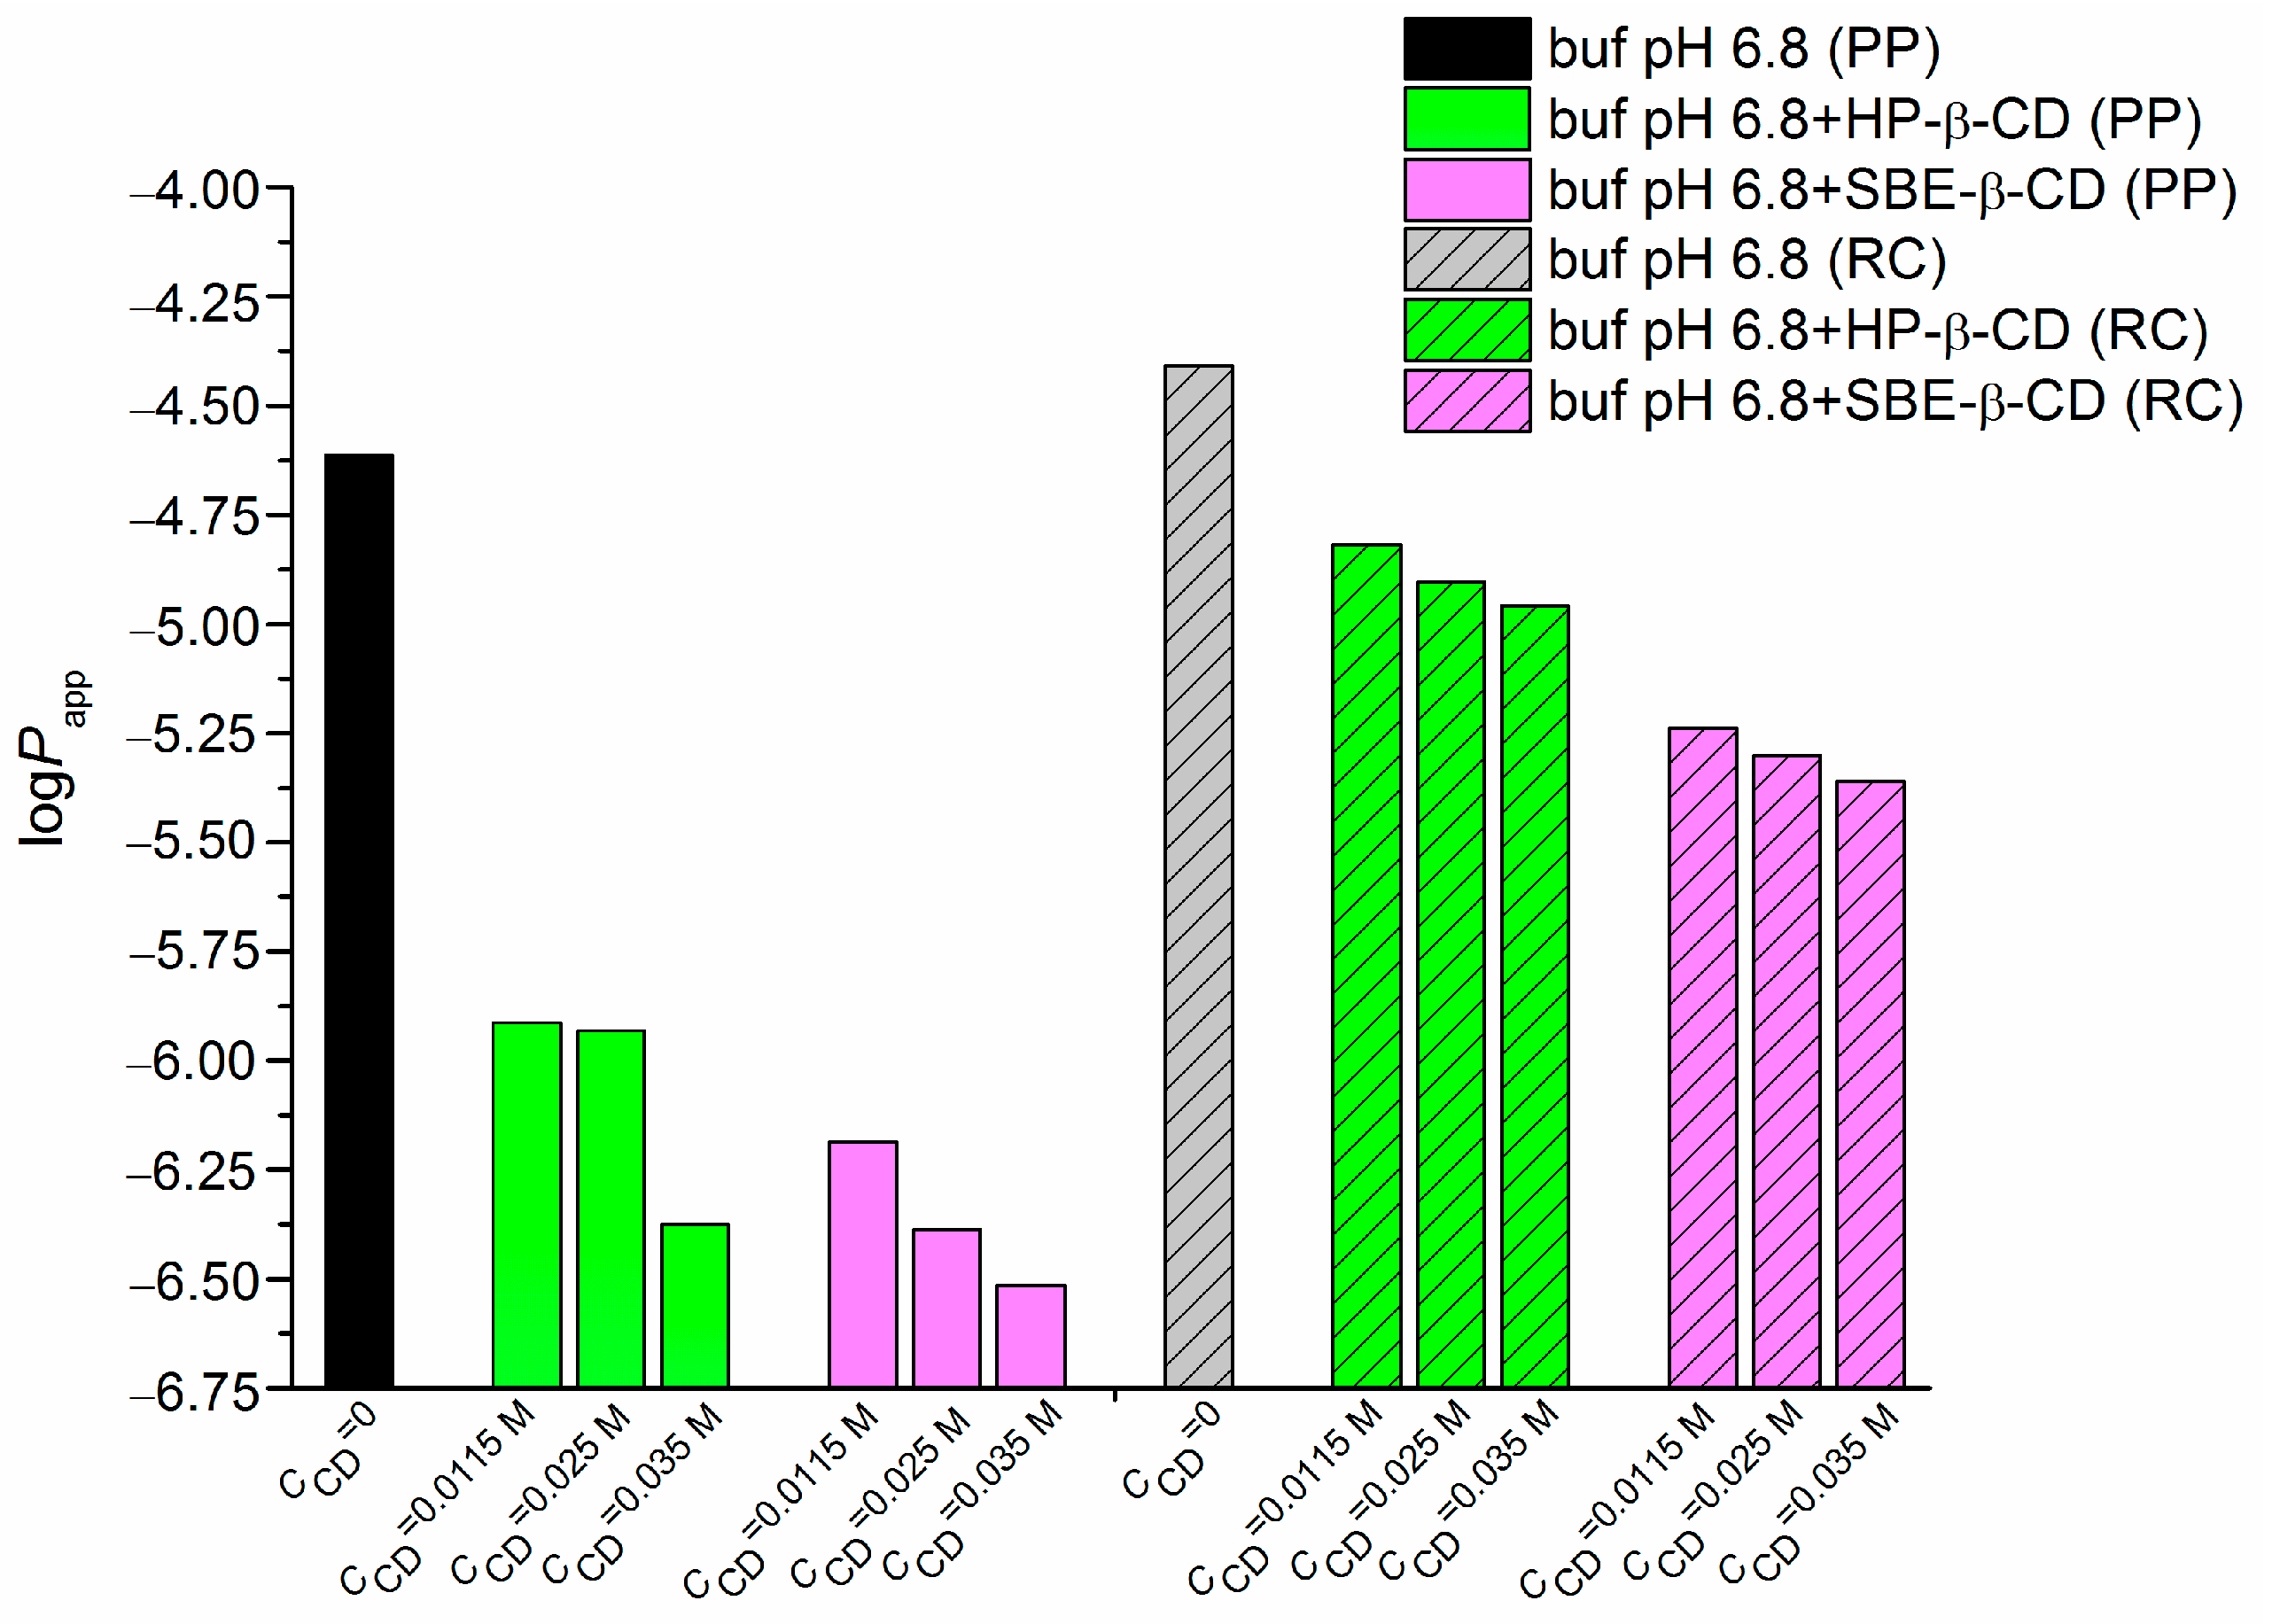
2.3. NTT•HCl Permeability, Effect of Cyclodextrin and Membrane Characteristics
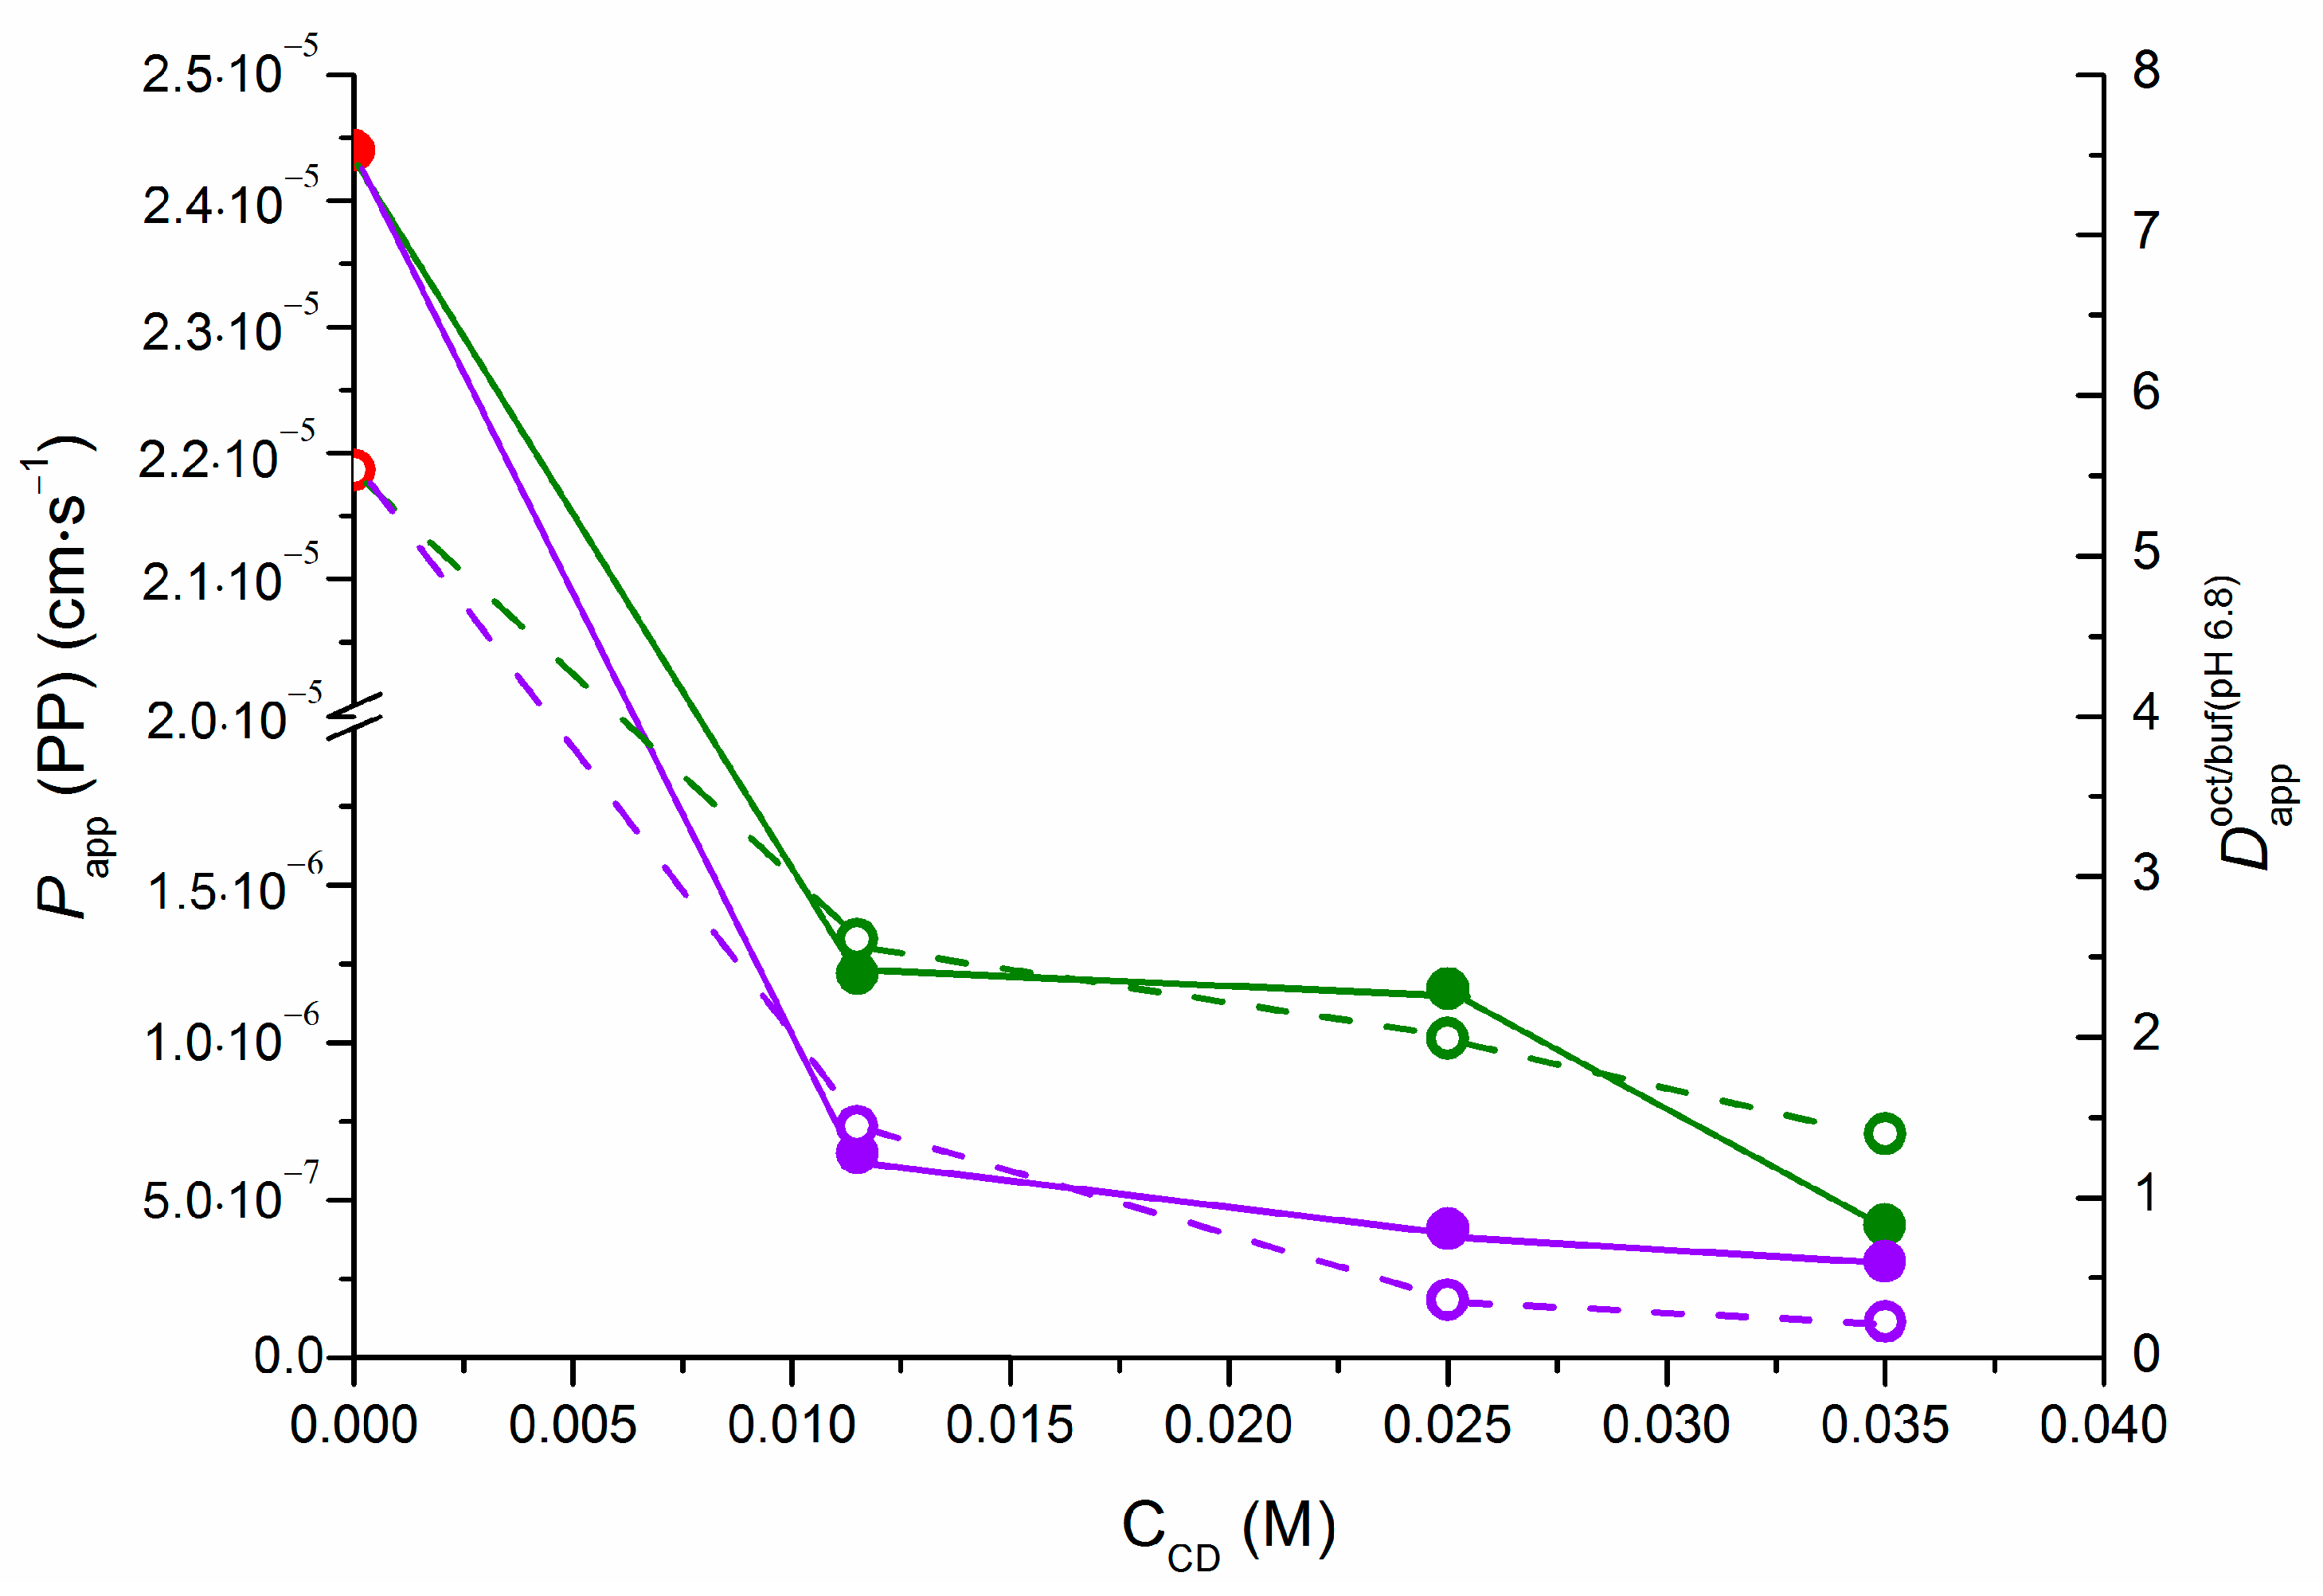
2.4. Correlations of NTT•HCl PermeaPad Permeability and 1-Octanol/Buffer 6.8 pH Distribution
3. Materials and Methods
3.1. Materials
3.2. Distribution Experiments in Systems with and without Cyclodextrins
3.3. Determination of Permeability in Systems with and without Cyclodextrins
3.4. Light Scattering Examination
4. Conclusions
5. Future Prospects and Limitations
Supplementary Materials
Author Contributions
Funding
Institutional Review Board Statement
Informed Consent Statement
Data Availability Statement
Acknowledgments
Conflicts of Interest
Abbreviations
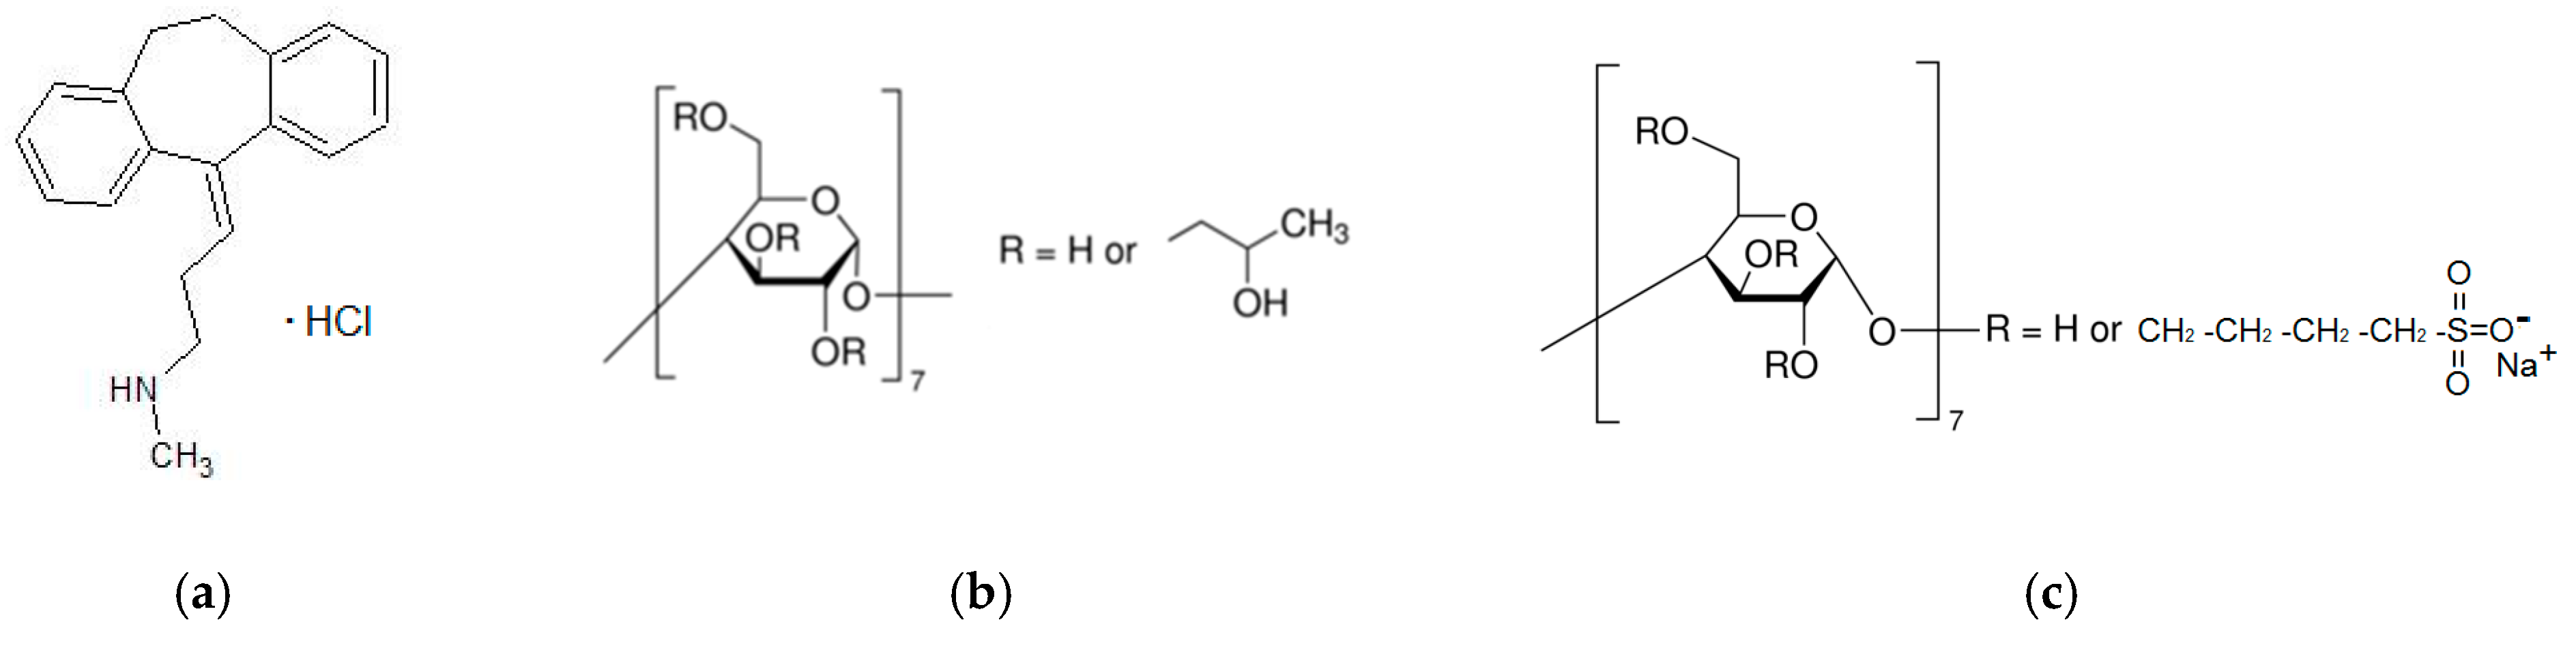
| NTT•HCl | Nortriptyline hydrochloride |
| HP-β-CD | 2-hydroxypropyl-β-cyclodextrin |
| SBE-β-CD | Sulfobutylether-β-cyclodextrin |
| pKa | Ionization constant |
| Apparent distribution coefficients in the organic solvent/buffer system | |
| Apparent distribution coefficients in the 1-octanol/buffer system | |
| Apparent distribution coefficients in the n-hexane/buffer system | |
| ∆logD | Seiler parameter characterizing the impact of hydrogen bonding on the distribution |
| t | Temperature (°C) |
| u(Dapp) | Standard uncertainty of distribution coefficient |
| u(t) | Standard uncertainty of temperature |
| ur(Dapp) | Relative standard uncertainty of distribution coefficient |
| CCD | Concentration of cyclodextrin (M) |
| KC | Association constant (M−1) |
| R | Pair correlation coefficient |
| σ | Residual sum of squares |
| F | Fisher criterion |
| RC | Regenerated cellulose membrane of MWCO 12–14 kDa |
| PP | PermeaPad barrier |
| J | Steady-state flux through the membrane (µmol∙cm−2∙s−1) |
| Papp | Permeability coefficient (cm∙s−1) |
References
- Avdeef, A. Absorption and Drug Development: Solubility, Permeability and Charge State; John Wiley & Sons, Inc.: Hoboken, NJ, USA, 2012. [Google Scholar]
- Loftsson, T.; Duchêneb, D. Cyclodextrins and their pharmaceutical applications. Int. J. Pharm. 2007, 329, 1–11. [Google Scholar] [CrossRef]
- Jambhekar, S.S.; Breen, P. Cyclodextrins in pharmaceutical formulations I: Structure and physicochemical properties, formation of complexes, and types of complex. Drug Discov. Today 2015, 21, 356–362. [Google Scholar] [CrossRef] [PubMed]
- Milcovich, G.; Lettieri, S.; Antunes, F.E.; Medronho, B.; Fonseca, A.C.; Coelho, J.F.J.; Marizza, P.; Perrone, F.; Farra, R.; Dapas, B.; et al. Recent advances in smart biotechnology: Hydrogels and nanocarriers for tailored bioactive molecules depot. Adv. Colloid Interface Sci. 2017, 249, 163–180. [Google Scholar] [CrossRef] [PubMed]
- Milcovich, G.; Antunes, F.E.; Grassi, M.; Asaro, F. Stabilization of unilamellar catanionicvesicles induced by β-cyclodextrins: A strategy for a tunable drug delivery depot. Int. J. Pharm. 2018, 548, 474–479. [Google Scholar] [CrossRef]
- Miller, J.M.; Dahan, A. Predicting the solubility–permeability interplay when using cyclodextrins insolubility-enabling formulations: Model validation. Int. J. Pharm. 2012, 430, 388–391. [Google Scholar] [CrossRef] [PubMed]
- Samuelsen, L.; Holm, R.; Schönbeck, C. Cyclodextrin binding constants as a function of pH for compounds with multiple pKa values. Int. J. Pharm. 2020, 585, 119493. [Google Scholar] [CrossRef]
- Shinoda, W. Permeability across lipid membranes. Biochim. Biophys. Acta Biomembr. 2016, 1858, 2254–2265. [Google Scholar] [CrossRef]
- di Cagno, M.; Bauer-Brandl, A. Assay for Drug Permeability with Adjustable Biomimetic Properties. Danish Patent WO/2016/078667, 26 May 2016. [Google Scholar]
- Sripetch, S.; Prajapati, M.; Loftsson, T. Cyclodextrins and drug membrane permeation: Thermodynamic considerations. J. Pharm. Sci. 2022, 111, 2571–2580. [Google Scholar] [CrossRef]
- Abraham, M.H.; Chadha, H.S.; Whiting, G.S.; Mitchell, R.C. Hydrogen bonding. 32. An analysis of water-octanol and water-alkane partitioning and the ΔlogP parameter of Seiler. J. Pharm. Sci. 1994, 83, 1085–1100. [Google Scholar] [CrossRef]
- Mälkiä, A.; Murtomäki, L.; Urtti, A.; Kontturi, K. Drug permeation in biomembranes: In vitro and in silico prediction and influence of physicochemical properties. Eur. J. Pharm. Sci. 2004, 23, 13–47. [Google Scholar] [CrossRef]
- Volkova, T.V.; Drozd, K.V.; Surov, A.O. Effect of polymers and cyclodextrins on solubility, permeability and distribution of enzalutamide and apalutamide antiandrogens. J. Mol. Liq. 2020, 322, 114937. [Google Scholar] [CrossRef]
- Volkova, T.V.; Simonova, O.R.; Perlovich, G.L. Revisiting the distribution/permeability regularities exemplified by cationic drug amitriptyline hydrochloride: Impact of temperature and pH. J. Mol. Liq. 2022, 368, 120801. [Google Scholar] [CrossRef]
- Volkova, T.; Simonova, O.; Perlovich, G. Modulation of distribution and diffusion through the lipophilic membrane with cyclodextrins exemplified by a model pyridinecarboxamide derivative. Pharmaceutics 2023, 15, 1531. [Google Scholar] [CrossRef] [PubMed]
- Eli, W.; Chen, W. Determination of association constants of cyclodextrin-nonionic surfactant inclusion complexes by a partition coefficient method. J. Incl. Phenom. 2000, 38, 37–43. [Google Scholar] [CrossRef]
- Másson, M.; Sigurdardóttir, B.V.; Matthíasson, K.; Loftsson, T. Investigation of drug–cyclodextrin complexes by a phase-distribution method: Some theoretical and practical considerations. Chem. Pharm. Bull. 2005, 53, 958–964. [Google Scholar] [CrossRef] [PubMed]
- Melero, A.; Garrigues, T.M.; Almudever, P.; Martín Villodre, A.; Lehr, C.M.; Schäfer, U. Nortriptyline hydrochloride skin absorption: Development of a transdermal patch. Eur. J. Pharm. Biopharm. 2008, 69, 588–596. [Google Scholar] [CrossRef] [PubMed]
- Zia, V.; Rajewski, R.A.; Stella, V.J. Effect of cyclodextrin charge on complexation of neutral and charged substrates: Comparison of (SBE)7M-beta-CD to HP-beta-CD. Pharm. Res. 2001, 18, 667–673. [Google Scholar] [CrossRef]
- Nakajima, T.; Sunagawa, M.; Hirohashi, T. Studies of cyclodextrin inclusion complexes. II. Application of the partition coefficient method. Chem. Pharm. Bull. 1984, 32, 401–408. [Google Scholar] [CrossRef]
- El-Badry, M.; Taha, A.I.; Alanazi, F.K.; Alsarra, I.A. Study of omeprazole stability in aqueous solution: Influence of cyclodxtrins. J. Drug Deliv. Sci. Technol. 2009, 19, 347–351. [Google Scholar] [CrossRef]
- Carrier, R.L.; Miller, L.A.; Ahmed, I. The utility of cyclodextrins for enhancing oral bioavailability. J. Control. Release 2007, 123, 78–99. [Google Scholar] [CrossRef]
- Rekharsky, M.V.; Inoue, Y. Complexation thermodynamics of cyclodextrins. Chem. Rev. 1998, 98, 1875–1917. [Google Scholar] [CrossRef] [PubMed]
- Youdim, K.A.; Avdeef, A.; Abbott, N.J. In vitro trans-monolayer permeability calculations: Often forgotten assumptions. Drug Discov. Today 2003, 8, 997–1003. [Google Scholar] [CrossRef] [PubMed]
- Conradi, R.A.; Burton, P.S.; Borchardt, R.T. Physico-chemical and biological factors that influence a drug’s cellular permeability by passive diffusion. In Lipophilicity in Drug Action and Toxicology; Pliška, V., Testa, B., van de Waterbeemd, H., Eds.; VCH Verlagsgesellschaft mbH: Weinhiem, Germany, 1996; pp. 234–252. [Google Scholar]
- Missner, A.; Pohl, P. 110 years of the Meyer-Overton rule: Predicting membrane permeability of gases and other small compounds. Chem. Phys. Chem. 2009, 10, 1405–1414. [Google Scholar] [CrossRef]
- Bouchard, G.; Carrupt, P.-A.; Testa, B.; Gobry, V.; Girault, H.H. Lipophilicity and solvation of anionic drugs. Chem. Eur. J. 2002, 8, 3478–3484. [Google Scholar] [CrossRef]
- Volkova, T.V.; Simonova, O.R.; Levshin, I.B.; Perlovich, G.L. Chiral recognition R- and RS- of new antifungal: Complexation/solubilization/dissolution thermodynamics and permeability assay. Pharmaceutics 2022, 14, 864–885. [Google Scholar] [CrossRef] [PubMed]
- Andrés, A.; Rosés, M.; Ràfols, C.; Bosch, E.; Espinosa, S.; Segarra, V.; Huerta, J.M. Setup and validation of shake-flask procedures for the determination of partition coefficients (logD) from low drug amounts. Eur. J. Pharm. Sci. 2015, 76, 181–191. [Google Scholar] [CrossRef] [PubMed]
- Menges, R.A.; Armstrong, D.W. Use of a three-phase model with hydroxypropyl-β-cyclodextrin for the direct determination of large octanol-water and cyclodextrin- water partition coefficients. Anal. Chim. Acta. 1991, 255, 157–162. [Google Scholar] [CrossRef]
- Saokham, P.; Muankaew, C.; Jansook, P.; Loftsson, T. Solubility of cyclodextrins and drug/cyclodextrin complexes. Molecules 2018, 23, 1161. [Google Scholar] [CrossRef]
- di Cagno, M.; Luppi, B. Drug ‘‘supersaturation’’ states induced by polymeric micelles and liposomes: A mechanistic investigation into permeability enhancements. Eur. J. Pharm. Sci. 2013, 48, 775–780. [Google Scholar] [CrossRef]


| CCD (M) | ∆logD | ||
|---|---|---|---|
| pH of 6.8 | |||
| 0 | 5.537 ± 0.111 (0.74) | (9.5 ± 0.2) × 10−3 (−2.02) | 2.76 |
| HP-β-CD | |||
| 0.0115 | 2.613 ± 0.022 (0.42) | (8.7 ± 0.1) × 10−3 (−2.06) | 2.48 |
| 0.025 | 1.993 ± 0.030 (0.30) | - | |
| 0.035 | 1.395 ± 0.025 (0.15) | - | |
| SBE-β-CD | |||
| 0.0115 | 1.443 ± 0.040 (0.16) | (8.6 ± 0.3) × 10−3 (−2.07) | 2.23 |
| 0.025 | 0.364 ± 0.011 (−0.44) | - | |
| 0.035 | 0.227 ± 0.006 (−0.64) | - | |
| pH of 4.0 | |||
| 0 | 4.159 ± 0.080 (0.62) | (5.6 ± 0.2) × 10−3 (−2.23) | 2.85 |
| HP-β-CD | |||
| 0.0115 | 0.299 ± 0.008 (−0.52) | (4.6 ± 0.1) × 10−3 (−2.34) | 1.82 |
| 0.025 | 0.154 ± 0.003 (−0.81) | - | |
| 0.035 | 0.101 ± 0.001 (−1.0) | - | |
| SBE-β-CD | |||
| 0.0115 | 0.204 ± 0.005 (−0.69) | (3.3 ± 0.1) × 10−3 (−2.48) | 1.79 |
| 0.025 | 0.086 ± 0.001 (−1.07) | - | |
| 0.035 | 0.013 ± 0.000 (−1.89) | - | |
| pH of the Aqueous Phase | KC (M−1) | 1R | 2 σ | 3F |
|---|---|---|---|---|
| HP-β-CD | ||||
| pH of 6.8 | 2.01 ± 0.05 | 0.9866 | 3.06 × 10⁻⁴ | 36.4 |
| pH of 4.0 | 1.13 ± 0.02 | 0.9991 | 4.69 × 10⁻⁷ | 538.9 |
| SBE-β-CD | ||||
| pH of 6.8 | 2.24 ± 0.03 | 0.9784 | 3.30 × 10⁻⁴ | 22.4 |
| pH of 4.0 | 1.14 ± 0.02 | 0.9965 | 1.49 × 10⁻⁶ | 141.6 |
Disclaimer/Publisher’s Note: The statements, opinions and data contained in all publications are solely those of the individual author(s) and contributor(s) and not of MDPI and/or the editor(s). MDPI and/or the editor(s) disclaim responsibility for any injury to people or property resulting from any ideas, methods, instructions or products referred to in the content. |
© 2023 by the authors. Licensee MDPI, Basel, Switzerland. This article is an open access article distributed under the terms and conditions of the Creative Commons Attribution (CC BY) license (https://creativecommons.org/licenses/by/4.0/).
Share and Cite
Volkova, T.; Simonova, O.; Perlovich, G. Cyclodextrin’s Effect on Permeability and Partition of Nortriptyline Hydrochloride. Pharmaceuticals 2023, 16, 1022. https://doi.org/10.3390/ph16071022
Volkova T, Simonova O, Perlovich G. Cyclodextrin’s Effect on Permeability and Partition of Nortriptyline Hydrochloride. Pharmaceuticals. 2023; 16(7):1022. https://doi.org/10.3390/ph16071022
Chicago/Turabian StyleVolkova, Tatyana, Olga Simonova, and German Perlovich. 2023. "Cyclodextrin’s Effect on Permeability and Partition of Nortriptyline Hydrochloride" Pharmaceuticals 16, no. 7: 1022. https://doi.org/10.3390/ph16071022