
Comparative Study on the Effect of Phenolics and Their Antioxidant Potential of Freeze-Dried Australian Beach-Cast Seaweed Species upon Different Extraction Methodologies
 , , and
Abstract
:
1. Introduction
2. Results and Discussion
2.1. Total Phenolics, Flavonoids Tannin and Phlorotannin Content
2.2. Antioxidant Potential
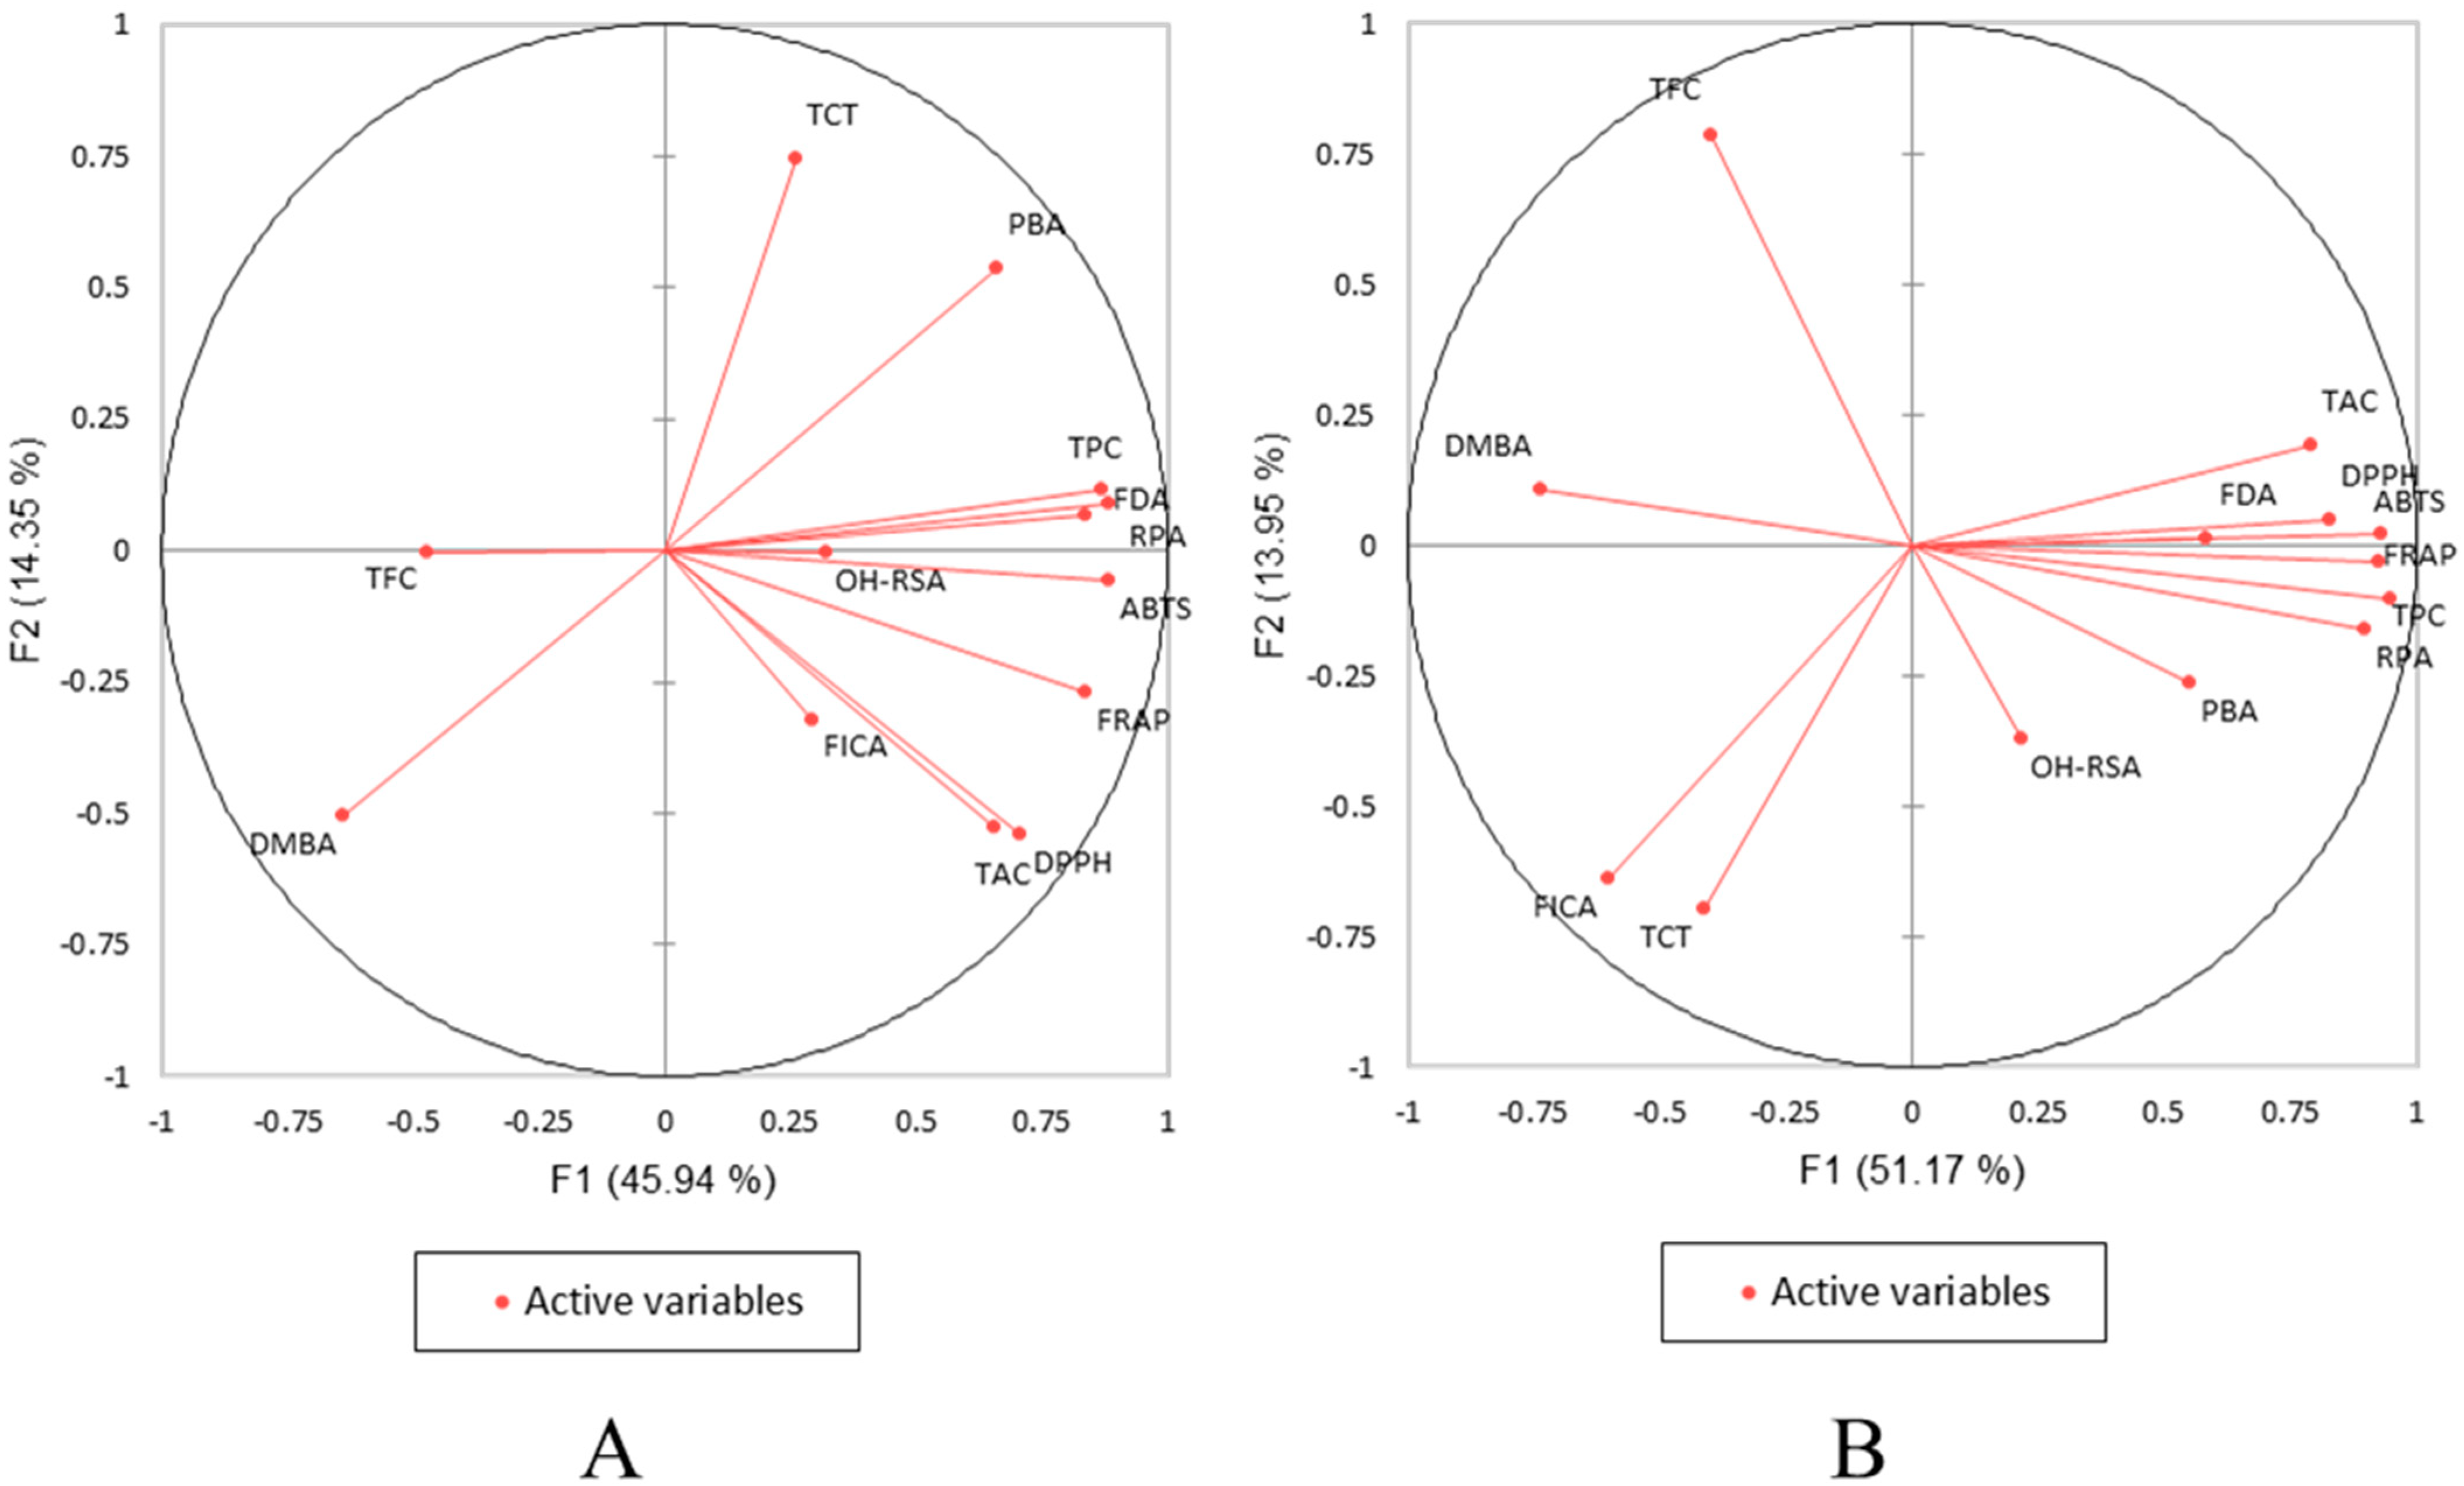
2.3. Correlation
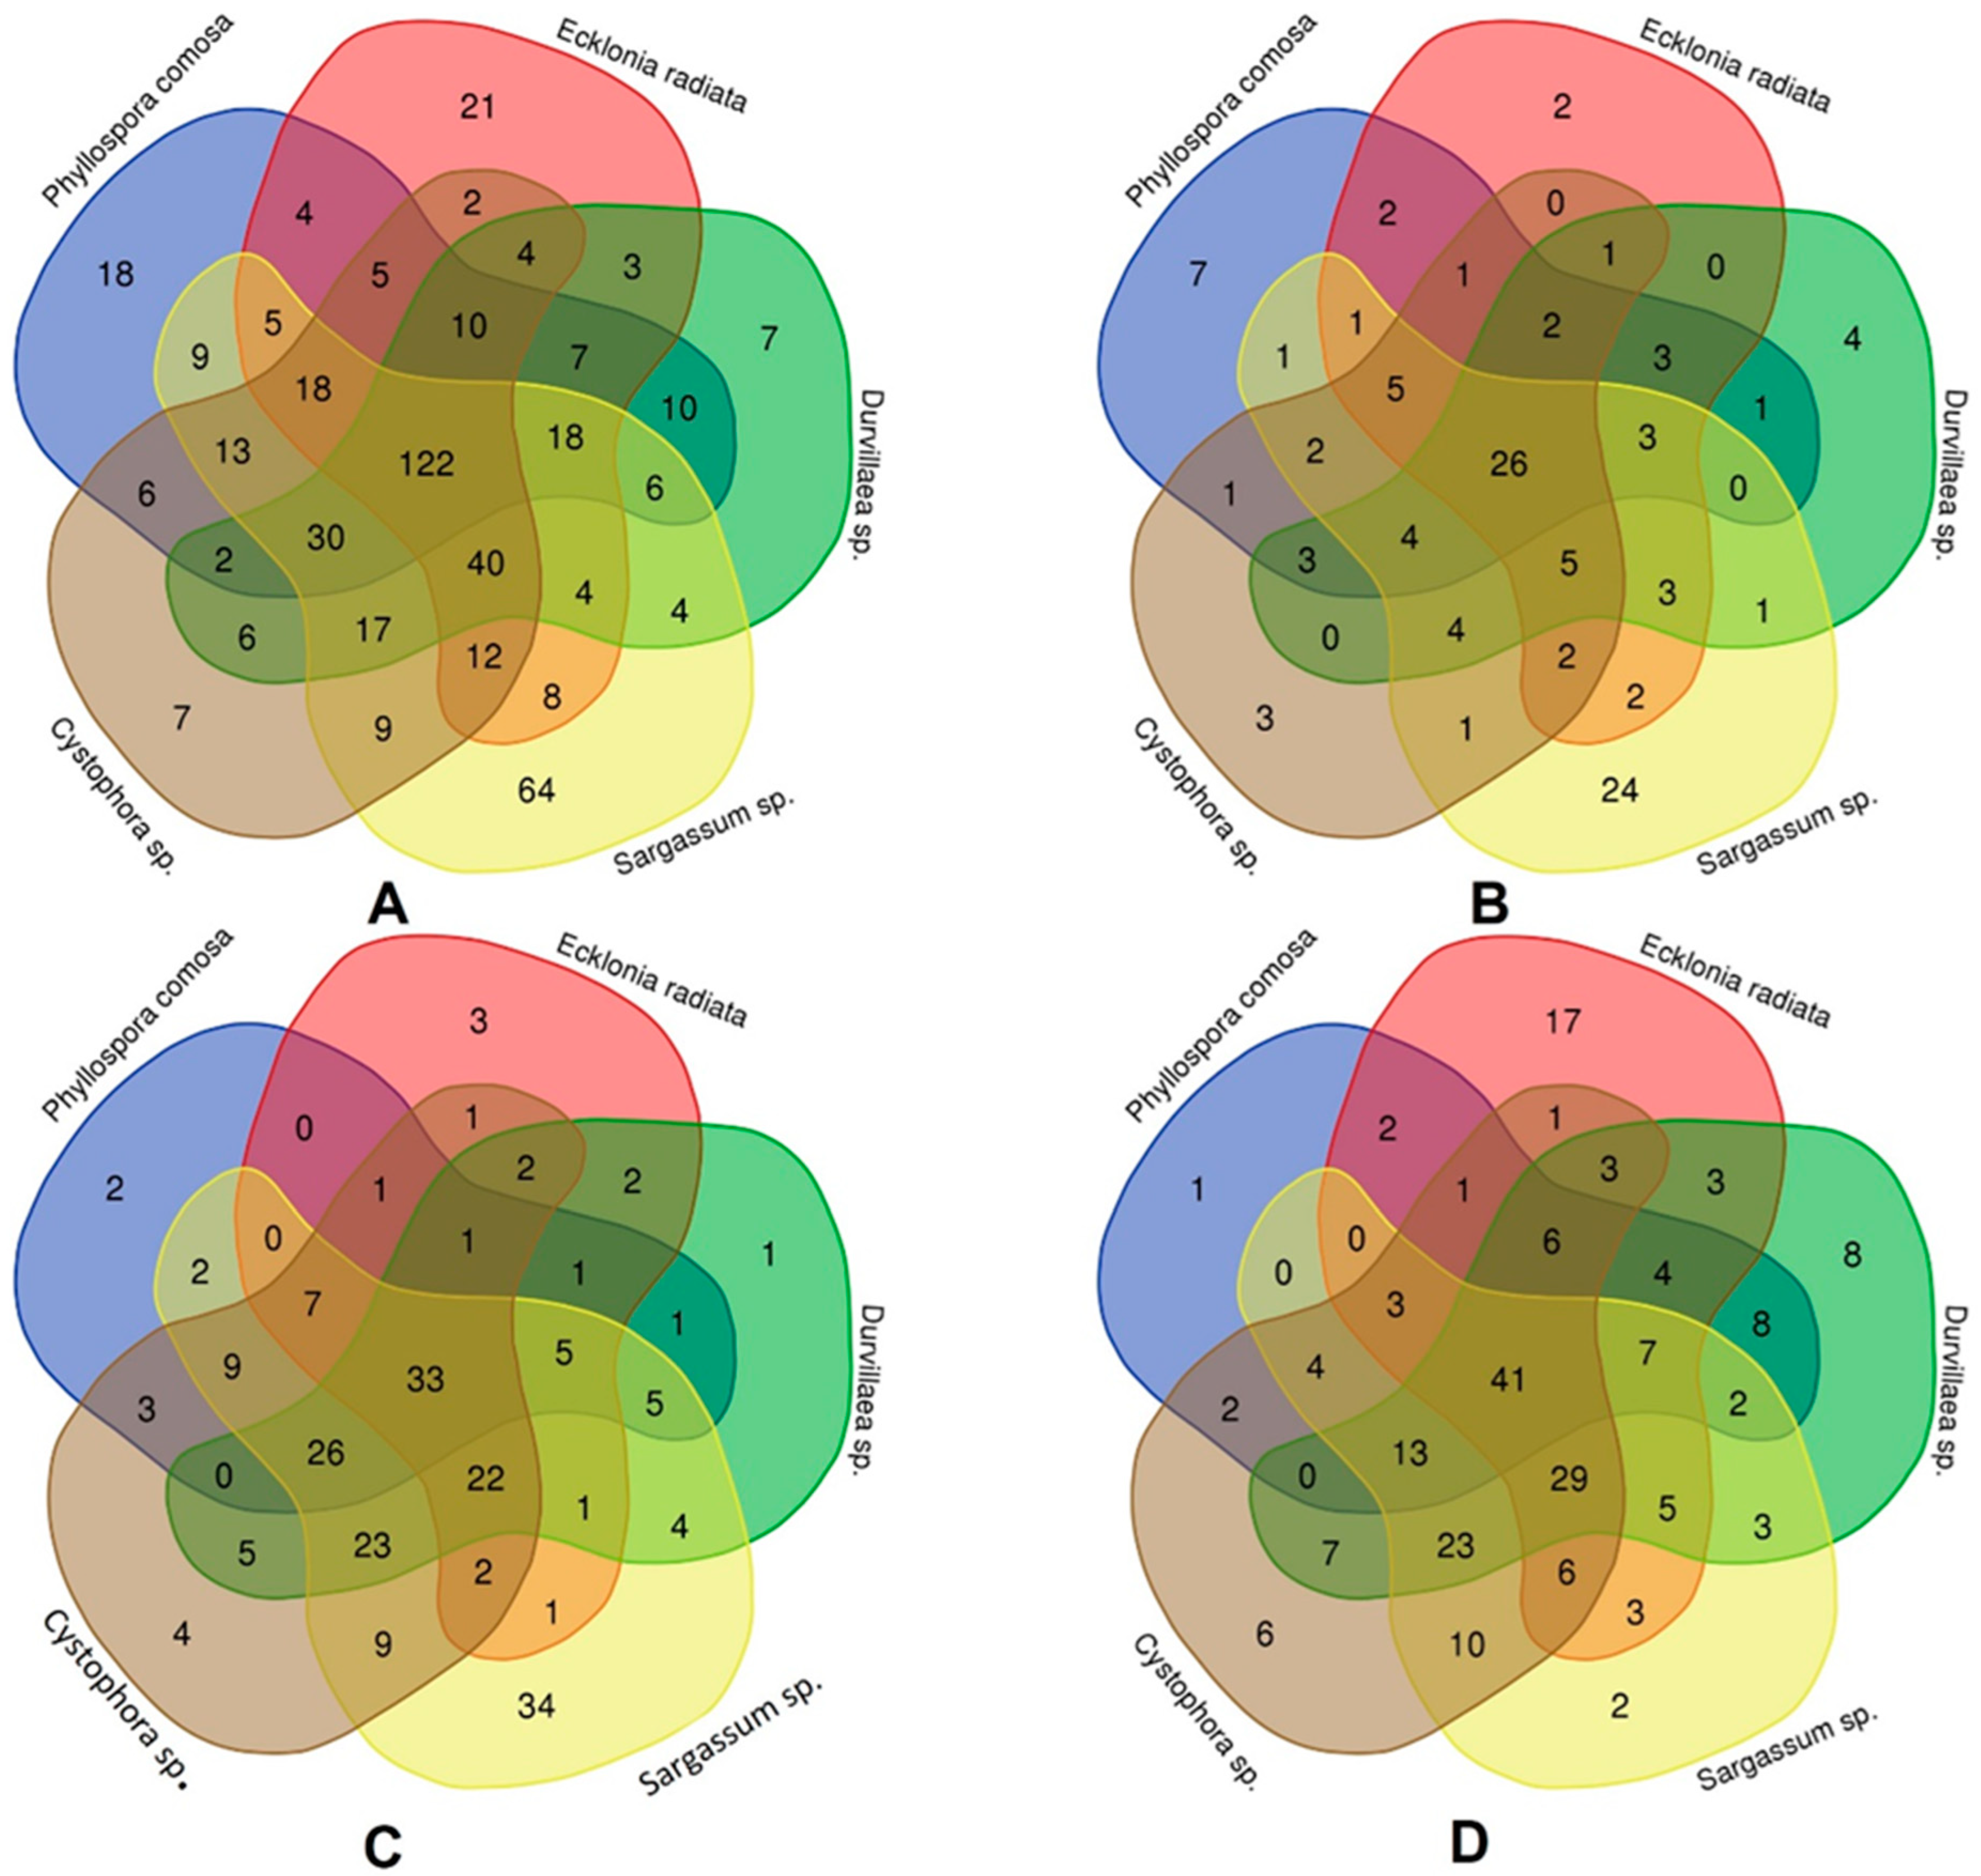
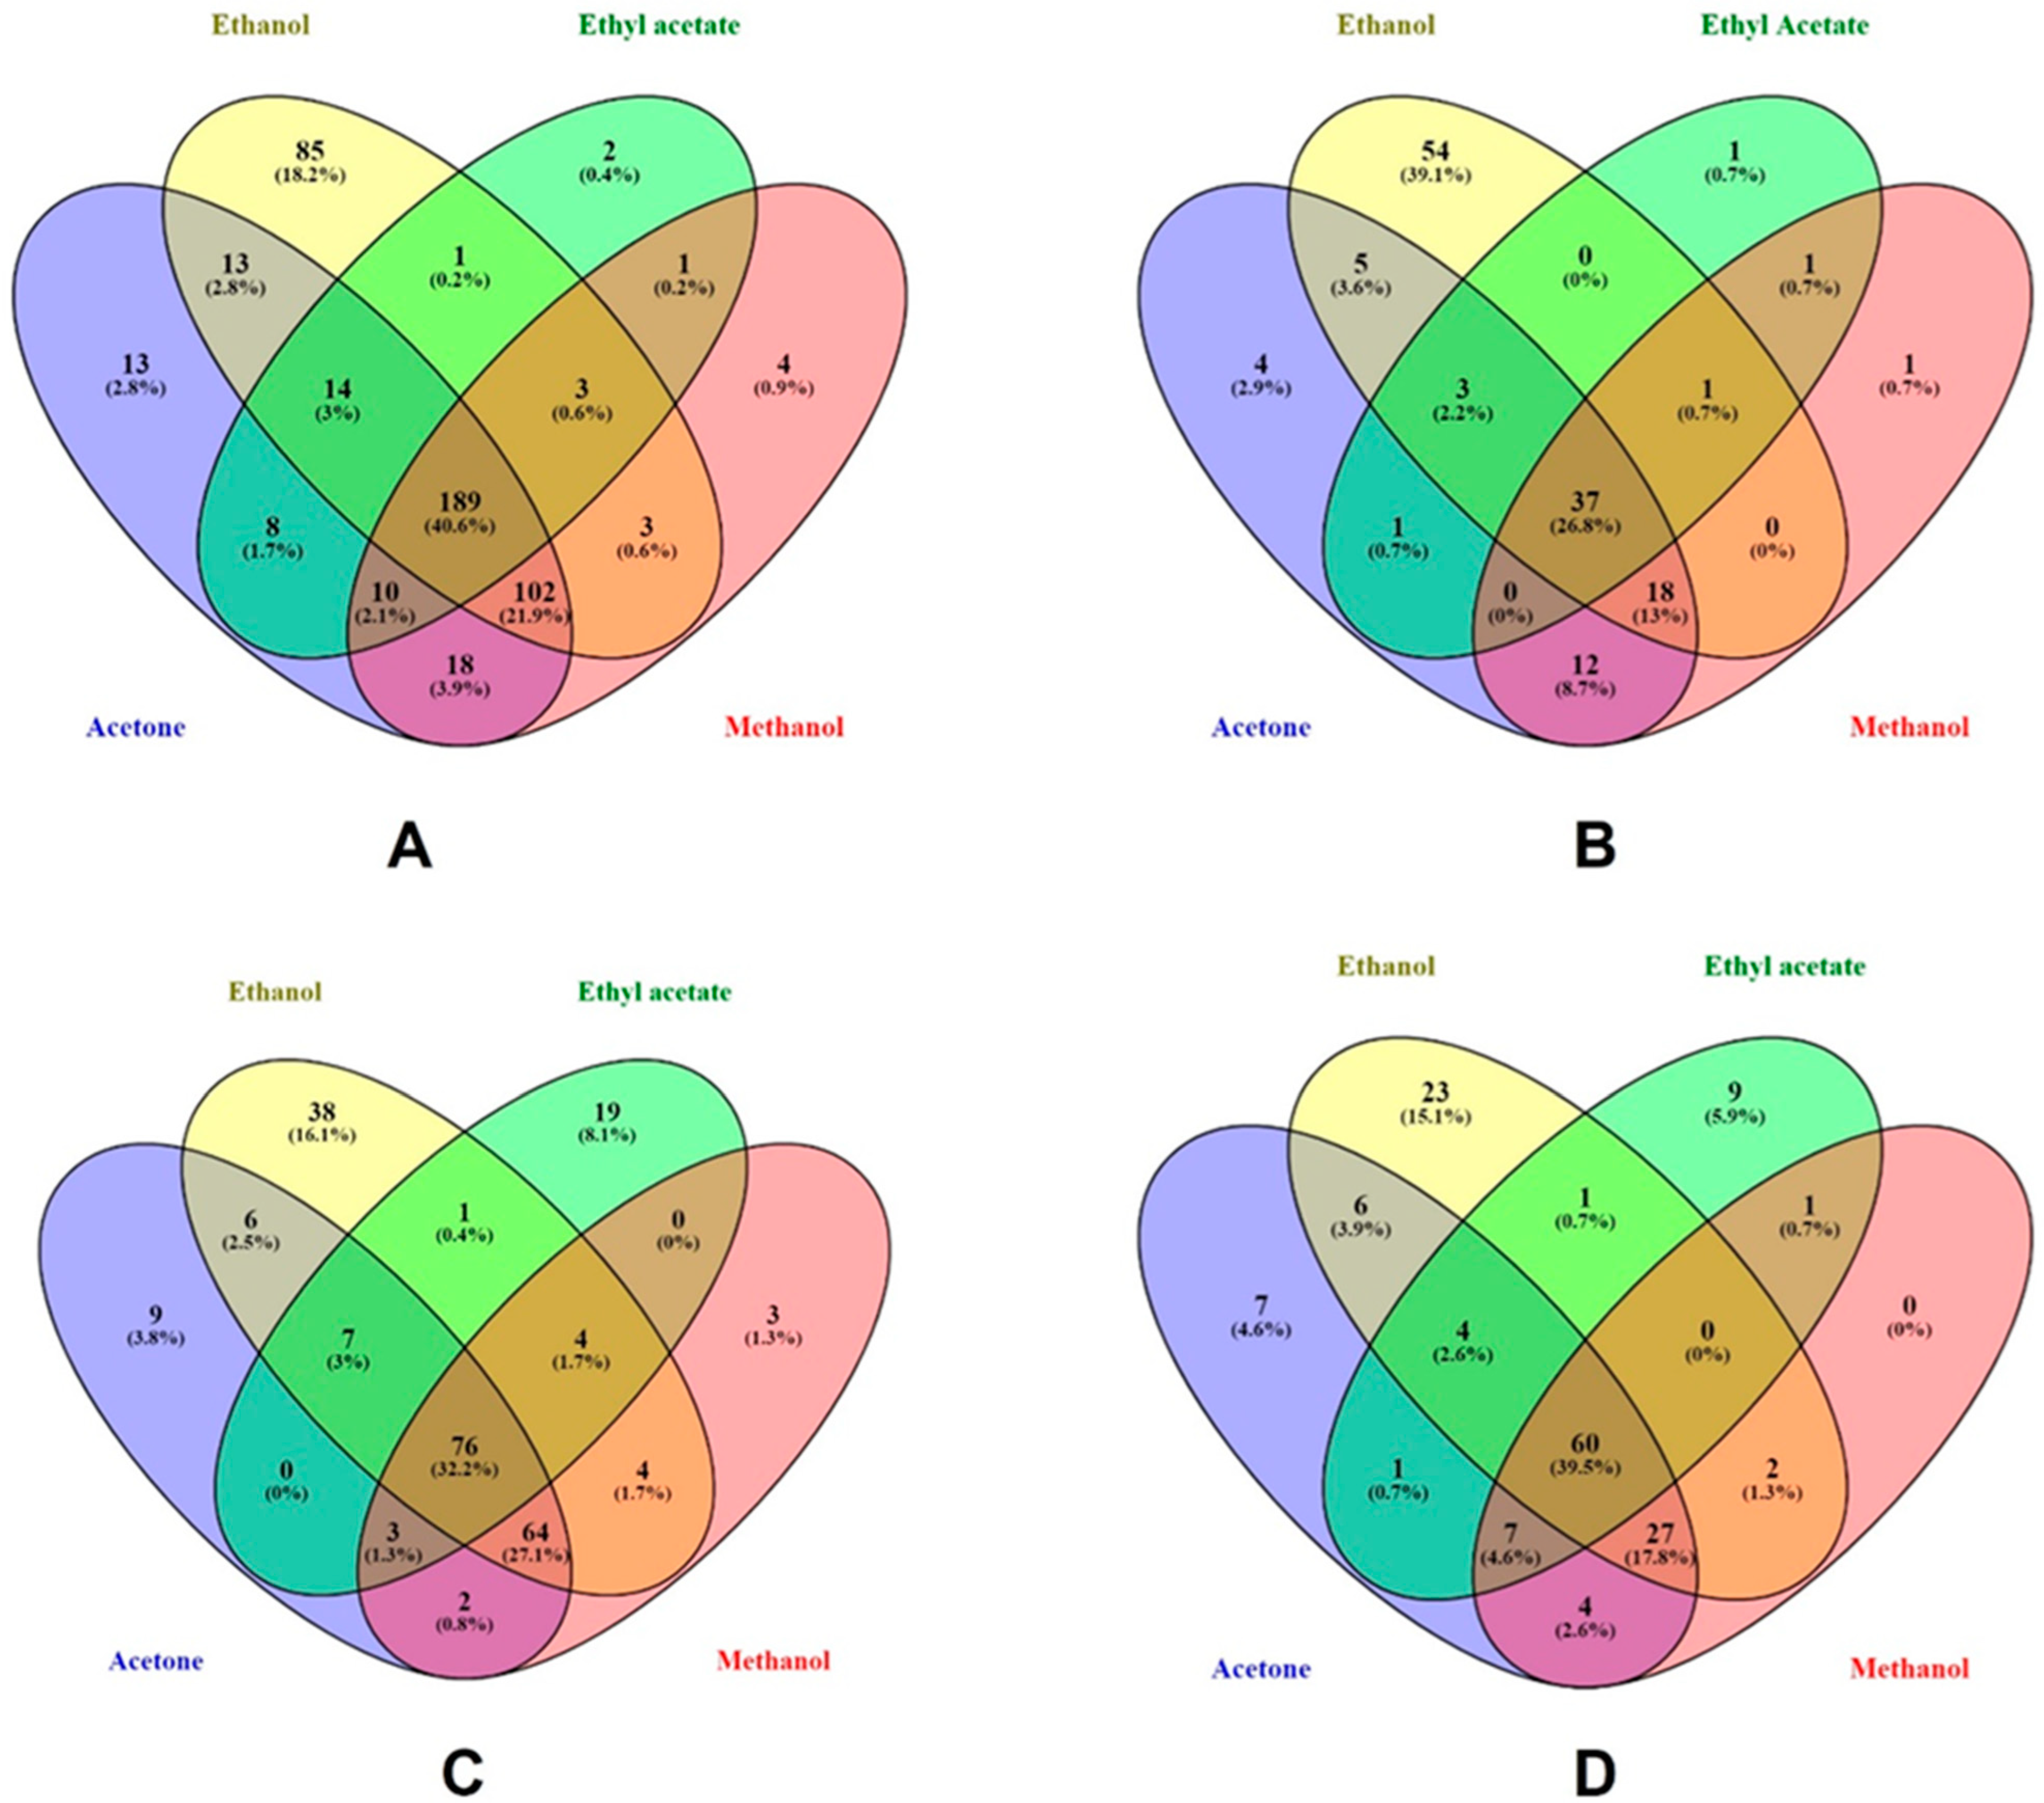
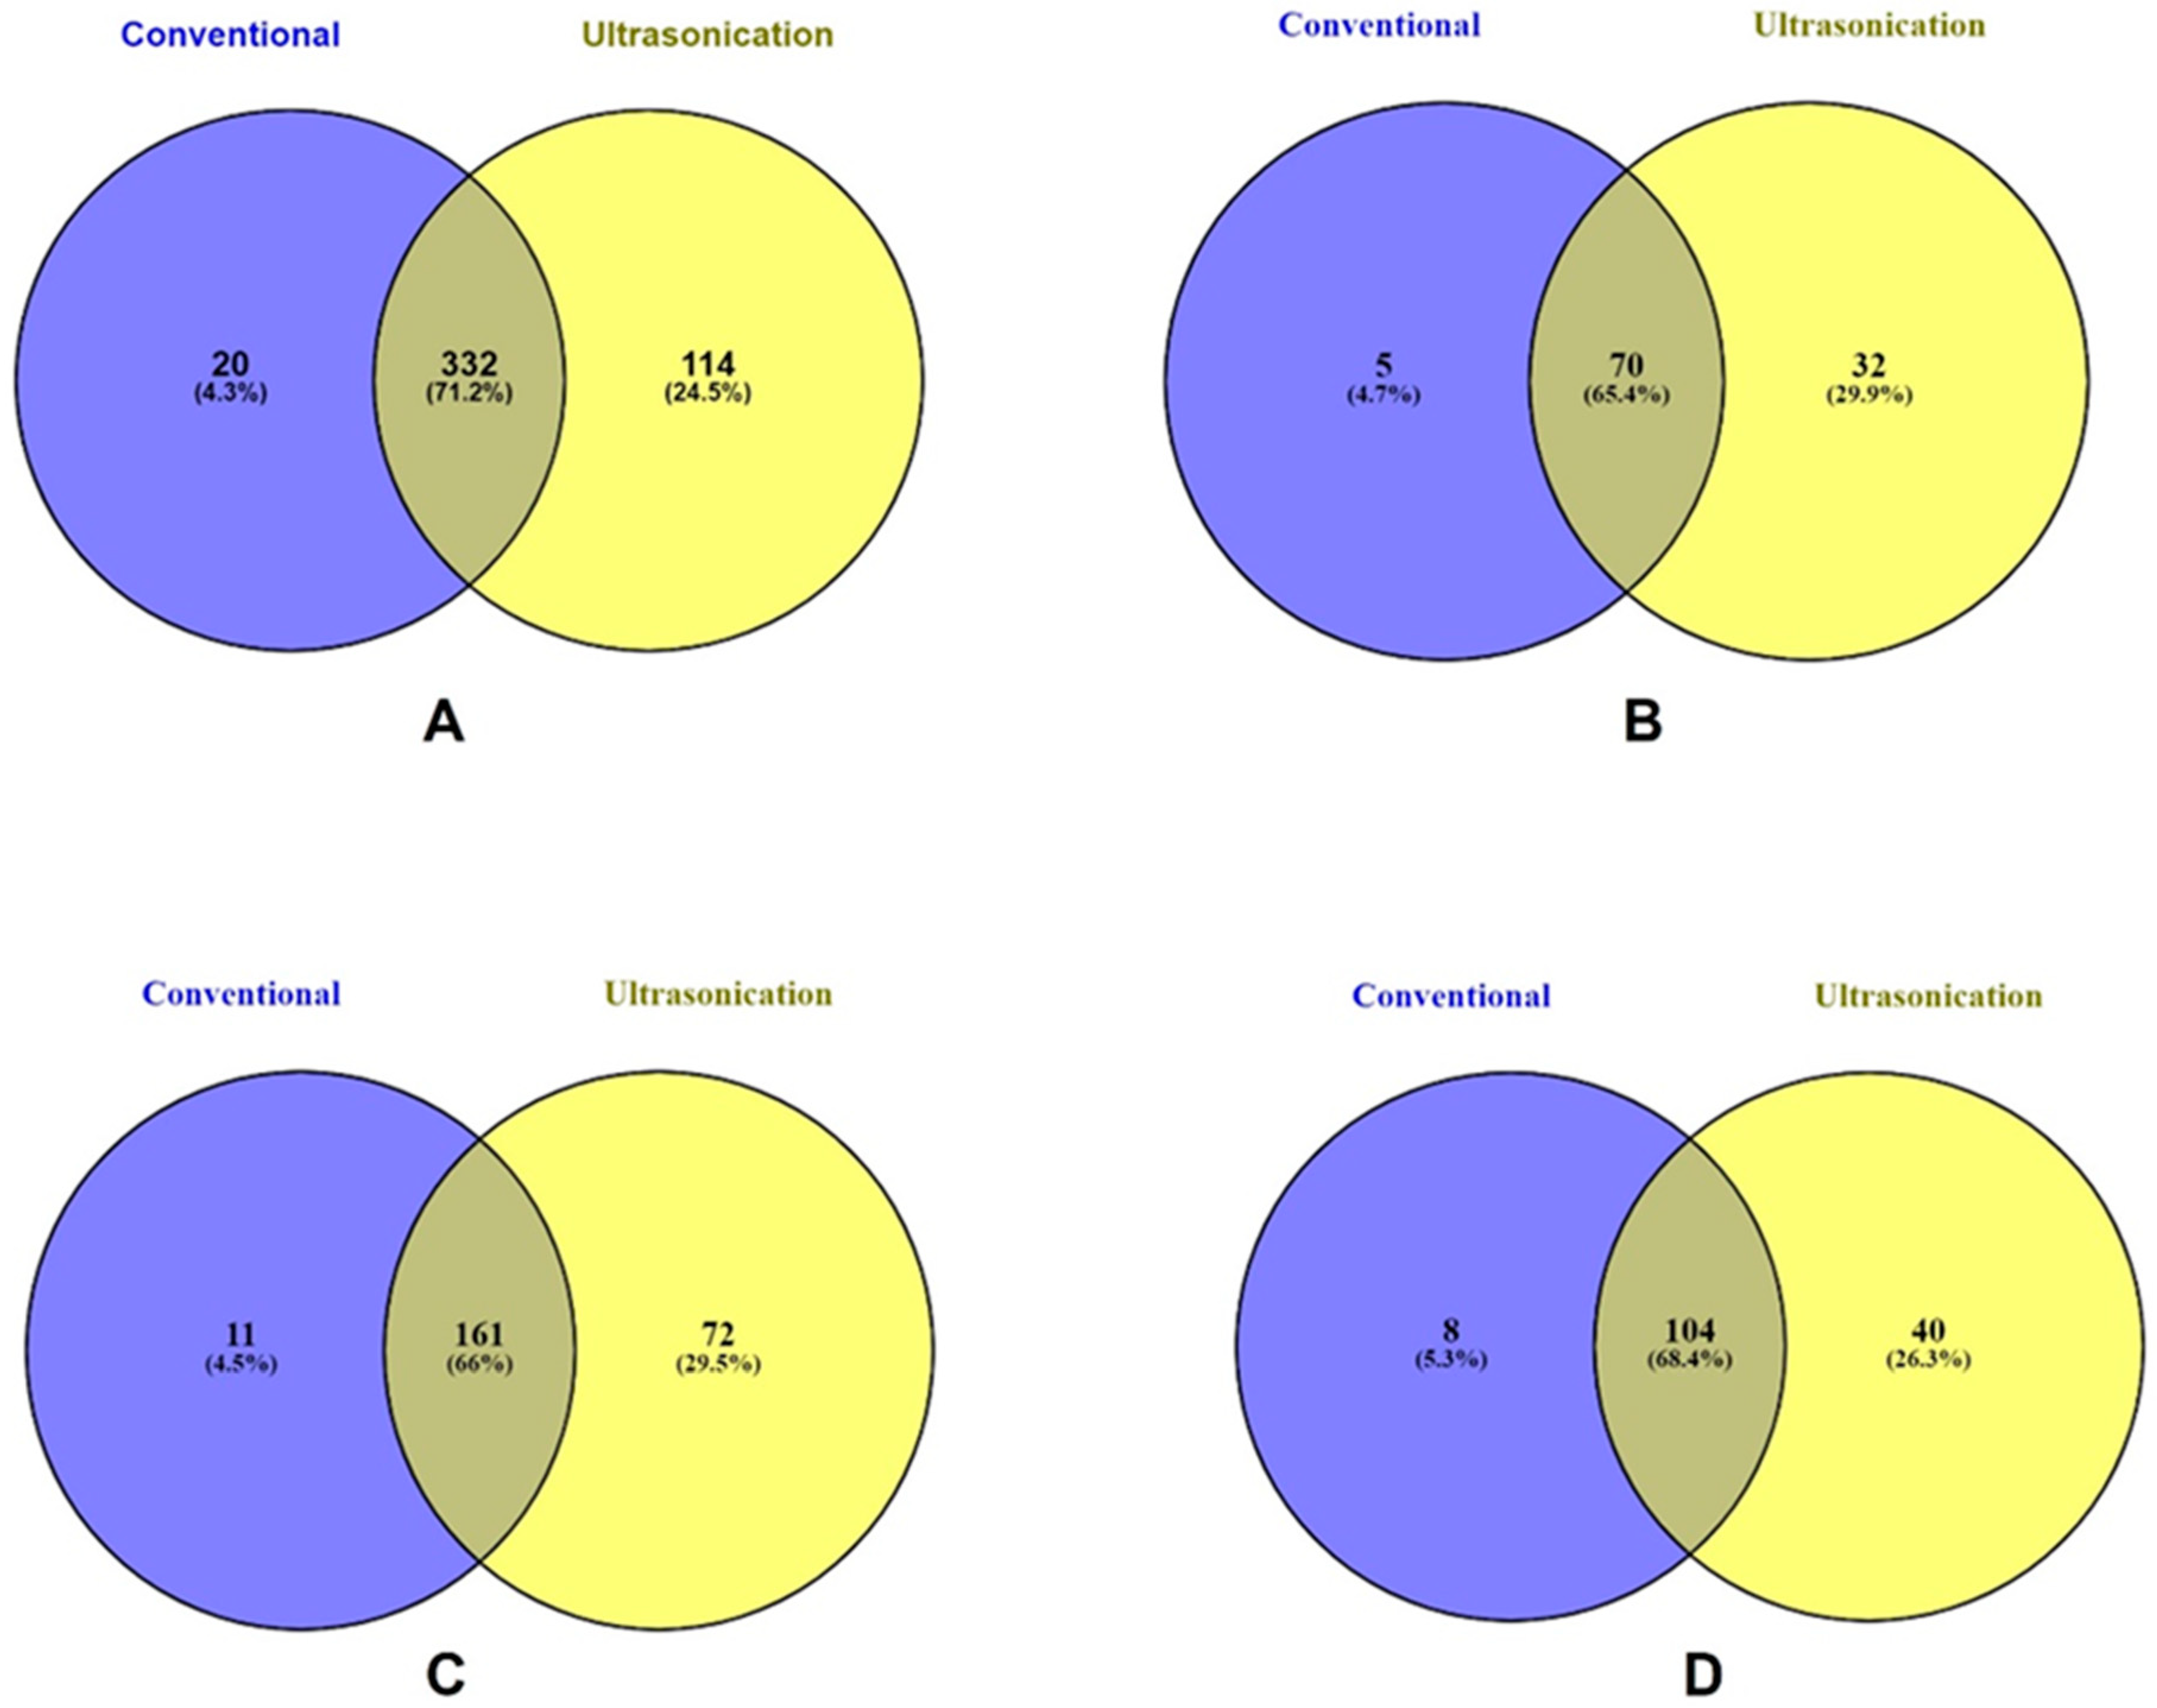
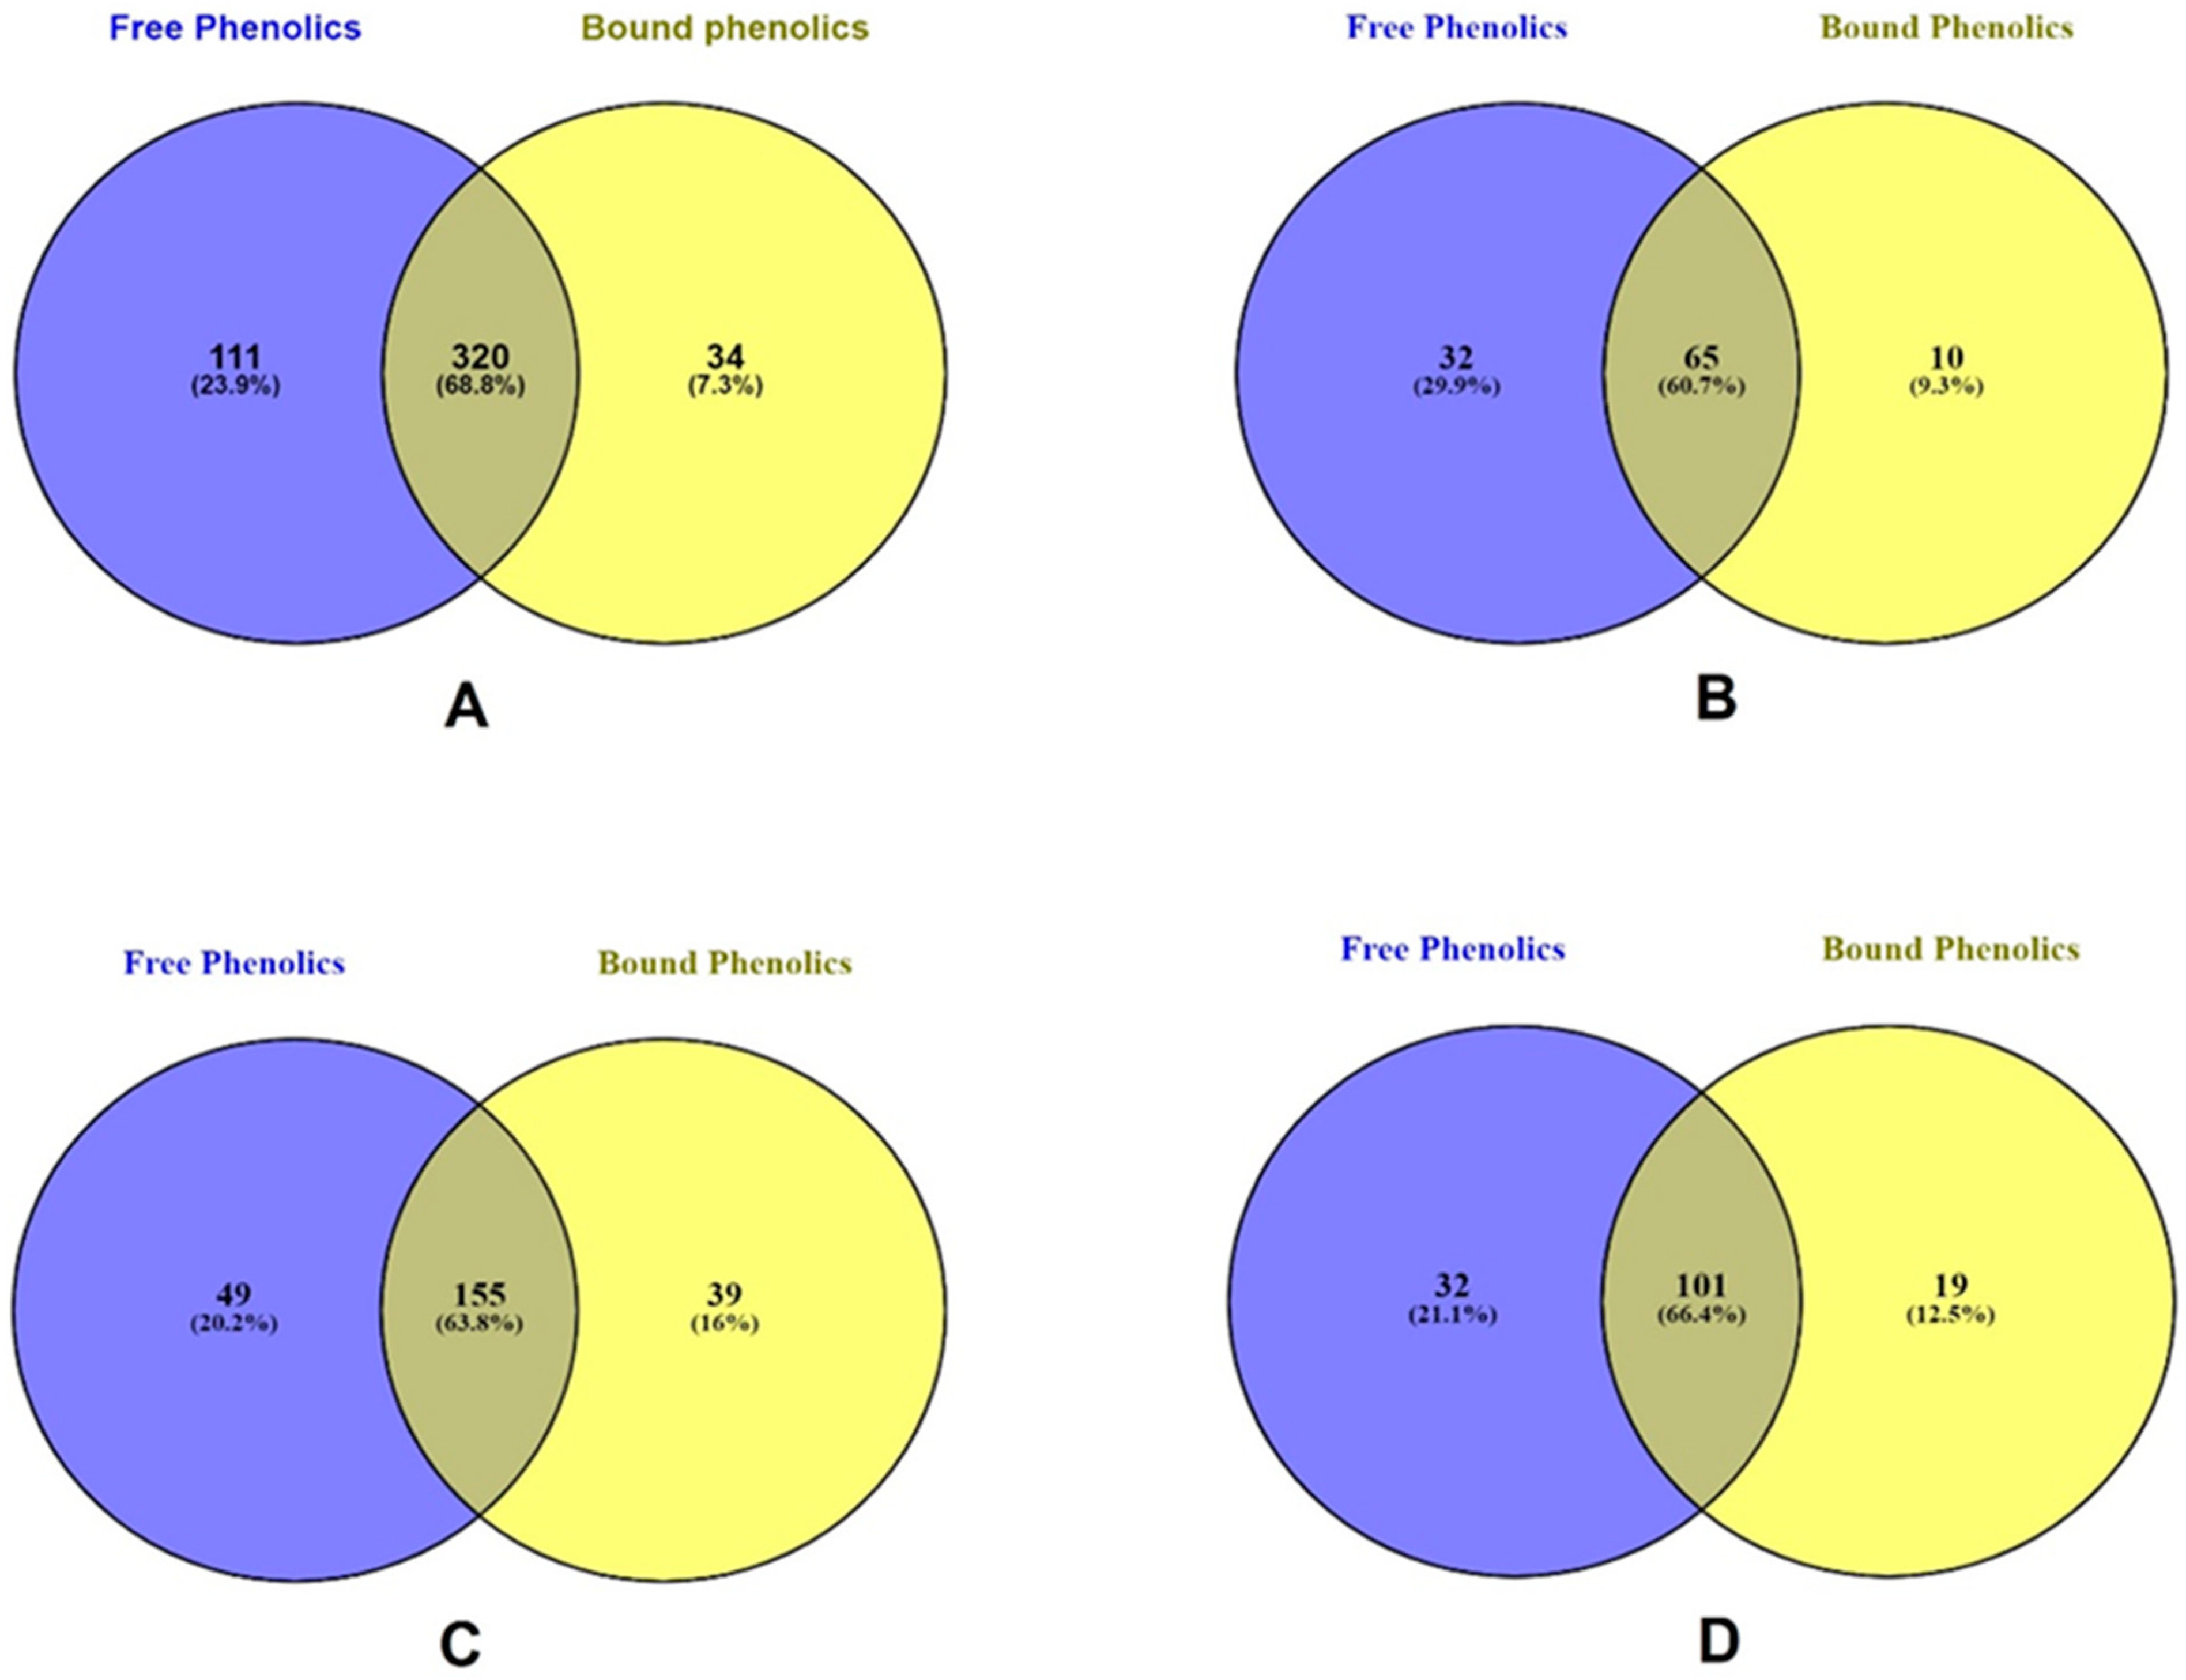
2.4. Distribution of Phenolic Compounds in Seaweeds
2.5. LC-ESI-QTOF-MS/MS Characterization of Phenolic Compounds
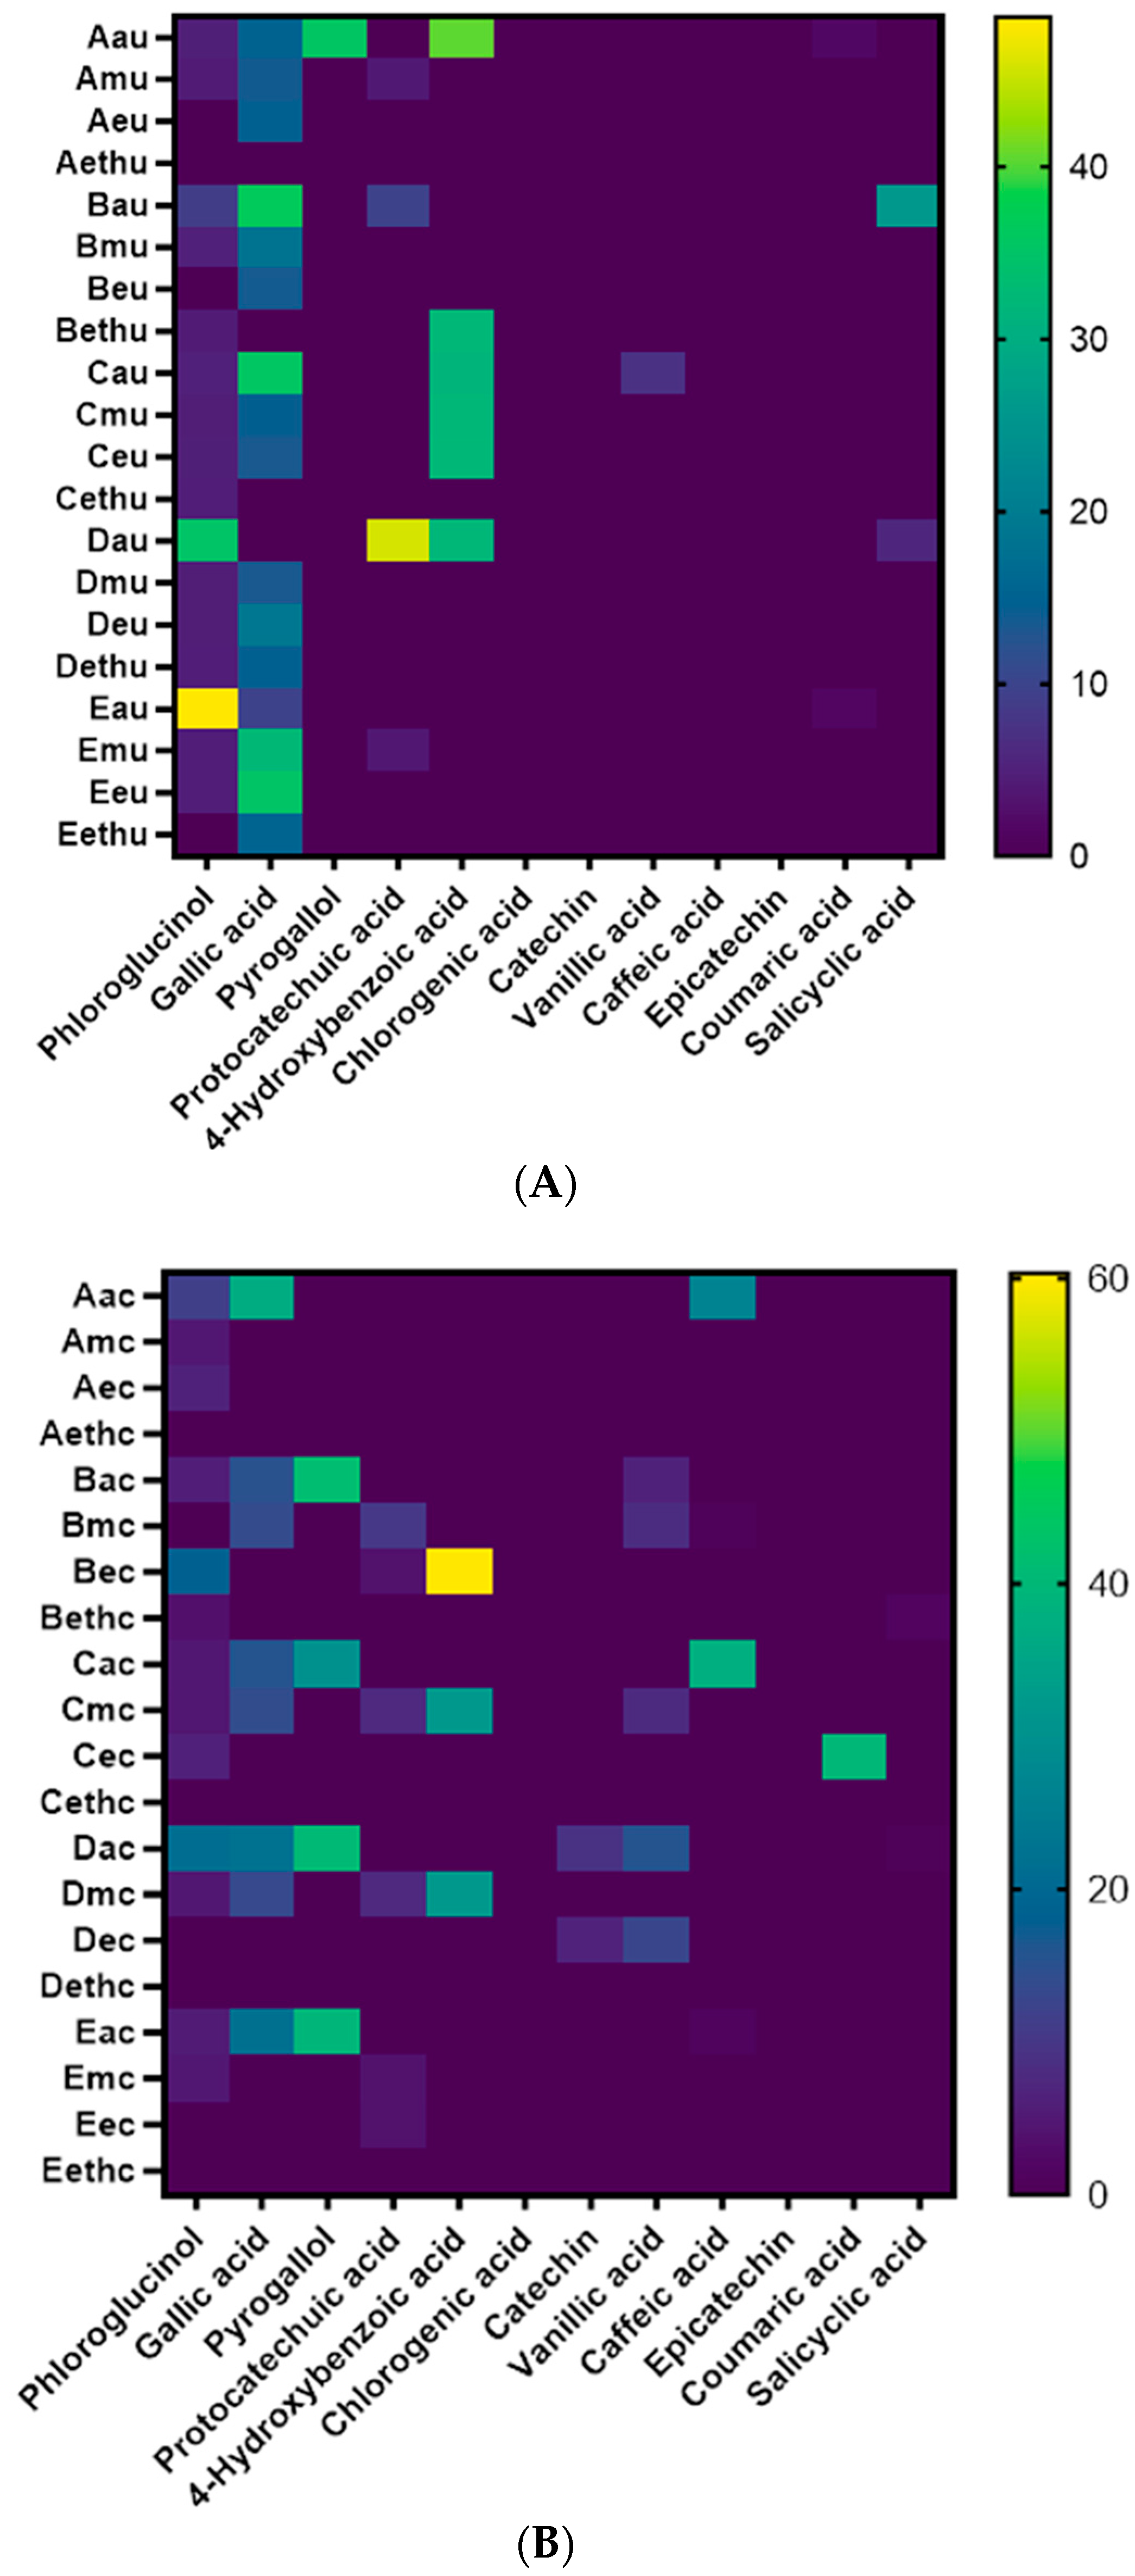
2.6. Heatmap Analysis of Quantified Phenolics in Seaweeds
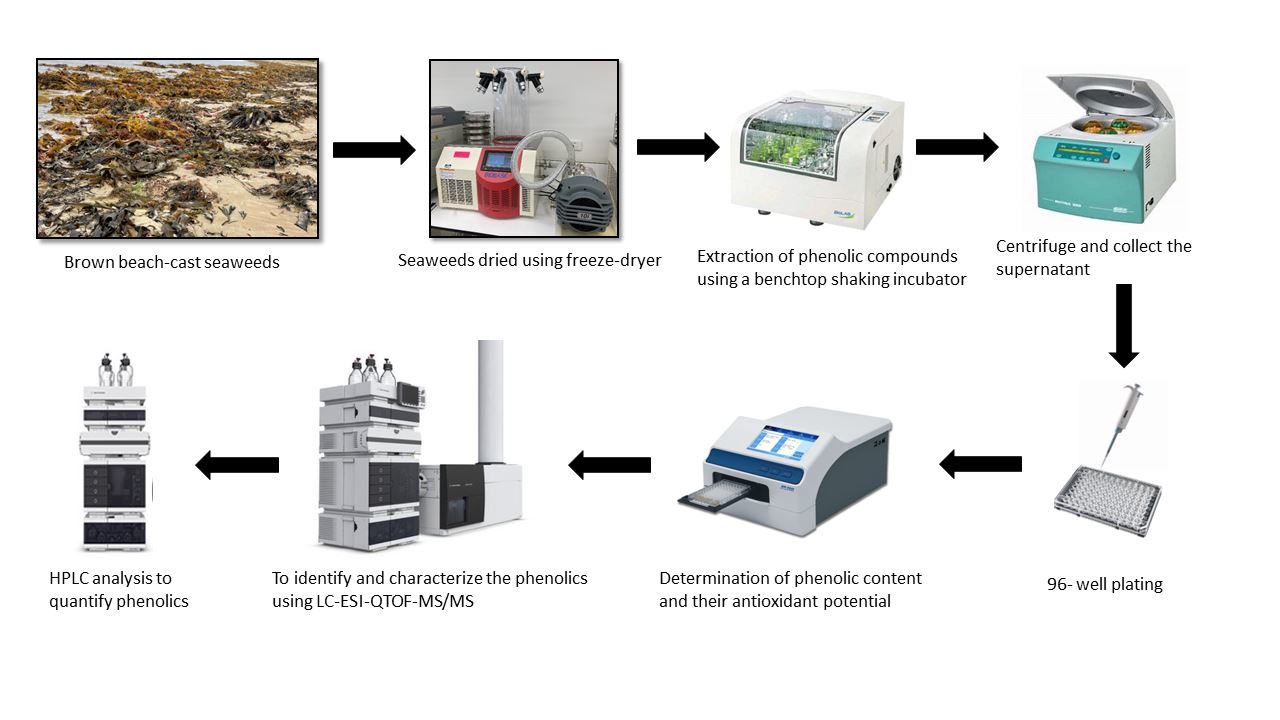
3. Materials and Methods
3.1. Chemicals
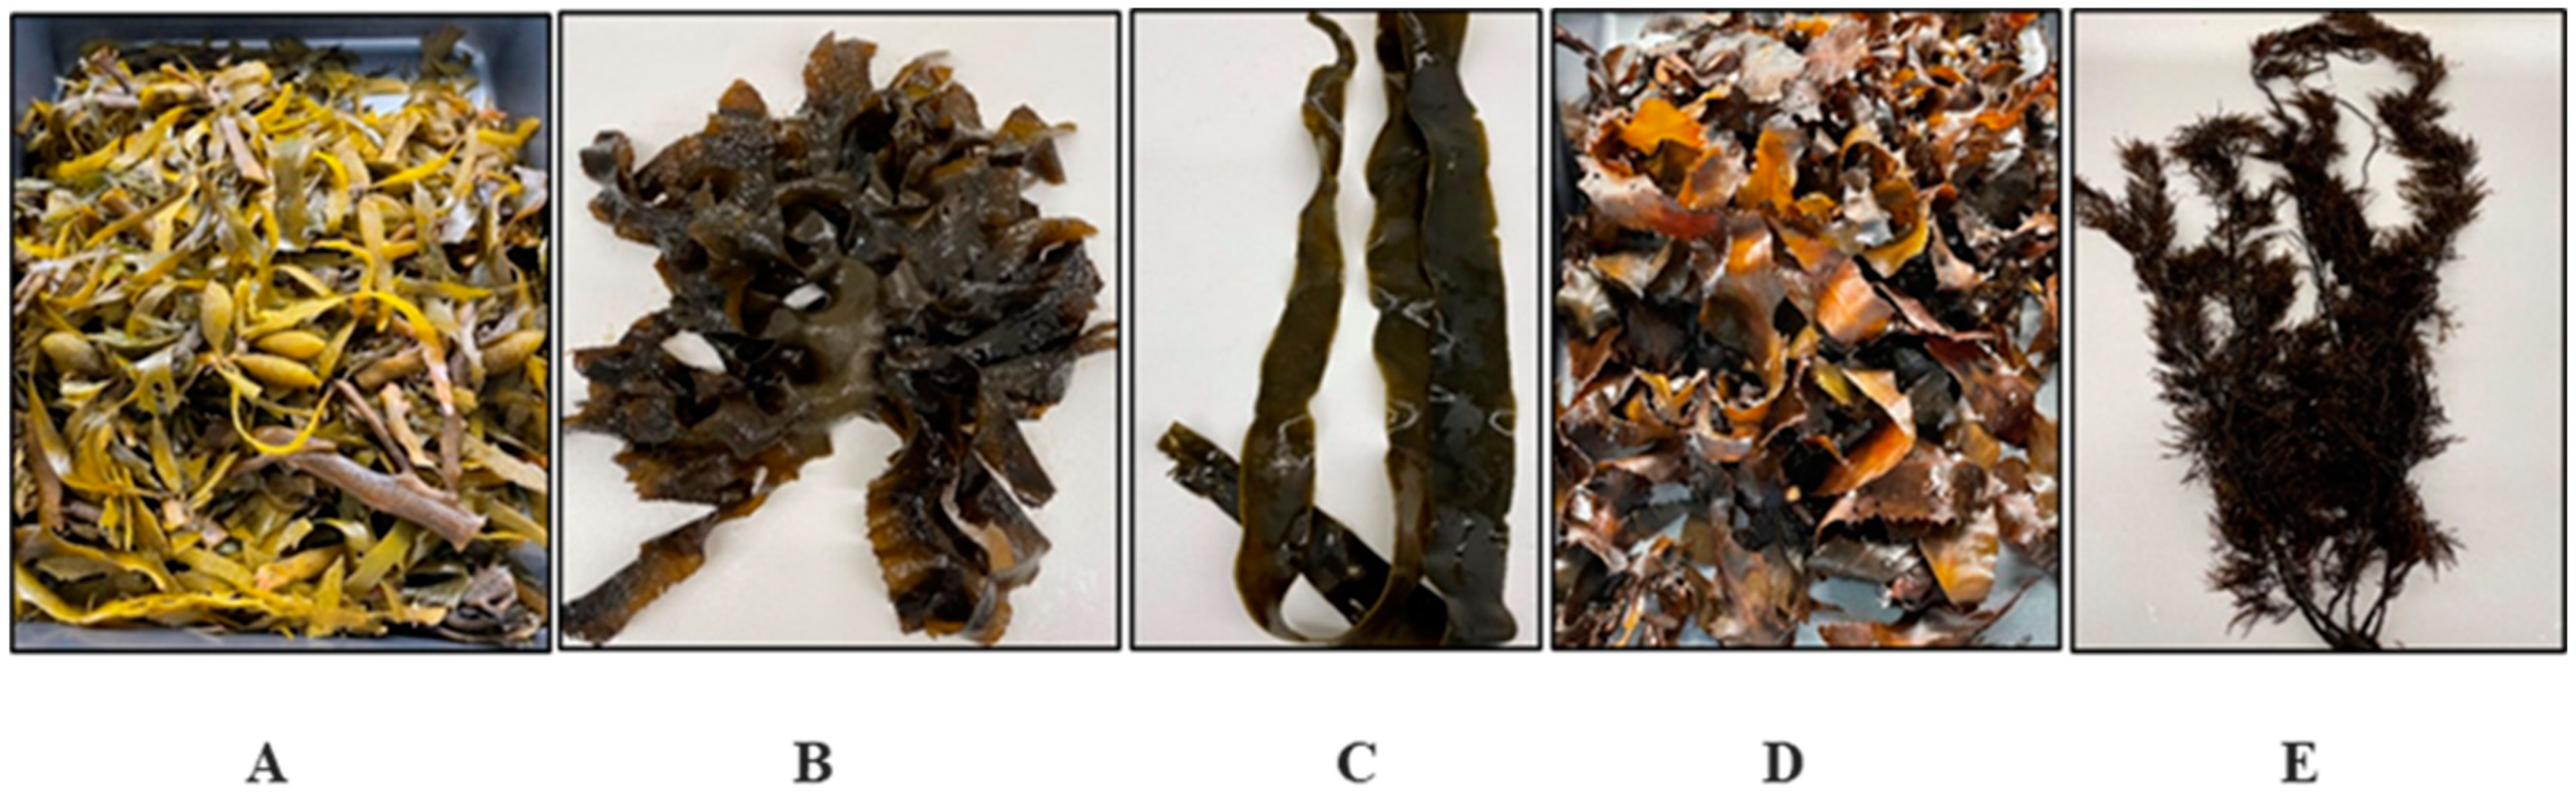
3.2. Seaweed Collection and Identification of Seaweed Samples
3.3. Sample Preparation
3.4. Extraction Preparation
3.4.1. Free Phenolics Extraction
3.4.2. Bound Phenolic Extraction
3.5. Estimation of Phenolic and Antioxidant Assays
3.5.1. Estimation of Total Phenolic Compound
3.5.2. Determination of Total Flavonoid Compounds (TFC)
3.5.3. Determination of Total Tannin Content (TTC)
3.5.4. 2,4-Dimethoxybenzaldehyde Assay (DMBA)
3.5.5. Prussian Blue Assay (PBA)
3.5.6. Folin–Denis Assay (FDA)
3.5.7. 2,2′-Diphenyl-1-Picrylhydrazyl (DPPH) Assay
3.5.8. Ferric Reducing Antioxidant Power (FRAP) Assay
3.5.9. 2,2′-Azino-Bis-3-Ethylbenzothiazoline-6-Sulfonic Acid (ABTS) Assay
3.5.10. Estimation of Hydroxyl Radical Scavenging Activity (OH-RSA)
3.5.11. Estimation of Ferrous Ion Chelating Activity (FICA)
3.5.12. Estimation of Reducing Power (RPA)
3.5.13. Total Antioxidant Capacity (TAC)
3.6. Characterization of Phenolic Compounds by LC-ESI-QTOF-MS/MS Analysis
3.7. HPLC-PDA Analysis
3.8. Statistical Analysis
4. Conclusions
Supplementary Materials
Author Contributions
Funding
Institutional Review Board Statement
Informed Consent Statement
Data Availability Statement
Acknowledgments
Conflicts of Interest
Abbreviations
References
- Palmieri, N.; Forleo, M.B. The potential of edible seaweed within the western diet. A segmentation of italian consumers. Int. J. Gastron. Food Sci. 2020, 20, 100202. [Google Scholar] [CrossRef]
- Pereira, L. A Review of the Nutrient Composition of Selected Edible Seaweeds; Nova Science Publishers, Inc.: Hauppauge, NY, USA, 2011; Volume 7, pp. 15–47. [Google Scholar]
- Rajapakse, N.; Kim, S.K. Nutritional and digestive health benefits of seaweed. Adv. Food Nutr. Res. 2011, 64, 17–28. [Google Scholar] [PubMed]
- Al Jitan, S.; Alkhoori, S.A.; Yousef, L.F. Chapter 13—Phenolic acids from plants: Extraction and application to human health. In Studies in Natural Products Chemistry; Atta-ur, R., Ed.; Elsevier: Amsterdam, The Netherlands, 2018; Volume 58, pp. 389–417. [Google Scholar]
- Cotas, J.; Pacheco, D.; Gonçalves, A.M.M.; Silva, P.; Carvalho, L.G.; Pereira, L. Seaweeds’ nutraceutical and biomedical potential in cancer therapy: A concise review. J. Cancer Metastasis Treat. 2021, 2021, 13. [Google Scholar] [CrossRef]
- Harb, T.B.; Chow, F. An overview of beach-cast seaweeds: Potential and opportunities for the valorization of underused waste biomass. Algal Res. 2022, 62, 102643. [Google Scholar] [CrossRef]
- Chan, J.C.C.; Cheung, P.C.K.; Ang, P.O. Comparative studies on the effect of three drying methods on the nutritional composition of seaweed Sargassum hemiphyllum (turn.) c. Ag. J. Agric. Food Chem. 1997, 45, 3056–3059. [Google Scholar] [CrossRef]
- Ciurzyńska, A.; Lenart, A. Freeze-drying—Application in food processing and biotechnology—A review. Pol. J. Food Nutr. Sci. 2011, 61, 165–171. [Google Scholar] [CrossRef]
- Cruces, E.; Rojas-Lillo, Y.; Ramirez-Kushel, E.; Atala, E.; López-Alarcón, C.; Lissi, E.; Gómez, I. Comparison of different techniques for the preservation and extraction of phlorotannins in the kelp Lessonia spicata (phaeophyceae): Assays of dpph, orac-pgr, and orac-fl as testing methods. J. Appl. Phycol. 2015, 28, 573–580. [Google Scholar] [CrossRef]
- Turkmen, N.; Sari, F.; Velioglu, Y.S. Effects of extraction solvents on concentration and antioxidant activity of black and black mate tea polyphenols determined by ferrous tartrate and folin–ciocalteu methods. Food Chem. 2006, 99, 835–841. [Google Scholar] [CrossRef]
- Yingngam, B.; Monschein, M.; Brantner, A. Ultrasound-assisted extraction of phenolic compounds from Cratoxylum formosum ssp. Formosum leaves using central composite design and evaluation of its protective ability against H2O2-induced cell death. Asian Pac. J. Trop. Med. 2014, 7S1, S497–S505. [Google Scholar] [CrossRef]
- Rostagno, M.A.; Prado, J.M. Natural Product Extraction: Principles and Applications; Royal Society of Chemistry: London, UK, 2013. [Google Scholar]
- Rodrigues, D.; Sousa, S.; Silva, A.; Amorim, M.; Pereira, L.; Rocha-Santos, T.A.; Gomes, A.M.; Duarte, A.C.; Freitas, A.C. Impact of enzyme- and ultrasound-assisted extraction methods on biological properties of red, brown, and green seaweeds from the central west coast of portugal. J. Agric. Food Chem. 2015, 63, 3177–3188. [Google Scholar] [CrossRef]
- Kadam, S.U.; Tiwari, B.K.; O’Donnell, C.P. Effect of ultrasound pre-treatment on the drying kinetics of brown seaweed Ascophyllum nodosum. Ultrason. Sonochem. 2015, 23, 302–307. [Google Scholar] [CrossRef] [PubMed]
- Hassan, I.H.; Pham, H.N.T.; Nguyen, T.H. Optimization of ultrasound-assisted extraction conditions for phenolics, antioxidant, and tyrosinase inhibitory activities of vietnamese brown seaweed (Padina australis). J. Food Process. Preserv. 2021, 45, e15386. [Google Scholar] [CrossRef]
- Ummat, V.; Tiwari, B.K.; Jaiswal, A.K.; Condon, K.; Garcia-Vaquero, M.; O’Doherty, J.; O’Donnell, C.; Rajauria, G. Optimisation of ultrasound frequency, extraction time and solvent for the recovery of polyphenols, phlorotannins and associated antioxidant activity from brown seaweeds. Mar. Drugs 2020, 18, 250. [Google Scholar] [CrossRef] [PubMed]
- Alothman, M.; Bhat, R.; Karim, A.A. Antioxidant capacity and phenolic content of selected tropical fruits from malaysia, extracted with different solvents. Food Chem. 2009, 115, 785–788. [Google Scholar] [CrossRef]
- Farrés-Cebrián, M.; Seró, R.; Saurina, J.; Núñez, O. Hplc-uv polyphenolic profiles in the classification of olive oils and other vegetable oils via principal component analysis. Separations 2016, 3, 33. [Google Scholar] [CrossRef]
- Alam, M.N.; Bristi, N.J.; Rafiquzzaman, M. Review on in vivo and in vitro methods evaluation of antioxidant activity. Saudi Pharm. J. 2013, 21, 143–152. [Google Scholar] [CrossRef]
- Zhong, B.; Robinson, N.A.; Warner, R.D.; Barrow, C.J.; Dunshea, F.R.; Suleria, H.A. Lc-esi-qtof-ms/ms characterization of seaweed phenolics and their antioxidant potential. Mar. Drugs 2020, 18, 331. [Google Scholar] [CrossRef]
- Salar, R.K.; Purewal, S.S.; Sandhu, K.S. Relationships between DNA damage protection activity, total phenolic content, condensed tannin content and antioxidant potential among indian barley cultivars. Biocatal. Agric. Biotechnol. 2017, 11, 201–206. [Google Scholar] [CrossRef]
- Song, K.-M.; Ha, S.J.; Lee, J.-E.; Kim, S.-H.; Kim, Y.H.; Kim, Y.; Hong, S.P.; Jung, S.K.; Lee, N.H. High yield ultrasonication extraction method for Undaria pinnatifida sporophyll and its anti-inflammatory properties associated with ap-1 pathway suppression. LWT—Food Sci. Technol. 2015, 64, 1315–1322. [Google Scholar] [CrossRef]
- Magnusson, M.; Yuen, A.K.; Zhang, R.; Wright, J.T.; Taylor, R.B.; Maschmeyer, T.; de Nys, R. A comparative assessment of microwave assisted (mae) and conventional solid-liquid (sle) techniques for the extraction of phloroglucinol from brown seaweed. Algal Res. 2017, 23, 28–36. [Google Scholar] [CrossRef]
- Dang, T.T.; Bowyer, M.C.; Van Altena, I.A.; Scarlett, C. Comparison of chemical profile and antioxidant properties of the brown algae. Int. J. Food Sci. Technol. 2018, 53, 174–181. [Google Scholar] [CrossRef]
- Subbiah, V.; Xie, C.D.; Dunshea, F.R.; Barrow, C.J.; Suleria, H.A.R. The quest for phenolic compounds from seaweed: Nutrition, biological activities and applications. Food Rev. Int. 2022, 1–28. [Google Scholar] [CrossRef]
- Al-Matani, S.K.; Al-Wahaibi, R.N.S.; Hossain, M.A. Total flavonoids content and antimicrobial activity of crude extract from leaves of Ficus sycomorus native to sultanate of oman. Karbala Int. J. Mod. Sci. 2015, 1, 166–171. [Google Scholar] [CrossRef]
- Yusoff, I.M.; Mat Taher, Z.; Rahmat, Z.; Chua, L.S. A review of ultrasound-assisted extraction for plant bioactive compounds: Phenolics, flavonoids, thymols, saponins and proteins. Food Res. Int. 2022, 157, 111268. [Google Scholar] [CrossRef]
- Sobuj, M.K.A.; Islam, M.; Haque, M.; Alam, M.; Rafiquzzaman, S.M. Evaluation of bioactive chemical composition, phenolic, and antioxidant profiling of different crude extracts of Sargassum coriifolium and Hypnea pannosa seaweeds. J. Food Meas. Charact. 2021, 15, 1653–1665. [Google Scholar] [CrossRef]
- Fanali, C.; Tripodo, G.; Russo, M.; Della Posta, S.; Pasqualetti, V.; De Gara, L. Effect of solvent on the extraction of phenolic compounds and antioxidant capacity of hazelnut kernel. Electrophoresis 2018, 39, 1683–1691. [Google Scholar] [CrossRef]
- Ford, L.; Theodoridou, K.; Sheldrake, G.N.; Walsh, P.J. A critical review of analytical methods used for the chemical characterisation and quantification of phlorotannin compounds in brown seaweeds. Phytochem. Anal. 2019, 30, 587–599. [Google Scholar] [CrossRef]
- Fogliano, V.; Verde, V.; Randazzo, G.; Ritieni, A. Method for measuring antioxidant activity and its application to monitoring the antioxidant capacity of wines. J. Agric. Food Chem. 1999, 47, 1035–1040. [Google Scholar] [CrossRef]
- Lutz, M.; Hernández, J.; Henríquez, C. Phenolic content and antioxidant capacity in fresh and dry fruits and vegetables grown in chile. CyTA—J. Food 2015, 13, 541–547. [Google Scholar]
- Tapia-Salazar, M.; Arévalo-Rivera, I.G.; Maldonado-Muñiz, M.; Garcia-Amezquita, L.E.; Nieto-López, M.G.; Ricque-Marie, D.; Cruz-Suárez, L.E.; Welti-Chanes, J. The dietary fiber profile, total polyphenol content, functionality of silvetia compressa and ecklonia arborea, and modifications induced by high hydrostatic pressure treatments. Food Bioprocess. Technol. 2019, 12, 512–523. [Google Scholar] [CrossRef]
- Marinova, G.; Batchvarov, V. Evaluation of the methods for determination of the free radical scavenging activity by dpph. Bulg. J. Agric. Sci. 2011, 17, 11–24. [Google Scholar]
- Seo, Y.-W.; Park, K.-E.; Nam, T.-J. Isolation of a new chromene from the brown alga Sargassum thunbergii. Bull. Korean Chem. Soc. 2007, 28, 1831–1833. [Google Scholar]
- Arrieta, M.P.; López de Dicastillo, C.; Garrido, L.; Roa, K.; Galotto, M.J. Electrospun pva fibers loaded with antioxidant fillers extracted from Durvillaea antarctica algae and their effect on plasticized pla bionanocomposites. Eur. Polym. J. 2018, 103, 145–157. [Google Scholar] [CrossRef]
- Dasgupta, A.; Klein, K. Chapter 2—Methods for measuring oxidative stress in the laboratory. In Antioxidants in Food, Vitamins and Supplements; Dasgupta, A., Klein, K., Eds.; Elsevier: San Diego, CA, USA, 2014; pp. 19–40. [Google Scholar]
- Trkan, K.; Kasim, T.; Bircan, e.; Murat, K. DNA damage protecting activity and in vitro antioxidant potential of the methanol extract of cherry (Prunus avium L.). J. Med. Plants Res. 2014, 8, 715–726. [Google Scholar] [CrossRef]
- Dhingra, N.; Sharma, R.; Kar, A. Evaluation of the antioxidant activities of Prunus domestica whole fruit: An in vitro study. Int. J. Pharm. Pharm. Sci. 2014, 6, 271–276. [Google Scholar]
- Zakaria, N.A.; Ibrahim, D.; Sulaiman, S.F.; Supardy, A. Assessment of antioxidant activity, total phenolic content and in vitro toxicity of malaysian red seaweed, Acanthophora spicifera. J. Chem. Pharm. Res. 2011, 3, 182–191. [Google Scholar]
- Abirami, R.; Kowsalya, S. Quantification and correlation study on derived phenols and antioxidant activity of seaweeds from gulf of mannar. J. Herbs Spices Med. Plants 2017, 23, 9–17. [Google Scholar] [CrossRef]
- Matanjun, P.; Mohamed, S.; Mustapha, N.M.; Muhammad, K.; Ming, C.H. Antioxidant activities and phenolics content of eight species of seaweeds from north borneo. J. Appl. Phycol. 2008, 20, 367–373. [Google Scholar] [CrossRef]
- Steinberg, P.D. Biogeographical variation in brown algal polyphenolics and other secondary metabolites—Comparison between temperate australasia and north-america. Oecologia 1989, 78, 373–382. [Google Scholar] [CrossRef]
- Lever, J.; Brkljača, R.; Kraft, G.; Urban, S. Natural products of marine macroalgae from south eastern australia, with emphasis on the port phillip bay and heads regions of victoria. Mar. Drugs 2020, 18, 142. [Google Scholar] [CrossRef]
- Do, Q.D.; Angkawijaya, A.E.; Tran-Nguyen, P.L.; Huynh, L.H.; Soetaredjo, F.E.; Ismadji, S.; Ju, Y.H. Effect of extraction solvent on total phenol content, total flavonoid content, and antioxidant activity of Limnophila aromatica. J. Food Drug Anal. 2014, 22, 296–302. [Google Scholar] [CrossRef]
- Babbar, N.; Oberoi, H.S.; Sandhu, S.K.; Bhargav, V.K. Influence of different solvents in extraction of phenolic compounds from vegetable residues and their evaluation as natural sources of antioxidants. J. Food Sci. Technol. 2014, 51, 2568–2575. [Google Scholar] [CrossRef] [PubMed]
- Sultana, B.; Anwar, F.; Ashraf, M. Effect of extraction solvent/technique on the antioxidant activity of selected medicinal plant extracts. Molecules 2009, 14, 2167–2180. [Google Scholar] [CrossRef] [PubMed]
- Anokwuru, C.; Anyasor, G.; Ajibaye, O.; Fakoya, O.; Okebugwu, P. Effect of extraction solvents on phenolic, flavonoid and antioxidant activities of three nigerian medicinal plants. Nat. Sci. 2011, 9, 53–61. [Google Scholar]
- Das, P.R.; Islam, M.T.; Lee, S.-H.; Lee, M.-K.; Kim, J.-B.; Eun, J.-B. Uplc-dad-qtof/ms analysis of green tea phenolic metabolites in their free, esterified, glycosylated, and cell wall-bound forms by ultra-sonication, agitation, and conventional extraction techniques. LWT 2020, 127, 109440. [Google Scholar] [CrossRef]
- Rodrigues, S.; Pinto, G.A.S. Ultrasound extraction of phenolic compounds from coconut (Cocos nucifera) shell powder. J. Food Eng. 2007, 80, 869–872. [Google Scholar] [CrossRef]
- Harukaze, A.; Murata, M.; Homma, S. Analyses of free and bound phenolics in rice. Food Sci. Technol. Res. 1999, 5, 74–79. [Google Scholar] [CrossRef]
- Ramón-Gonçalves, M.; Gómez-Mejía, E.; Rosales-Conrado, N.; León-González, M.E.; Madrid, Y.J.W.M. Extraction, identification and quantification of polyphenols from spent coffee grounds by chromatographic methods and chemometric analyses. Waste Manag. 2019, 96, 15–24. [Google Scholar] [CrossRef]
- Escobar-Avello, D.; Lozano-Castellón, J.; Mardones, C.; Pérez, A.J.; Saéz, V.; Riquelme, S.; von Baer, D.; Vallverdú-Queralt, A.J.M. Phenolic profile of grape canes: Novel compounds identified by lc-esi-ltq-orbitrap-ms. Molecules 2019, 24, 3763. [Google Scholar]
- Wang, X.; Yan, K.; Ma, X.; Li, W.; Chu, Y.; Guo, J.; Li, S.; Zhou, S.; Zhu, Y.; Liu, C. Simultaneous determination and pharmacokinetic study of protocatechuic aldehyde and its major active metabolite protocatechuic acid in rat plasma by liquid chromatography-tandem mass spectrometry. J. Chromatogr. Sci. 2016, 54, 697–705. [Google Scholar] [CrossRef]
- Bontpart, T.; Marlin, T.; Vialet, S.; Guiraud, J.L.; Pinasseau, L.; Meudec, E.; Sommerer, N.; Cheynier, V.; Terrier, N. Two shikimate dehydrogenases, vvsdh3 and vvsdh4, are involved in gallic acid biosynthesis in grapevine. J. Exp. Bot. 2016, 67, 3537–3550. [Google Scholar] [CrossRef] [PubMed]
- Rajauria, G.; Foley, B.; Abu-Ghannam, N. Identification and characterization of phenolic antioxidant compounds from brown irish seaweed himanthalia elongata using lc-dad-esi-ms/ms. Innov. Food Sci. Emerg. Technol. 2016, 37, 261–268. [Google Scholar] [CrossRef]
- Wekre, M.E.; Kåsin, K.; Underhaug, J.; Holmelid, B.; Jordheim, M.J.A. Quantification of polyphenols in seaweeds: A case study of ulva intestinalis. Antioxidants 2019, 8, 612. [Google Scholar] [CrossRef] [PubMed]
- Karamac, M.; Kosiñska, A.; Pegg, R. Content of gallic acid in selected plant extracts. Pol. J. Food Nutr. Sci. 2006, 15, 55. [Google Scholar]
- Genwali, G.R.; Acharya, P.P.; Rajbhandari, M. Isolation of gallic acid and estimation of total phenolic content in some medicinal plants and their antioxidant activity. Nepal J. Sci. Technol. 2013, 14, 95–102. [Google Scholar] [CrossRef]
- Verma, S.; Singh, A.; Mishra, A. Gallic acid: Molecular rival of cancer. Environ. Toxicol. Pharmacol. 2013, 35, 473–485. [Google Scholar] [CrossRef]
- Iqbal, Y.; Ponnampalam, E.N.; Suleria, H.A.R.; Cottrell, J.J.; Dunshea, F.R. Lc-esi/qtof-ms profiling of chicory and lucerne polyphenols and their antioxidant activities. Antioxidants 2021, 10, 932. [Google Scholar] [CrossRef]
- Zanta, C.; Martínez-Huitle, C.A. Degradation of 2-hydroxybenzoic acid by advanced oxidation processes. Braz. J. Chem. Eng. 2009, 26, 503–513. [Google Scholar] [CrossRef]
- Suleria, H.A.; Barrow, C.J.; Dunshea, F.R. Screening and characterization of phenolic compounds and their antioxidant capacity in different fruit peels. Foods 2020, 9, 1206. [Google Scholar] [CrossRef]
- Wang, J.; Jia, Z.; Zhang, Z.; Wang, Y.; Liu, X.; Wang, L.; Lin, R. Analysis of chemical constituents of melastoma dodecandrum lour. By uplc-esi-q-exactive focus-ms/ms. Molecules 2017, 22, 476. [Google Scholar] [CrossRef]
- Mathew, S.; Abraham, T.E. Bioconversions of ferulic acid, an hydroxycinnamic acid. Crit. Rev. Microbiol. 2006, 32, 115–125. [Google Scholar] [CrossRef]
- Agregán, R.; Munekata, P.E.S.; Franco, D.; Dominguez, R.; Carballo, J.; Lorenzo, J.M. Phenolic compounds from three brown seaweed species using lc-dad–esi-ms/ms. Food Res. Int. 2017, 99, 979–985. [Google Scholar] [CrossRef]
- Rajauria, G. Optimization and validation of reverse phase hplc method for qualitative and quantitative assessment of polyphenols in seaweed. J. Pharm. Biomed. Anal. 2018, 148, 230–237. [Google Scholar] [CrossRef]
- Kumar, N.; Pruthi, V. Potential applications of ferulic acid from natural sources. Biotechnol. Rep. 2014, 4, 86–93. [Google Scholar] [CrossRef]
- Ou, S.Y.; Kwok, K.C. Ferulic acid: Pharmaceutical functions, preparation and applications in foods. J. Sci. Food Agric. 2004, 84, 1261–1269. [Google Scholar] [CrossRef]
- Montanari, L.; Perretti, G.; Natella, F.; Guidi, A.; Fantozzi, P. Organic and phenolic acids in beer. LWT—Food Sci. Technol. 1999, 32, 535–539. [Google Scholar] [CrossRef]
- Strassburg, C.P.; Kalthoff, S. Chapter 60—Coffee and gastrointestinal glucuronosyltransferases. In Coffee in Health and Disease Prevention; Preedy, V.R., Ed.; Academic Press: San Diego, CA, USA, 2015; pp. 535–543. [Google Scholar]
- Moselhy, S.S.; Razvi, S.S.; ALshibili, F.A.; Kuerban, A.; Hasan, M.N.; Balamash, K.S.; Huwait, E.A.; Abdulaal, W.H.; Al-Ghamdi, M.A.; Kumosani, T.A.; et al. M-coumaric acid attenuates non-catalytic protein glycosylation in the retinas of diabetic rats. J. Pestic. Sci. 2018, 43, 180–185. [Google Scholar] [CrossRef] [PubMed]
- Castro, C.B.; Luz, L.R.; Guedes, J.A.C.; Porto, D.D.; Silva, M.F.S.; Silva, G.S.; Riceli, P.R.V.; Canuto, K.M.; Brito, E.S.; Zampieri, D.S.; et al. Metabolomics-based discovery of biomarkers with cytotoxic potential in extracts of myracrodruon urundeuva. J. Braz. Chem. Soc. 2020, 31, 775–787. [Google Scholar] [CrossRef]
- Wang, Y.; Vorsa, N.; Harrington, P.B.; Chen, P. Nontargeted metabolomic study on variation of phenolics in different cranberry cultivars using uplc-im—Hrms. J. Agric. Food Chem. 2018, 66, 12206–12216. [Google Scholar] [CrossRef]
- Singh, P.; Arif, Y.; Bajguz, A.; Hayat, S. The role of quercetin in plants. Plant Physiol. Biochem. 2021, 166, 10–19. [Google Scholar] [CrossRef]
- Zheng, W.; Wang, S.Y. Oxygen radical absorbing capacity of phenolics in blueberries, cranberries, chokeberries, and lingonberries. J. Agric. Food Chem. 2003, 51, 502–509. [Google Scholar] [CrossRef] [PubMed]
- Olate-Gallegos, C.; Barriga, A.; Vergara, C.; Fredes, C.; Garcia, P.; Gimenez, B.; Robert, P. Identification of polyphenols from chilean brown seaweeds extracts by lc-dad-esi-ms/ms. J. Aquat. Food Prod. Technol. 2019, 28, 375–391. [Google Scholar] [CrossRef]
- Zhao, X.; Zhang, S.; Liu, D.; Yang, M.; Wei, J. Analysis of flavonoids in dalbergia odorifera by ultra-performance liquid chromatography with tandem mass spectrometry. Molecules 2020, 25, 389. [Google Scholar] [CrossRef] [PubMed]
- Gampe, N.; Darcsi, A.; Lohner, S.; Béni, S.; Kursinszki, L. Characterization and identification of isoflavonoid glycosides in the root of spiny restharrow (ononis spinosa l.) by hplc-qtof-ms, hplc–ms/ms and nmr. J. Pharm. Biomed. Anal. 2016, 123, 74–81. [Google Scholar] [CrossRef]
- Ham, S.A.; Hwang, J.S.; Kang, E.S.; Yoo, T.; Lim, H.H.; Lee, W.J.; Paek, K.S.; Seo, H.G. Ethanol extract of dalbergia odorifera protects skin keratinocytes against ultraviolet b-induced photoaging by suppressing production of reactive oxygen species. Biosci. Biotechnol. Biochem. 2015, 79, 760–766. [Google Scholar] [CrossRef]
- Liu, R.; Sun, J.; Bi, K.; Guo, D.-a. Identification and determination of major flavonoids in rat serum by hplc–uv and hplc–ms methods following oral administration of dalbergia odorifera extract. J. Chromatogr. B 2005, 829, 35–44. [Google Scholar] [CrossRef]
- Al-Snafi, A.E. Chemical constituents and pharmacological effects of dalbergia sissoo-a review. IOSR J. Pharm. 2017, 7, 59–71. [Google Scholar] [CrossRef]
- Zeng, Y.; Lu, Y.; Chen, Z.; Tan, J.; Bai, J.; Li, P.; Wang, Z.; Du, S. Rapid characterization of components in bolbostemma paniculatum by uplc/ltq-orbitrap msn analysis and multivariate statistical analysis for herb discrimination. Molecules 2018, 23, 1155. [Google Scholar] [CrossRef]
- Parama, D.; Girisa, S.; Khatoon, E.; Kumar, A.; Alqahtani, M.S.; Abbas, M.; Sethi, G.; Kunnumakkara, A.B. An overview of the pharmacological activities of scopoletin against different chronic diseases. Pharmacol. Res. 2022, 179, 106202. [Google Scholar] [CrossRef]
- Gnonlonfin, G.J.B.; Sanni, A.; Brimer, L. Review scopoletin—A coumarin phytoalexin with medicinal properties. Crit. Rev. Plant Sci. 2012, 31, 47–56. [Google Scholar] [CrossRef]
- Jamuna, S.; Karthika, K.; Paulsamy, S.; Thenmozhi, K.; Kathiravan, S.; Venkatesh, R. Confertin and scopoletin from leaf and root extracts of hypochaeris radicata have anti-inflammatory and antioxidant activities. Ind. Crops Prod. 2015, 70, 221–230. [Google Scholar] [CrossRef]
- Stella, L.; De Rosso, M.; Panighel, A.; Vedova, A.D.; Flamini, R.; Traldi, P. Collisionally induced fragmentation of [M–H]− species of resveratrol and piceatannol investigated by deuterium labelling and accurate mass measurements. Rapid Commun. Mass Spectrom. 2008, 22, 3867–3872. [Google Scholar] [CrossRef] [PubMed]
- Frémont, L. Biological effects of resveratrol. Life Sci. 2000, 66, 663–673. [Google Scholar] [CrossRef] [PubMed]
- Karthik, R.; Manigandan, V.; Sheeba, R.; Saravanan, R.; Rajesh, P.R. Structural characterization and comparative biomedical properties of phloroglucinol from indian brown seaweeds. J. Appl. Phycol. 2016, 28, 3561–3573. [Google Scholar] [CrossRef]
- Rodríguez-bernaldo De Quirós, A.; Frecha-ferreiro, S.; Vidal-pérez, A.M.; López-hernández, J. Antioxidant compounds in edible brown seaweeds. Eur. Food Res. Technol. 2010, 231, 495–498. [Google Scholar] [CrossRef]
- Dewick, P.M.; Haslam, E. Phenol biosynthesis in higher plants. Gallic acid. Biochem. J. 1969, 113, 537–542. [Google Scholar] [CrossRef]
- Khan, M.K.; Abert-Vian, M.; Fabiano-Tixier, A.-S.; Dangles, O.; Chemat, F. Ultrasound-assisted extraction of polyphenols (flavanone glycosides) from orange (Citrus sinensis L.) peel. Food Chem. 2010, 119, 851–858. [Google Scholar] [CrossRef]
- Metsämuuronen, S.; Sirén, H. Bioactive phenolic compounds, metabolism and properties: A review on valuable chemical compounds in scots pine and norway spruce. Phytochem. Rev. 2019, 18, 623–664. [Google Scholar] [CrossRef]
- Badmus, U.O.; Taggart, M.A.; Boyd, K.G. The effect of different drying methods on certain nutritionally important chemical constituents in edible brown seaweeds. J. Appl. Phycol. 2019, 31, 3883–3897. [Google Scholar] [CrossRef]
- Čagalj, M.; Skroza, D.; Tabanelli, G.; Özogul, F.; Šimat, V. Maximizing the antioxidant capacity of padina pavonica by choosing the right drying and extraction methods. Processes 2021, 9, 587. [Google Scholar] [CrossRef]
- Gulsunoglu, Z.; Karbancioglu-Guler, F.; Raes, K.; Kilic-Akyilmaz, M. Soluble and insoluble-bound phenolics and antioxidant activity of various industrial plant wastes. Int. J. Food Prop. 2019, 22, 1501–1510. [Google Scholar] [CrossRef]
- Subbiah, V.; Zhong, B.; Nawaz, M.A.; Barrow, C.J.; Dunshea, F.R.; Suleria, H.A.R. Screening of phenolic compounds in australian grown berries by lc-esi-qtof-ms/ms and determination of their antioxidant potential. Antioxidants 2020, 10, 26. [Google Scholar] [CrossRef] [PubMed]
- Mussatto, S.I.; Ballesteros, L.F.; Martins, S.; Teixeira, J.A. Extraction of antioxidant phenolic compounds from spent coffee grounds. Sep. Purif. Technol. 2011, 83, 173–179. [Google Scholar] [CrossRef]
- Ali, A.; Wu, H.; Ponnampalam, E.N.; Cottrell, J.J.; Dunshea, F.R.; Suleria, H.A.R. Comprehensive profiling of most widely used spices for their phenolic compounds through lc-esi-qtof-ms(2) and their antioxidant potential. Antioxidants 2021, 10, 721. [Google Scholar] [CrossRef] [PubMed]
- Vissers, A.M.; Caligiani, A.; Sforza, S.; Vincken, J.P.; Gruppen, H. Phlorotannin composition of laminaria digitata. Phytochem. Anal. 2017, 28, 487–495. [Google Scholar] [CrossRef] [PubMed]
- Stern, J.L.; Hagerman, A.E.; Steinberg, P.D.; Winter, F.C.; Estes, J.A. A new assay for quantifying brown algal phlorotannins and comparisons to previous methods. J. Chem. Ecol. 1996, 22, 1273–1293. [Google Scholar] [CrossRef]
- Margraf, T.; Karnopp, A.R.; Rosso, N.D.; Granato, D. Comparison between folin-ciocalteu and prussian blue assays to estimate the total phenolic content of juices and teas using 96-well microplates. J. Food Sci. 2015, 80, C2397–C2403. [Google Scholar] [CrossRef] [PubMed]
- Nebesny, E.; Budryn, G. Antioxidative activity of green and roasted coffee beans as influenced by convection and microwave roasting methods and content of certain compounds. Eur. Food Res. Technol. 2003, 217, 157–163. [Google Scholar] [CrossRef]
- Benzie, I.F.; Strain, J.J. The ferric reducing ability of plasma (frap) as a measure of “antioxidant power”: The frap assay. Anal. Biochem. 1996, 239, 70–76. [Google Scholar] [CrossRef]
- Re, R.; Pellegrini, N.; Proteggente, A.; Pannala, A.; Yang, M.; Rice-Evans, C. Antioxidant activity applying an improved abts radical cation decolorization assay. Free Radic. Biol. Med. 1999, 26, 1231–1237. [Google Scholar] [CrossRef]
- Smirnoff, N.; Cumbes, Q.J. Hydroxyl radical scavenging activity of compatible solutes. Phytochemistry 1989, 28, 1057–1060. [Google Scholar] [CrossRef]
- Dinis, T.C.; Maderia, V.M.; Almeida, L.M. Action of phenolic derivatives (acetaminophen, salicylate, and 5-aminosalicylate) as inhibitors of membrane lipid peroxidation and as peroxyl radical scavengers. Arch. Biochem. Biophys. 1994, 315, 161–169. [Google Scholar] [CrossRef] [PubMed]
- Ferreira, I.C.F.R.; Baptista, P.; Vilas-Boas, M.; Barros, L. Free-radical scavenging capacity and reducing power of wild edible mushrooms from northeast portugal: Individual cap and stipe activity. Food Chem. 2007, 100, 1511–1516. [Google Scholar] [CrossRef]
- Prieto, P.; Pineda, M.; Aguilar, M. Spectrophotometric quantitation of antioxidant capacity through the formation of a phosphomolybdenum complex: Specific application to the determination of vitamin e. Anal. Biochem. 1999, 269, 337–341. [Google Scholar] [CrossRef] [PubMed]
- Allwood, J.W.; Evans, H.; Austin, C.; McDougall, G.J. Extraction, enrichment, and lc-msn-based characterization of phlorotannins and related phenolics from the brown seaweed, ascophyllum nodosum. Mar. Drugs 2020, 18, 448. [Google Scholar] [CrossRef] [PubMed]
- Zhu, Z.; Zhong, B.; Yang, Z.; Zhao, W.; Shi, L.; Aziz, A.; Rauf, A.; Aljohani, A.S.M.; Alhumaydhi, F.A.; Suleria, H.A.R. Lc-esi-qtof-ms/ms characterization and estimation of the antioxidant potential of phenolic compounds from different parts of the lotus (nelumbo nucifera) seed and rhizome. ACS Omega 2022, 7, 14630–14642. [Google Scholar] [CrossRef] [PubMed]
- Gu, C.; Suleria, H.A.R.; Dunshea, F.R.; Howell, K. Dietary lipids influence bioaccessibility of polyphenols from black carrots and affect microbial diversity under simulated gastrointestinal digestion. Antioxidants 2020, 9, 762. [Google Scholar] [CrossRef] [PubMed]


| Samples | Solvents | TPC (mg GAE/g) | TFC (mg QE/g) | TCT (mg CE/g) | DMBA (PGE mg/g) | PBA (PGE mg/g) | FDA (PGE mg/g) |
|---|---|---|---|---|---|---|---|
| Ultrasonication Extraction | |||||||
| Cystophora sp. | 70% ACE | 19.35 ± 0.09 Ba | 2.28 ± 0.02 HIb | 0.67 ± 0.06 EFc | 1.96 ± 0.08 Fb | 2.61 ± 0.30 Je | 11.21 ± 0.7 Ba |
| 70% MeOH | 22.74 ± 0.28 Ba | 3.33 ± 0.02 E–Gb | - | 1.02 ± 0.04 Ia | 8.61 ± 0.08 Bb | 3.86 ± 0.1 Hc | |
| 70% EtOH | 28.92 ± 1.33 Aa | 3.82 ± 0.07 DEa | 2.21 ± 0.01 Ba | 1.63 ± 0.02 Ga | 8.11 ± 0.61 BCa | 14.2 ± 0.63 Aa | |
| EA | 1.66 ± 0.09 Ob | 7.13 ± 0.9 Cb | 0.94 ± 0.07 DEa | 4.15 ± 0.01 Dc | 5.05 ± 0.25 Ha | - | |
| Phyllospora comosa | 70% ACE | 16.11 ± 0.85 Fb | 1.86 ± 0.01 IJc | 0.94 ± 0.07 DEb | 4.96 ± 0.44 Ca | 6.18 ± 0.29 DEFb | 8.57 ± 0.89 Cb |
| 70% MeOH | 16.85 ± 0.12 Db | 3.43 ± 0.06 D–Fb | 2.86 ± 0.12 Aa | 0.67 ± 0.01 JKb | 12.62 ± 0.26 Aa | 6.58 ± 0.17 Ea | |
| 70% EtOH | 12.41 ± 0.03 Hc | 3.62 ± 0.03 D-Fb | 2.18 ± 0.06 Ba | 0.46± 0.01 LMd | 3.2 ± 0.22 Ic | 6.36 ± 0.41 Fb | |
| EA | 2.23 ± 0.04 Pd | 3.54 ± 0.10 D–Fc | 0.77 ± 0.06 Eb | 6.65 ± 0.67 Bb | 0.13 ± 0.6 Lc | - | |
| Sargassum sp. | 70% ACE | 14.6 ± 0.72 Gc | 0.67 ± 0.04 Le | 0.27 ± 0.02 Gd | 0.89 ± 0.05 Id | 6.5 ± 0.07 DEFa | 7.64 ± 0.25 Dc |
| 70% MeOH | 16.36 ± 0.34 Ec | 1.39 ± 0.01 JKc | - | 0.68 ± 0.04 JKb | 7.77 ± 0.16 Cc | 5.24 ± 0.37 Gb | |
| 70% EtOH | 17.52 ± 0.57 Cb | 2.79 ± 0.02 GHd | 0.64 ± 0.03 EFc | 0.72 ± 0.11 Jc | 6.85 ± 0.19 Db | 3.39 ± 0.25 Jd | |
| EA | 0.34 ± 0.03 Qe | 2.6 ± 0.04 Hd | - | 3.24 ± 0.34 Ed | 1.18 ± 0.3 Kb | - | |
| Ecklonia radiata | 70% ACE | 11.19 ± 0.41 Id | 0.85 ± 0.01 KLd | 1.29 ± 0.01 CDa | 1.02 ± 0.1 Ic | 5.86 ± 0.25 FGc | 2.5 ± 0.04 Le |
| 70% MeOH | 12.19 ± 0.41 Id | 11.15 ± 0.12 Ba | 0.92 ± 0.09 DEc | 0.96 ± 0.07 a | 8 ± 0.37 BCc | 3.5 ± 0.1 IJd | |
| 70% EtOH | 9.03 ± 0.11 Kd | 1.65 ± 0.04 Je | - | 1.18 ± 0.02 Hb | 6.13 ± 0.14 EFb | 0.71 ± 0.01 Me | |
| EA | 1.54 ± 0.01 Oc | 4.04 ± 0.01 Dc | - | 8.29 ± 0.47 Aa | 0.96 ± 0.13 Kb | - | |
| Durvillaea sp. | 70% ACE | 9.98 ± 0.68 Je | 3.35 ± 0.03 EFa | 1.04 ± 0.01 Db | 0.57 ± 0.02 KLe | 5.36 ± 0.14 GHd | 6.72 ± 0.26 Ed |
| 70% MeOH | 4.45 ± 0.09 Ne | 1.32 ± 0.03 JKc | 2.12 ± 0.07 Bb | 0.35 ± 0.02 Mc | 3.87 ± 0.47 Id | 2.82 ± 0.25 Ke | |
| 70% EtOH | 8.6 ± 0.45 Le | 3.15 ± 0.01 FGc | 1.9 ± 0.05 Cb | 0.4 ± 0.01 Md | 6.63 ± 0.58 DEb | 3.63 ± 0.3 Ic | |
| EA | 7.26 ± 0.03 Ma | 18.23 ± 0.17 Aa | - | 8.22 ± 0.18 Aa | 0.48 ± 0.04 KLb | - | |
| Conventional Extraction | |||||||
| Cystophora sp. | 70% ACE | 18.27 ± 1.06 Ba | 2.46 ± 0.03 Da | 0.15 ± 0.01 FGc | 0.57 ± 0.03 HIa | 0.48 ± 0.21 Ke | 7.17 ± 0.55 Db |
| 70% MeOH | 18.59 ± 0.54 Aa | 1.83 ± 0.01 Ea | 2.55 ± 0.07 Ba | 0.94 ± 0.26 Fb | 7.35 ± 0.1 Aa | 8.94 ± 0.42 Ba | |
| 70% EtOH | 15.49 ± 0.59 Ca | 2.48 ± 0.04 Da | 1.40 ± 0.07 Da | 0.79 ± 0.14 Gb | 6.2 ± 0.25 Cb | 8.44 ± 0.55 Ca | |
| EA | 0.96 ± 0.05 La | 2.51 ± 0.15 Cc | 0.17 ± 0.02 FGb | - | - | - | |
| Sargassum sp. | 70% ACE | 13.93 ± 0.45 D | 0.34 ± 0.01 Ke | 0.28 ± 0.03 EFb | 0.65 ± 0.01 Ha | 4.74 ± 0.15 Ea | 3.05 ± 0.13 Gd |
| 70% MeOH | 10.37 ± 0.63 Fc | 1.38 ± 0.02 Kb | 0.43 ± 0.11 Ec | 0.54 ± 0.03 HIc | 7.03 ± 0.08 Bb | 2.91 ± 0.19 Hb | |
| 70% EtOH | 8.89 ± 0.19 Gc | 0.96 ± 0.06 Kd | 0.13 ± 0.01 FGc | 0.58 ± 0.01 HIc | 3.7 ± 0.06 Fd | 0.69 ± 0.2 Kd | |
| EA | 0.53 ± 0.03 Mc | 6.35 ± 0.01 Bb | 0.02 ± 0.01 Gc | 6.32 ± 0.8 Bb | 0.12 ± 0.06 Lc | - | |
| Phyllospora comosa | 70% ACE | 13.72 ± 0.50 Db | 1.07 ± 0.02 Fb | 0.59 ± 0.01 Hd | 0.38 ± 0.01 JKb | 2.26 ± 0.35 Id | 1.87 ± 0.12 Je |
| 70% MeOH | 11.03 ± 0.81 Eb | 0.22 ± 0.01 Lc | 0.14 ± 0.05 EFd | 0.33 ± 0.01 Kd | 1.48 ± 0.22 Jd | 1.92 ± 0.01 Jd | |
| 70% EtOH | 10.28 ± 0.59 Fb | 0.91 ± 0.02 Gb | - | 0.47 ± 0.03 IJd | 6.95 ± 0.09 Ba | 4.69 ± 0.2 Eb | |
| EA | 0.68 ± 0.01 Mc | 6.52 ± 0.03 Aa | - | 6.01 ± 0.01 Cc | 2.22 ± 0.2 Ia | - | |
| Ecklonia radiata | 70% ACE | 10.78 ± 0.31 Gc | 0.35 ± 0.03 Jd | - | 0.59 ± 0.03 HIa | 2.6 ± 0.05 Hc | 3.6 ± 0.3 Fc |
| 70% MeOH | 10.63 ± 0.38 Hd | 0.12 ± 0.04 Lc | - | 1.12 ± 0.12 Ea | 1.46 ± 0.1 Jd | 2.5 ± 0.04 Ic | |
| 70% EtOH | 8.74 ± 0.21 Id | 0.34 ± 0.05 Gb | - | 0.91 ± 0.07 FGa | 4.94 ± 0.7 Dc | 2.82 ± 0.02 Hc | |
| EA | - | 0.11 ± 0.02 Aa | 27.54 ± 0.23 Aa | 6.57 ± 0.3 Aa | 0.46 ± 0.3 Kb | - | |
| Durvillaea sp. | 70% ACE | 8.13 ± 0.20 Hd | 0.99 ± 0.03 Ic | 0.8 ± 0.22 Da | 0.32 ± 0.07 Kb | 2.8 ± 0.09 Gb | 20.04 ± 0.23 Aa |
| 70% MeOH | 4.32 ± 0.15 Ke | 0.04 ± 0.01 Md | 1.61 ± 0.09 Cb | 0.29 ± 0.07 Kd | 6.19 ± 0.01 Cc | 0.19 ± 0.01 Le | |
| 70% EtOH | 5.01 ± 0.33 Je | 0.78 ± 0.01 Hc | 0.53 ± 0.07 Eb | 0.39 ± 0.05 JKe | 4.8 ± 0.07D Ec | 2.91 ± 0.26 Hc | |
| EA | 0.09 ± 0.01 Nd | 6.35 ± 0.01 Bc | - | 0.9 ± 0.01 FGe | - | - | |
| Samples | Solvents | DPPH (mg TE/g) | FRAP (mg TE/g) | ABTS (mg TE/g) | FICA (mg EDTA/g) | ·OH-RSA (mg TE/g) | TAC (mg TE/g) | RPA (mg TE/g) |
|---|---|---|---|---|---|---|---|---|
| Ultrasonication | ||||||||
| Cystophora sp. | 70% ACE | 50.33 ± 0.07 Aa | 45.62 ± 0.13 Aa | 64.15 ± 0.20 Aa | 1.76 ± 0.01 BCd | 13.26 ± 0.22 Gd | 76.61 ± 0.30 Aa | 17.21 ± 0.03 Gc |
| 70% MeOH | 43.6 ± 0.10 Ba | 26.08 ± 0.22 Ba | 58.65 ± 0.18 Ba | 0.96 ± 0.01 Fd | 62.67 ± 0.44 Bb | 29.23 ± 1.04 Ic | 16.11 ± 0.08 Hc | |
| 70% EtOH | 7.26 ± 0.03 Hb | 25.00 ± 0.22 Ca | 44.24 ± 0.18 Db | 1.04 ± 0.01 Fa | - | 33.30 ± 1.20 Gb | 29.27 ± 0.14 Aa | |
| EA | 1.42 ± 0.8 Nb | 0.35 ± 0.01 Nc | 6.58 ± 0.06 Pb | 1.45 ± 0.9 BCb | 9.06 ± 0.55 I | 20.24 ± 0.6 Kc | 1.95± 0.35 Pb | |
| Phyllospora comosa | 70% ACE | 37.52 ± 0.07 Dc | 17.01 ± 0.12 Gc | 22.99 ± 0.85 Kb | 4.14 ± 0.11 Aa | 53.38 ± 1.10 Cb | 48.71 ± 0.76 Cc | 25.76 ± 0.09 Cb |
| 70% MeOH | 4.76 ± 0.03 Le | 7.80 ± 0.23 Ic | 33.22 ± 0.33 Fc | 1.91 ± 0.02 Ba | 65.42 ± 0.96 Ba | 33.52 ± 0.60 Ga | 20.46 ± 0.18 Da | |
| 70% EtOH | 4.69 ± 0.01 Kd | 11.02 ± 0.19 Hd | 32.21 ± 0.11 Ge | 1.59 ± 0.01 B–Db | 15.38 ± 0.17 Fa | 40.94 ± 0.92 Da | 7.24 ± 0.04 Me | |
| EA | 2.1 ± 0.03 Ma | 0.53 ± 0.04 Nd | 9.03 ± 0.03 Oa | 1.02 ± 0.04 Fb | 33.23 ± 0.15 H | - | 2.90 ± 0.04 Oa | |
| Sargassum sp. | 70% ACE | 38.79 ± 0.06 Cb | 36.73 ± 0.27 Db | 45.16 ± 0.40 Cd | 1.45 ± 0.01 C–Ed | 16.73 ± 0.36 Ec | 56.01 ± 0.35 Bb | 28.47 ± 0.14 Ba |
| 70% MeOH | 7.89 ± 0.06 Ga | 35.60 ± 0.21 Eb | 30.13 ± 0.07 Hd | 1.11 ± 0.01 Fc | 3.66 ± 0.01 Fd | 32.58 ± 0.63 GHb | 15.53 ± 0.04 Id | |
| 70% EtOH | 7.84 ± 0.03 Ga | 27.63 ± 0.16 Fb | 30.22 ± 0.75 Ha | 1.01 ± 0.01 Ga | 1.33 ± 0.05 Kd | 31.63 ± 0.46 Hc | 18.52 ± 0.19 Fb | |
| EA | 0.62 ± 0.01 Oc | 0.09 ± 0.01 Mb | 4.86 ± 0.05 Qd | 0.52 ± 0.02 Hc | - | 40.30 ± 1.26 Ea | - | |
| Ecklonia radiata | 70% ACE | 34.09 ± 0.05 Ed | 24.10 ± 0.12 Db | 24.92 ± 0.45 Jd | 1.87 ± 0.01 Bb | 134.49 ± 5.25 Aa | 37.82 ± 1.5 Fd | 11.90 ± 0.04 Jd |
| 70% MeOH | 5.01 ± 0.01 Ld | 20.80 ± 0.09 Eb | 40.91 ± 0.99 Eb | 0.53 ± 0.01 He | 11.94 ± 0.01 Cb | 15.35 ± 0.76 Ld | 19.10 ± 0.08 Eb | |
| 70% EtOH | 5.51 ± 0.02 Ic | 19.20 ± 0.16 Fb | 21.09 ± 0.69 Lc | 1.87 ± 0.01 D–Fa | 3.23 ± 0.06 Jc | 26.43 ± 1.5 Jd | 8.61 ± 0.08 Ld | |
| EA | - | 0.84 ± 0.01 Mb | 6.75 ± 0.10 PQc | 0.66 ± 0.01 Ba | - | 33.79 ± 0.42 Hb | 1.88 ± 0.02 Qc | |
| Durvillaea sp. | 70% ACE | 22.49 ± 0.04 Fe | 3.58 ± 0.08 Ld | 28.42 ± 0.07 Ie | 1.06 ± 0.01 Fe | 13.12 ± 0.16 Gd | 18.50 ± 0.08 Ke | 4.68 ± 0.16 Ne |
| 70% MeOH | 5.24 ± 0.01 Jc | 6.39 ± 0.12 Jd | 17.67 ± 0.09 Ne | 1.16 ± 0.01 EFb | 18.22 ± 0.02 Dc | 7.01 ± 0.15 Ne | 11.99 ± 0.04 Je | |
| 70% EtOH | 5.47 ± 0.01 Ic | 11.39 ± 0.08 Hc | 18.36 ± 0.40 Mc | 1.01 ± 0.01 Fa | 14.27 ± 0.09 Fb | 9.36 ± 0.15 Me | 11.65 ± 0.06 Kc | |
| EA | 2.01 ± 0.01 Ma | 0.25 ± 0.01 Ka | 6.40 ± 0.03 Qd | 1.92 ± 0.01 Ba | - | 5.86 ± 0.05 Od | 2.00 ± 0.03 Pb | |
| Conventional Extraction | ||||||||
| Cystophora sp. | 70% ACE | 46.73 ± 0.12 Aa | 32.54 ± 0.29 Ca | 42.50 ± 0.22 Aa | 0.24 ± 0.01 | 0.70 ± 0.73 Jc | 77.63 ± 0.17 Aa | 7.92 ± 0.03 Fd |
| 70% MeOH | 42.95 ± 0.12 Ca | 32.88 ± 0.12 Ba | 41.10 ± 0.15 Ba | 0.10 ± 0.01 Nc | 2.20 ± 0.74 Hc | 46.00 ± 0.54 Ca | 15.20 ± 0.14 Ba | |
| 70% EtOH | 46.49 ± 0.08 Ba | 33.48 ± 0.23 Aa | 42.34 ± 0.32 Aa | 0.37 ± 0.01 Ke | 3.72 ± 0.05 Gc | 73.79 ± 0.30 Ba | 22.01 ± 0.10 Aa | |
| EA | 4.40 ± 0.06 Jb | 0.25 ± 0.01 Opb | 3.41 ± 0.04 Lb | 0.93 ± 0.01 Ee | - | 17.59 ± 0.35 Ha | 2.27 ± 0.09 La | |
| Sargassum sp. | 70% ACE | 32.94 ± 0.17 Ec | 30.35 ± 0.17 Db | 23.43 ± 0.27 Cb | 0.36 ± 0.02 Kc | 23.37 ± 0.74 Ca | 34.75 ± 0.52 Cb | 10.55 ± 0.08 Da |
| 70% MeOH | 5.97 ± 0.08 Hc | 17.83 ± 0.23 Fb | 23.34 ± 0.48 Cb | 0.46 ± 0.01 Jc | 3.60 ± 0.29 Gd | 8.85 ± 0.17 Dd | 7.84 ± 0.05 Hd | |
| 70% EtOH | 5.87 ± 0.07 Hc | 16.96 ± 0.32 Gb | 21.53 ± 0.48 Eb | 0.48 ± 0.03 Jc | 0.39 ± 0.35 Jd | 14.77 ± 0.18 Ld | 8.91 ± 0.08 Fc | |
| EA | 3.44 ± 0.19 Kc | 0.40 ± 0.01 Oa | 2.88 ± 0.03 Mc | 0.35 ± 0.02 Kd | - | 16.64 ± 1.30 Ib | 0.43 ± 0.01 Mb | |
| Phyllospora comosa | 70% ACE | 35.09 ± 0.09 Db | 12.69 ± 0.23 Hd | 20.24 ± 0.87 Fd | 0.98 ± 0.01 Da | 5.80 ± 0.01 Eb | 18.01 ± 0.63 Jd | 8.27 ± 0.04 Gc |
| 70% MeOH | 4.99 ± 0.01 Id | 6.56 ± 0.12 Ld | 12.56 ± 0.10 Ijd | 0.78 ± 0.01 Fa | 26.63 ± 0.12 Aa | 13.71 ± 0.31 Ic | 9.94 ± 0.05 Eb | |
| 70% EtOH | 5.12 ± 0.01 Hd | 9.18 ± 0.29 Kd | 12.66 ± 0.07 Ijd | 1.19 ± 0.01 Ba | 4.51 ± 0.13 Fb | 21.69 ± 0.09 Fa | 11.90 ± 0.12 Cb | |
| EA | 0.69 ± 0.01 Me | 0.17 ± 0.01 Opb | 2.85 ± 0.05 Ka | 1.02 ± 0.01 Cb | - | - | 0.44 ± 0.02 Mb | |
| Ecklonia radiata | 70% ACE | 41.96 ± 0.07 Fd | 20.88 ± 0.12 Ec | 25.35 ± 0.62 Dc | 0.66 ± 0.01 Ib | 2.17 ± 0.05 H | 27.91 ± 0.17 Fc | 8.71 ± 0.07 Ge |
| 70% MeOH | 31.59 ± 0.08 Fb | 12.32 ± 0.12 Ic | 19.62 ± 0.40 Hc | 0.37± 0.01 Ld | 6.75 ± 0.15 Dc | 28.09 ± 0.15 Eb | 10.17 ± 0.07 Fc | |
| 70% EtOH | 29.41 ± 0.12 Gb | 14.06 ± 0.19 Hc | 13.75 ± 0.23 Ijc | 0.66 ± 0.01 Jd | 1.11 ± 0.65 Ie | 28.24 ± 0.23 Gc | 11.43 ± 0.04 Fc | |
| EA | 2.51 ± 0.04 Ld | 0.02 ± 0.01 Pc | - | 4.56 ± 0.07 Aa | - | - | 0.14 ± 0.01 Nd | |
| Durvillaea sp. | 70% ACE | 30.54 ± 0.06 Fe | 10.25 ± 0.08 Je | 12.86 ± 0.07 Ie | 0.27 ± 0.01 Md | 4.56 ± 0.14 Ec | 13.31 ± 0.09 Ke | 9.84 ± 0.04 Ec |
| 70% MeOH | 4.73 ± 0.02 Je | 6.20 ± 0.20 Me | 12.60 ± 0.07 Ijd | 0.56 ± 0.02 Hb | 16.80 ± 0.15 Bb | 4.09 ± 0.04 Ne | 5.12 ± 0.04 Je | |
| 70% EtOH | 4.77 ± 0.02 Je | 5.83 ± 0.16 Ne | 12.29 ± 0.04 Je | 0.66 ± 0.01 Gb | 6.50 ± 0.23 Da | 5.34 ± 0.14 Me | 4.51 ± 0.03 Kd | |
| EA | 4.82 ± 0.03 Ja | 0.03 ± 0.01 Pc | 1.87 ± 0.04 Ne | 0.93 ± 0.01 Ec | - | 8.01 ± 0.53 Lc | - | |
| Variables | TPC | TFC | TCT | DMBA | PBA | FDA | DPPH | FRAP | ABTS | FICA | OH-RSA | TAC |
|---|---|---|---|---|---|---|---|---|---|---|---|---|
| Ultrasonication | ||||||||||||
| TFC | −0.178 | |||||||||||
| TCT | 0.222 | −0.155 | ||||||||||
| DMBA | −0.469 | 0.491 b | −0.414 | |||||||||
| PBA | 0.649 a | −0.238 | 0.394 | −0.663 | ||||||||
| FDA | 0.818 a | −0.297 | 0.422 | −0.421 | 0.432 | |||||||
| DPPH | 0.505 b | −0.349 | −0.170 | −0.236 | 0.178 | 0.498 b | ||||||
| FRAP | 0.731 a | −0.365 | −0.145 | −0.503 | 0.403 | 0.600 a | 0.657 a | |||||
| ABTS | 0.837 a | −0.245 | 0.110 | −0.571 | 0.510 b | 0.734 a | 0.690 a | 0.815 a | ||||
| FICA | 0.202 | −0.067 | 0.118 | 0.150 | 0.114 | 0.279 | 0.406 | 0.111 | 0.016 | |||
| OH-RSA | 0.165 | −0.270 | 0.254 | −0.164 | 0.311 | 0.024 | 0.474 b | 0.114 | 0.161 | 0.375 | ||
| TAC | 0.448 b | −0.442 | −0.111 | −0.193 | 0.110 | 0.571 a | 0.646 a | 0.650 a | 0.562 a | 0.326 | 0.120 | |
| RPA | 0.819 a | −0.294 | 0.286 | −0.458 | 0.682 a | 0.771 a | 0.480 b | 0.712 a | 0.699 a | 0.313 | 0.182 | 0.449 b |
| Conventional | ||||||||||||
| TFC | −0.434 | |||||||||||
| TCT | −0.292 | −0.205 | ||||||||||
| DMBA | −0.668 | 0.511 b | 0.488 | |||||||||
| PBA | 0.457 b | −0.384 | −0.196 | −0.513 | ||||||||
| FDA | 0.478 b | −0.195 | −0.133 | −0.393 | 0.262 | |||||||
| DPPH | 0.799 a | −0.262 | −0.186 | −0.445 | 0.167 | 0.561 b | ||||||
| FRAP | 0.907 a | −0.304 | −0.217 | −0.538 | 0.478 a | 0.447 b | 0.824 a | |||||
| ABTS | 0.921 b | −0.280 | −0.257 | −0.567 | 0.457 a | 0.451 b | 0.809 a | 0.958 a | ||||
| FICA | −0.460 | −0.122 | 0.926 a | 0.537 b | −0.298 | −0.321 | −0.376 | −0.443 | −0.480 | |||
| OH-RSA | 0.247 | −0.444 | −0.153 | −0.390 | 0.190 | −0.40 | −0.021 | 0.112 | 0.047 | −0.168 | ||
| TAC | 0.761 a | 0.055 b | −0.220 | −0.317 | 0.154 | 0.403 | 0.809 a | 0.837 a | 0.851 a | −0.393 | −0.063 | |
| RPA | 0.830 a | −0.449 | −0.273 | −0.625 | 0.628 a | 0.541 b | 0.688 a | 0.785 a | 0.787 a | −0.423 | 0.219 | 0.685 a |
| No. | Proposed Compounds | Molecular Formula | RT (min) | Ionization (ESI+/ESI−) | Molecular Weight | Theoretical (m/z) | Observed (m/z) | Error (ppm) | MS2 Product Ions | Seaweed Samples |
|---|---|---|---|---|---|---|---|---|---|---|
| Phenolic acid | ||||||||||
| Hydroxybenzoic acids | ||||||||||
| 1 | 4-Hydroxybenzaldehyde | C7H6O2 | 7.188 | [M – H]− | 122.0376 | 121.0303 | 121.0303 | 0.2 | 77 | Dabu |
| 2 | Protocatechuic acid 4-O-glucoside | C13H16O9 | 14.994 | [M – H]− | 316.0786 | 315.0713 | 315.0702 | −3.5 | 153 | * Embu, Dmbu, Eeu |
| 3 | 2,3-Dihydroxybenzoic acid | C7H6O4 | 25.802 | [M – H]− | 154.0262 | 153.0189 | 153.0190 | 0.7 | 109 | Eethbu |
| 4 | Gallic acid 4-O-glucoside | C13H16O10 | 30.462 | ** [M – H]− | 332.0768 | 331.0695 | 331.0691 | −1.2 | 169, 125 | * Amu, Dmu, Aeu, Aau, Cabu, Cebu, Dmbu |
| 5 | Gallic acid | C7H6O5 | 31.309 | [M – H]− | 170.0225 | 169.0152 | 169.0154 | 1.2 | 125 | * Aabu, Aebu, Ambu, Babu, Bebu, Bethbu, Bmbu, Dethbu, Eabu, Eethbu, Eeu, Eau |
| 6 | 2-Hydroxybenzoic acid | C7H6O3 | 32.019 | [M – H]− | 138.0310 | 137.0237 | 137.0238 | 0.7 | 93 | * Dabu, Dmbu |
| Hydroxycinnamic acids | ||||||||||
| 7 | Feruloyl tartaric acid | C14H14O9 | 4.933 | [M – H]− | 326.0652 | 325.0579 | 325.0575 | −1.2 | 193, 149 | * Eau, Cau |
| 8 | m-Coumaric acid | C9H8O3 | 5.228 | [M – H]− | 164.0487 | 163.0414 | 163.0412 | −1.2 | 119 | * Dabu, Cmbu, Debu, Dmbu, Eabu |
| 9 | Caffeoyl tartaric acid | C13H12O9 | 5.426 | [M – H]− | 312.0504 | 311.0431 | 311.0438 | 2.3 | 161 | * Emu, Dmu, Amu |
| 10 | Ferulic acid | C10H10O4 | 5.539 | [M – H]− | 194.0585 | 193.0512 | 193.0516 | 2.1 | 178, 149, 134 | Eau |
| 11 | Isoferulic acid 3-sulfate | C10H10O7S | 5.608 | [M – H]− | 274.0129 | 273.0056 | 273.0054 | −0.7 | 193, 178 | * Aabu, Aethbu, Ambu, Bmbu, Cabu, Dabu, Amu |
| 12 | Caffeic acid 3-O-glucuronide | C15H16O10 | 6.388 | ** [M – H]− | 356.0743 | 355.0670 | 355.0673 | 0.8 | 179 | * Cebu, Ambu, Embu, Cethbu, Emu, Amu |
| 13 | Hydroxycaffeic acid | C9H8O5 | 7.205 | [M – H]− | 196.0368 | 195.0295 | 195.0299 | 2.1 | 151 | Cebu |
| 14 | Cinnamic acid | C9H8O2 | 7.246 | [M – H]− | 148.0537 | 147.0464 | 147.0465 | 0.7 | 103 | * Cebu, Aethbu, Bmbu, Cabu, Cmbu, Dabu, Eabu |
| 15 | Ferulic acid 4-O-glucoside | C16H20O9 | 13.750 | [M – H]− | 356.1106 | 355.1033 | 355.1025 | −2.3 | 193, 178, 149, 134 | * Aabu, Babu |
| 16 | Chlorogenic acid | C16H18O9 | 13.985 | [M – H]− | 354.0929 | 353.0856 | 353.0855 | −0.3 | 253, 190, 144 | * Dabu, Babu, Cabu, Cebu, Eabu, Eau, Aeu |
| 17 | 1-Sinapoyl−2-feruloylgentiobiose | C33H40O18 | 14.898 | ** [M – H]− | 724.2205 | 723.2132 | 723.2136 | 0.6 | 529, 499 | * Bmbu, Cabu, Cethbu, Cmbu, Dmbu, Eebu, Aeu |
| 18 | Sinapic acid | C11H12O5 | 16.158 | ** [M – H]− | 224.0666 | 223.0593 | 223.0595 | 0.9 | 205, 163 | * Aabu, Cethbu, Dabu, Debu, Dmbu |
| 19 | p-Coumaroyl tartaric acid | C13H12O8 | 16.214 | [M – H]− | 296.0555 | 295.0482 | 295.0486 | 1.4 | 115 | * Debu, Dmbu, Embu |
| 20 | p-Coumaroyl malic acid | C13H12O7 | 16.596 | ** [M – H]− | 280.0596 | 279.0523 | 279.0512 | −3.9 | 163, 119 | * Dmbu, Cabu, Cebu, Cethbu, Dabu, Dmbu, Emu, Aeu |
| 21 | 1,5-Dicaffeoylquinic acid | C25H24O12 | 17.017 | [M – H]− | 516.1233 | 515.1160 | 515.1172 | 2.3 | 353, 335, 191, 179 | * Dabu, Eabu, Eau |
| 22 | Ferulic acid 4-O-glucuronide | C16H18O10 | 17.199 | ** [M – H]− | 370.0895 | 369.0822 | 369.0836 | 3.8 | 193 | * Eau, Bmu, Dabu, Debu, Embu |
| 23 | p-Coumaric acid 4-O-glucoside | C15H18O8 | 17.367 | [M – H]− | 326.0970 | 325.0897 | 325.0891 | −1.8 | 163 | * Eabu, Dabu |
| 24 | Rosmarinic acid | C18H16O8 | 18.249 | [M – H]− | 360.0850 | 359.0777 | 359.0775 | −0.6 | 179 | * Dmbu, Emu |
| 25 | Caffeoyl glucose | C15H18O9 | 18.549 | [M – H]− | 342.0951 | 341.0878 | 341.0890 | 3.5 | 179, 161 | * Dmbu, Dabu, Eabu |
| 26 | 3-p-Coumaroylquinic acid | C16H18O8 | 19.117 | [M – H]− | 338.0998 | 337.0925 | 337.0926 | 0.3 | 265, 173, 162 | * Dabu, Cabu, Eabu, Eebu, Eau |
| 27 | p-Coumaric acid 4-O-glucoside | C15H18O7 | 21.240 | [M – H]− | 310.1024 | 309.0951 | 309.0951 | 0.1 | 163 | Debu |
| 28 | 5-5′-Dehydrodiferulic acid | C20H18O8 | 21.657 | ** [M – H]+ | 386.0985 | 385.0912 | 385.0913 | 0.3 | 369 | * Eabu, Embu, Cebu |
| 29 | 3-Sinapoylquinic acid | C18H22O10 | 23.306 | [M – H]− | 398.1177 | 397.1104 | 397.1109 | 1.3 | 233, 179 | Eeu |
| 30 | 1,2,2′-Triferuloylgentiobiose | C42H46O20 | 31.165 | [M – H]− | 870.2584 | 869.2511 | 869.2481 | −3.5 | 693, 517 | * Deu, Bau |
| Hydroxyphenyl acetic acids | ||||||||||
| 31 | 3,4-Dihydroxyphenylacetic acid | C8H8O4 | 6.661 | [M – H]− | 168.0432 | 167.0359 | 167.0350 | −5.4 | 149, 123 | * Deu |
| 32 | 2-Hydroxy-2-phenylacetic acid | C8H8O3 | 7.182 | [M – H]− | 152.0475 | 151.0402 | 151.0403 | 0.7 | 136, 92 | * Cebu, Aeu, Aau |
| Hydroxyphenylpropanoic acids | ||||||||||
| 33 | Dihydroferulic acid 4-O-glucuronide | C16H20O10 | 3.119 | ** [M – H]− | 372.1090 | 371.1017 | 371.1019 | 0.5 | 195 | * Babu, Bebu, Bmbu, Dabu, Eabu, Embu, Cethbu |
| 34 | Dihydrocaffeic acid 3-O-glucuronide | C15H18O10 | 7.535 | [M – H]− | 358.0913 | 357.0840 | 357.0837 | −0.8 | 181 | * Bebu, Bmbu, Debu, Eabu, Eebu, Embu, Aabu |
| 35 | Dihydroferulic acid 4-sulfate | C10H12O7S | 16.763 | [M – H]− | 276.0290 | 275.0217 | 275.0212 | −1.8 | 195, 151, 177 | Eebu |
| Flavonoids | ||||||||||
| Flavanols | ||||||||||
| 36 | Theaflavin | C29H24O12 | 3.082 | [M – H]− | 564.1254 | 563.1181 | 563.1198 | 3.0 | 545 | * Bebu, Dabu, Eeu |
| 37 | (+)-Gallocatechin 3-O-gallate | C22H18O11 | 5.144 | [M – H]− | 458.0818 | 457.0745 | 457.0744 | −0.2 | 305, 169 | * Cebu, Debu |
| 38 | Procyanidin dimer B1 | C30H26O12 | 17.032 | [M – H]− | 578.1385 | 577.1312 | 577.1292 | −3.5 | 451 | Babu |
| 39 | 3′-O-Methylcatechin | C16H16O6 | 17.951 | ** [M – H]− | 304.0959 | 303.0886 | 303.0894 | 2.6 | 271, 163 | Babu |
| 40 | (+)-Catechin 3-O-gallate | C22H18O10 | 20.261 | [M – H]− | 442.0879 | 441.0806 | 441.0811 | 1.1 | 289, 169, 125 | * Embu, Eeu |
| 41 | (+)-Catechin | C15H14O6 | 20.437 | ** [M – H]− | 290.0786 | 289.0713 | 289.0716 | 1.0 | 245, 205, 179 | * Eeu, Dabu |
| 42 | Theaflavin 3,3′-O-digallate | C43H32O20 | 24.533 | [M – H]− | 868.1448 | 867.1375 | 867.1373 | −0.2 | 715, 563, 545 | * Bmu, Beu, Bau |
| 43 | (−)-Epigallocatechin | C15H14O7 | 30.714 | ** [M – H]− | 306.0737 | 305.0664 | 305.0670 | 2.0 | 261, 219 | * Aau, Dau, Deu, Debu, Eabu, Embu |
| Flavones | ||||||||||
| 44 | Apigenin 6-C-glucoside | C21H20O10 | 16.981 | [M – H]− | 432.1077 | 431.1004 | 431.1015 | 2.6 | 413, 341, 311 | * Dabu, Dmbu |
| 45 | Isorhamnetin | C16H12O7 | 19.215 | [M – H]− | 316.0575 | 315.0502 | 315.0510 | 2.5 | 300, 271 | Dmu |
| 46 | Apigenin 7-O-glucuronide | C21H18O11 | 22.686 | ** [M – H]− | 446.0875 | 445.0802 | 445.0802 | 0.2 | 271, 253 | * Aau, Amu |
| 47 | 3-Methoxysinensetin | C21H22O8 | 30.813 | [M – H]− | 402.1301 | 401.1228 | 401.1234 | 1.5 | 388, 373, 355, 327 | Eau |
| Flavanones | ||||||||||
| 48 | Hesperetin 3′,7-O-diglucuronide | C28H30O18 | 4.806 | [M – H]− | 654.1424 | 653.1351 | 653.1356 | 0.8 | 477, 301, 286, 242 | * Babu, Cmbu, Debu, Eabu |
| 49 | Narirutin | C27H32O14 | 5.264 | [M – H]− | 580.1827 | 579.1754 | 579.1756 | 0.3 | 271 | * Cmbu, Cabu, Cebu |
| 50 | Hesperetin 3′-sulfate | C16H14O9S | 7.389 | [M – H]− | 382.0354 | 381.0281 | 381.0277 | −1.0 | 301, 286, 257, 242 | * Aethbu, Ambu, Babu, Cmbu, Dmbu, Eabu |
| 51 | Hesperetin 3′-O-glucuronide | C22H22O12 | 13.741 | ** [M – H]− | 478.1130 | 477.1057 | 477.1062 | 1.0 | 301, 175, 113, 85 | * Eau, Emu |
| 52 | Naringin 4′-O-glucoside | C33H42O19 | 32.747 | [M – H]− | 742.2295 | 741.2222 | 741.2232 | 1.3 | 433, 271 | Cethbu |
| Flavonols | ||||||||||
| 53 | Kaempferol 3-O-glucosyl-rhamnosyl-galactoside | C33H40O20 | 4.719 | [M – H]− | 756.2135 | 755.2062 | 755.2075 | 1.7 | 285 | Ceu |
| 54 | Quercetin 3′-O-glucuronide | C21H18O13 | 5.185 | [M – H]− | 478.0758 | 477.0685 | 477.0679 | −1.3 | 301 | * Cabu, Bmu, Beu, Bethu, Bau |
| 55 | Patuletin 3-O-glucosyl-(1->6)-[apiosyl(1->2)]-glucoside | C33H40O22 | 5.616 | [M – H]− | 788.1982 | 787.1909 | 787.1919 | 1.3 | 625, 463, 301, 271 | * Ceu, Cau |
| 56 | Myricetin 3-O-arabinoside | C20H18O12 | 7.182 | [M – H]− | 450.0821 | 449.0748 | 449.0750 | 0.4 | 317 | * Cebu, Emu, Cau |
| 57 | Quercetin 3-O-glucosyl-xyloside | C26H28O16 | 15.852 | [M – H]− | 596.1347 | 595.1274 | 595.1280 | 1.0 | 265, 138, 116 * | Eabu |
| 58 | Isorhamnetin 3-O-glucuronide | C22H20O13 | 15.938 | [M – H]− | 492.0897 | 491.0824 | 491.0821 | −0.6 | 315, 300, 272, 255 | Aabu` |
| 59 | Myricetin 3-O-galactoside | C21H20O13 | 16.921 | ** [M – H]− | 480.0911 | 479.0838 | 479.0848 | 2.1 | 317 | * Eeu, Deu, Beu, Bau |
| 60 | Myricetin 3-O-rhamnoside | C21H20O12 | 17.690 | [M – H]− | 464.0937 | 463.0864 | 463.0879 | 3.2 | 317 | * Eeu, Beu |
| 61 | Quercetin 3-O-arabinoside | C20H18O11 | 20.258 | ** [M – H]− | 434.0850 | 433.0777 | 433.0796 | 4.4 | 301 | * Eeu, Dmu, Dmbu |
| 62 | 6-Hydroxyluteolin 7-rhamnoside | C21H20O11 | 20.989 | [M – H]− | 448.0991 | 447.0918 | 447.0904 | −3.1 | 301 | * Eeu, Eau |
| 63 | Quercetin 3′-sulfate | C15H10O10S | 31.909 | [M – H]− | 381.9980 | 380.9907 | 380.9905 | −0.5 | 301 | * Ceu, Cau, Beu, Bau, Aau |
| 64 | 3-Methoxynobiletin | C22H24O9 | 34.064 | [M + H]+ | 432.1461 | 433.1534 | 433.1534 | 0.1 | 403, 385, 373, 345 | * Aethu |
| Dihydroflavonols | ||||||||||
| 65 | Dihydromyricetin 3-O-rhamnoside | C21H22O12 | 15.652 | ** [M – H]− | 466.1112 | 465.1039 | 465.1043 | 0.9 | 301 | * Eau, Deu |
| 66 | Dihydroquercetin | C15H12O7 | 15.971 | [M – H]− | 304.0591 | 303.0518 | 303.0518 | 0.2 | 285, 275, 151 | * Emu, Dabu |
| Dihydrochalcones | ||||||||||
| 67 | 3-Hydroxyphloretin 2′-O-glucoside | C21H24O11 | 4.593 | [M – H]− | 452.1354 | 451.1281 | 451.1280 | −0.2 | 289, 273 | Bau |
| Isoflavonoids | ||||||||||
| 68 | 6″-O-Acetylglycitin | C24H24O11 | 5.896 | [M + H]+ | 488.1333 | 489.1406 | 489.1398 | −1.6 | 285, 270 | * Amu |
| 69 | 2-Dehydro-O-desmethylangolensin | C15H12O4 | 5.898 | [M – H]− | 256.0751 | 255.0678 | 255.0679 | 0.4 | 135, 119 | * Cmbu, Babu |
| 70 | 2′-Hydroxyformononetin | C16H12O5 | 5.934 | ** [M – H]− | 284.0687 | 283.0614 | 283.0619 | 1.8 | 270, 229 | * Emu, Eeu, Dmu |
| 71 | Violanone | C17H16O6 | 5.937 | [M – H]− | 316.0932 | 315.0859 | 315.0850 | −2.9 | 300, 285, 135 | * Cmbu, Embu, Eeu |
| 72 | Sativanone | C17H16O5 | 16.707 | ** [M – H]− | 300.0987 | 299.0914 | 299.0914 | 0.1 | 284, 269, 225 | * Deu, Emu, Eau |
| 73 | Pseudobaptigenin | C16H10O5 | 19.160 | ** [M – H]− | 282.0506 | 281.0433 | 281.0431 | −0.7 | 263, 237 | * Dau, Aau |
| 74 | Dalbergin | C16H12O4 | 21.505 | [M – H]− | 268.0717 | 267.0644 | 267.0656 | 4.5 | 252, 224, 180 | * Deu, Ceu |
| 75 | 6″-O-Malonyldaidzin | C24H22O12 | 22.473 | [M + H]+ | 502.1085 | 503.1158 | 503.1149 | −1.8 | 255 | Bau |
| 76 | Genistein 4′,7-O-diglucuronide | C27H26O17 | 23.862 | ** [M – H]− | 622.1174 | 621.1101 | 621.1122 | 3.4 | 269 | Emu, Eeu, Dau, Cau, Bau, Aau |
| 77 | Glycitin | C22H22O10 | 30.888 | [M – H]− | 446.1206 | 445.1133 | 445.1124 | −2.0 | 285 | * Cethbu, Eabu |
| Other polyphenols | ||||||||||
| Hydroxycoumarins | ||||||||||
| 78 | Esculetin | C9H6O4 | 24.158 | [M – H]− | 178.0280 | 177.0207 | 177.0207 | 0.1 | 149, 133, 89 | Bau |
| 79 | Scopoletin | C10H8O4 | 31.117 | [M – H]− | 192.0419 | 191.0346 | 191.0347 | 0.5 | 176 | * Bethbu, Eeu, Eau, Bmu, Beu, Bau |
| Hydroxybenzoketones | ||||||||||
| 80 | 2-Hydroxy-4-methoxyacetophenone 5-sulfate | C9H10O7S | 24.081 | ** [M – H]− | 262.0155 | 261.0082 | 261.0081 | −0.4 | 181, 97 | * Aeu, Aau |
| Phenolic terpenes | ||||||||||
| 81 | Carnosic acid | C20H28O4 | 32.549 | ** [M – H]− | 332.2004 | 331.1931 | 331.1933 | 0.6 | 287, 269 | * Dethbu, Cethbu, Emu, Eau, Dmu, Deu, Dau, Ceu, Cethu, Cau, Bmu, Beu, Bethu, Bau, Amu, Aau |
| Tyrosols | ||||||||||
| 82 | 3,4-DHPEA-AC | C10H12O4 | 24.521 | [M – H]− | 196.0736 | 195.0663 | 195.0662 | −0.5 | 135 | Amu |
| 83 | 3,4-DHPEA-EDA | C17H20O6 | 29.370 | [M – H]− | 320.1270 | 319.1197 | 319.1192 | −1.6 | 275, 195 | * Aabu, Bmbu |
| Alkylmethoxyphenols | ||||||||||
| 84 | Equol | C15H14O3 | 16.915 | [M + H]+ | 242.0943 | 243.1016 | 243.1019 | 1.2 | 255, 211, 197 | * Emu, Eau, Dau |
| Other polyphenols | ||||||||||
| 85 | Salvianolic acid C | C26H20O10 | 16.686 | [M – H]− | 492.1026 | 491.0953 | 491.0976 | 4.7 | 311, 267, 249 | Embu |
| 86 | Arbutin | C12H16O7 | 19.621 | [M – H]− | 272.0901 | 271.0828 | 271.0827 | −0.4 | 109 | * Ceu, Cau |
| Lignans | ||||||||||
| 87 | Schisandrol B | C23H28O7 | 3.062 | ** [M – H]− | 416.1824 | 415.1751 | 415.1749 | −0.5 | 224, 193, 165 | Aebu |
| 88 | 7-Hydroxymatairesinol | C20H22O7 | 3.296 | ** [M – H]− | 374.1381 | 373.1308 | 373.1311 | 0.8 | 343, 313, 298, 285 | * Aebu, Eebu |
| 89 | Todolactol A | C20H24O7 | 16.242 | [M – H]− | 376.1546 | 375.1473 | 375.1469 | −1.1 | 313, 137 | * Ambu, Dmbu |
| 90 | Sesamin | C20H18O6 | 24.500 | ** [M – H]− | 354.1138 | 353.1065 | 353.1068 | 0.8 | 338, 163 | * Deu, Aabu, Babu |
| 91 | Arctigenin | C21H24O6 | 26.476 | [M – H]− | 372.1565 | 371.1492 | 371.1494 | 0.5 | 356, 312, 295 | * Embu, Eebu, Dmu, Dau, Cau, Aeu, Aau |
| 92 | Secoisolariciresinol-sesquilignan | C30H38O10 | 31.907 | [M – H]− | 558.2434 | 557.2361 | 557.2387 | 4.7 | 539, 521, 509, 361 | Amu |
| Stilbenes | ||||||||||
| 93 | Resveratrol | C14H12O3 | 17.529 | ** [M – H]− | 228.0787 | 227.0714 | 227.0717 | 1.3 | 212, 185, 157, 143 | * Eau, Deu, Dabu |
| 94 | Resveratrol 5-O-glucoside | C20H22O8 | 33.742 | [M – H]− | 390.1283 | 389.1210 | 389.1214 | 1.0 | 227 | Debu |
| No. | Proposed Compounds | Molecular Formula | RT (min) | Ionization (ESI+/ESI−) | Molecular Weight | Theoretical (m/z) | Observed (m/z) | Error (ppm) | MS2 Product Ions | Seaweed Samples |
|---|---|---|---|---|---|---|---|---|---|---|
| Phenolic acid | ||||||||||
| Hydroxybenzoic acids | ||||||||||
| 1 | Protocatechuic acid 4-O-glucoside | C13H16O9 | 3.062 | [M – H]− | 316.0818 | 315.0745 | 315.0751 | 1.9 | 153 | * Cethbc, Cebc, Debc, Dmbc |
| 2 | 4-Hydroxybenzoic acid 4-O-glucoside | C13H16O8 | 7.687 | [M – H]− | 300.0839 | 299.0766 | 299.0773 | 2.3 | 255, 137 | Dabc |
| 3 | 4-Hydroxybenzaldehyde | C7H6O2 | 25.146 | [M – H]− | 122.0366 | 121.0293 | 121.0294 | 0.8 | 77 | * Bethbc, Cmbc, Dabc, Dmbc |
| 4 | 2,3-Dihydroxybenzoic acid | C7H6O4 | 25.793 | [M – H]− | 154.0259 | 153.0186 | 153.0185 | −0.7 | 109 | Bethbc |
| 5 | 2-Hydroxybenzoic acid | C7H6O3 | 29.923 | [M – H]− | 138.0307 | 137.0234 | 137.0234 | 0.1 | 93 | Bethbc |
| 6 | Gallic acid | C7H6O5 | 31.949 | [M – H]− | 170.0209 | 169.0136 | 169.0140 | 2.4 | 125 | * Aec, Aac, Bac, Bec, Bethc, Bmc, Cec, Cac, Cethc, Dec, Dethc, Dmc, Aabc, Debc |
| 7 | 3-O-Methylgallic acid | C8H8O5 | 33.658 | [M – H]− | 184.0355 | 183.0282 | 183.0280 | −1.1 | 170, 142 | * Dec, Dethc, Dmc |
| Hydroxycinnamic acids | ||||||||||
| 8 | Chlorogenic acid | C16H18O9 | 3.078 | [M – H]− | 354.0969 | 353.0896 | 353.0902 | 1.7 | 253, 190, 144 | * Cabc, Eabc |
| 9 | 1-Sinapoyl-2,2′-diferuloylgentiobiose | C43H48O21 | 3.119 | [M – H]− | 900.2677 | 899.2604 | 899.2574 | −3.3 | 613, 201 | * Aebc, Debc |
| 10 | 3-Feruloylquinic acid | C17H20O9 | 4.687 | [M – H]− | 368.1081 | 367.1008 | 367.1012 | 1.1 | 298, 288, 192, 191 | Cmc |
| 11 | Ferulic acid 4-O-glucoside | C16H20O9 | 4.821 | [M – H]− | 356.1100 | 355.1027 | 355.1031 | 1.1 | 193, 178, 149, 134 | Eac |
| 12 | Feruloyl tartaric acid | C14H14O9 | 4.958 | [M – H]− | 326.0641 | 325.0568 | 325.0562 | −1.8 | 193, 149 | * Dac, Dethc, Eac |
| 13 | Caffeic acid | C9H8O4 | 5.116 | [M – H]− | 180.0431 | 179.0358 | 179.0359 | 0.6 | 143, 133 | Emc |
| 14 | Cinnamic acid | C9H8O2 | 7.400 | ** [M – H]− | 148.0523 | 147.0450 | 147.0451 | 0.7 | 103 | * Cmbc, Ambc |
| 15 | Caffeoyl glucose | C15H18O9 | 7.457 | [M – H]− | 342.0922 | 341.0849 | 341.0837 | −3.5 | 179, 161 | Eebc |
| 16 | p-Coumaric acid 4-O-glucoside | C15H18O8 | 15.736 | [M – H]− | 326.0993 | 325.0920 | 325.0920 | 0.1 | 163 | Bebc |
| 17 | 3-p-Coumaroylquinic acid | C16H18O8 | 16.364 | [M – H]− | 338.0974 | 337.0901 | 337.0900 | −0.3 | 265, 173, 162 | Dabc |
| 18 | p-Coumaroyl tartaric acid | C13H12O8 | 16.591 | [M – H]− | 296.0522 | 295.0449 | 295.0437 | −4.1 | 115 | Dmbc |
| 19 | Hydroxycaffeic acid | C9H8O5 | 17.250 | [M – H]− | 196.0376 | 195.0303 | 195.0304 | 0.5 | 151 | * Aabc, Bethbc, Dabc, Dethbc |
| 20 | Chicoric acid | C22H18O12 | 17.787 | [M – H]− | 474.0826 | 473.0753 | 473.0739 | −3.0 | 293, 311 | Eac |
| 21 | Rosmarinic acid | C18H16O8 | 18.986 | [M – H]− | 360.0823 | 359.0750 | 359.0753 | 0.8 | 179 | * Dmbc, Eabc, emc |
| 22 | Cinnamoyl glucose | C15H18O7 | 20.687 | [M – H]− | 310.1035 | 309.0962 | 309.0955 | −2.3 | 147, 131, 103 | * Dabc, Eabc |
| 23 | Sinapic acid | C11H12O5 | 22.780 | ** [M – H]− | 224.0674 | 223.0601 | 223.0598 | −1.3 | 205, 163 | * Cabc, Aabc, Ambc, Babc, Bebc, Bmbc, Cebc, Eabc, Eac |
| 24 | 1,5-Dicaffeoylquinic acid | C25H24O12 | 23.930 | [M – H]− | 516.1262 | 515.1189 | 515.1213 | 4.7 | 353, 335, 191, 179 | Eec |
| 25 | Caffeic acid 3-O-glucuronide | C15H16O10 | 24.346 | ** [M – H]− | 356.0756 | 355.0683 | 355.0674 | −2.5 | 179 | * Bmc, Bac, Dmc, Ambc, Dethbc |
| 26 | 1,2,2′-Triferuloylgentiobiose | C42H46O20 | 30.541 | [M – H]− | 870.2536 | 869.2463 | 869.2486 | 2.6 | 693, 517 | Aac |
| 27 | m-Coumaric acid | C9H8O3 | 32.821 | [M – H]− | 164.0477 | 163.0404 | 163.0408 | 2.5 | 119 | Eethc |
| 28 | Ferulic acid 4-O-glucuronide | C16H18O10 | 33.763 | [M + H]+ | 370.0902 | 371.0975 | 371.0974 | −0.3 | 193 | * Cebc, Dethbc |
| 29 | p-Coumaroyl malic acid | C13H12O7 | 34.094 | [M + H]+ | 280.0580 | 281.0653 | 281.0650 | −1.1 | 163, 119 | * Aebc, Ambc, Debc |
| Hydroxyphenylacetic acids | ||||||||||
| 30 | 2-Hydroxy-2-phenylacetic acid | C8H8O3 | 14.463 | [M – H]− | 152.0473 | 151.0400 | 151.0401 | 0.7 | 136, 92 | * Cmbc, Aabc, Cabc, Dabc, Eabc, Eethc, Dmc, Eac |
| 31 | 3,4-Dihydroxyphenylacetic acid | C8H8O4 | 15.889 | [M – H]− | 168.0426 | 167.0353 | 167.0354 | 0.6 | 149, 123 | * Aabc, Eethc |
| Hydroxyphenylpropanoic acids | ||||||||||
| 32 | Dihydroferulic acid 4-O-glucuronide | C16H20O10 | 3.064 | ** [M – H]− | 372.1073 | 371.1000 | 371.1004 | 1.1 | 195 | * Aabc, Aebc, Cabc, Cebc, Cmbc, Debc, Dmbc, Eabc, Aethbc, Dethbc |
| 33 | Dihydrocaffeic acid 3-O-glucuronide | C15H18O10 | 3.077 | ** [M – H]− | 358.0905 | 357.0832 | 357.0833 | 0.3 | 181 | * Aabc, Aebc, Eabc. Eebc, Aabc, Bac, Bec, Cmc |
| Flavonoids | ||||||||||
| Flavanols | ||||||||||
| 34 | (+)-Gallocatechin 3-O-gallate | C22H18O11 | 7.625 | [M – H]− | 458.0830 | 457.0757 | 457.0755 | −0.4 | 305, 169 | * Babc, Bebc, Cebc, Debc |
| 35 | Prodelphinidin dimer B3 | C30H26O14 | 16.094 | [M + H]+ | 610.1318 | 611.1391 | 611.1366 | −4.1 | 469, 311, 291 | Aebc |
| 36 | Theaflavin | C29H24O12 | 16.799 | [M – H]− | 564.1257 | 563.1184 | 563.1190 | 1.1 | 545 | * Dac, Emc, Embc |
| 37 | Procyanidin dimer B 1 | C30H26O12 | 18.209 | ** [M – H]− | 578.1444 | 577.1371 | 577.1378 | 1.2 | 451 | * Cabc, Aebc, Dethbc |
| 38 | (−)-Epigallocatechin | C15H14O7 | 21.155 | [M – H]− | 306.0764 | 305.0691 | 305.0697 | 2.0 | 261, 219 | * Aabc, Eabc |
| 39 | (+)-Catechin 3-O-gallate | C22H18O10 | 24.152 | [M – H]− | 442.0876 | 441.0803 | 441.0816 | 2.9 | 289, 169, 125 | Cac |
| 40 | Theaflavin 3,3′-O-digallate | C43H32O20 | 26.891 | [M – H]− | 868.1512 | 867.1439 | 867.1439 | 0.1 | 715, 563, 545 | Bac |
| 41 | 4″-O-Methylepigallocatechin 3-O-gallate | C23H20O11 | 28.257 | [M – H]− | 472.1005 | 471.0932 | 471.0923 | −1.9 | 169, 319 | * Cac, Bec, Debc |
| 42 | 4′-O-Methyl-(−)-epigallocatechin 7-O-glucuronide | C22H24O13 | 34.052 | ** [M – H]− | 496.1186 | 495.1113 | 495.1117 | 0.8 | 451, 313 | * Bmc, Bethc, Dmc, Cac, Dmc, Emc, Embc |
| Flavones | ||||||||||
| 43 | Apigenin 7-O-glucuronide | C21H18O11 | 20.616 | ** [M + H]+ | 446.0826 | 445.0753 | 445.0755 | 0.4 | 271, 253 | * Cac, Dmc, Emc, Aac, Dabc |
| 44 | Apigenin 7-O-(6″-malonyl-apiosyl-glucoside) | C29H30O17 | 20.668 | [M – H]− | 650.1509 | 649.1436 | 649.1445 | 1.4 | 605 | * Dmc, Aac |
| 45 | Apigenin 6-C-glucoside | C21H20O10 | 21.777 | [M – H]− | 432.1045 | 431.0972 | 431.0980 | 1.9 | 413, 341, 311 | * Dethc, Eec |
| 46 | Apigenin 7-O-apiosyl-glucoside | C26H28O14 | 22.663 | [M – H]− | 564.1524 | 563.1451 | 563.1459 | 1.4 | 296 | Eec |
| 47 | 3-Methoxysinensetin | C21H22O8 | 30.907 | [M – H]− | 402.1278 | 401.1205 | 401.1202 | −0.7 | 388, 373, 355, 327 | Dec |
| 48 | Apigenin 6,8-di-C-glucoside | C27H30O15 | 32.223 | [M – H]− | 594.1592 | 593.1519 | 593.1509 | −1.7 | 503, 473 | * Bac, Aec, Bec, Bethc |
| Flavanones | ||||||||||
| 49 | Hesperetin 3′-sulfate | C16H14O9S | 7.732 | [M – H]− | 382.0358 | 381.0285 | 381.0283 | −0.5 | 301, 286, 257, 242 | * Babc, Bebc, Cebc, Dmbc, Embc |
| 50 | Hesperetin 3′-O-glucuronide | C22H22O12 | 16.771 | [M – H]− | 478.1134 | 477.1061 | 477.1055 | −1.3 | 301, 175, 113, 85 | * Emc, Dac, Dmc, Dabc, Eabc, Eebc |
| 51 | Hesperetin 3′,7-O-diglucuronide | C28H30O18 | 18.725 | [M – H]− | 654.1415 | 653.1342 | 653.1356 | 2.1 | 477, 301, 286, 242 | Embc |
| 52 | Naringin 4′-O-glucoside | C33H42O19 | 30.498 | [M – H]− | 742.2314 | 741.2241 | 741.2258 | 2.3 | 433, 271 | Bec |
| 53 | Xanthohumol | C21H22O5 | 31.272 | [M – H]− | 354.1486 | 353.1413 | 353.1425 | 3.4 | 338, 309 | Aethc |
| Flavonols | ||||||||||
| 54 | Kaempferol 3-O-glucosyl-rhamnosyl-galactoside | C33H40O20 | 4.718 | [M – H]− | 756.2092 | 755.2019 | 755.2012 | −0.9 | 285 | Cmc |
| 55 | Kaempferol 3,7-O-diglucoside | C27H30O16 | 16.377 | [M – H]− | 610.1542 | 609.1469 | 609.1474 | 0.8 | 447, 285 | Amc |
| 56 | Isorhamnetin 3-O-glucuronide | C22H20O13 | 16.474 | [M – H]− | 492.0928 | 491.0855 | 491.0872 | 3.5 | 315, 300, 272, 255 | * Dac, Dmc |
| 57 | Myricetin 3-O-rhamnoside | C21H20O12 | 17.258 | [M – H]− | 464.0946 | 463.0873 | 463.0867 | −1.3 | 317 | * Dmc, Bac, Bec, Dmc, Eec, Emc |
| 58 | Quercetin 3-O-arabinoside | C20H18O11 | 18.213 | [M – H]− | 434.0837 | 433.0764 | 433.0772 | 1.8 | 301 | * Dac, Dmc |
| 59 | Myricetin 3-O-arabinoside | C20H18O12 | 18.941 | [M – H]− | 450.0825 | 449.0752 | 449.0741 | −2.4 | 317 | Dmc |
| 60 | 6-Hydroxyluteolin 7-rhamnoside | C21H20O11 | 19.191 | [M – H]− | 448.1003 | 447.0930 | 447.0933 | 0.7 | 301 | * Emc, Cac, Dac, Dethc, Eec, Emc, Cmbc, Eebc |
| 61 | Quercetin 3-O-(6”-malonyl-glucoside) | C24H22O15 | 23.143 | [M – H]− | 550.0977 | 549.0904 | 549.0886 | −3.3 | 303 | Bac |
| 62 | Myricetin 3-O-galactoside | C21H20O13 | 24.356 | [M – H]− | 480.0909 | 479.0836 | 479.0837 | 0.2 | 317 | * Emc, Bac, Bethc, Dmc |
| 63 | Quercetin 3-O-glucosyl-xyloside | C26H28O16 | 25.144 | [M – H]− | 596.1402 | 595.1329 | 595.1313 | −2.7 | 265, 138, 116 | Bac |
| 64 | Quercetin 3′-O-glucuronide | C21H18O13 | 31.165 | [M – H]− | 478.0785 | 477.0712 | 477.0717 | 1.0 | 301 | * Bec, Bac |
| 65 | Quercetin 3′-sulfate | C15H10O10S | 32.872 | [M – H]− | 382.0021 | 380.9948 | 380.9951 | 0.8 | 301 | * Bmc, Aec, Bethc, Dec, Eac |
| 66 | Quercetin 3-O-xylosyl-rutinoside | C32H38O20 | 33.752 | [M + H]− | 742.1933 | 743.2006 | 743.2003 | −0.4 | 479, 317 | Debc |
| Dihydroflavonols | ||||||||||
| 67 | Dihydroquercetin 3-O-rhamnoside | C21H22O11 | 19.734 | [M – H]− | 450.1147 | 449.1074 | 449.1077 | 0.7 | 303 | * Eec, Dethc, Dmc, Emc, Eabc, Dabc, Eabc |
| 68 | Dihydromyricetin 3-O-rhamnoside | C21H22O12 | 23.443 | [M – H]− | 466.1111 | 465.1038 | 465.1047 | 1.9 | 301 | * Emc, Dac, Dethc, Eec |
| Dihydrochalcones | ||||||||||
| 69 | 3-Hydroxyphloretin 2′-O-glucoside | C21H24O11 | 4.663 | [M – H]− | 452.1348 | 451.1275 | 451.1277 | 0.4 | 289, 273 | * Aac, Aec, Bec, Cac, Eec |
| Anthocyanins | ||||||||||
| 70 | Delphinidin 3-O-glucoside | C21H21O12 | 26.489 | [M – H]− | 465.1016 | 464.0943 | 464.0940 | −0.6 | 303 | Bac |
| 71 | Pelargonidin | C15H11O5 | 32.266 | [M – H]− | 271.0618 | 270.0545 | 270.0557 | 4.4 | 243, 197, 169, 141 | Eac |
| 72 | Cyanidin 3,5-O-diglucoside | C27H31O16 | 32.278 | [M + H]+ | 611.1632 | 612.1705 | 612.1711 | 1.0 | 449, 287 | * Aethbc, Bebc, Debc |
| 73 | Peonidin 3-O-diglucoside-5-O-glucoside | C34H43O21 | 33.383 | [M – H]− | 787.2331 | 786.2258 | 786.2246 | −1.5 | 625, 478, 317 | * Cethc, Dec |
| Isoflavonoids | ||||||||||
| 74 | 6″-O-Acetyldaidzin | C23H22O10 | 4.703 | [M – H]− | 458.1218 | 457.1145 | 457.1139 | −1.3 | 221 | Bmc |
| 75 | 5,6,7,3′,4′-Pentahydroxyisoflavone | C15H10O7 | 5.266 | [M – H]− | 302.0439 | 301.0366 | 301.0376 | 3.3 | 285, 257 | Amc |
| 76 | 2′,7-Dihydroxy-4′,5′-dimethoxyisoflavone | C17H14O6 | 6.882 | [M – H]− | 314.0767 | 313.0694 | 313.0698 | 1.3 | 300, 282 | * Eac, Eec |
| 77 | 6″-O-Malonylgenistin | C24H22O13 | 14.363 | ** [M + H]+ | 518.1069 | 517.0996 | 517.0997 | 0.2 | 271 | * Eac, Eac |
| 78 | 2-Dehydro-O-desmethylangolensin | C15H12O4 | 16.548 | [M – H]− | 256.0746 | 255.0673 | 255.0667 | −2.4 | 135, 119 | * Emc, Bmc |
| 79 | Sativanone | C17H16O5 | 16.563 | ** [M – H]− | 300.0994 | 299.0921 | 299.0923 | 0.7 | 284, 269, 225 | * Aec, Aac, Amc, Bec, Cac, Emc, Ambc |
| 80 | 6″-O-Malonylglycitin | C25H24O13 | 18.919 | [M – H]− | 532.1215 | 531.1142 | 531.1145 | 0.6 | 285, 270, 253 | * Emc, Eec |
| 81 | Formononetin 7-O-glucuronide | C22H20O10 | 21.977 | [M – H]− | 444.1048 | 443.0975 | 443.0972 | −0.7 | 267, 252 | * Cac, Eac |
| 82 | 2′-Hydroxyformononetin | C16H12O5 | 22.421 | [M + H]+ | 284.0694 | 285.0767 | 285.0764 | −1.1 | 270, 229 | * Dmc, Cac, Emc |
| 83 | Violanone | C17H16O6 | 24.296 | [M – H]− | 316.0921 | 315.0848 | 315.0842 | −1.9 | 300, 285, 135 | * Aebc, Ambc |
| 84 | Genistein 4′,7-O-diglucuronide | C27H26O17 | 25.445 | [M – H]− | 622.1114 | 621.1041 | 621.1067 | 4.2 | 269 | * Aac, Bec, Dethc, Debc |
| 85 | 6″-O-Malonyldaidzin | C24H22O12 | 33.752 | ** [M + H]+ | 502.1093 | 503.1166 | 503.1178 | 2.4 | 255 | * Debc, Dabc, Embc, Dac, Cac, Eac, Emc |
| Other polyphenols | ||||||||||
| Hydroxycoumarins | ||||||||||
| 86 | Esculetin | C9H6O4 | 24.191 | [M – H]− | 178.0248 | 177.0175 | 177.0171 | −2.3 | 149, 133, 89 | Bec |
| 87 | Scopoletin | C10H8O4 | 31.153 | [M – H]− | 192.0407 | 191.0334 | 191.0335 | 0.5 | 176 | * Babc, Aebc, Bebc, Bethbc, Bmbc, Dabc, Debc, Dmbc, Dmc, Bec, Bmc, Cac, Eec, Emc |
| Hydroxybenzaldehydes | ||||||||||
| 88 | p-Anisaldehyde | C8H8O2 | 30.932 | [M – H]− | 136.0516 | 135.0443 | 135.0442 | −0.7 | 122, 109 | * Bethc, Eac, Eec, Eethc, Emc |
| 89 | 3-Hydroxy-3-(3-hydroxyphenyl) propionic acid | C9H10O4 | 32.498 | [M – H]− | 182.0582 | 181.0509 | 181.0507 | −1.1 | 163, 135, 119 | Eac |
| Phenolic terpenes | ||||||||||
| 90 | Carnosic acid | C20H28O4 | 32.545 | [M – H]− | 332.1985 | 331.1912 | 331.1906 | −1.8 | 287, 269 | * Bac, Aac, Aec, Aethc, Amc, Bac, Bec, Bethc, Bmc, Cec, Dac, Dethc, Eec, Emc, Dethbc, Eabc |
| Tyrosols | ||||||||||
| 91 | 3,4-DHPEA-AC | C10H12O4 | 4.682 | [M – H]− | 196.0727 | 195.0654 | 195.0654 | 0.1 | 135 | Cac |
| 92 | Hydroxytyrosol 4-O-glucoside | C14H20O8 | 16.175 | [M – H]− | 316.1149 | 315.1076 | 315.1076 | 0.1 | 153, 123 | Cmbc |
| 93 | 3,4-DHPEA-EDA | C17H20O6 | 28.718 | [M – H]− | 320.1280 | 319.1207 | 319.1209 | 0.6 | 275, 195 | Bethbc |
| Alkylmethoxyphenols | ||||||||||
| 94 | Equol | C15H14O3 | 18.110 | ** [M + H]+ | 242.0943 | 243.1016 | 243.1014 | −0.8 | 255, 211, 197 | * Cabc, Amc, Aac, Aec, Eac, Eethc |
| Other polyphenols | ||||||||||
| 95 | Salvianolic acid B | C36H30O16 | 16.693 | [M – H]− | 718.1517 | 717.1444 | 717.1421 | −3.2 | 519, 339, 321, 295 | Embc |
| 96 | Lithospermic acid | C27H22O12 | 17.324 | ** [M – H]− | 538.1097 | 537.1024 | 537.1018 | −1.1 | 493, 339, 295 | * Eabc, Cabc, Cethbc, Dmc, Cec |
| 97 | Salvianolic acid C | C26H20O10 | 21.929 | [M – H]− | 492.1052 | 491.0979 | 491.0989 | 2.0 | 311, 267, 249 | * Debc, Dmbc |
| Lignans | ||||||||||
| 98 | Todolactol A | C20H24O7 | 16.368 | [M – H]− | 376.1539 | 375.1466 | 375.1470 | 1.1 | 313, 137 | * Debc, Embc |
| 99 | 7-Hydroxymatairesinol | C20H22O7 | 28.718 | ** [M – H]− | 374.1379 | 373.1306 | 373.1311 | 1.3 | 343, 313, 298, 285 | * Bethbc, Dabc, Eebc, aac |
| 100 | Arctigenin | C21H24O6 | 30.493 | [M – H]− | 372.1565 | 371.1492 | 371.1475 | −4.6 | 356, 312, 295 | Aethc |
| 101 | Secoisolariciresinol-sesquilignan | C30H38O10 | 30.674 | [M – H]− | 558.2463 | 557.2390 | 557.2390 | 0.1 | 539, 521, 509, 361 | Aec, debc |
| 102 | 7-Oxomatairesinol | C20H20O7 | 32.347 | [M + H]+ | 372.1184 | 373.1257 | 373.1256 | −0.3 | 358, 343, 328, 325 | * Babc, Bebc, Bethbc, Cmbc |
| 103 | Sesamin | C20H18O6 | 32.442 | [M – H]− | 354.1124 | 353.1051 | 353.1061 | 2.8 | 338, 163 | Eec |
| Stilbenes | ||||||||||
| 104 | Resveratrol 5-O-glucoside | C20H22O8 | 16.382 | [M – H]− | 390.1310 | 389.1237 | 389.1234 | −0.8 | 227 | Embc |
Disclaimer/Publisher’s Note: The statements, opinions and data contained in all publications are solely those of the individual author(s) and contributor(s) and not of MDPI and/or the editor(s). MDPI and/or the editor(s) disclaim responsibility for any injury to people or property resulting from any ideas, methods, instructions or products referred to in the content. |
© 2023 by the authors. Licensee MDPI, Basel, Switzerland. This article is an open access article distributed under the terms and conditions of the Creative Commons Attribution (CC BY) license (https://creativecommons.org/licenses/by/4.0/).
Share and Cite
Subbiah, V.; Ebrahimi, F.; Agar, O.T.; Dunshea, F.R.; Barrow, C.J.; Suleria, H.A.R. Comparative Study on the Effect of Phenolics and Their Antioxidant Potential of Freeze-Dried Australian Beach-Cast Seaweed Species upon Different Extraction Methodologies. Pharmaceuticals 2023, 16, 773. https://doi.org/10.3390/ph16050773
Subbiah V, Ebrahimi F, Agar OT, Dunshea FR, Barrow CJ, Suleria HAR. Comparative Study on the Effect of Phenolics and Their Antioxidant Potential of Freeze-Dried Australian Beach-Cast Seaweed Species upon Different Extraction Methodologies. Pharmaceuticals. 2023; 16(5):773. https://doi.org/10.3390/ph16050773
Chicago/Turabian StyleSubbiah, Vigasini, Faezeh Ebrahimi, Osman T. Agar, Frank R. Dunshea, Colin J. Barrow, and Hafiz A. R. Suleria. 2023. "Comparative Study on the Effect of Phenolics and Their Antioxidant Potential of Freeze-Dried Australian Beach-Cast Seaweed Species upon Different Extraction Methodologies" Pharmaceuticals 16, no. 5: 773. https://doi.org/10.3390/ph16050773