Article

Acyl Hydrazides and Acyl Hydrazones as High-Performance Chemical Exchange Saturation Transfer MRI Contrast Agents

1
Department of Medical Imaging, The Affiliated Guangdong Second Provincial General Hospital of Jinan University, Guangzhou 510317, China
2
Medical Imaging Center, The First Affiliated Hospital of Jinan University, Guangzhou 510632, China
3
The Russell H. Morgan Department of Radiology and Radiological Science, The Johns Hopkins University School of Medicine, Baltimore, MD 21287, USA
4
F.M. Kirby Research Center for Functional Brain Imaging, Kennedy Krieger Institute, Baltimore, MD 21287, USA
*
Authors to whom correspondence should be addressed.
These authors contributed equally to this work.
Pharmaceuticals 2023, 16(5), 639; https://doi.org/10.3390/ph16050639
Submission received: 13 March 2023 / Revised: 17 April 2023 / Accepted: 20 April 2023 / Published: 23 April 2023
(This article belongs to the Special Issue Next-Generation Contrast Agents for Medical Imaging)

Abstract

:
Chemical exchange saturation transfer (CEST) MRI is a versatile molecular imaging approach that holds great promise for clinical translation. A number of compounds have been identified as suitable for performing CEST MRI, including paramagnetic CEST (paraCEST) agents and diamagnetic CEST (diaCEST) agents. DiaCEST agents are very attractive because of their excellent biocompatibility and potential for biodegradation, such as glucose, glycogen, glutamate, creatine, nucleic acids, et al. However, the sensitivity of most diaCEST agents is limited because of small chemical shifts (1.0–4.0 ppm) from water. To expand the catalog of diaCEST agents with larger chemical shifts, herein, we have systematically investigated the CEST properties of acyl hydrazides with different substitutions, including aromatic and aliphatic substituents. We have tuned the labile proton chemical shifts from 2.8–5.0 ppm from water while exchange rates varied from ~680 to 2340 s−1 at pH 7.2, which allows strong CEST contrast on scanners down to B0 = 3 T. One acyl hydrazide, adipic acid dihydrazide (ADH), was tested on a mouse model of breast cancer and showed nice contrast in the tumor region. We also prepared a derivative, acyl hydrazone, which showed the furthest shifted labile proton (6.4 ppm from water) and excellent contrast properties. Overall, our study expands the catalog of diaCEST agents and their application in cancer diagnosis.

1. Introduction

Magnetic resonance imaging (MRI) has become an essential diagnostic modality since its initial introduction into clinical practice in the 1980s [1]. Approximately 1/3 of all MRI scans require contrast agents to highlight pathology and utilize relaxation-based agents which alter the longitudinal (T1) or transverse (T2) magnetic resonance relaxation times of water. Chemical exchange saturation transfer (CEST) MRI is an alternative method based on contrast mechanisms, which is “switched on” by applying selective saturation using radiofrequency pulse(s) at the frequency of labile protons on solute molecules which exchange with water [2]. This saturation and exchange mechanism results in large signal amplifications enabling the detection of low-concentration biomolecules and synthetic molecules (in the high μM to low mM concentration range) at high spatial resolutions [3]. CEST MRI has attracted a number of researchers because of its unique features detecting probe accumulation in malignancies after enzyme action [4,5,6], detecting metabolism of drugs which switches on contrast [7,8], and detecting changes in pH related to lose in organ function [9,10,11,12,13,14,15]. As part of this effort, a number of compounds have been reported with excellent properties for detection via CEST, including paramagnetic CEST (paraCEST) agents [16,17,18,19,20,21] and diamagnetic CEST (diaCEST) agents [22,23,24,25,26,27,28,29].
ParaCEST agents possess labile protons with large chemical shifts and can respond to various metabolites, making them excellent environmental sensors [30]. Enlarged chemical shift allows using higher saturation powers upon irradiation of exchangeable protons while still avoiding signal attenuation due to conventional magnetization transfer (MT) or direct saturation of water [31]. However, nephrogenic fibrosis concerns from paramagnetic ions and the low sensitivity of paraCEST agents in vivo have somewhat limited their applications. The nephrogenic fibrosis from paramagnetic probes can be reduced by introducing good chelating systems like the macrocycles, which is a rule to design new paraCEST agents with lower toxicity [32]. DiaCEST agents are very attractive because of their excellent biocompatibility and potential for biodegradation, and they can be naturally occurring compounds or unnatural and synthesized compounds [23,33,34,35,36,37]. Naturally occurring compounds usually possess small labile proton chemical shifts (usually 1–4 ppm), which has limited their sensitivity. To exhibit CEST MRI contrast, the exchange rate (kex) is preferably less than the difference in chemical shift between the exchangeable protons and the water protons (Δω): Δω ≥ kex. The chemical and physical environment (hydrogen bond, pH, temperature) will have a great influence on both chemical shift and kex. Exemplary structures include phenol in salicylic acid [3] and amine in imidazole derivatives [38], which can result in larger labile proton chemical shifts of 9.3 ppm and 7.8 ppm because of intramolecular hydrogen bonding. To expand the scope of CEST MRI applications, it would be of great importance to develop novel diaCEST agents with large labile proton chemical shifts and suitable exchange rates.
Herein, we show that acyl hydrazides can display excellent properties as CEST agents. Acyl hydrazides are organic molecules containing the active functional group (-C(=O)-NHNH2) [39], which are widely present in many drugs approved by the Food and Drug Administration (FDA) [40,41]. Previous studies have reported that CEST contrast agents can be “turned on” by the Hydrazo-CEST effect [22,27]. In this study, we systematically investigated the CEST properties of a series of acyl hydrazides with different substitutions and how this impacts their CEST properties, as well as the preparation of an acyl hydrazone derivative with larger chemical shifts (6.4 ppm) from water by reaction with aldehydes (Scheme 1). We selected one of the best acyl hydrazides and evaluated its uptake in the tumor region using CEST MRI, which showed nice CEST contrast. Hence, our study can lead to the development of new diaCEST agents as well as their application in cancer diagnosis.

2. Results

2.1. CEST Properties of Aromatic Acyl Hydrazides

We originally decided to investigate the CEST properties of a series of aromatic acyl hydrazides based on detecting the strong contrast of the anthranilates previously [3] with these compounds listed in Scheme 2. The proton kex with water was measured using the quantitation of exchange using a saturation power (QUESP) experiment [42]. While 2-hydrazinobenzoic acid 1, with an -NHNH2 and carboxylic acid as an adjacent substituent on the benzene ring, showed no CEST signal above +1.0 ppm (Figure S2a), benzoic hydrazide 2 with a benzoyl group attached to -NHNH2, displays a strong CEST signal at 4.6 ppm downfield from water (17%, Figure 1a), indicating that acyl hydrazide groups can produce CEST contrast. We then tested a series of compounds to further clarify how well this contrast could be tuned. Switching the carbonyl for a sulfonyl group results in no CEST signal, (benzenesulfonyl hydrazide 3, Figure S2b). We attribute this to the electron-withdrawing effect of the benzenesulfonyl group being stronger than that of the benzoyl group. Isoniazid 4, an FDA-approved antibacterial prescription medicine for the prevention and treatment of tuberculosis, has a similar structure to 2; however, it showed no CEST contrast, and neither did nicotinic hydrazide 5 (Figure S2c,d). 2-picolinyl hydrazide 6 with its nitrogen on a pyridine ring available for hydrogen bonding with the amide group [43], displayed a CEST contrast of 5.0 ppm downfield from water (Figure 1b). Picolinamide 7 also shows CEST signal at 4.4 ppm (Figure S2e). Hydrazide 8 with a -CF3 group at the 2-position on the benzene ring showed a lower contrast at 4.8 ppm than 2 (Figure S2f) but a faster kex (2340 s−1). However, the -CF3 group on the meta- or para-position leads to bad water solubility of hydrazide 8 isomers with no CEST data. Collectively, these results indicate that hydrazides are suitable groups for CEST contrast and that electron-withdrawing substitution and hydrogen bonding could be used to tune the proton kex of NH.

2.2. CEST Properties of Aliphatic Acyl Hydrazides

Based on the success of our aromatic hydrazides, we further explored the CEST properties of aliphatic acyl hydrazides (Scheme 3). Acethydrazide 9 showed 19% contrast at 4.0 ppm (Figure 1c) with a well-tuned exchange (kex = 1732 s−1). Carbohydrazide 10 with two –NHNH2 groups possesses lower shifted labile protons at 2.8 ppm (Figure 2d) and slower exchange (kex = 680 s−1). Two –NHNH2 group adjacent to the carbonyl group reduced the could reduce the electron-withdrawing effect of the carbonyl group, leading to a smaller chemical shift of the amide group. Adipic acid dihydrazide (ADH) 11, which is usually used as a homobifunctional cross-linking reagent, showed CEST contrast at 4.4 ppm (Figure 1e) with kex = 1140 s−1. When the methyl group on 9 was substituted with the trifluoromethyl group (12), no CEST contrast was observed (Figure S3a), while if a hydroxyl group is added adjacent to the carbonyl group, 2-hydroxyethanehydrazide 13, there is similar CEST contrast and kex to 9 although the proton is slightly further shifted (Figure 1f). A similar contrast is also seen when a phenyl ring is attached (14, Figure S3b). However, when there is amino group substitution on the methyl adjacent to the carbonyl group, serine hydrazide 15 and L-tyrosine hydrazide 16 showed no CEST signal (Figure S2c,d). We postulate that this is due to the electron donation of the amine group, which influences the inductive effect of the carbonyl group. In summary, a wide range of aliphatic acyl hydrazides displays strong CEST contrast because of their suitable kex. ADH (11), 7, and 14 are the best three CEST agents which display strong CEST contrast > 4 ppm from water and suitable kex between 1000–2000 s−1 for detection on 3 T scanners as described previously [44].

2.3. In Vitro and In Vivo CEST MRI of ADH

Then, we decided to further explore ADH’s suitability as a CEST agent. First, we prepared solutions at different pH values and measured their CEST contrast efficiency at 37 °C (Figure 2a,b). The results showed that the CEST contrast and kex did not change too much until pH was ≤6.0, which is because the CEST contrast depends on the amide bond. The stability of this amide bond on ADH is broken when pH is ≤6.0, which results in a decrease in CEST contrast for ADH (Figure 2b). The kex was below the chemical shift difference at 9.4 T (Δω = 1760 Hz), placing these rates in the slow exchange regime and making ADH well-suited for in vivo CEST imaging. We also performed 4T1 cell toxicity studies on ADH testing a range of concentrations of ADH up to 100 mM. As can be seen in Figure S1, ADH was well tolerated and displayed no significant cell toxicity, even at the highest concentration. In addition, it has a small molecular weight and high water solubility, and the contrast is fairly insensitive to pH, making ADH an excellent contrast agent for depicting perfusion imaging but not for measuring pH.
Based on the excellent CEST properties of ADH, we decided to test it’s in vivo performance in a mouse model of breast cancer. We injected ADH (500 mM in PBS, 100 μL) into 4T1 tumor-bearing mice and acquired dynamic CEST MRI data on a single axial slice near the center of the tumor to characterize tumor uptake for up to 34 min after intravenous injection. Figure 3 displays the images and MTRasym spectra for two representative mice. As can be seen, an increase in CEST MRI contrast was observed in all mice with an average difference in CEST MRI tumor contrast at Δω = 4.4 ppm post minus pre-injection at (MTRasym) = 1.5%, rmsd = 0.3 for n = 5 mice at 34 min post-injection. These data indicate that ADH can be used as CEST contrast agent for depicting perfusion differences found in tumor tissue.

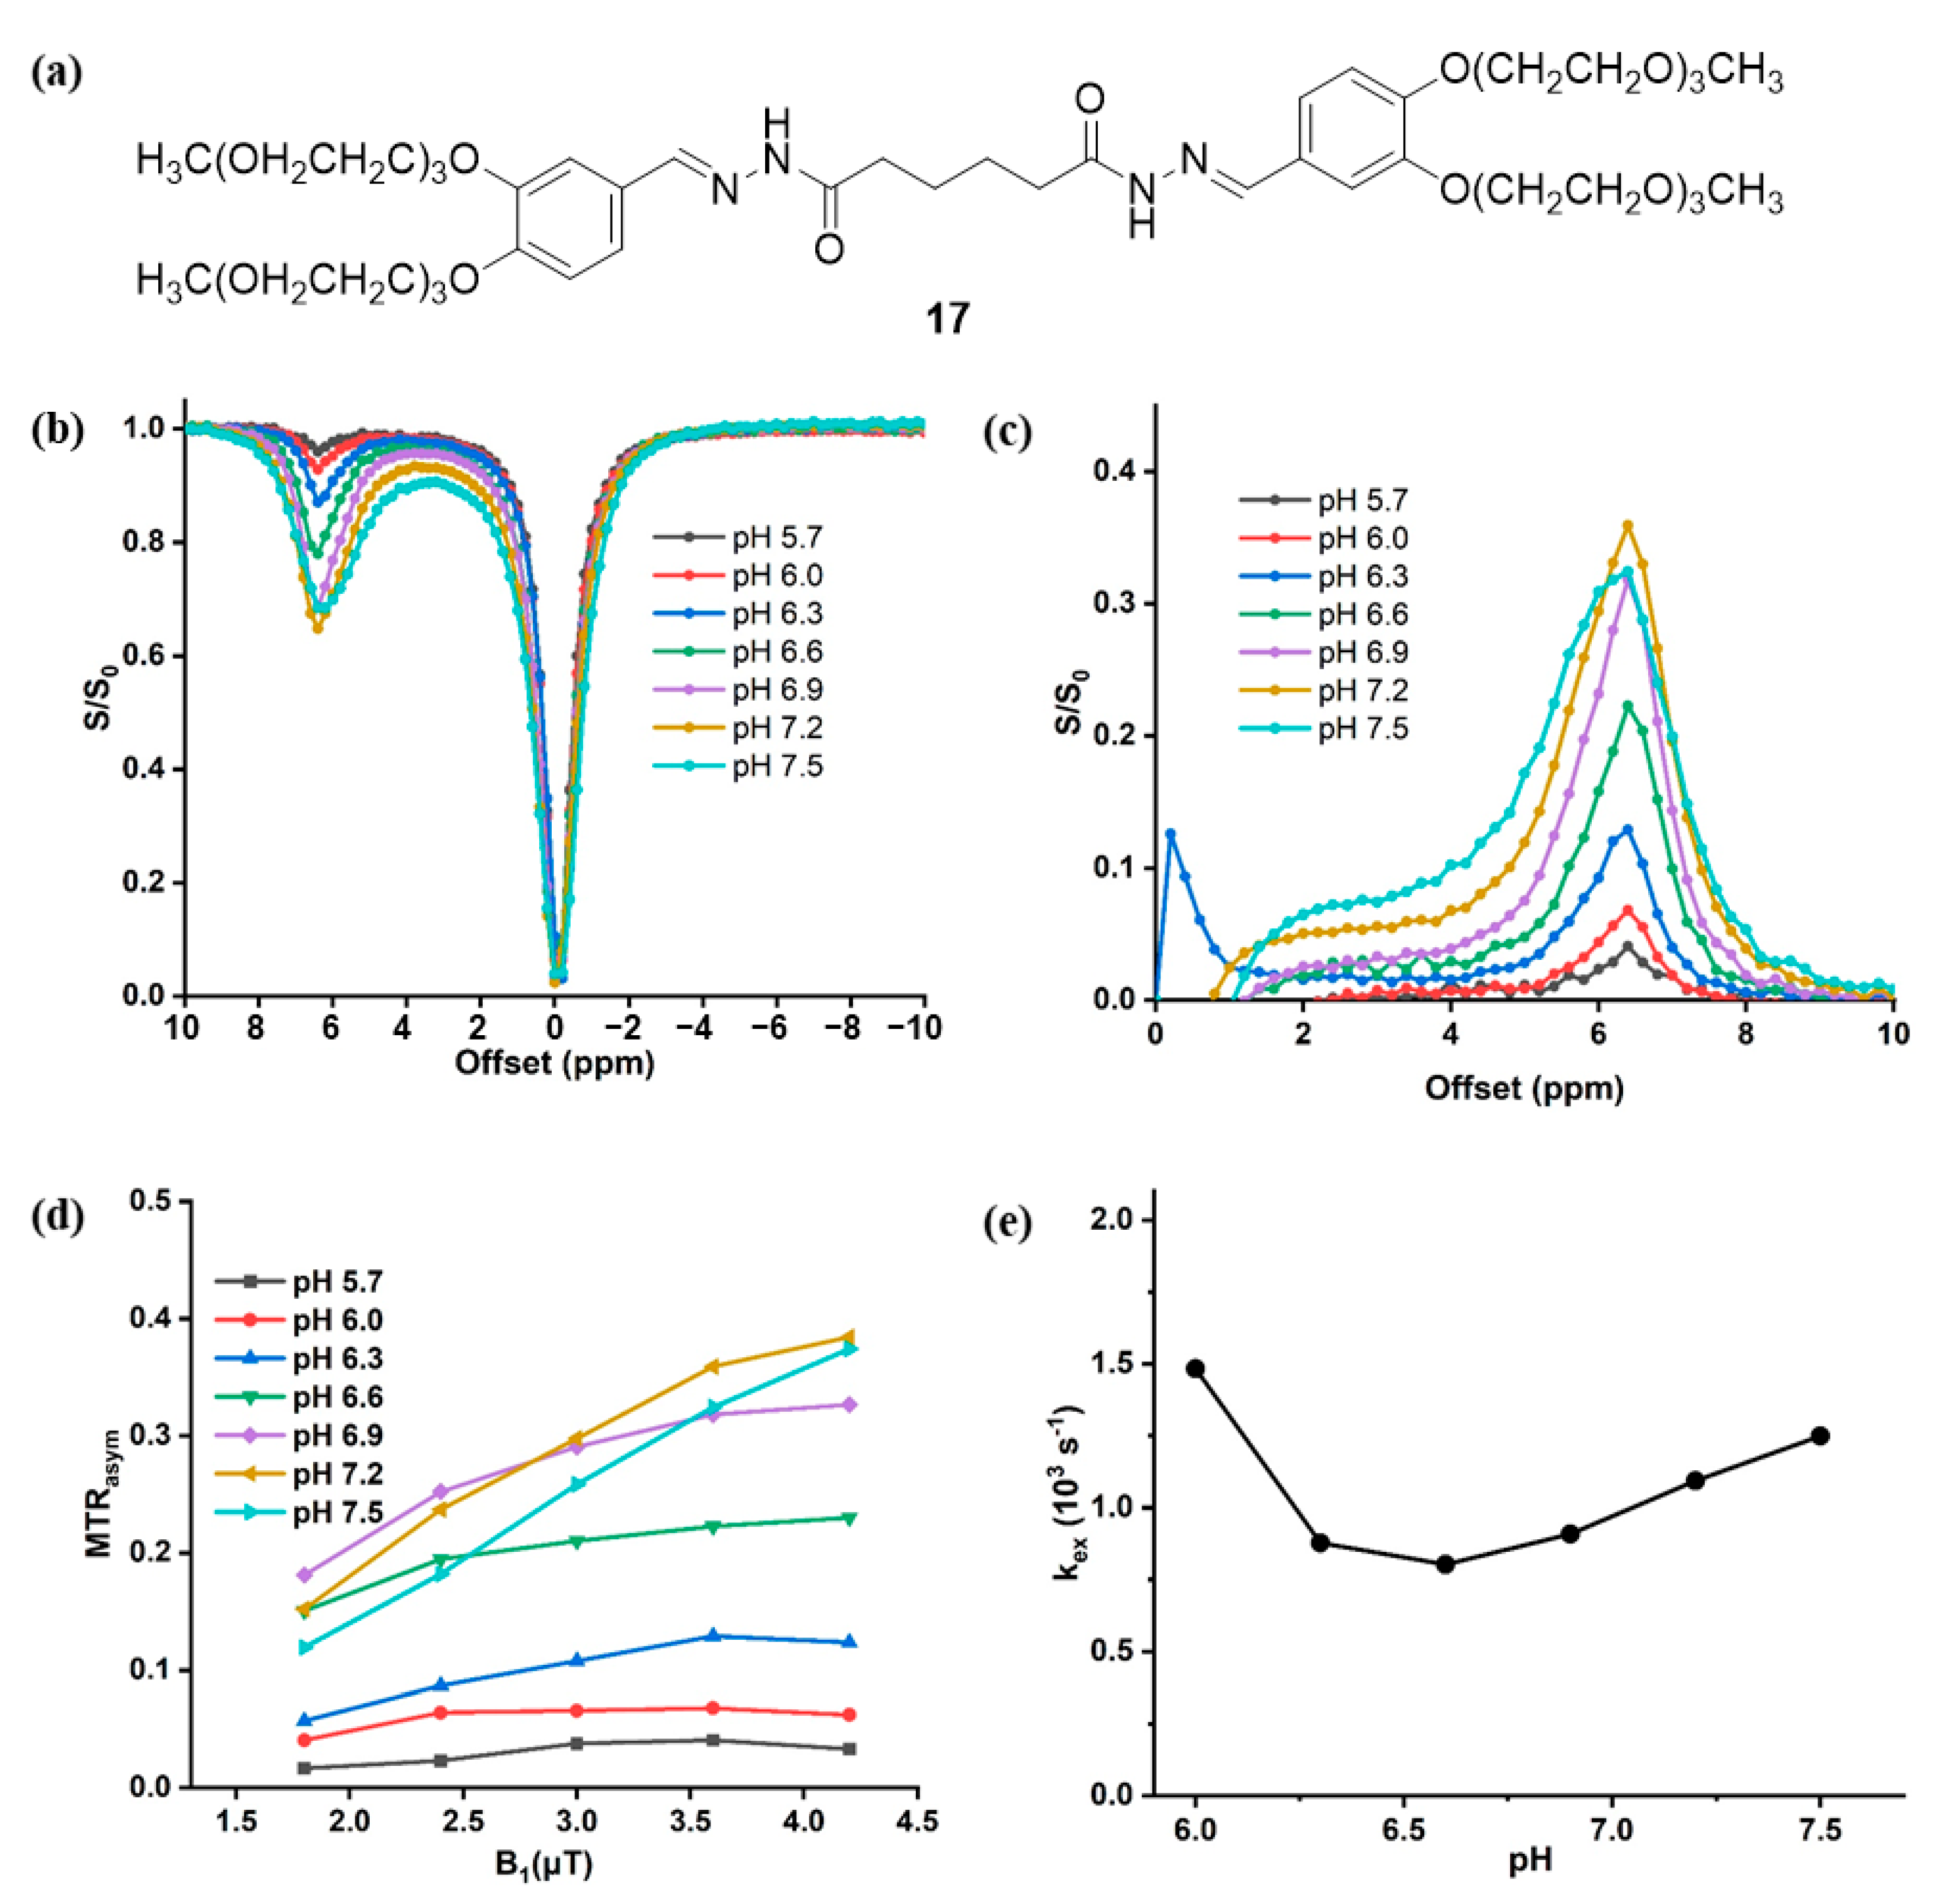
2.4. In Vitro CEST Properties of Acyl Hydrazone 17

Acyl hydrazones are products obtained by condensation of acyl hydrazides with corresponding aldehydes or ketones [45]. Over the last twenty years, acyl hydrazone has been proven to be a very versatile and promising motif in drug design and medicinal chemistry with multiple specific functions [46,47]. The acyl hydrazone group can form p-π conjugation, which makes the intramolecular hydrogen bonding stable. Based on this, we synthesized one acyl hydrazone derivative (17, Figure 3a) using ADH and hydrophilic aldehyde 18 (Scheme 4) with a 78% yield. The polyethylene glycol (PEG) chains were attached to the compound to improve the water solubility and biocompatibility. As can be seen in Figure 4a,b, 17 displays a strong CEST signal at 6.4 ppm, which is similar to the previously reported hydrazone agents based on phenyl hydrazine [22,27]. Z-spectra and MTRasym spectra show that the signal intensity of 17 decreases with increasing pH. The kex decreased from pH 6.0 (1480 s−1) to pH 6.6 (803 s−1) and increased from pH 6.6 to pH 7.5 (1250 s−1) (Figure 4c,d). As this shows, the acyl hydrazone moiety is promising to incorporate into CEST contrast agents and displays contrast at larger chemical shifts (>6 ppm).

3. Discussion

Dynamic contrast-enhanced (DCE) MRI is widely used in clinical practice for visualizing tumors and monitoring multiple sclerosis. DCE MRI based on CEST contrast has the potential for enabling tumor detection and visualizing physiological and morphological changes in tumor tissue and has potential as an alternative to gadolinium. Injection of gadolinium-based contrast agents presents some risk for nephrogenic systemic fibrosis in patients with severe chronic kidney disease [48] and can accumulate in tissue [49] as well. DiaCEST agents have shown excellent potential for clinical translation based on a number of compounds possessing suitable biocompatibility and the implementation of CEST imaging sequences on General Electric, Siemens, and Philips Healthcare clinical scanners. Glucose and its derivatives are currently being evaluated for cancer imaging by a number of groups [50,51,52,53,54]; however, the small labile chemical shift (around 1.0 ppm) of these sugars leads to lower amplification factors in a region with a lot of other endogenous contrast limiting their detection sensitivity. In this study, we identified acyl hydrazones and acyl hydrazides with larger labile proton shifts (in the range of 2.8–5.0 ppm), which display strong CEST signals based on their moderate chemical exchange rates with water. Indeed, the N-acyl hydrazone scaffold has been identified as a promising motif in drug design and medicinal chemistry [45] based on the ease of synthesis and the clinical usage of several of these compounds for fighting bacterial infections, as hemostatic agents and to treat hyperthermia. Hydrazide analogs are used as antifungal, antibacterial, antiviral, and anticancer agents [55]. Furthermore, many also possess good water solubility and are highly biocompatible, enabling injections of high concentrations. Because of all these features, this scaffold has advantages over other NH- and NH2-based CEST agents, which are less biocompatible [24,25,38,56], which poses some challenges for the high doses required by the CEST technique.
We discovered ADH to be particularly well-suited for CEST imaging. Because of the large proton chemical shift (4.4 ppm), stronger saturation pulses can be utilized than those used on glucose. ADH is also very well tolerated with an oral LD50 of 5000 mg/kg for rats [57]. We observed no adverse reactions in our mice at the much lower imaging dosage of ADH (~290 mg/kg). In addition, the CEST contrast of ADH does not change between 6.1 > pH > 7.0, which makes it insensitive to pH over a wide range allowing for direct linkage between contrast changes to agent and concentration changes. The large chemical shift at 4.4 ppm and exchange rate in the slow-intermediate exchange regime make ADH a nice CEST contrast agent which should be readily detected on 3T scanners, and the in vivo imaging showed nice CEST contrast from ADH in tumors, indicating its potential in cancer imaging.
Furthermore, acyl hydrazones are a viable scaffold of CEST agents, which can possess larger chemical shifts (>6.0 ppm) than previously reported hydrazone compounds [27]. These have the additional advantage of simple synthesis from acyl hydrazides. These can also form gels at room temperature, as reported previously for two functionalized hyaluronic acid (HA) derivatives containing aldehyde (HA-aldehyde) or hydrazide (HA-hydrazide) [58,59]. However, in this article, they only mentioned the CEST effect from the -OH group at 1.0 ppm and not at 4.4 ppm or 6.4 ppm, which may be due to the low substitution of acyl hydrazide on HA to show visible CEST contrast at 4.4 or 6.4 ppm. Because of the simple synthesis and pH dependence of acyl hydrazone, this group could be applied to designing new pH sensors with larger chemical shifts with another labile proton incorporated to allow ratiometric measurements [38].
Our study, however, has several limitations. First, we only investigated a small subset of acyl hydrazides for their CEST properties. Strong electron withdrawing substitutions or amino next to the carbonyl group on acyl hydrazides could have a big impact on CEST contrast, for example, so we will need to test a larger library of hydrazones and hydrazides to fully understand how substitution will impact CEST contrast and identify the best probes. Second, in this study, we selected just one compound (ADH) to evaluate a mouse model of breast cancer and collected it’s in vivo CEST MRI over 34 min on a single slice instead of carrying out a detailed pharmacokinetic study. More types of acyl hydrazides should be evaluated in vivo as well. Though ADH was very well tolerated by mice during the imaging experiments, we will carefully test organ toxicity in the future. Third, acyl hydrazone showed great promise as a CEST agent with a large labile proton chemical shift (>6.0 ppm). Its biocompatibility and in vivo applications in cancer diagnosis were not investigated in this study as for pH imaging, an additional CEST active group with a different labile proton shift should be conjugated, which will be the subject of future investigations. Nevertheless, our work displays the promise of this scaffold for medical applications.

4. Materials and Methods

4.1. General Information and Chemistry

1H and 13C NMR spectra were recorded on a 300 MHz Bruker NMR spectrometer. Chemical shifts are in ppm, and coupling constants (J) are in Hertz (Hz). 1H NMR spectra were referenced to tetramethylsilane (d, 0.00 ppm) using CDCl3 as solvent. 13C NMR spectra were referenced to solvent carbons (77.16 ppm for CDCl3). The splitting patterns for 1H NMR spectra are denoted as follows: s (singlet), d (doublet), t (triplet), q (quartet), and m (multiplet). Mass spectra were recorded on an ESI mass spectrometer for compounds below 3000 Da.
All reagents were obtained from commercial suppliers and used without prior purification. Compounds 1, 5, 8, 12, 13, and 14 were purchased from Bide Pharmatech (Shanghai, China). Compounds 2, 6, 7, 15, and 16 were obtained from Aladdin (Shanghai, China). Compounds 3, 4, 9, 10, and 11 were obtained from Macklin Biochemical Technology (Shanghai, China). All solvents were analytical or HPLC grade. Deionized water was used unless otherwise indicated.

4.2. Synthesis of Acyl Hydrazone 17

ADH (348 mg, 2.0 mmol) was dissolved with 20 mL of anhydrous ethanol in a round bottle. Aldehyde (synthesized according to the literature [60], 1.72 g, 4.0 mmol) was dissolved in 20 mL anhydrous ethanol was added slowly. The mixture was refluxed for 6 h. The solvent was removed, and the crude product was purified by column chromatography on silica gel (CH2Cl2/MeOH = 20/1) to afford acyl hydrazone 17 as white waxy solid (1.53 g, 78% yield), 1H NMR (300 MHz, D2O) δ 7.26 (s, 2H), 7.21 (s, 2H), 6.95 (d, J = 9.0 Hz, 2H), 6.75 (d, J = 9.0 Hz, 2H), 3.96–4.00 (m, 8H), 3.70–3.73 (m, 8H), 3.58–3.60 (m, 8H), 3.49–3.55 (m, 16H), 3.42–3.46 (m, 8H), 2.19 (s, 4H), 1.56 (s, 4H). 13C NMR (75 MHz, D2O) δ 171.9, 149.9, 149.1, 147.7, 126.6, 123.3, 112.7, 110.2, 71.0, 69.9, 69.8, 69.6, 69.5, 68.9, 68.8, 67.9, 58.0, 33.8, 24.8. HRMS calcd for C48H79N4O18+ ([M + H]+) 999.5384, found 999.5369.

4.3. Phantom Preparation and In Vitro CEST MRI

Acyl hydrazides and acyl hydrazone were dissolved in 0.01M phosphate-buffered saline (PBS) at different concentrations and titrated to various pH values ranging from 5.7 to 7.5. The samples were kept at 37 °C during imaging. In vitro CEST MRI experiments were performed on a horizontal bore 9.4 T Bruker Biospec system (Bruker, Ettlingen, Germany). For phantoms, a transmit-receive volume coil with an inner diameter of 40 mm was used. CEST images were acquired using a continuous-wave RF saturation pulse of 3s followed by a RARE imaging sequence. CEST data were acquired using six different saturation power (B1) from 1.8, 2.4, 3.0, 3.6, 4.2, and 4.8 μΤ. One hundred two offsets between ±10 ppm were acquired with a 0.2 ppm stepsize to produce saturation images, plus one at +40 ppm. Other imaging sequence parameters: matrix size 64 × 64; slice thickness 1.5 mm; TR/TE 6000/4.6 ms. For B0 inhomogeneity calculation, water saturation shift referencing (WASSR) images were acquired using B1 = 0.5 μΤ with 31 offsets from −1.5 to +1.5 ppm with a 0.1 ppm stepsize.

4.4. In Vivo CEST MRI of 4T1 Tumor Mice Model

All animal experiments were performed under a protocol approved by the Jinan University Animal Care and Use Committee. Tumor xenografts of murine 4T1 breast cancer were established in three 4-week-old female Balb/c nude mice (Charles River Laboratories) through the subcutaneous injection of 2 × 10⁶ cells suspended in PBS above the rear right flank. Two to three weeks after cell injection, CEST MRI imaging was performed. In vivo CEST MRI data were collected on a horizontal bore 9.4 T Bruker Biospec system (Bruker, Ettlingen, Germany). Prior to imaging, the tail vein was cannulated, permitting intravenous injection in the MRI scanner. Mice were warmed, and their respiration rate was monitored throughout the duration of the imaging experiment. A T2w image was obtained using a multi-slice RARE sequence. RARE factor = 8, TR/TE = 2 s/20 ms, field of view = 28 mm2 × 20 mm2, matrix size = 256 × 256, slice thickness 1.5 mm. For CEST data acquisition, 4 s long cw saturation pulses were applied with B1 = 3.6 μΤ using 31 offsets from −7.0 to +7.0 ppm with stepsize 0.2 ppm and one offset of +40 ppm for 72 offsets. WASSR images were collected for generating B0 maps using 31 offsets from −1.5 to +1.5 ppm with stepsize 0.1 ppm and B1 = 0.5 μT. After completion of the initial Z-spectrum, the mouse was injected with 100 μL of 500 mM (~435 mg/kg) ADH, and the line was flushed with 100 μL saline. No adverse events were noted in any of the mice receiving ADH injections. Post-contrast Z-spectra were acquired sequentially up to 34 min post-injection. The time taken for each set of 72 offsets was 8 min and 24 s, and the other sequence parameters were as follows: TR/TE 7000/4.6 ms; number of averages = 1; matrix size = 64 × 64; field of view 28 mm2 × 20 mm2.

4.5. CEST Data Analysis

All post-processing was performed using custom-written script implemented in MATLAB (MathWorks, Natick, Massachusetts). Saturation transfer (ST) contrast was calculated by applying magnetization transfer ratio asymmetry analysis with MTRasym = (S(−Δω) − S(+Δω))/S0, where S+Δω and S−Δω were the MRI signals with RF irradiation at particular offsets +Δω and –Δω, respectively, and S0 is the signal acquired without RF saturation. Both S+Δω and S−Δω were corrected pixel-wise for B0 inhomogeneity using the WASSR method as described previously [61].
The exchange rates for the labile protons were estimated using the quantifying exchange using saturation power (QUESP) method as described previously [42]. In brief, the measured MTRasym values at the maximum CEST offsets for the set of 6 saturation field strengths were fit numerically using the Bloch equations to estimate the exchange rates (kex).

4.6. In Vitro Cellular Cytotoxicity Assay

4T1 cells were cultured in completed RPMI 1640 media (10% fetal bovine serum) and seeded into 96-well plates (100 μL/well) at a density of 1× 10⁴ cells per well for 24 h at 37 °C and in an atmosphere of 5% CO2. Then, the medium was removed and the cells were washed with PBS (×2). Afterward, the cells were exposed to different concentrations of ADH (0, 6.25, 12.5, 25, 50, 100 mM) in each well. The cells were grown for a further 24 h. Then a standard CCK-8 assay was carried out to evaluate the cell viability. Briefly, 10 μL of the CCK-8 solution was added to each well of the plate, and the cells were allowed to grow for another 3 h. The absorbance (optical density (OD)) was measured at 450 nm using a microplate reader (Epoch, BioTek Instruments Inc., Shoreline, WA, USA). The measured absorbance value (OD) of the wells was then used to calculate the cell viability via the formula
cell viability(%) = [(ODexperimental well − ODblank)/(ODcontrol well − ODblank well)] × 100%

5. Conclusions

In conclusion, we have identified a number of compounds from the acyl hydrazise–hydrazone scaffold, which produces strong CEST contrast from 2.8–6.4 ppm from water. We have also demonstrated that one compound from this scaffold (ADH) allows the detection of altered perfusion in a mouse model of breast cancer. Our study expands the catalog of compounds suited as CEST agents, which will accelerate the clinical translation of CEST MRI in the future.

Supplementary Materials

The following supporting information can be downloaded at: https://www.mdpi.com/article/10.3390/ph16050639/s1, Figure S1. Cytotoxicity assay of ADH on 4T1 cells with different concentration ranges; Figure S2. Z spectra and MTRasym spectra of acyl hydrazide 1 (a), 3 (b), 4 (c), 5 (d), 7 (e), and 8 (f); Figure S3. Z spectra and MTRasym of acyl hydrazide 12 (a), 14 (b), 15 (c), and 16 (d); Figure S4. 1H NMR of acyl hydrazone 17; Figure S5. 13C NMR of acyl hydrazone 17; Figure S6. HRMS of acyl hydrazone 17.

Author Contributions

Conceptualization, M.T.M. and C.S.; methodology, S.B. and D.Z.; investigation, M.M.; writing—original draft preparation, S.B. and D.Z.; resources, S.B., D.Z. and X.M.; data curation, S.B. and D.Z.; formal analysis, J.S.; project administration, L.L.; writing—review and editing, M.T.M., C.S. and L.L.; supervision, M.T.M., C.S. and L.L. All authors have read and agreed to the published version of the manuscript.

Funding

This work is financially supported by the Guangzhou Key Laboratory of Molecular and Functional Imaging for Clinical Translation (201905010003); the National Natural Science Foundation of China (81971672 and 82271943); Guangdong Basic and Applied Basic Research Foundation (2021A1515111129); Fundamental Research Funds for the Central Universities (21620308).

Institutional Review Board Statement

Not applicable.

Informed Consent Statement

Not applicable.

Data Availability Statement

Data are contained within the article and Supplementary Material.

Acknowledgments

We acknowledge the Animal Magnetic Resonance Research Center of the First Affiliated Hospital of Jinan University for providing the MRI scanner (Bruker Biospec 9.4T) in this study.

Conflicts of Interest

The authors declare no conflict of interest.

References

  1. Geon-Ho, J.; Park, S.; Ryu, C.-W.; Cho, Z.-H. Magnetic Resonance Imaging: Historical Overview, Technical Developments, and Clinical Applications. Prog. Med. Phys. 2020, 31, 35–53. [Google Scholar]
  2. van Zijl, P.C.M.; Yadav, N.N. Chemical Exchange Saturation Transfer (CEST): What is in a Name and What Isn’t? Magn. Reson. Med. 2011, 65, 927–948. [Google Scholar] [CrossRef]
  3. Yang, X.; Song, X.; Li, Y.; Liu, G.; Banerjee, S.R.; Pomper, M.G.; McMahon, M.T. Salicylic acid and analogues as diaCEST MRI contrast agents with highly shifted exchangeable proton frequencies. Angew. Chem. Int. Ed. 2013, 52, 8116–8119. [Google Scholar] [CrossRef]
  4. Liu, G.S.; Liang, Y.J.; Bar-Shir, A.; Chan, K.W.Y.; Galpoththawela, C.S.; Bernard, S.M.; Tse, T.; Yadav, N.N.; Walczak, P.; McMahon, M.T.; et al. Monitoring Enzyme Activity Using a Diamagnetic Chemical Exchange Saturation Transfer Magnetic Resonance Imaging Contrast Agent. J. Am. Chem. Soc. 2011, 133, 16326–16329. [Google Scholar] [CrossRef]
  5. Sinharay, S.; Randtke, E.A.; Jones, K.M.; Howison, C.M.; Chambers, S.K.; Kobayashi, H.; Pagel, M.D. Noninvasive detection of enzyme activity in tumor models of human ovarian cancer using catalyCEST MRI. Magn. Reson. Med. 2017, 77, 2005–2014. [Google Scholar] [CrossRef]
  6. Hingorani, D.V.; Montano, L.A.; Randtke, E.A.; Lee, Y.S.; Cardenas-Rodriguez, J.; Pagel, M.D. A single diamagnetic catalyCEST MRI contrast agent that detects cathepsin B enzyme activity by using a ratio of two CEST signals. Contrast Media Mol. Imaging 2016, 11, 130–138. [Google Scholar] [CrossRef]
  7. Liu, H.; Jablonska, A.; Li, Y.; Cao, S.; Liu, D.; Chen, H.; Van Zijl, P.C.; Bulte, J.W.; Janowski, M.; Walczak, P.; et al. Label-free CEST MRI Detection of Citicoline-Liposome Drug Delivery in Ischemic Stroke. Theranostics 2016, 6, 1588–1600. [Google Scholar] [CrossRef]
  8. Goldenberg, J.M.; Pagel, M.D. Assessments of tumor metabolism with CEST MRI. NMR Biomed. 2019, 32, e3943. [Google Scholar] [CrossRef]
  9. Villano, D.; Romdhane, F.; Irrera, P.; Consolino, L.; Anemone, A.; Zaiss, M.; Dastru, W.; Longo, D.L. A fast multislice sequence for 3D MRI-CEST pH imaging. Magn. Reson. Med. 2021, 85, 1335–1349. [Google Scholar] [CrossRef]
  10. Irrera, P.; Consolino, L.; Cutrin, J.C.; Zoellner, F.G.; Longo, D.L. Dual assessment of kidney perfusion and pH by exploiting a dynamic CEST-MRI approach in an acute kidney ischemia-reperfusion injury murine model. NMR Biomed. 2020, 33, e4287. [Google Scholar] [CrossRef]
  11. Wu, Y.; Zhou, I.Y.; Igarashi, T.; Longo, D.L.; Aime, S.; Sun, P.Z. A generalized ratiometric chemical exchange saturation transfer (CEST) MRI approach for mapping renal pH using iopamidol. Magn. Reson. Med. 2018, 79, 1553–1558. [Google Scholar] [CrossRef]
  12. Longo, D.L.; Sun, P.Z.; Consolino, L.; Michelotti, F.C.; Uggeri, F.; Aime, S. A General MRI-CEST Ratiometric Approach for pH Imaging: Demonstration of in Vivo pH Mapping with lobitridol. J. Am. Chem. Soc. 2014, 136, 14333–14336. [Google Scholar] [CrossRef]
  13. Pavuluri, K.; Manoli, I.; Pass, A.; Li, Y.; Vernon, H.J.; Venditti, C.P.; McMahon, M.T. Noninvasive monitoring of chronic kidney disease using pH and perfusion imaging. Sci. Adv. 2019, 5, eaaw8357. [Google Scholar] [CrossRef]
  14. Bo, S.; Sedaghat, F.; Pavuluri, K.; Rowe, S.P.; Cohen, A.; Kates, M.; McMahon, M.T. Dynamic contrast enhanced-MR CEST urography: An emerging tool in the diagnosis and management of upper urinary tract obstruction. Tomography 2021, 7, 80–94. [Google Scholar] [CrossRef]
  15. Longo, D.L.; Busato, A.; Lanzardo, S.; Antico, F.; Aime, S. Imaging the pH evolution of an acute kidney injury model by means of iopamidol, a MRI-CEST pH-responsive contrast agent. Magn. Reson. Med. 2013, 70, 859–864. [Google Scholar] [CrossRef]
  16. Ratnakar, S.J.; Chirayil, S.; Funk, A.M.; Zhang, S.; Queiro, J.F.; Geraldes, C.F.G.C.; Kovacs, Z.; Sherry, A.D. A Frequency-Selective pH-Responsive paraCEST Agent. Angew. Chem. Int. Ed. 2020, 59, 21671–21676. [Google Scholar] [CrossRef]
  17. Gambino, T.; Laura, V.; Perez-Lourido, P.; Esteban-Gomez, D.; Zaiss, M.; Platas-Iglesias, C.; Angelovski, G. Inert macrocyclic Eu3+ complex with affirmative paraCEST features. Inorg. Chem. Front. 2020, 7, 2274–2286. [Google Scholar] [CrossRef]
  18. Thorarinsdottir, A.E.; Harris, T.D. Dramatic enhancement in pH sensitivity and signal intensity through ligand modification of a dicobalt PARACEST probe. Chem. Commun. 2019, 55, 794–797. [Google Scholar] [CrossRef]
  19. He, J.F.; Bonnet, C.S.; Eliseeva, S.V.; Lacerda, S.; Chauvin, T.; Retailleau, P.; Szeremeta, F.; Badet, B.; Petoud, S.; Toth, E.; et al. Prototypes of Lanthanide(III) Agents Responsive to Enzymatic Activities in Three Complementary Imaging Modalities: Visible/Near-Infrared Luminescence, PARACEST-, and T-1-MRI. J. Am. Chem. Soc. 2016, 138, 2913–2916. [Google Scholar] [CrossRef]
  20. Huang, C.H.; Hammell, J.; Ratnakar, S.J.; Sherry, A.D.; Morrow, J.R. Activation of a PARACEST agent for MRI through selective outersphere interactions with phosphate diesters. Inorg. Chem. 2010, 49, 5963–5970. [Google Scholar] [CrossRef]
  21. Woods, M.; Woessner, D.E.; Zhao, P.; Pasha, A.; Yang, M.Y.; Huang, C.H.; Vasalitiy, O.; Morrow, J.R.; Sherry, A.D. Europium(III) macrocyclic complexes with alcohol pendant groups as chemical exchange saturation transfer agents. J. Am. Chem. Soc. 2006, 128, 10155–10162. [Google Scholar] [CrossRef]
  22. Brun, E.; Calvert, N.D.; Suchy, M.; Kirby, A.; Melkus, G.; Garipov, R.; Addison, C.L.; Shuhendler, A.J. Mapping vitamin B6 metabolism by hydrazoCEST magnetic resonance imaging. Chem. Commun. 2021, 57, 10867–10870. [Google Scholar] [CrossRef]
  23. Han, Z.; Chen, C.; Xu, X.; Bai, R.; Staedtke, V.; Huang, J.; Chan, K.W.Y.; Xu, J.; Kamson, D.O.; Wen, Z.; et al. Dynamic contrast-enhanced CEST MRI using a low molecular weight dextran. NMR Biomed. 2022, 35, e4649. [Google Scholar] [CrossRef]
  24. Cai, X.K.; Zhang, J.; Lu, J.Q.; Yi, L.; Han, Z.; Zhang, S.X.; Yang, X.; Liu, G.S. N-Aryl Amides as Chemical Exchange Saturation Transfer Magnetic Resonance Imaging Contrast Agents. Chem. Eur. J. 2020, 26, 11705–11709. [Google Scholar] [CrossRef]
  25. Chakraborty, S.; Peruncheralathan, S.; Ghosh, A. Paracetamol and other acetanilide analogs as inter-molecular hydrogen bonding assisted diamagnetic CEST MRI contrast agents. RSC Adv. 2021, 11, 6526–6534. [Google Scholar] [CrossRef]
  26. Zhang, X.; Yuan, Y.; Li, S.; Zeng, Q.; Guo, Q.; Liu, N.; Yang, M.; Yang, Y.; Liu, M.; McMahon, M.T.; et al. Free-base porphyrins as CEST MRI contrast agents with highly upfield shifted labile protons. Magn. Reson. Med. 2019, 82, 577–585. [Google Scholar] [CrossRef]
  27. Dang, T.; Suchy, M.; Truong, Y.J.; Oakden, W.; Lam, W.W.; Lazurko, C.; Facey, G.; Stanisz, G.J.; Shuhendler, A.J. Hydrazo-CEST: Hydrazone-Dependent Chemical Exchange Saturation Transfer Magnetic Resonance Imaging Contrast Agents. Chem. Eur. J. 2018, 24, 9148–9156. [Google Scholar] [CrossRef]
  28. Dorsey, S.M.; Haris, M.; Singh, A.; Witschey, W.R.T.; Rodell, C.B.; Kogan, F.; Reddy, R.; Burdick, J.A. Visualization of Injectable Hydrogels Using Chemical Exchange Saturation Transfer MRI. ACS Biomater. Sci. Eng. 2015, 1, 227–237. [Google Scholar] [CrossRef]
  29. Yuan, Y.; Zhang, J.; Qi, X.; Li, S.; Liu, G.; Siddhanta, S.; Barman, I.; Song, X.; McMahon, M.T.; Bulte, J.W.M. Furin-mediated intracellular self-assembly of olsalazine nanoparticles for enhanced magnetic resonance imaging and tumour therapy. Nat. Mater. 2019, 18, 1376–1383. [Google Scholar] [CrossRef]
  30. Bonnet, C.S.; Toth, E. Smart Contrast Agents for Magnetic Resonance Imaging. Chimia 2016, 70, 102–108. [Google Scholar] [CrossRef]
  31. Rodriguez-Rodriguez, A.; Zaiss, M.; Esteban-Gomez, D.; Angelovski, G.; Platas-Iglesias, C. Paramagnetic chemical exchange saturation transfer agents and their perspectives for application in magnetic resonance imaging. Int. Rev. Phys. Chem. 2021, 40, 51–79. [Google Scholar] [CrossRef]
  32. Castro, G.; Regueiro-Figueroa, M.; Esteban-Gomez, D.; Bastida, R.; Macias, A.; Perez-Lourido, P.; Platas-Iglesias, C.; Valencia, L. Exceptionally Inert Lanthanide (III) PARACEST MRI Contrast Agents Based on an 18-Membered Macrocyclic Platform. Chem. Eur. J. 2015, 21, 18662–18670. [Google Scholar] [CrossRef]
  33. Longo, D.L.; Carella, A.; Corrado, A.; Pirotta, E.; Mohanta, Z.; Singh, A.; Stabinska, J.; Liu, G.; McMahon, M.T. A snapshot of the vast array of diamagnetic CEST MRI contrast agents. NMR Biomed. 2022, e4715. [Google Scholar] [CrossRef]
  34. Chen, Z.; Han, Z.; Liu, G. Repurposing Clinical Agents for Chemical Exchange Saturation Transfer Magnetic Resonance Imaging: Current Status and Future Perspectives. Pharmaceuticals 2021, 14, 11. [Google Scholar] [CrossRef]
  35. Haris, M.; Cai, K.; Singh, A.; Hariharan, H.; Reddy, R. In vivo mapping of brain myo-inositol. Neuroimage 2011, 54, 2079–2085. [Google Scholar] [CrossRef]
  36. Rivlin, M.; Navon, G. Molecular imaging of tumors by chemical exchange saturation transfer MRI of glucose analogs. Quant. Imag. Med. Surg. 2019, 9, 1731–1746. [Google Scholar] [CrossRef] [PubMed]
  37. Shin, S.H.; Wendland, M.F.; Zhang, B.; Tran, A.; Tang, A.; Vandsburger, M.H. Noninvasive imaging of renal urea handling by CEST-MRI. Magn. Reson. Med. 2020, 83, 1034–1044. [Google Scholar] [CrossRef]
  38. Yang, X.; Song, X.; Banerjee, S.R.; Li, Y.; Byun, Y.; Liu, G.; Bhujwalla, Z.M.; Pomper, M.G.; McMahon, M.T. Developing imidazoles as CEST MRI pH sensors. Contrast Media Mol. Imaging 2016, 11, 304–312. [Google Scholar] [CrossRef]
  39. Majumdar, P.; Pati, A.; Patra, M.; Behera, R.K.; Behera, A.K. Acid Hydrazides, Potent Reagents for Synthesis of Oxygen-, Nitrogen-, and/or Sulfur-Containing Heterocyclic Rings. Chem. Rev. 2014, 114, 2942–2977. [Google Scholar] [CrossRef] [PubMed]
  40. Souza, I.M.S.; Borrego-Sanchez, A.; Ignacio Sainz-Diaz, C.; Viseras, C.; Pergher, S.B.C. Study of Faujasite zeolite as a modified delivery carrier for isoniazid. Mater. Sci. Eng. C 2021, 118, 111365. [Google Scholar] [CrossRef] [PubMed]
  41. Chang, H.J.; Park, J.; Oh, S.; Shin, C.W.; Cho, J.W.; Lee, J.Y. Efficacy of levodopa/benserazide dispersible tablet on delayed ON in Parkinson’s disease patients with motor fluctuations: A multicenter randomized open-label cross-over trial. Mov. Disord. 2022, 37, 321. [Google Scholar]
  42. McMahon, M.T.; Gilad, A.A.; Zhou, J.Y.; Sun, P.Z.; Bulte, J.W.M.; van Zijl, P.C.M. Quantifying exchange rates in chemical exchange saturation transfer agents using the saturation time and saturation power dependencies of the magnetization transfer effect on the magnetic resonance imaging signal (QUEST and QUESP): pH calibration for poly-L-lysine and a starburst dendrimer. Magn. Reson. Med. 2006, 55, 836–847. [Google Scholar] [PubMed]
  43. Kolesnikova, I.N.; Chegodaev, N.A.; Sharanov, P.Y.F.; Shishkov, I. Equilibrium molecular structure and intramolecular interactions of picolinic acid hydrazide. Chem. Phys. Lett. 2022, 793, 139447. [Google Scholar] [CrossRef]
  44. Yang, X.; Yadav, N.N.; Song, X.; Banerjee, S.R.; Edelman, H.; Minn, I.; van Zijl, P.C.M.; Pomper, M.G.; McMahon, M.T. Tuning Phenols with Intra-Molecular Bond Shifted HYdrogens (IM-SHY) as diaCEST MRI Contrast Agents. Chem. Eur. J. 2014, 20, 15824–15832. [Google Scholar] [CrossRef]
  45. Thota, S.; Rodrigues, D.A.; Murteira Pinheiro, P.D.S.; Lima, L.M.; Fraga, C.A.M.; Barreiro, E.J. N-Acylhydrazones as drugs. Bioorg. Med. Chem. Lett. 2018, 28, 2797–2806. [Google Scholar] [CrossRef]
  46. Tatum, L.A.; Su, X.; Aprahamian, I. Simple Hydrazone Building Blocks for Complicated Functional Materials. Acc. Chem. Res. 2014, 47, 2141–2149. [Google Scholar] [CrossRef]
  47. van Dijken, D.J.; Kovaricek, P.; Ihrig, S.P.; Hecht, S. Acylhydrazones as Widely Tunable Photoswitches. J. Am. Chem. Soc. 2015, 137, 14982–14991. [Google Scholar] [CrossRef] [PubMed]
  48. Weinreb, J.C.; Rodby, R.A.; Yee, J.; Wang, C.L.; Fine, D.; McDonald, R.J.; Perazella, M.A.; Dillman, J.R.; Davenport, M.S. Use of Intravenous Gadolinium-based Contrast Media in Patients with Kidney Disease: Consensus Statements from the American College of Radiology and the National Kidney Foundation. Radiology 2021, 298, 28–35. [Google Scholar] [CrossRef] [PubMed]
  49. Alexander, B.H.; Barnes, H.M.; Trimmer, E.; Davidson, A.M.; Ogola, B.O.; Lindsey, S.H.; Mostany, R. Stable Density and Dynamics of Dendritic Spines of Cortical Neurons Across the Estrous Cycle While Expressing Differential Levels of Sensory-Evoked Plasticity. Front. Mol. Neurosci. 2018, 11, 83. [Google Scholar] [CrossRef]
  50. Chan, K.W.Y.; McMahon, M.T.; Kato, Y.; Liu, G.S.; Bulte, J.W.M.; Bhujwalla, Z.M.; Artemov, D.; van Zijl, P.C.M. Natural D-glucose as a biodegradable MRI contrast agent for detecting cancer. Magn. Reson. Med. 2012, 68, 1764–1773. [Google Scholar] [CrossRef]
  51. Walker-Samuel, S.; Ramasawmy, R.; Torrealdea, F.; Rega, M.; Rajkumar, V.; Johnson, S.P.; Richardson, S.; Goncalves, M.; Parkes, H.G.; Arstad, E.; et al. In vivo imaging of glucose uptake and metabolism in tumors. Nat. Med. 2013, 19, 1067–1072. [Google Scholar] [CrossRef] [PubMed]
  52. Zaiss, M.; Anemone, A.; Goerke, S.; Longo, D.L.; Herz, K.; Pohmann, R.; Aime, S.; Rivlin, M.; Navon, G.; Golay, X.; et al. Quantification of hydroxyl exchange of D-Glucose at physiological conditions for optimization of glucoCEST MRI at 3, 7 and 9.4 Tesla. NMR Biomed. 2019, 32, e4113. [Google Scholar] [CrossRef] [PubMed]
  53. Xu, X.; Sehgal, A.A.; Yadav, N.N.; Laterra, J.; Blair, L.; Blakeley, J.; Seidemo, A.; Coughlin, J.M.; Pomper, M.G.; Knutsson, L.; et al. d-glucose weighted chemical exchange saturation transfer (glucoCEST)-based dynamic glucose enhanced (DGE) MRI at 3T: Early experience in healthy volunteers and brain tumor patients. Magn. Reson. Med. 2020, 84, 247–262. [Google Scholar] [CrossRef] [PubMed]
  54. Rivlin, M.; Navon, G. CEST MRI of 3-O-methyl-D-glucose on different breast cancer models. Magn. Reson. Med. 2018, 79, 1061–1069. [Google Scholar] [CrossRef] [PubMed]
  55. Popiolek, L. Updated Information on Antimicrobial Activity of Hydrazide-Hydrazones. Int. J. Mol. Sci. 2021, 22, 9389. [Google Scholar] [CrossRef]
  56. Pavuluri, K.; Rosenberg, J.T.; Helsper, S.; Bo, S.; McMahon, M.T. Amplified detection of phosphocreatine and creatine after supplementation using CEST MRI at high and ultrahigh magnetic fields. J. Magn. Reson. 2020, 313, 106703. [Google Scholar] [CrossRef]
  57. Han, L.; Zhao, Y.; Yin, L.; Li, R.; Liang, Y.; Huang, H.; Pan, S.; Wu, C.; Feng, M. Insulin-Loaded pH-Sensitive Hyaluronic Acid Nanoparticles Enhance Transcellular Delivery. AAPS PharmSciTech 2012, 13, 836–845. [Google Scholar] [CrossRef]
  58. Dou, W.; Lin, C.-Y.E.; Ding, H.; Shen, Y.; Dou, C.; Qian, L.; Wen, B.; Wu, B. Chemical exchange saturation transfer magnetic resonance imaging and its main and potential applications in pre-clinical and clinical studies. Quant. Imag. Med. Surg. 2019, 9, 1747–1766. [Google Scholar] [CrossRef]
  59. Bermejo-Velasco, D.; Dou, W.; Heerschap, A.; Ossipov, D.; Hilborn, J. Injectable hyaluronic acid hydrogels with the capacity for magnetic resonance imaging. Carbohydr. Polym. 2018, 197, 641–648. [Google Scholar] [CrossRef]
  60. Chen, H.; He, X.; Su, M.; Zhai, W.; Zhang, H.; Li, C. A General Strategy Toward Highly Fluorogenic Bioprobes Emitting across the Visible Spectrum. J. Am. Chem. Soc. 2017, 139, 10157–10163. [Google Scholar] [CrossRef]
  61. Kim, M.; Gillen, J.; Landman, B.A.; Zhou, J.Y.; van Zijl, P.C.M. Water Saturation Shift Referencing (WASSR) for Chemical Exchange Saturation Transfer (CEST) Experiments. Magn. Reson. Med. 2009, 61, 1441–1450. [Google Scholar] [CrossRef] [PubMed]
Scheme 1. Illustration of acyl hydrazide and acyl hydrazone CEST agents.
Pharmaceuticals 16 00639 sch001
Scheme 2. CEST signal (ppm), contrast (%) (kex [s−1]) of aromatic acyl hydrazides. Experimental conditions: 40 mM concentration, pH 7.2, tsat = 3 s, B1 = 3.6 μT, T = 37 °C.
Pharmaceuticals 16 00639 sch002
Figure 1. Z spectra (S/S0, black line) and MTRasym spectra (blue line) of hydrazide 2 (a), 6 (b), 9 (c), 10 (d), 11 (e), 13 (f). Experimental conditions: 40 mM concentration, pH 7.2, tsat = 3 s, B1 = 3.6 μT, T = 37 °C.
Pharmaceuticals 16 00639 g001
Scheme 3. CEST signal (ppm) and contrast (%) (kex [s−1]) of aliphatic acyl hydrazides. Experimental conditions: 40 mM concentration, pH 7.2, tsat = 3 s, B1 = 3.6 μT, T =37 °C.
Pharmaceuticals 16 00639 sch003
Figure 2. CEST properties of ADH. Z-spectra (a) and MTRasym spectra (b); (c) QUESP data from pH 5.7 to 7.5; (d) pH dependence of kex based on QUESP data. Experimental conditions: 30 mM concentration, pH 5.7–7.5, tsat = 3 s, B1 = 3.6 μT, T = 37 °C.
Pharmaceuticals 16 00639 g002
Figure 3. Dynamic CEST MRI for 4T1 tumor-bearing mice after injection of ADH including T2w image and overlay images showing MTRasym (4.4 ppm) pre-injection, 17 min, and 34 min post-injection and MTRasym spectra for ROIs enclosing the whole tumor. (a) representative mouse 1; and (b) representative mouse 2.
Pharmaceuticals 16 00639 g003
Scheme 4. Synthesis of acyl hydrazone 17.
Pharmaceuticals 16 00639 sch004
Figure 4. Chemical structure and CEST properties of acyl hydrazone 17. (a) Chemical structure; Z-spectra (b) and MTRasym spectra (c); (d) QUESP data; (e) pH dependence of kex. Experimental conditions: 30 mM concentration, pH 5.7–7.5, tsat = 3 s, B1 = 3.6 μT, T = 37 °C.
Pharmaceuticals 16 00639 g004
Disclaimer/Publisher’s Note: The statements, opinions and data contained in all publications are solely those of the individual author(s) and contributor(s) and not of MDPI and/or the editor(s). MDPI and/or the editor(s) disclaim responsibility for any injury to people or property resulting from any ideas, methods, instructions or products referred to in the content.

