Article

SPECT Imaging with Tc-99m-Labeled HYNIC-FAPI-04 to Extend the Differential Time Window in Evaluating Tumor Fibrosis

1
Department of Nuclear Medicine, Shanghai Changhai Hospital, Shanghai 200433, China
2
Department of Nuclear Medicine, The Second Affiliated Hospital of Chongqing Medical University, Chongqing 400010, China
*
Authors to whom correspondence should be addressed.
These authors contributed equally to this work.
Pharmaceuticals 2023, 16(3), 423; https://doi.org/10.3390/ph16030423
Submission received: 2 February 2023 / Revised: 2 March 2023 / Accepted: 6 March 2023 / Published: 10 March 2023

Abstract

:
The so-far used Ga-68- or F-18-labelled tracers are of a relative short time window in differentiating tumor fibrosis. SPECT applicable imaging probe, 99mTc-HYNIC-FAPI-04, was synthesized and evaluated in tumor cells and animal models of FAP-positive glioma and FAP-negative hepatoma, and then compared with 18F-FDG or 68Ga-FAPI-04 PET/CT. The radio-labeling rate of 99mTc-HYNIC-FAPI-04 was greater than 90%, and the radiochemical purity was >99% after purification with sep-pak C18 column. In vitro cell uptake experiments of 99mTc-HYNIC-FAPI-04 showed good FAP binding specificity, and the cellular uptake significantly decreased when blocked by DOTA-FAPI-04, reflecting the similar targeting mechanism of HYNIC-FAPI-04 and DOTA-FAPI-04. SPECT/CT imaging showed that U87MG tumor was distinguishable and of a high uptake of 99mTc-HYNIC-FAPI-04 (2.67 ± 0.35 %ID/mL at 1.5 h post injection (h P.I.), while tumor signal of FAP-negative HUH-7 was as low as 0.34 ± 0.06 %ID/mL. At 5 h P.I., U87MG tumor was still distinguishable (1.81 ± 0.20 %ID/mL). In comparison, although U87MG tumor was of obvious 68Ga-FAPI-04 uptake and clearly visible at 1 h P.I., the tumorous radioactive signals were fuzzy at 1.5 h P.I. 99mTc-HYNIC-FAPI-04 specifically bound to FAP-positive tumors and qualified with the ability of evaluating tumor fibrosis over longer time windows.

1. Introduction

Fibroblast activating protein (FAP) is a type II transmembrane serine protease that is highly expressed as a dimer on the surface and matrix of up to 90% of epithelial cancer tumor-associated fibroblasts (CAFs) [1,2], especially in breast cancer, colorectal cancer, pancreatic cancer, cervical cancer and other malignant tumors characterized by proliferative hyperplasia reaction of connective tissue [3]. The high expression of FAP in tumor interstitium and the poor prognosis of tumor patients suggests that FAP is a key factor in tumor growth, proliferation, invasion and metastasis [4,5], which further makes FAP the most prominent target for tumor diagnosis and treatment in the field of nuclear medicine. FAP inhibitor (FAPI)-based imaging is even expected to replace the most widely used radioactive diagnostic tracer FDG in clinical practice, due to the convenience in simplifying the integration of diagnosis and treatment via changing nuclides. FAP plays a complex role in the regulation of extracellular matrix [6], and its related specific inhibitors have been developed in different isomers [7,8,9]. Recent studies have shown that quinoline-based FAP inhibitors have more prominent specificity in targeting tumors [10]. Among them, FAPI-04 showed stronger binding efficiency and better biochemical kinetic properties, as it was able to in vivo combine with FAP in 10 min after injection, with low non-targeted soft tissue background, and was completely cleared by the kidneys at 3 h post injection (P.I.) [10,11].
68Ga-labeled FAPI-04 for positron emission tomography/computed tomography (PET/CT) or PET/magnetic resonance imaging (MRI) can reflect the tumor profile, such as types and microenvironment of tumor cases, and show a high contrast between the tumor and healthy tissue [12]. In PET imaging, 68Ga-FAPI-04 showed superior detection performance compared to 18F-FDG in pancreatic, gastric, and lung cancers [13,14]. In addition to 68Ga-FAPI-04, radiopharmaceuticals such as 18F-, 64Cu-, 90Y-, 177Lu- and 225Ac-labeled FAPI-04 have been used for PET imaging or selective internal irradiation [15,16,17,18]. Despite the increasing use of positron radionuclides in clinical medicine, PET scans are somewhat costly, and PET devices are not widely available, especially in the low-income or under-developed areas. Moreover, the half-life of commonly-used positron radionuclides (Ga-68 and F-18) is short, so the differential time window (dT), that is to say the time length of imaging modality with differential diagnosis capability, is too short to do some time-consuming examinations, such as the delayed scan and dual-phase scan. Except for the PET nuclides, 99mTc is one of the most commonly used nuclides in clinic because of its suitable half-life (t1/2 = 6.02 h), good radiophysical properties (Eγ = 141 keV), low cost and easy availability [19]. 99mTc-radiolabeled compounds are commonly used in single photon emission computed tomography (SPECT) imaging, correspondingly, 6-hydrazinonicotinate-aminocaproic (HYNIC) often acts as a bifunctional chelating ligand to conjugate 99mTc to various biomolecules, including antibodies and peptides [20,21,22]. For instance, 99mTc-HYNIC-PSMA has been reported in clinical studies and has shown high uptake in PSMA-positive lesions in patients with prostate cancer [23,24], making it an alternative method for PSMA-specific diagnosis.
Therefore, in this study, based on the developed synthesis of 99mTc-HYNIC-FAPI-04 [25,26], the feasibility in diagnosing FAP was evaluated, especially focusing on the extension of differential time window. In the additional comparison with 68Ga-FAPI-04 PET or 18F-FDG PET, the imaging performance of 99mTc-HYNIC-FAPI-04 SPECT was evaluated in mouse xenografted with U87MG-based FAP-positive tumors.

2. Results

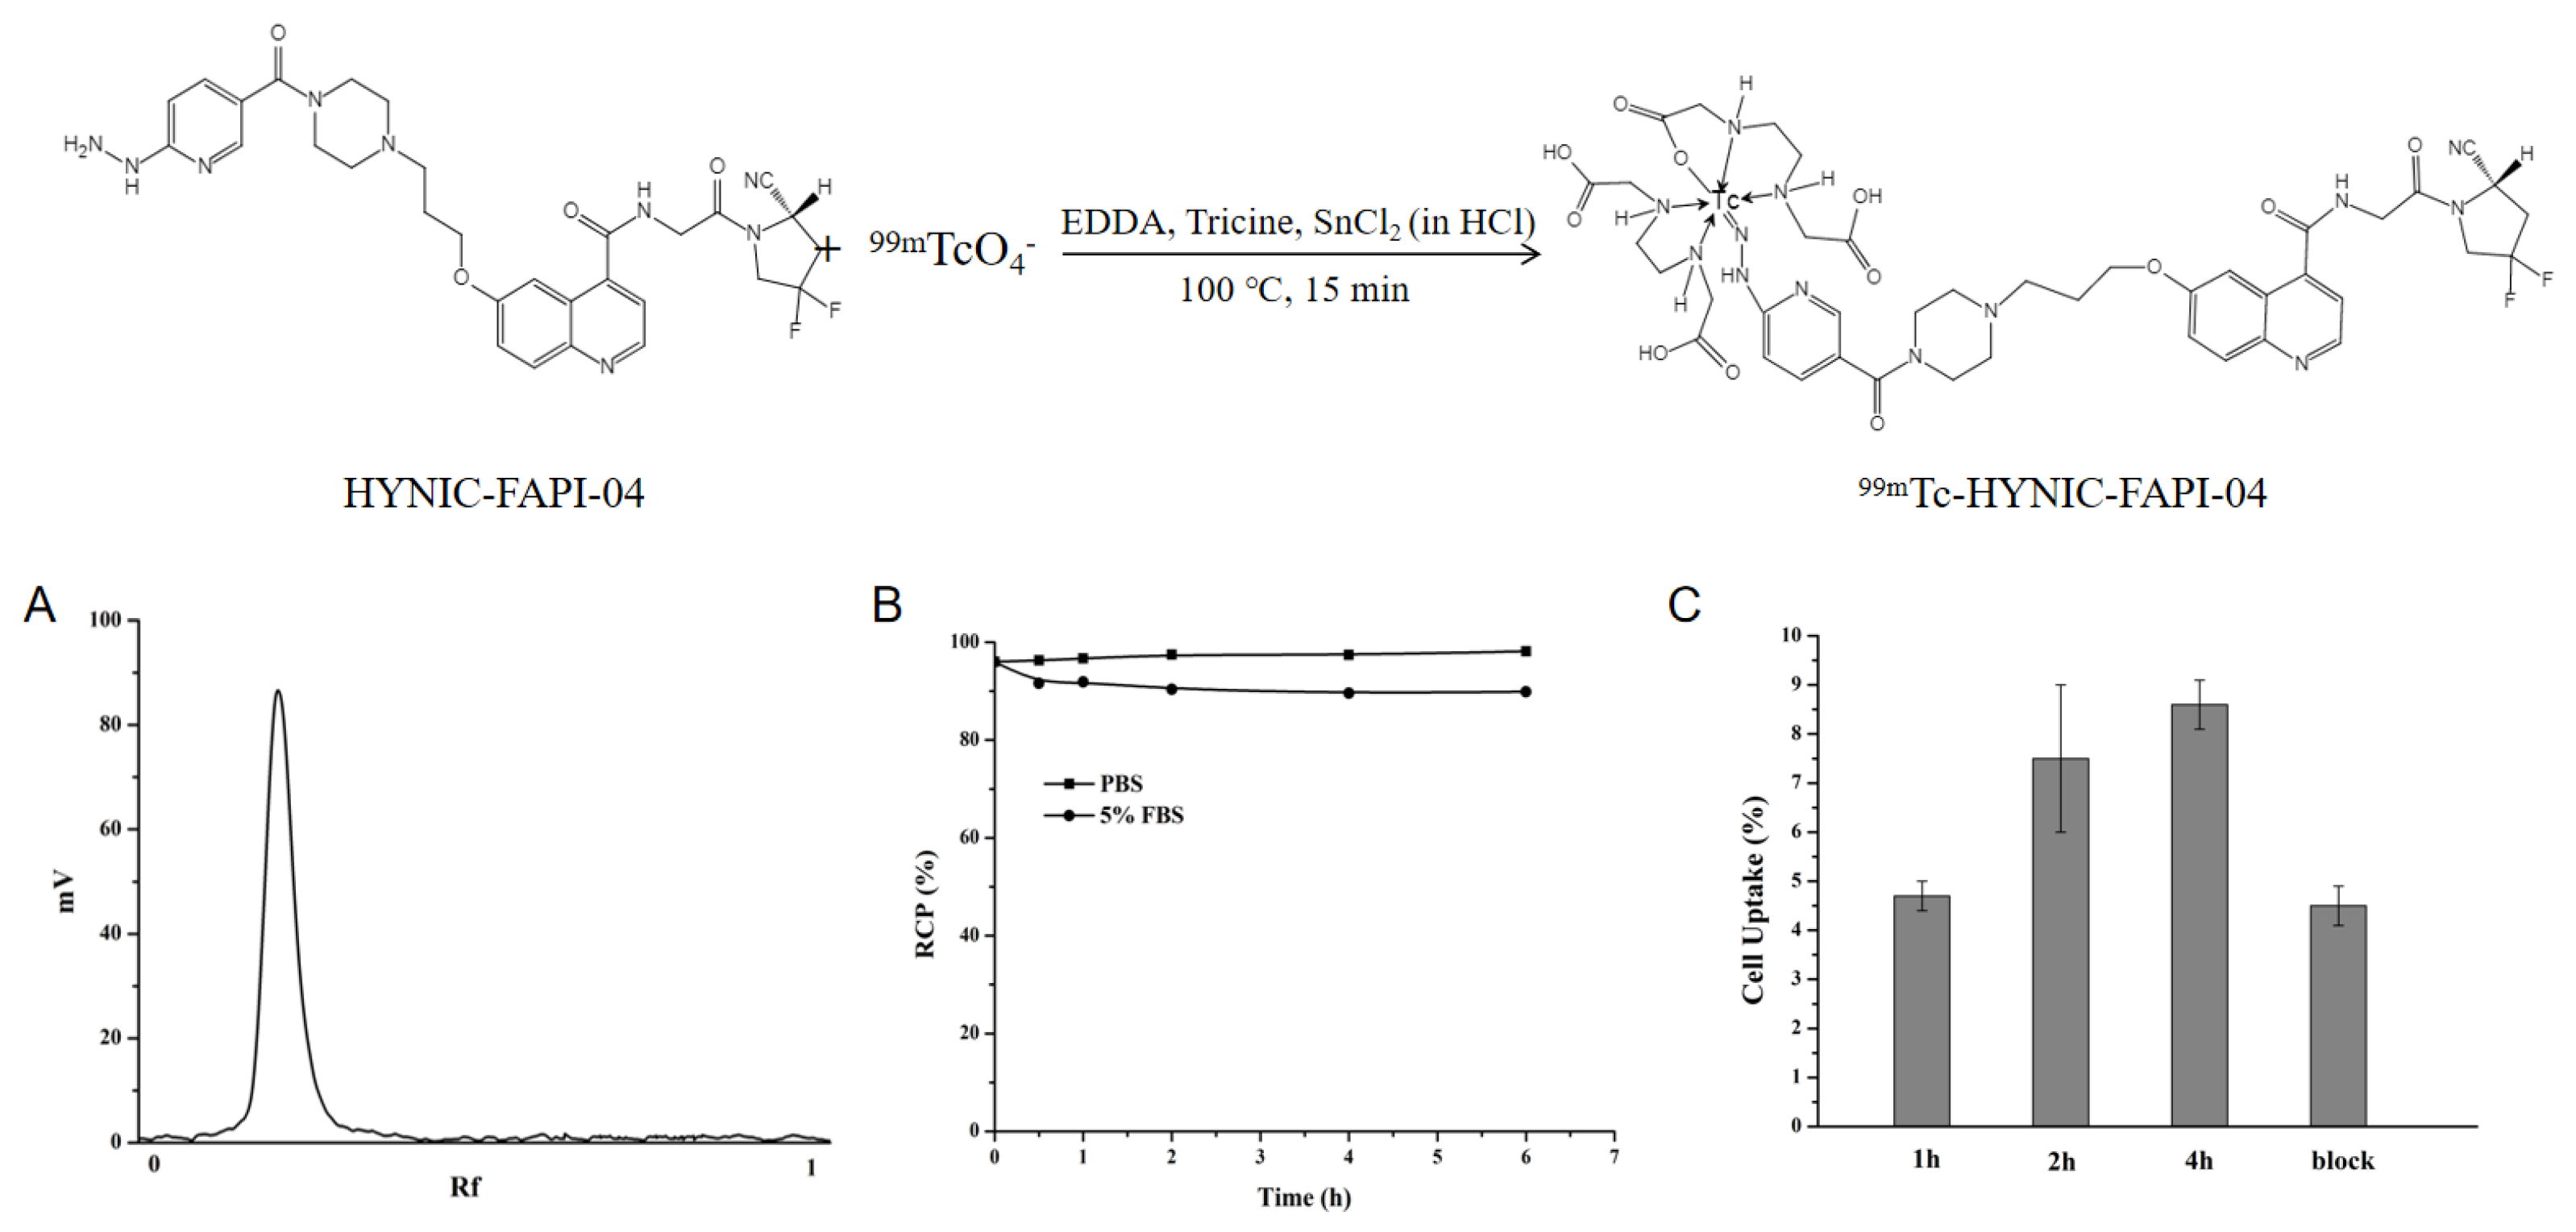
2.1. Radiolabeling and Stability

The labeling process of 99mTc-HYNIC-FAPI-04 is shown in Figure 1. HYNIC-FAPI-04 was labeled with Na99mTcO4 using SnCl2 in diluted HCl as the reducing agent, and ethylenediamine diacetic acid (EDDA) and Tricine served as co-ligands to obtain 99mTc-HYNIC-FAPI-04. 99mTc-HYNIC-FAPI-04 was primarily obtained with a 15-min reaction at 100 °C, and quality control was carried out through instant thin layer chromatography (iTLC) with thin layer chromatography paper as stationary phase and acetone as mobile phase. The labeling rate was normally higher than 90%. After purification with C18 column, the radiochemical purity (RCP) of 99mTc-HYNIC-FAPI-04 was nearly 100% (Figure 1A).
As shown in Figure 1B, 99mTc-HYNIC-FAPI-04 was stable in phosphate buffer solution (PBS) and 5% fetal bovine serum (FBS) solution at room temperature for 6 h, and the stability was better in PBS, meeting the requirements for storage and delivery as a daily-prepared radiopharmaceutical.

2.2. In Vitro Binding Ability

The results of cellular binding experiment of 99mTc-HYNIC-FAPI-04 are shown in Figure 1C. The 99mTc-HYNIC-FAPI-04 uptake of U87MG cells (FAPI+) increased with the extension of incubation time and the binding rate reached 8.6 ± 0.5% after 4 h incubation, manifesting the necessity of a longer interaction between tracer and target. In vitro cell binding competitive assay results obtained by adding 250 times excess unlabeled DOTA-FAPI-04 as a competitive agent showed that the binding of 99mTc-HYNIC-FAPI-04 to U87MG cells was significantly reduced (8.6 ± 0.5% vs. 4.5 ± 0.4%, p-value < 0.05) and of a same target with DOTA-FAPI-04.

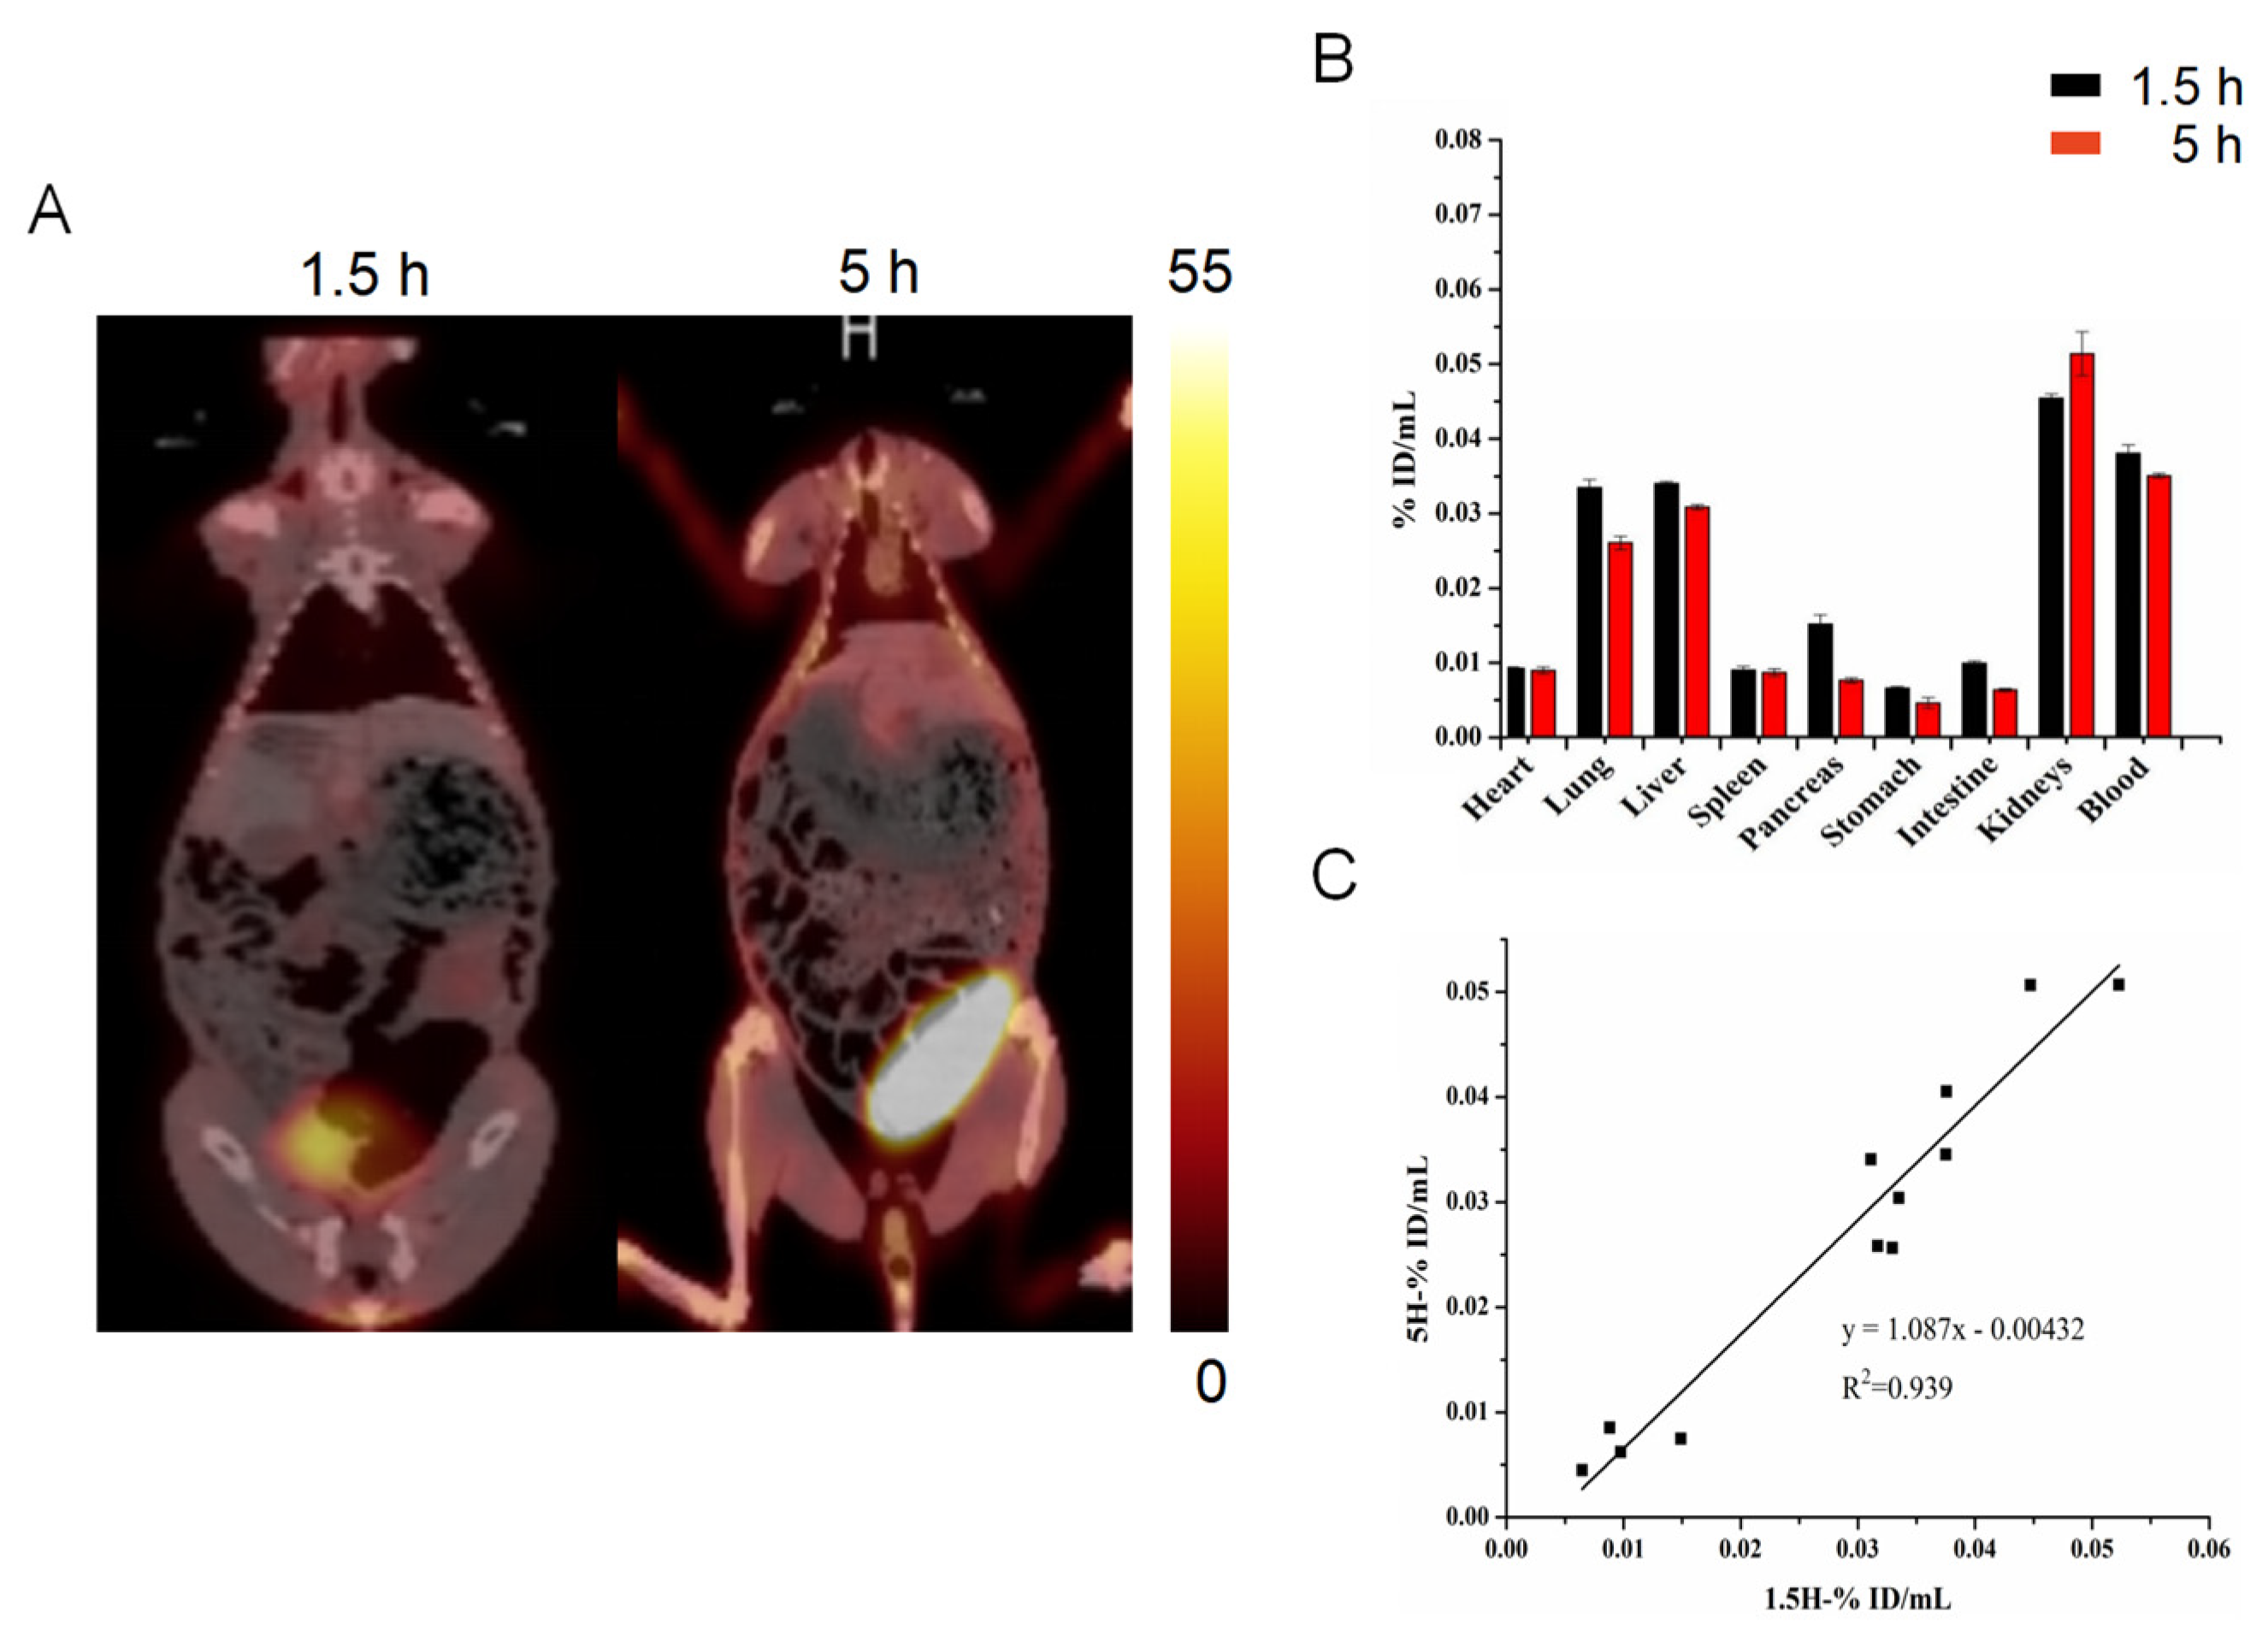
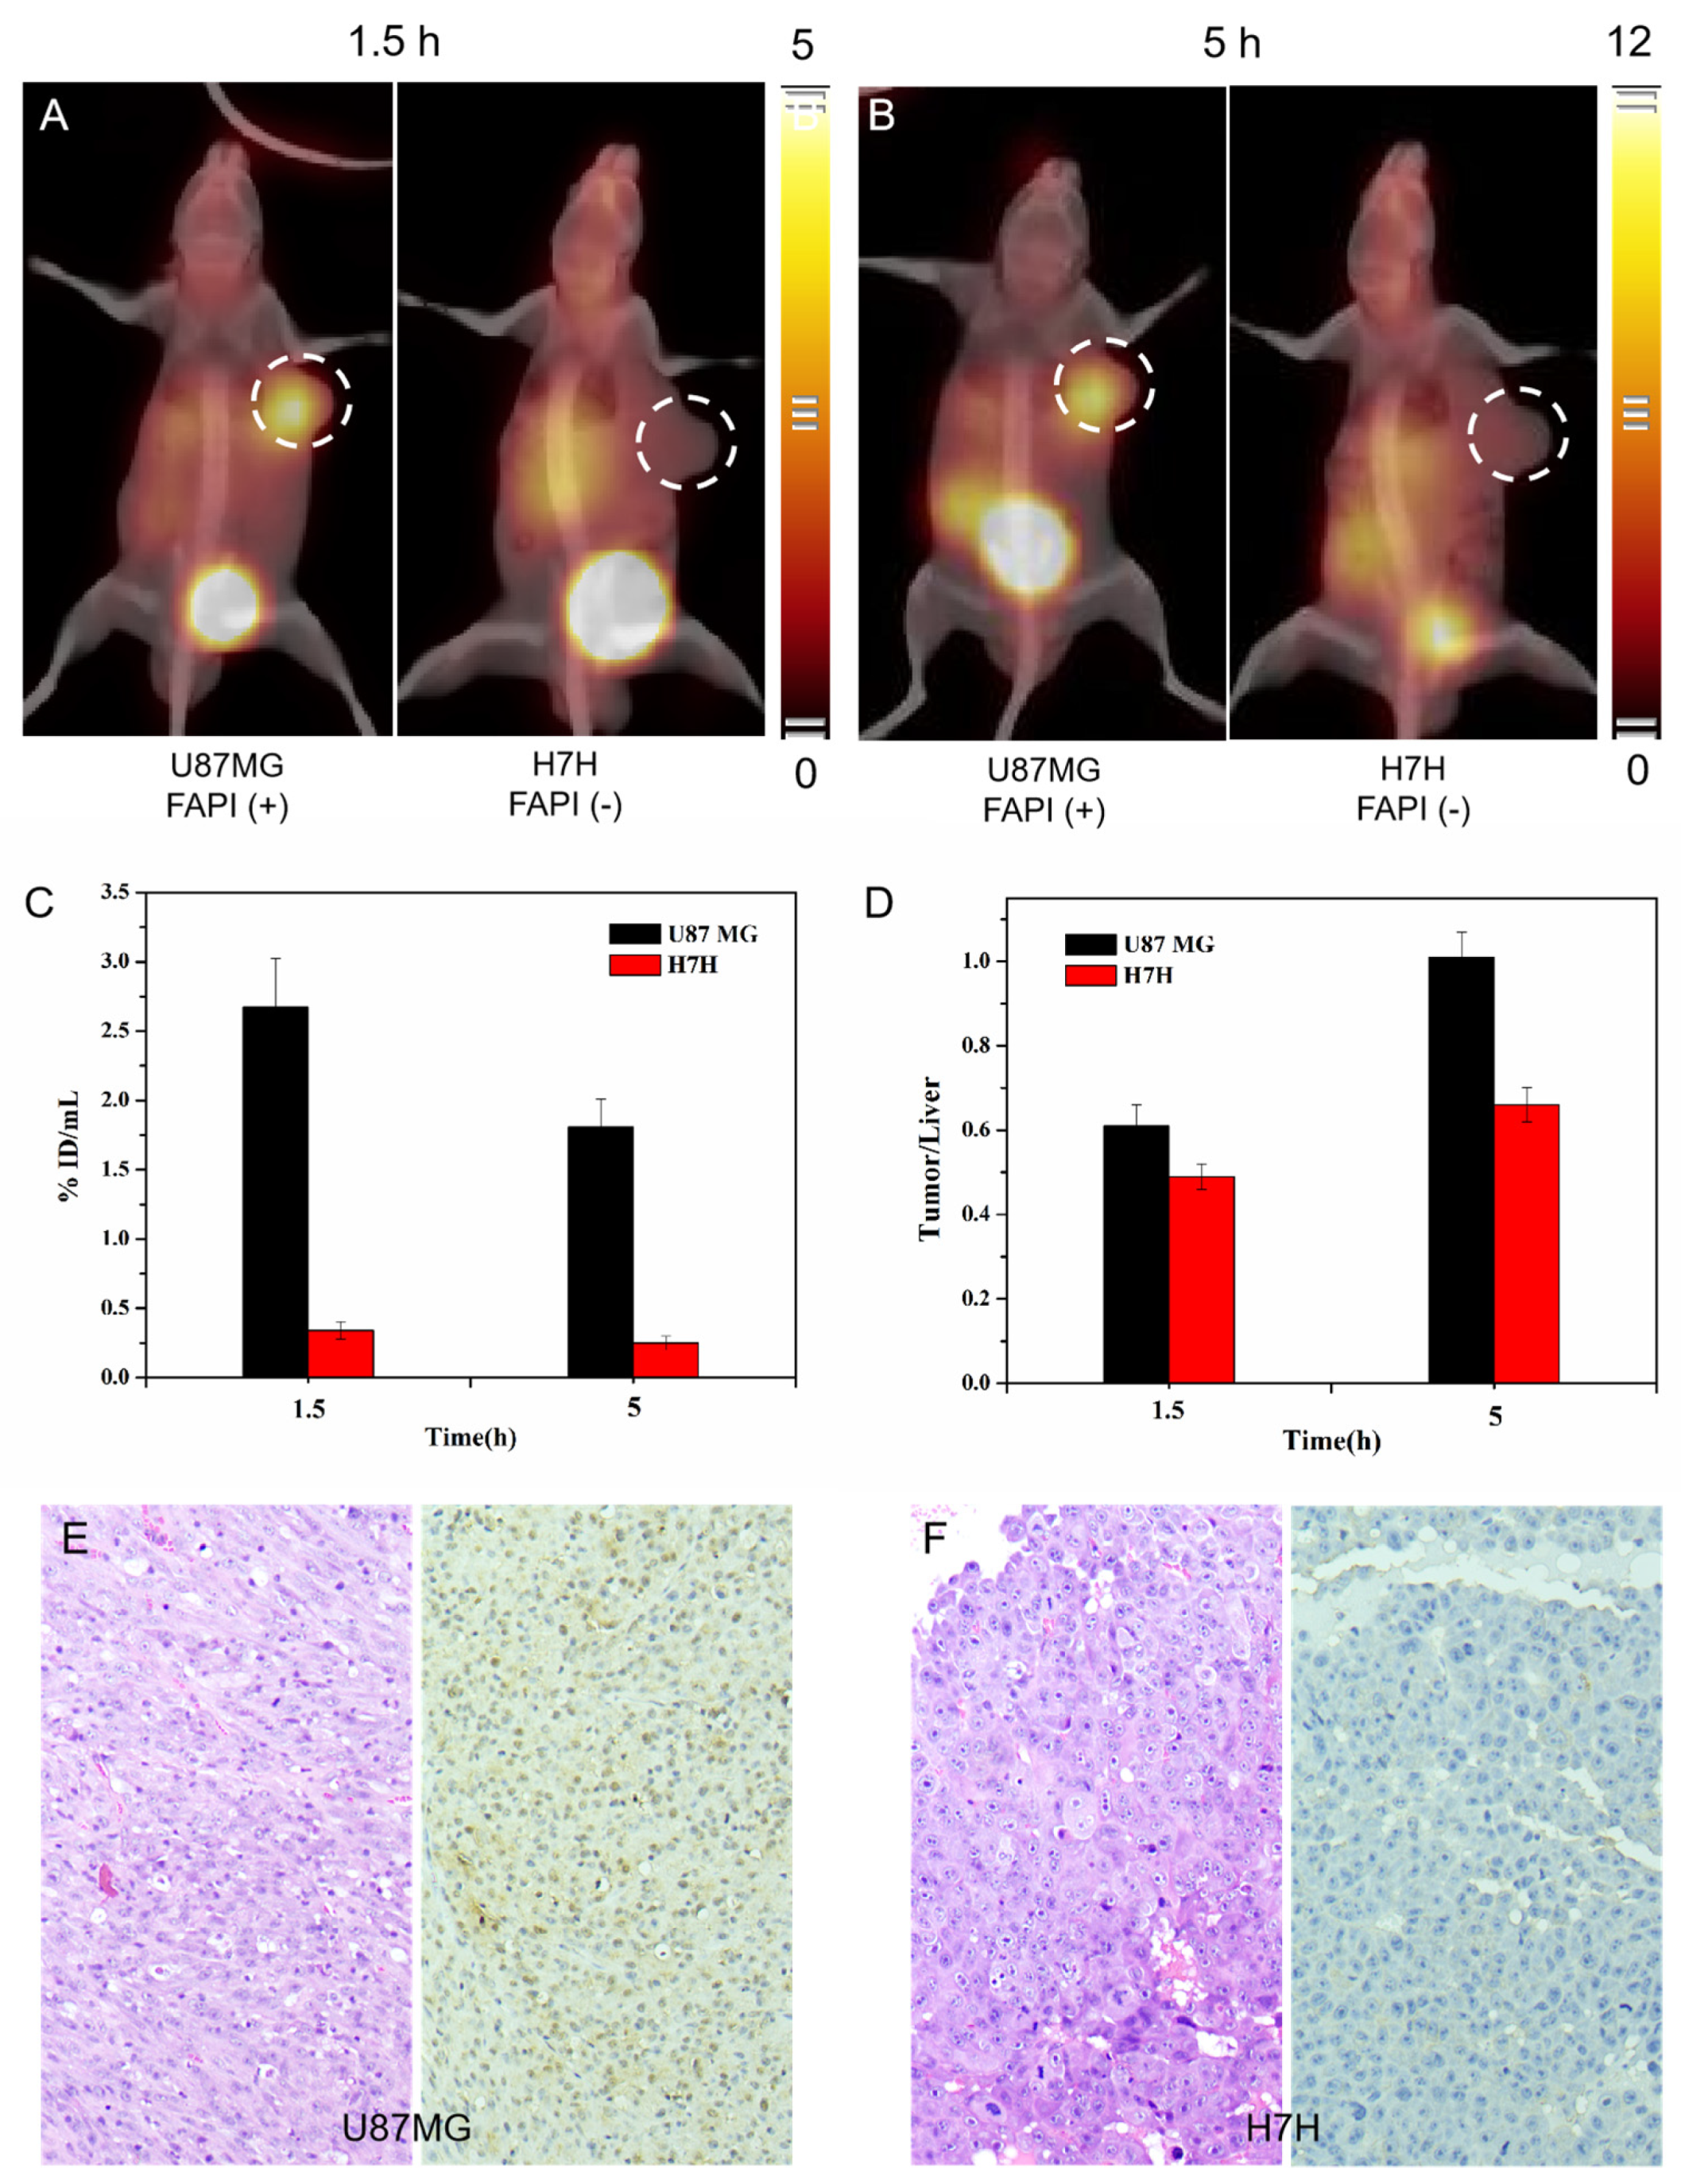
2.3. SPECT/CT Imaging with 99mTc-HYNIC-FAPI-04

The time-dependent in vivo distribution of 99mTc-HYNIC-FAPI-04 was firstly explored in rabbits. As shown in Figure 2A, most organs were of low uptake of 99mTc-HYNIC-FAPI-04 at 1.5 h P.I. and 5 h P.I., providing a clean imaging background and target to background ratio of lesion. Compared with other organs, the liver (0.03 ± 0.00 %ID/mL) and kidneys (0.04 ± 0.00 %ID/mL) were of relative higher tracer uptake at 1.5 h P.I., which indicated radioactive tracers were mainly excreted through the hepatoenteric metabolism and urinary system metabolism. At 5 h P.I., the in vivo distribution pattern of 99mTc-HYNIC-FAPI-04 was consistent with that at 1.5 h P.I.; in addition, the organ-specific uptake between 1.5 h P.I. and 5 h P.I. was of a high repeatability with a linearly dependent coefficient of 0.939, meaning the feasibility of a relatively longer scanning time window of 99mTc-HYNIC-FAPI-04 SPECT/CT.
3D whole-body 99mTc-HYNIC-FAPI-04 SPECT/CT images were obtained in severely immunodeficient NOD SCID mice bearing U87MG (FAPI+) or HUH-7 (FAPI-) tumor xenografts. As shown in Figure 3, at 1.5 h P.I., 99mTc-HYNIC-FAPI-04 uptake was clearly observed in FAP-positive U87MG tumor at 2.67 ± 0.35 %ID/mL. In contrast, uptake in FAP-negative HUH-7 xenografts was as low as 0.34 ± 0.06 %ID/mL, and no differentiable signal was observed when compared with background. At 5 h P.I., U87MG tumor was still of a high uptake at 1.81 ± 0.20 %ID/mL, an uptake value only decreased by half when compared with 1.5 h, indicating the stable binding of 99mTc-HYNIC-FAPI-04 to FAP in U87MG tumor. The tumor status can be therefore observed for a relatively long time of up to 5 h, especially given that there were higher tumor to liver ratios in the late phase of SPECT/CT examination.
In addition, the relative high uptake was clearly observed in the liver, kidneys and bladder at 1.5 h P.I., and a high uptake in intestinal tracts emerged at 5 h P.I., suggesting that radioactive tracers were mainly excreted through the hepatoenteric metabolism and urinary system metabolism.

2.4. Comparison with Other Imaging Modalities

2.4.1. Comparison with 18F-FDG PET

To perform a proof-of-concept study and evaluate the tracer performance of 18F-FDG compared to 99mTc-HYNIC-FAPI-04, PET/CT studies were performed using xenografts U87MG and HUH-7. Measurements at 60 min P.I. showed comparable biodistribution (Figure 4A,B) and specific uptake of 18F-FDG in tumors containing U87MG and HUH-7. Both U87MG and HUH-7 tumors showed obvious radioactive signals, and there was no significant difference between the target ratio and the tumor–liver ratio, indicating that tumor fibrosis was not the fundamental factor in tumor metabolism. In other words, FAP imaging can provide extra information in uncovering the subtle differences, so as to facilitate the personalized medicine. For example, the comparable tumor to liver ratios of U87MG (2.16 ± 0.78) and HUH-7 (2.58 ± 0.64) in FDG PET was adverse in making a judgement on primary lesions that were potentially originated from glioma or hepatoma, but 99mTc-HYNIC-FAPI-04 SPECT/CT at 5 h P.I. showed feasibility in differentiating the difference (Figure 3D).

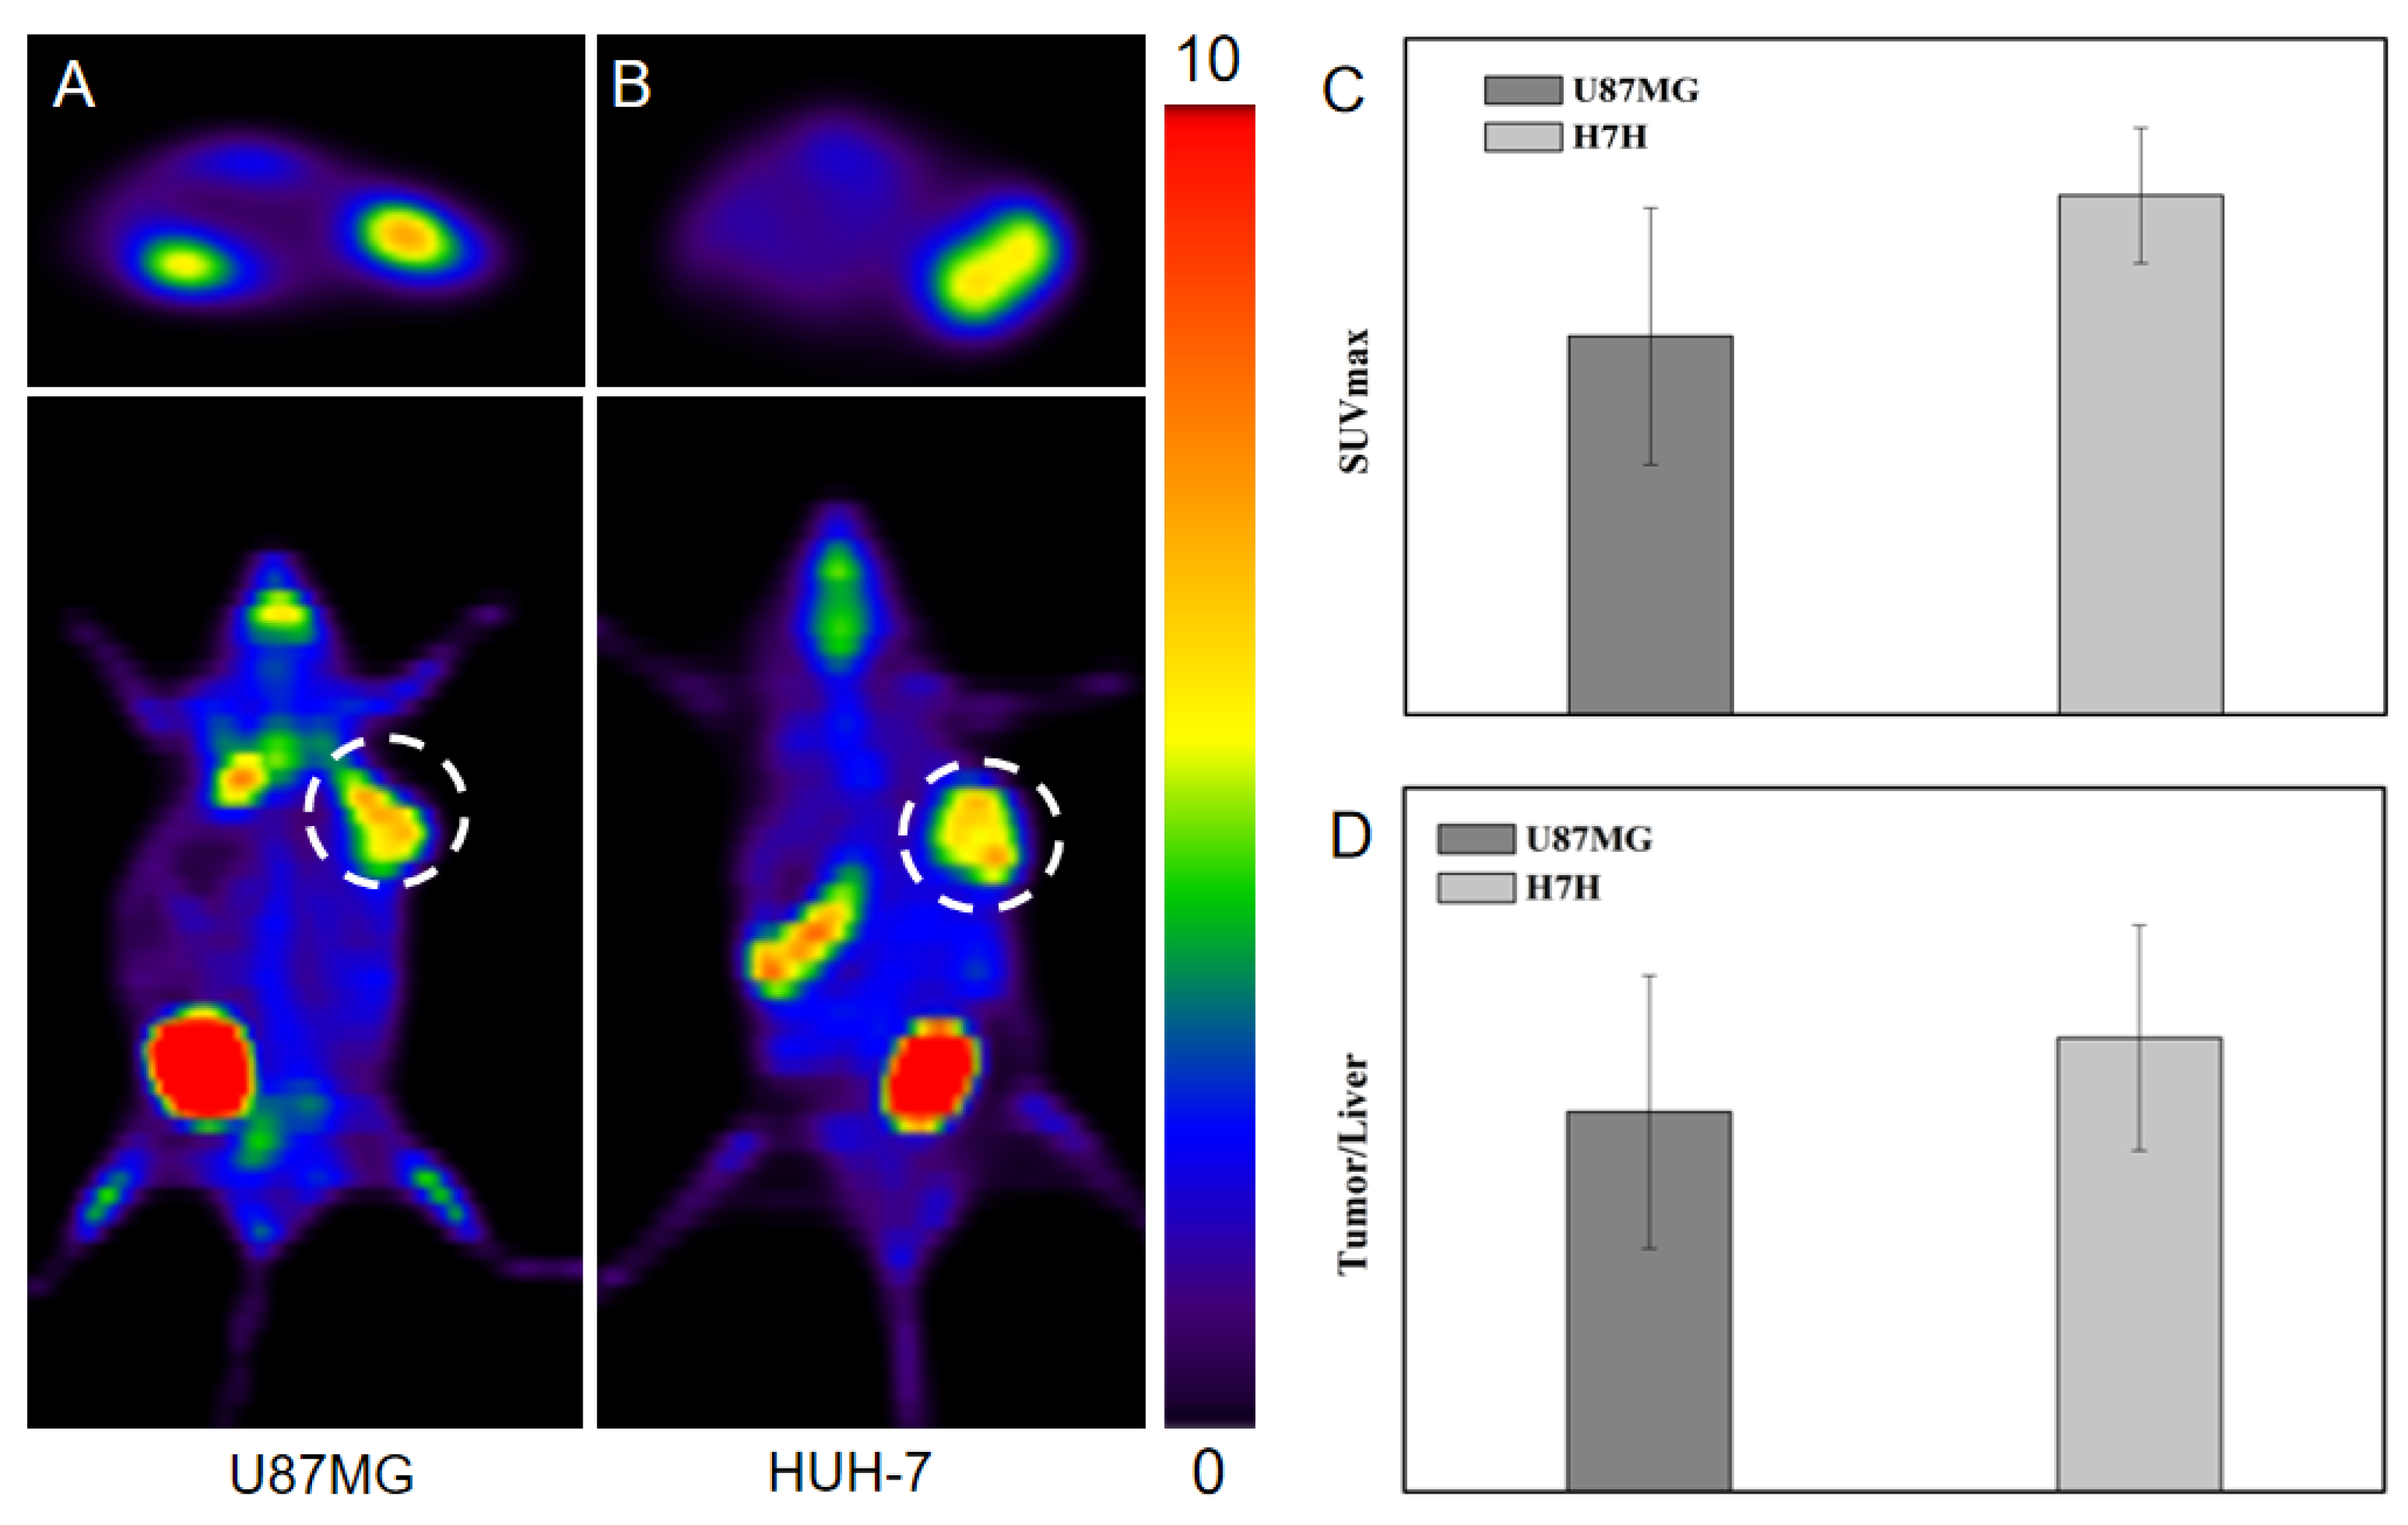
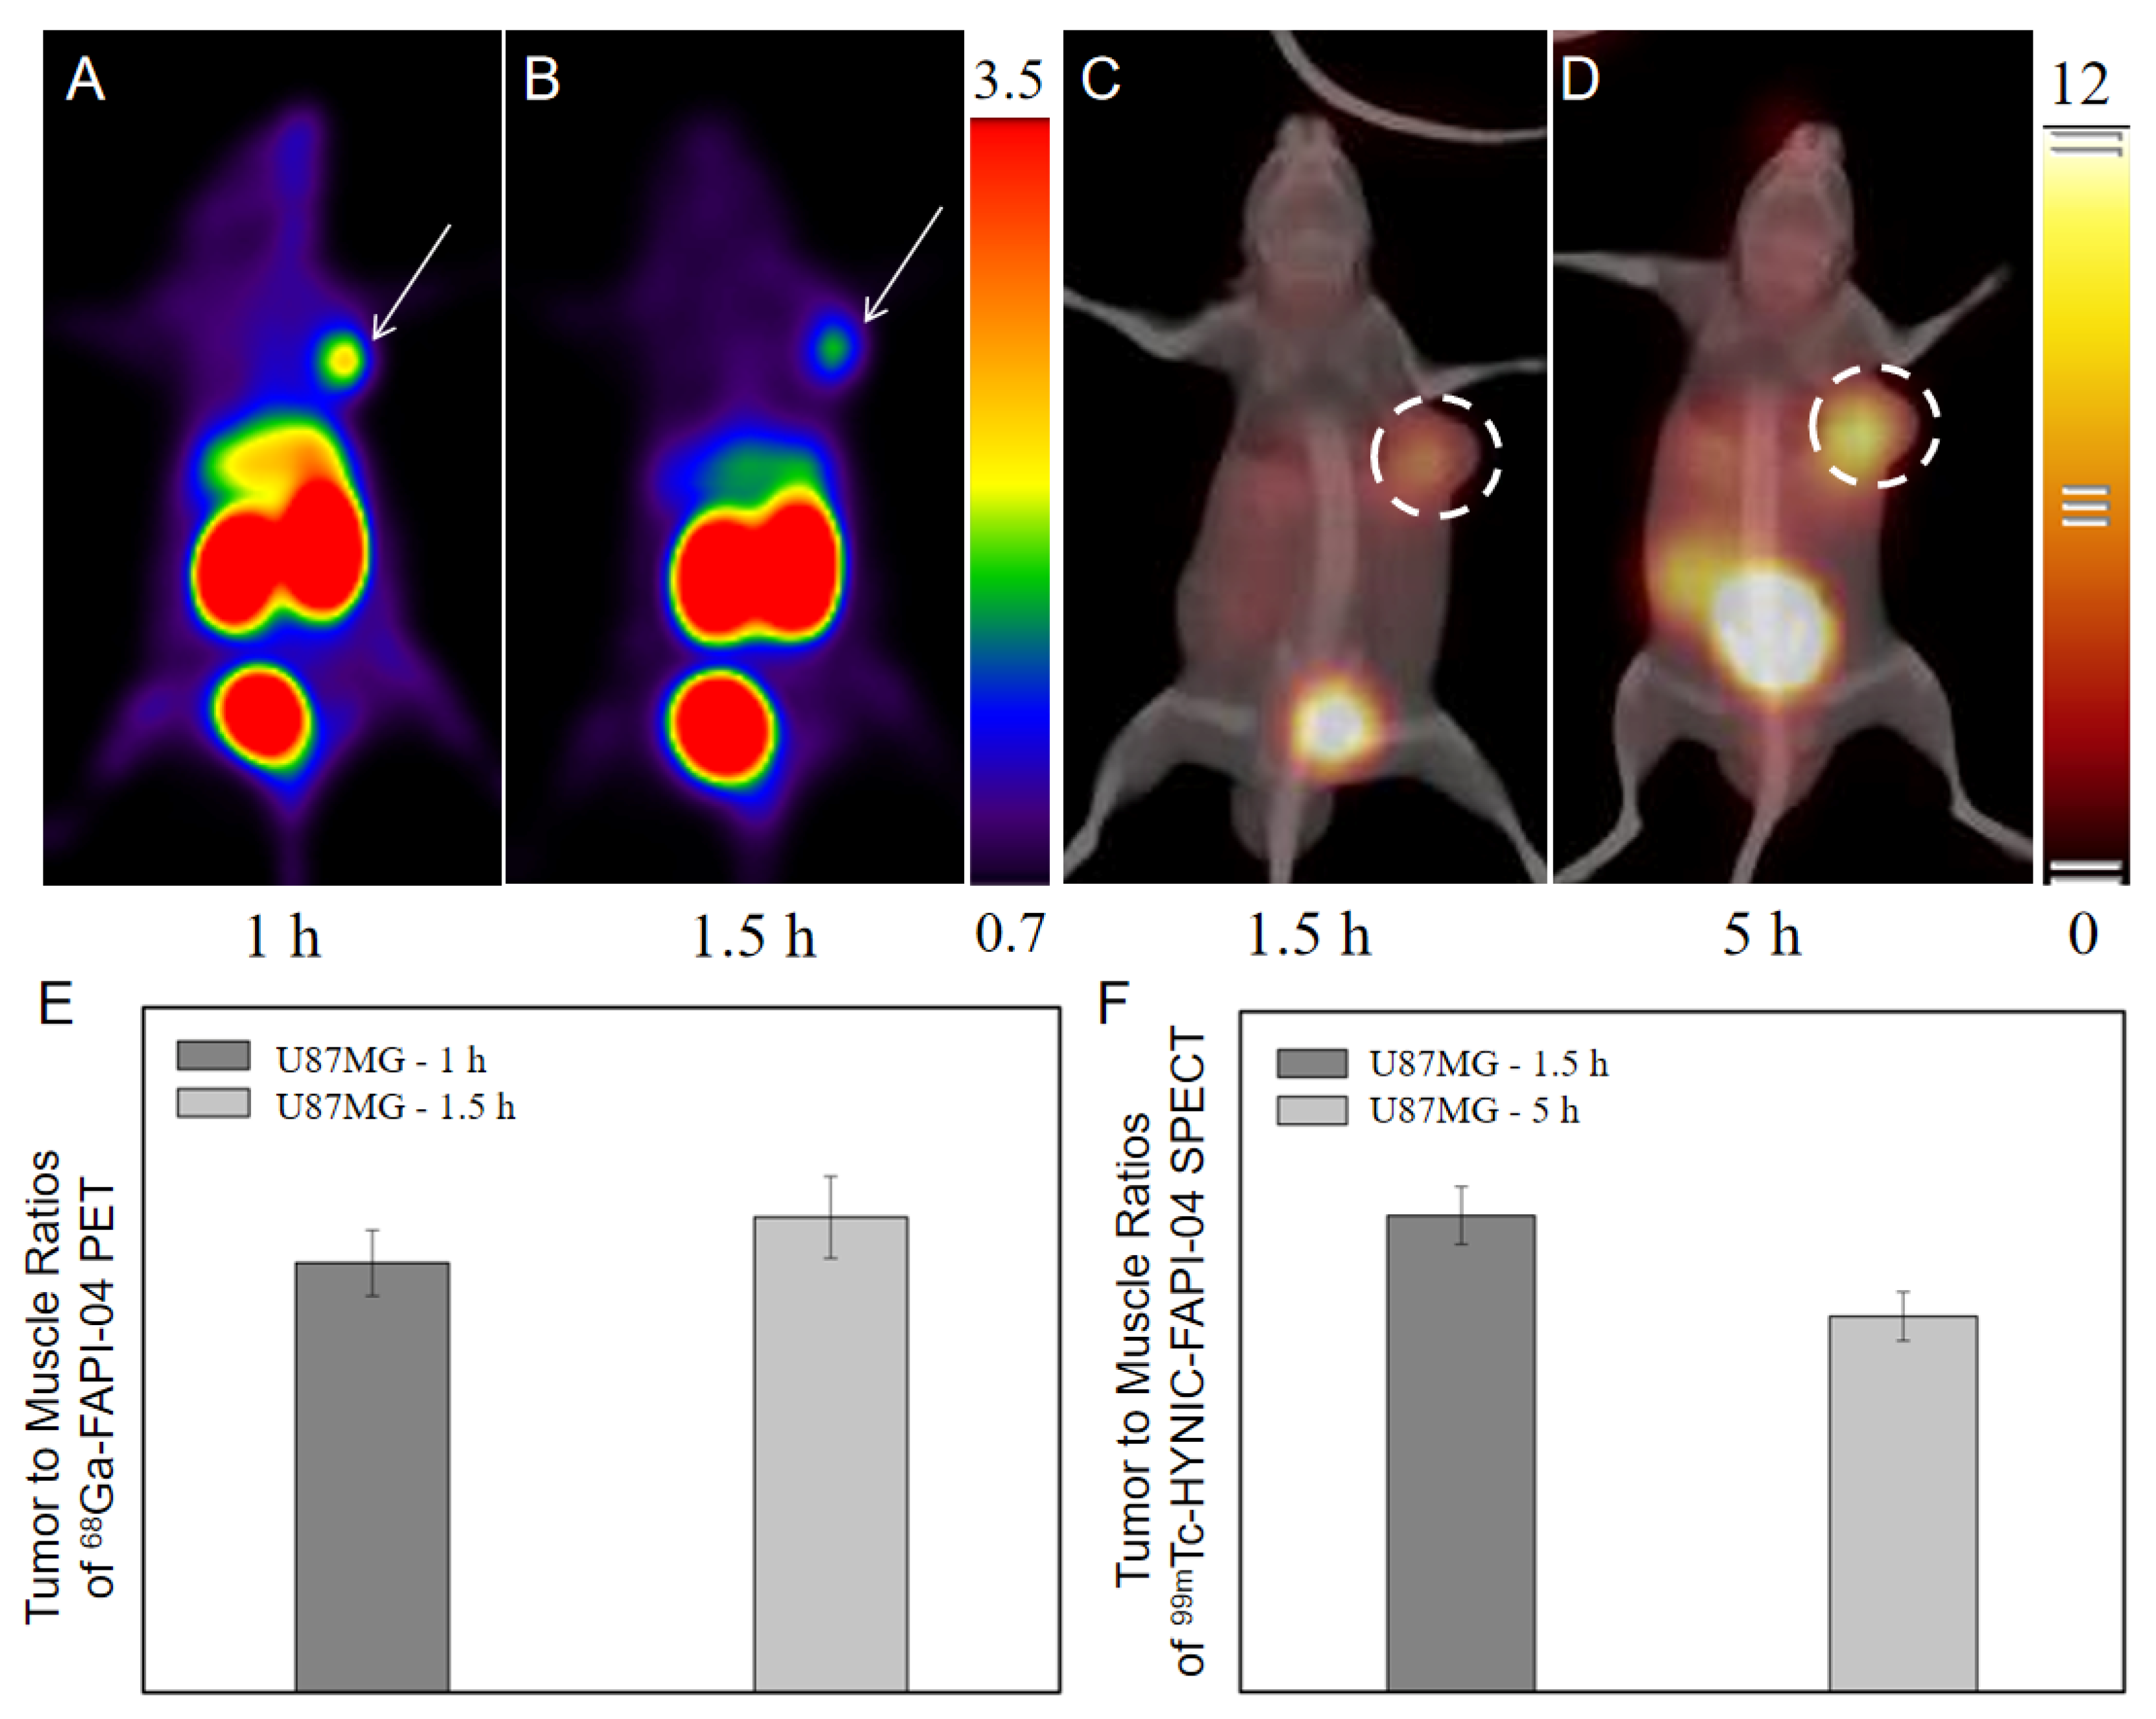
2.4.2. Comparison with 68Ga-FAPI-04 PET

As the comparison exhibits in Figure 5, for the distinguishable SPECT/CT images of U87MG tumor acquired at 1.5 h P.I., although U87MG tumor was of obvious 68Ga-FAPI-04 uptake (SUVmax = 0.362 ± 0.069) and clearly visible at 1 h P.I., the tumorous radioactive signals tended to be fuzzy at 1.5 h P.I. (SUVmax = 0.286 ± 0.033). At 5 h P.I., U87MG tumor was still distinguishable with tracer uptake as high as 1.81 ± 0.20 %ID/mL.
In the comparison of extending the differential time window (Figure 5C), tumor to muscle ratios were maintained in a comparable level when compared with the ones of routine imaging, but the proved effective dT extended from 1.5 h P.I. of 68Ga-FAPI-04 PET to 5 h P.I. of 99mTc-HYNIC-FAPI-04 SPECT, when utilizing the similar FAPI-04 analogs. Although 1.5 h P.I. was a shared optimal imaging time point of 68Ga-FAPI-04 PET and 99mTc-HYNIC-FAPI-04 SPECT, the increased tumor to background at 5 h P.I. of 99mTc-HYNIC-FAPI-04 SPECT was of clinical benefits to find metastases with low tracer uptake.

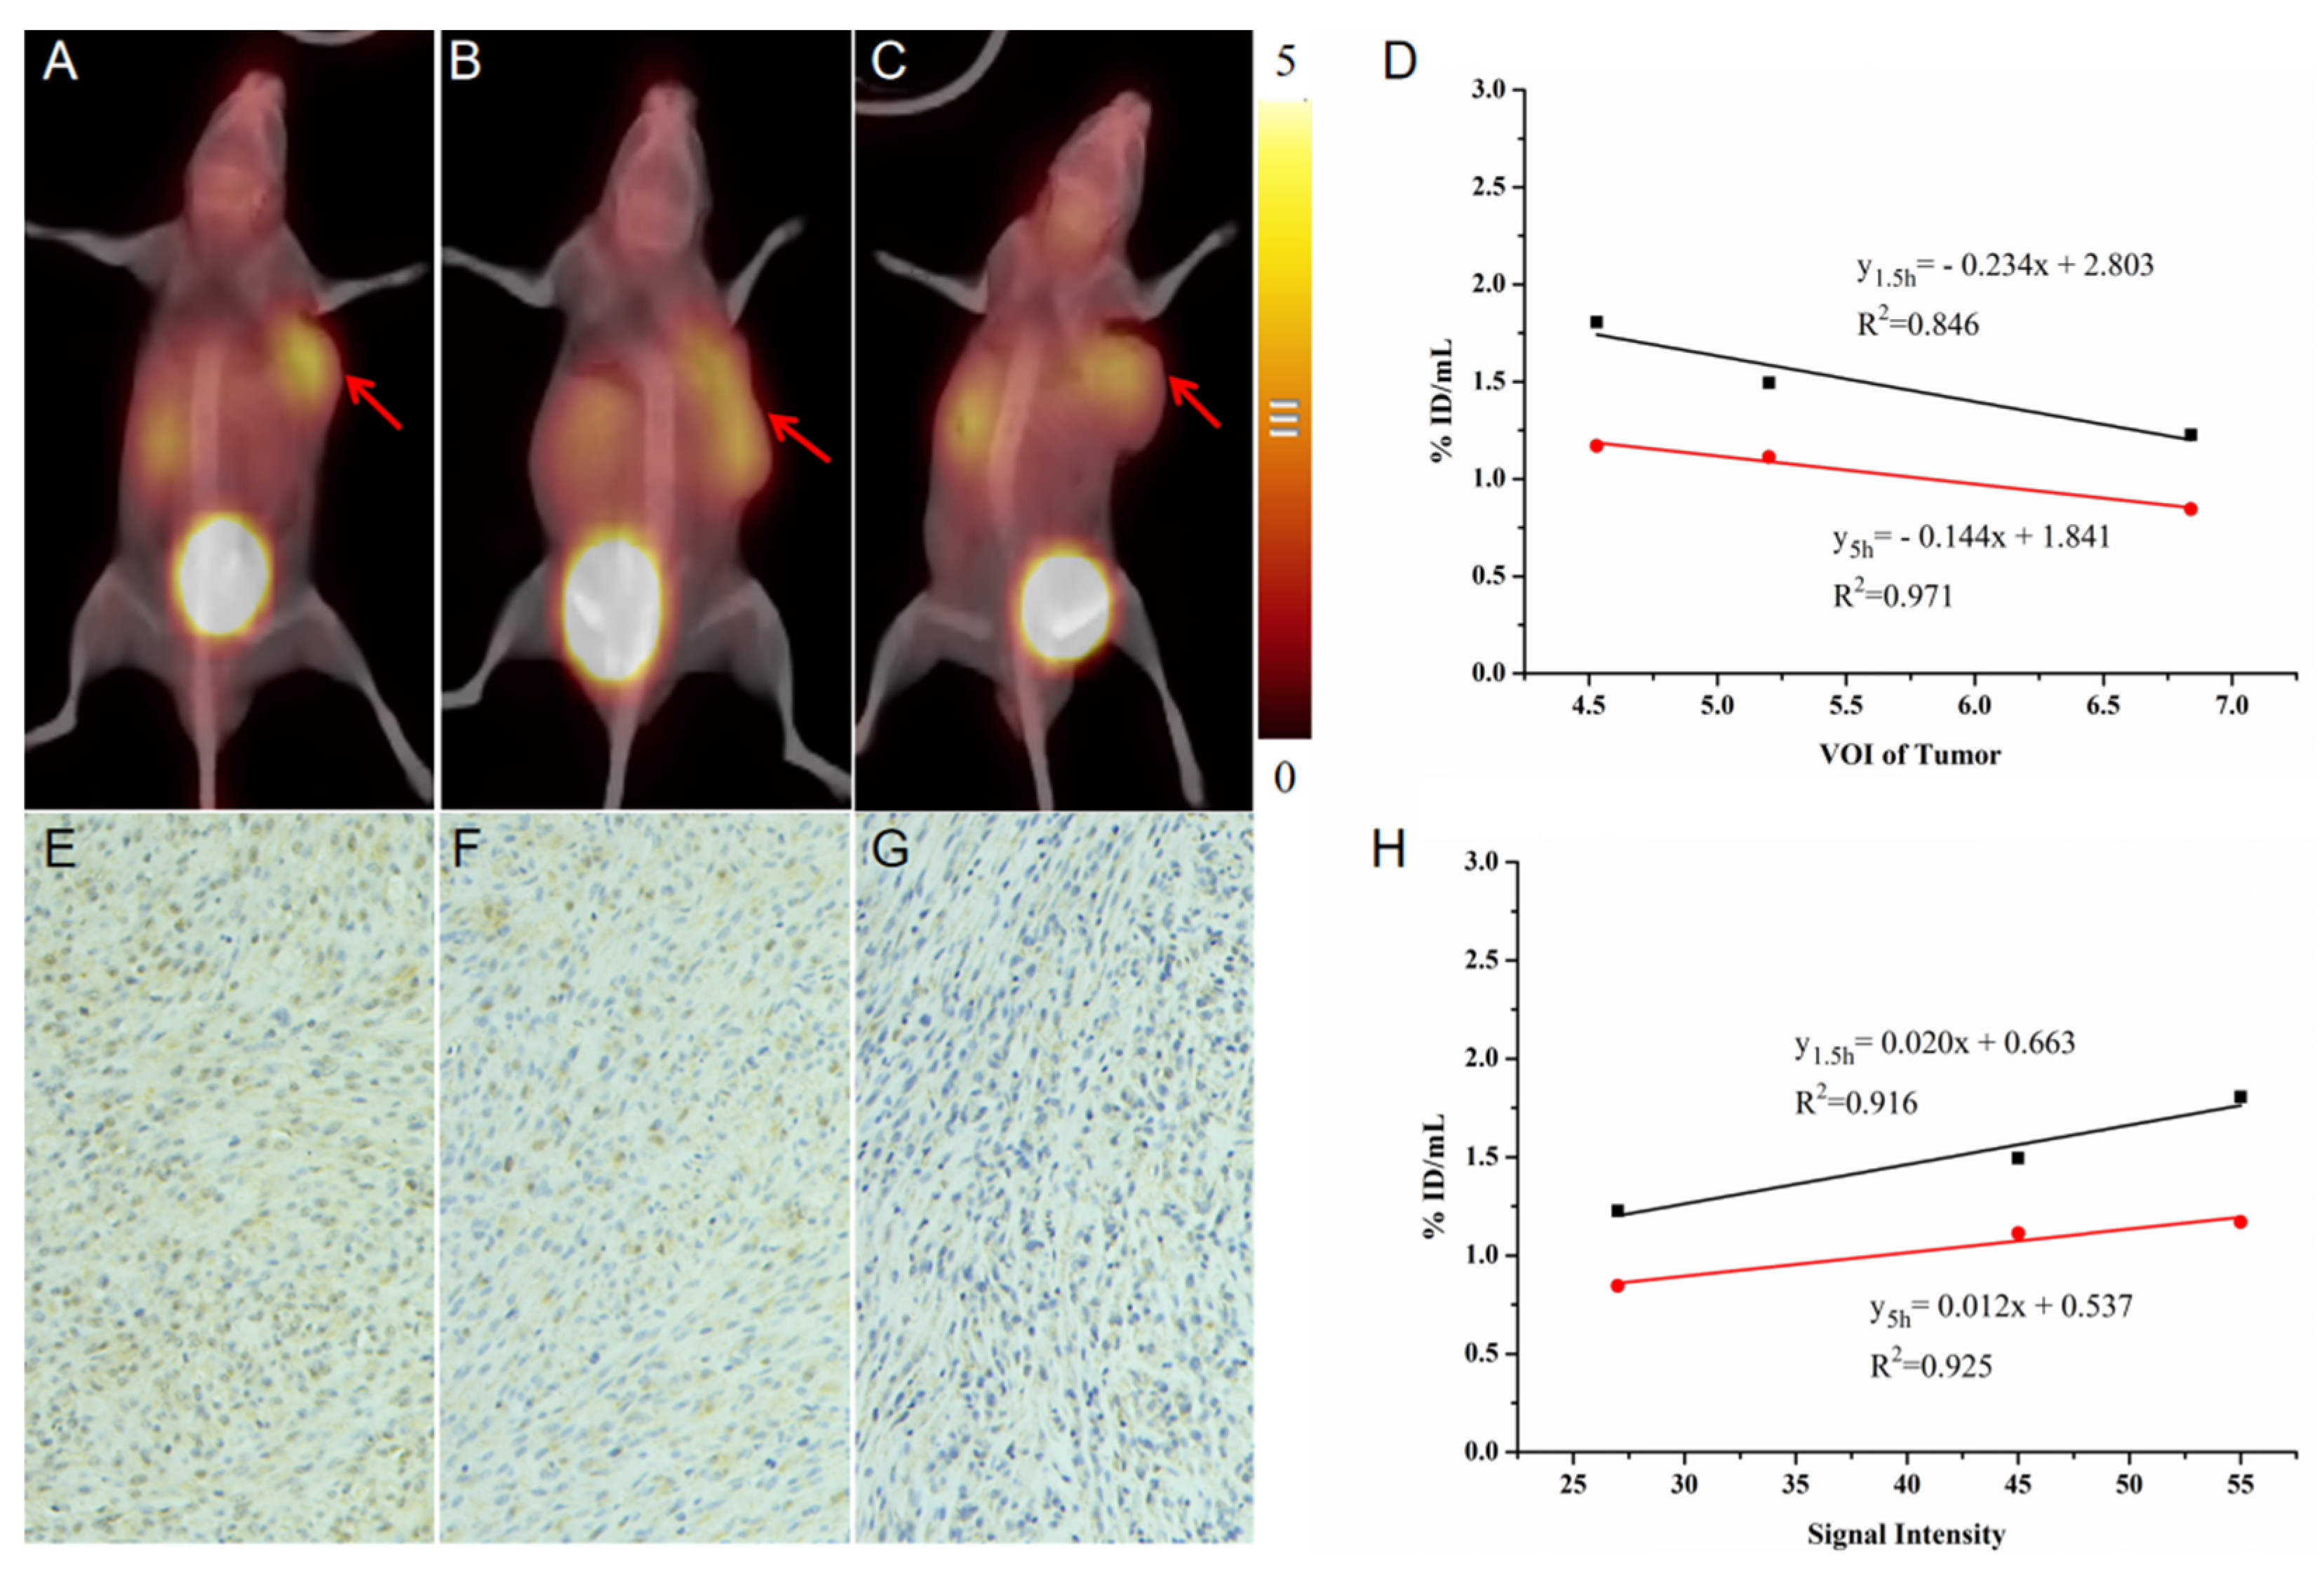
2.5. Validation of Fibrosis with a Longer Differential Time Window

Figure 6 summarizes the correlation between 99mTc-HYNIC-FAPI-04 SPECT and tumor progression, including tumor volume and FAP expression. The tracer uptake characterized as %ID/mL significantly correlated with tumor progression. For tumor volume, a negative correlation was detected that resulted in the delay of fibrosis in the rapid formation of tumor matrix (y1.5h = −0.234x + 2.803 and y5h = −0.144x + 1.841); accordingly, a positive correlation was undoubtedly manifested between tracer uptake and FAP expression (y1.5h = 0.020x + 0.663 and y5h = 0.012x + 0.537).
Notably, the tracer uptake at 5 h post injection (R2tumor volume = 0.971 and R2FAP expression = 0.925) was of a higher correlation coefficient than the quantification acquired at 1.5 h post injection (R2tumor volume = 0.846 and R2FAP expression = 0.916). The total clearance of blood background at a later time point contributed to the increase of correlation. In clinical practice, due to the existence of abundant new vessels in tumor, a correlation that avoided the interference from blood background was meaningful to FAP imaging.

3. Discussion

In clinic, the diagnostic imaging techniques of cancers include CT, MRI, ultrasound and nuclear medicine. Among the molecular imaging modalities, nuclear medicine is more sensitive to biochemical changes, and relatively bio-safe to patients, meanwhile, the biochemical characteristics of tumors can be observed at the molecular level [27,28]. Although 18F-FDG is an already-used PET/CT tracer of glucose metabolism that can be significantly taken up by hypermetabolic malignancies [29], 18F-FDG can also concentrate in inflammatory cells, causing false positive diagnosis [30]. A technique with more specificity for tumor imaging is of more potential benefits to patients. For the essential interstitial components throughout the whole process of tumor genesis and proliferation, FAP-related indicators are potentially more stable and reliable in developing a molecular imaging protocol than microenvironment-based ones, such as immunoPET. Hence, the development of Tc-99m-labeled targeted tracers is meaningful to expand the clinical applications of nuclear medicine, especially those targeted therapeutics on the basis of widely expressed targets, such as FAP.
Given the fact that tumor is composed of tumor cells and tumor matrix, as well as that FAP is highly expressed in the most abundant CAF [31,32], hence, a large number of FAP inhibitors that bind specifically to FAP have been developed [9], among which FAPI-04 has been extensively studied for its good tumor targeting effect and already utilized in diagnosing tens of cancers [25]. As an analog of DOTA-FAPI-04 and proved in this research, 99mTc-HYNIC-FAPI-04 SPECT/CT was sensitive to tumor progression, such as tumorous volume and FAP expression (Figure 6), providing a monitoring method for dynamic changes in tumor progression. 99mTc-HYNIC-FAPI-04 showed the replaceable role in vitro and in vivo via binding FAP to CAFs (Figure 1 and Figure 2), together with the facts that SPECT/CT is more popular than PET/CT and of recent advances in quantification and resolutions; hence, 99mTc-HYNIC-FAPI-04 SPECT/CT is of a promising role in diagnosing fibroblasts.
In practice, the necessity of long time and dynamic observation on FAP expression, especially on the tumor-associated fibroblasts, stands to reason due to the proven relationship between FAP and prognosis, as well as the development of dual-phase examinations. Therefore, the extension of differential time window from tens of minutes to no less than 5 h was the first concern and the primary achievement in this research.
As dT was determined by the affinity between target and targeting molecule as well as the radio-physical of nuclides, Tc-99m was an optimal supporter of dual-phase imaging or molecular imaging modalities that need a relatively long time of metabolism. For example, Technetium-99m methoxyisobutyronitrile (99mTc-MIBI) two-phase scintillate imaging is the primary preoperative localization method for patients with primary hyperparathyroidism or secondary hyperparathyroidism [33,34]. Moreover, cardiac imaging using technetium pyrophosphate (99mTc-PYP) can sensitively and specifically distinguish cardiac amyloidosis between light-chain and the transthyretin cardiac amyloidoses in patients with advanced disease [35]. More recently, 99mTc-PSMA SPECT has been extensively used as a supplement of personalized imaging, and the differential value was comparable to 68Ga-PSMA-11 PET, particularly in the cohorts with PSA higher than 2.10 ng/mL [36]. In consequence, 99mTc-HYNIC-FAPI-04 SPECT was also of potential in exploring more capacities that were not qualified by FAPI-04 PET.
Besides these proved possibilities, there were also some limitations in this research. More type of tumors with high FAP expressed should be used for validation of 99mTc-HYNIC-FAPI-04 SPECT imaging, such as the tumor model co-cultured with tumor matrix. Further studies dedicated to evaluating the diagnostic performance in tumor fibrosis are highly warranted.

4. Materials and Methods

4.1. Reagents and Equipment

All chemical reagents and solvents were purchased from Merck Sigma-Aldrich Co., Ltd. (Shanghai, China), and can be used without further purification. The Dulbecco′s modified Eagle′s medium (DMEM) and FBS were purchased from Gibco Life Technology Co., Ltd. (New York, NY, USA). The precursors of FAPI-04 was purchased from Shanghai Nice-labeling Biotechnology Co., Ltd. (Shanghai, China), and HYNIC-FAPI-04 was obtained from Shanghai Junna Medical Technology Co., Ltd. (Shanghai, China). Na99mTcO4 was freshly eluted with sodium chloride through a 99Mo/99mTc generator obtained from Shanghai Atom Kexing Pharmaceutical Co., Ltd. (Shanghai, China). 18F-FDG was purchased from Shanghai Atom Kexing Pharmaceutical Co., Ltd.
The radioactive thin layer chromatographic instrument Mini-Scan (Eckert & Ziegler, Bioscan Inc., Poway, CA, USA) was used for quality control, and a PET/CT scanner (Siemens Healthcare, Erlangen, Germany) and SPECT/CT scanner (Symbia T16, Siemens, Germany) were used for animal imaging.

4.2. Radiopharmaceuticals and Quality Control

A kit was developed for convenient used in radiolabeling, which contained 20 µg HYNIC-FAPI-04, 10 mg EDDA and 20 mg tricine. For radiolabeling, 50 μL SnCl2 solution (1 mg/mL in 0.05 M HCl) was added to the kit. Then, 5 mCi (185 MBq) of eluted Na99mTcO4 was added immediately. The mixture was heated for 15 min at 100 °C to prepare the raw product of 99mTc-HYNIC-FAPI-04, which was then purified with sep-pak C-18 column. 50% alcohol and normal saline were successively used as the flow separation phase.
The radiochemical purity of 99mTc-HYNIC-FAPI-04 was determined by iTLC. The amount of 99mTc-HYNIC-FAPI-04 (Rf = 0) and free 99mTcO4 (Rf = 1) were determined using thin layer chromatography paper as stationary phase and acetone as mobile phase.
The stability of 99mTc-HYNIC-FAPI-04 in vitro was tested in phosphate buffer saline (0.01 M, pH = 7.4) and 5% FBS. 99mTc-HYNIC-FAPI-04 was mixed with PBS or 5% FBS and kept at room temperature for 6 h. At different time points (0.5, 1, 2, 4, 6 h), the RCP of 99mTc-HYNIC-FAPI-04 in PBS and 5% FBS was determined by the above iTLC method.
The preparation of 68Ga-FAPI-04 was reported in previous work [37]. The rinsed 68Ga from the 68Ge/68Ga generator (ITM, Munich, Germany) was mixed with the precursor FAPI-04 in 0.25 M sodium acetate and reacted at 100 °C for 10 min. 68Ga-FAPI-04 was obtained by coupling 68Ga with the DOTA of FAPI-04 and of an RCP > 95%.

4.3. Cell Culture and In Vitro Binding Efficiency

U87MG (human glioma cells) and HUH-7 cells were purchased from the Chinese Infrastructure of Cell Line Resource. U87MG and HUH-7 cells in DMEM with 10% FBS and double antibody were cultured in an incubator containing 5% CO2 at 37 °C.
In vitro cell uptake of 99mTc-HYNIC-FAPI-04 was performed with U87MG cells. About 3 × 10⁵ cells were inoculated in 24-well cell culture plates (five multiple pores in each group) and then incubated with 99mTc-HYNIC-FAPI-04 and kept at 37 °C for 1, 2 and 4 h. To determine the specific cell uptake, a blocking assay was set up to block U87MG cells with the analogous precursor of FAPI-04. At each incubation end, the medium was removed, and the cells were washed with saline solution. Cells were finally cleaved with 1 M NaOH, and the radioactive counts were measured using a gamma counter.

4.4. Animal Models

Animal studies were approved by Shanghai Changhai Hospital Ethics Committee (Shanghai, China; approval number: CHEC2021-071) and carried out in accordance with the principles of laboratory animal care. Severely immunodeficient male NOD SCID mice were obtained from Beijing Vital River Laboratory Animal Technology Co., Ltd. (Beijing, China). In order to establish U87MG subcutaneous tumor model, U87MG cells (4 × 10⁶ in 100 μL DMEM) were inoculated into the right anterior axilla. When the diameter reaches about 5~7 mm, tumor can be used to study the biological distribution. HUH-7 subcutaneous tumor models were obtained following the same protocol. 5 mice in each group. Five male New Zealand white rabbits (9–12 weeks of age, weighing 2.0–2.5 kg) were purchased from Shanghai Sippr-BK LAB Animal Co., Ltd. (Shanghai China) to explore the patterns of in vivo distribution and metabolism of 99mTc-HYNIC-FAPI-04.

4.5. SPECT/CT Imaging

SPECT/CT imaging was performed in mice carrying U87MG glioma or HUH-7 hepatocellular carcinoma xenografts. After anaesthesia, 7.4 MBq 99mTc-HYNIC-FAPI-04 for each mouse and 111 MBq 99mTc-HYNIC-FAPI-04 for each rabbit were injected into the caudal vein. Imaging was performed with a low-energy, high-resolution SPECT/CT scanner (frame time, 25 s; slice, 0.75 mm) at 1.5 and 5 h after injection.

4.6. PET/CT Imaging

For mice, 68Ga-FAPI-04 PET and 18F-FDG PET were performed immediately after SPECT scans. Mice were kept fasting for 8 h before the scans. For 18F-FDG PET, mice were anesthetized and each was injected with 7.4 MBq 18F-FDG to the tail vein. PET/CT imaging in mice with glioma and liver cancer was performed at 1 h post injection. The mice were fixed on the examination bed in a prone position for CT scanning (effective current, 170 mAs; voltage, 120 kV; slice, 0.75 mm) and PET collection.
68Ga-FAPI-04 PET/CT scans were performed at 60 min and 90 min post injection. Mice were injected with 68Ga-FAPI-04 to the tail vein at 7.4 MBq/mouse. The mice were scanned with the same protocol with 18F-FDG PET.

4.7. Definition and Quantification of ROIs

On the PET/CT image, SUV was calculated by drawing the circular areas of interest, including the tumor, liver and muscle, and then the SUVmax was determined. The ratio of tumor to muscle and the ratio of tumor to liver were calculated. On the SPECT/CT image, for mice, the tumor, liver, and total body areas of interest were mapped to obtain the total counts and volume, and then the %ID/mL of tumor and liver were calculated. Similarly, the areas of interest of rabbits were manually drawn on the SPECT/CT image to obtain the counts and volume, and the organ-specific uptakes of 99mTc-HYNIC-FAPI-04 were quantified as %ID/mL.

4.8. Immunohistochemistry and Quantification

For each xenograft that was harvested immediately after the imaging, hematoxylin-eosin staining and immunohistochemical staining of FAP expression were performed to present the tumor progression and difference on molecular level. In detail, the slides were incubated overnight with fibroblast activation protein (FAP) antibody (ab53066, rabbit polyclonal IgG: diluted 1:100; Abcam, Shanghai, China) at 4℃. Then, slices were incubated with a secondary goat anti-rabbit antibody (cat. no. GB23303; Wuhan Servicebio Technology Co., Ltd., Shanghai, China; 1:200) at room temperature for 50 min. FAP expression was quantified with Image for the staining intensity of FAP-positive area.

4.9. Statistics

The differences of tracer uptake between FAP-positive and FAP-negative models were evaluated with independent samples t-test, and any difference with p-value < 0.05 was statistically significant.

5. Conclusions

99mTc-HYNIC-FAPI-04 extended the differential time window in evaluating tumor fibrosis, as well as intensified the advantage of high target-to-background ratio.

Author Contributions

Conceptualization, R.L., X.L. (Xiu Luo) and Z.Z.; methodology, R.L., X.L. (Xiu Luo) and C.C.; formal analysis, T.W.; investigation, D.F.; data curation, X.L. (Xiu Luo), Z.Z. and C.C.; writing—original draft preparation, X.L. (Xiu Luo), Z.Z. and C.C.; writing—review and editing, G.Y. and R.L.; funding acquisition, C.Z.; project administration, R.L., G.Y. and X.L. (Xiao Li). All authors have read and agreed to the published version of the manuscript.

Funding

This research was funded by the Special Foundation for Emerging Interdisciplinary Field Research of Shanghai Municipal Health Commission (Grant No. 2022JC004), the National Natural Science Foundation of China (Grant No. 82272040), the First Affiliated Hospital of Naval Medical University (Shanghai Changhai Hospital) “Guhai Plan in the 14th Five-Year Plan period” (Grant No. GH145-22), and the “Discipline Construction Climbing 234 Plan” of Shanghai Changhai Hospital of Naval Medical University (Grant No. 2019YPT002 and 2020YPT002).

Institutional Review Board Statement

The animal study protocol was approved by the Ethics Committee of Shanghai Changhai Hospital (protocol code CHEC2021-071 and date of approval (13 April 2021).

Informed Consent Statement

Not applicable.

Data Availability Statement

Data is contained within the article.

Conflicts of Interest

The authors declare no conflict of interest.

References

  1. Scanlan, M.J.; Mohan, B.K.; Calvo, B.; Garin-Chesa, P.; Sanz-Moncasi, M.P.; Healey, J.H.; Old, L.J.; Rettig, W.J. Molecular cloning of fibroblast activation protein alpha, a member of the serine protease family selectively expressed in stromal fibroblasts of epithelial cancers. Proc. Natl. Acad. Sci. USA 1994, 91, 5657–5661. [Google Scholar] [CrossRef] [PubMed] [Green Version]
  2. Hamson, E.J.; Keane, F.M.; Tholen, S.; Schilling, O.; Gorrell, M.D. Understanding fibroblast activation protein (FAP): Substrates, activities, expression and targeting for cancer therapy. Proteom. Clin. Appl. 2014, 8, 454–463. [Google Scholar] [CrossRef]
  3. Kratochwil, C.; Flechsig, P.; Lindner, T.; Abderrahim, L.; Altmann, A.; Mier, W.; Adeberg, S.; Rathke, H.; Röhrich, M.; Winter, H.; et al. 68Ga-FAPI PET/CT: Tracer uptake in 28 different kinds of cancer. J. Nucl. Med. 2019, 60, 801–805. [Google Scholar] [CrossRef] [PubMed] [Green Version]
  4. Coto-Llerena, M.; Ercan, C.; Kancherla, V.; Taha-Mehlitz, S.; Eppenberger-Castori, S.; Soysal, S.D.; Charlotte, K.Y.; Bolli, M.; Flüe, M.V.; Nicolas, G.P.; et al. High expression of FAP in colorectal cancer is associated with angiogenesis and immunoregulation processes. Front. Oncol. 2020, 10, 979–991. [Google Scholar] [CrossRef]
  5. Wikberg, M.L.; Edin, S.; Lundberg, I.V.; Guelpen, B.V.; Dahlin, A.M.; Rutegard, J.; Stenling, R.; Öberg, A.; Palmqvist, R. High intratumoral expression of fibroblast activation protein (FAP) in colon cancer is associated with poorer patient prognosis. Tumor Biol. 2013, 34, 1013–1020. [Google Scholar] [CrossRef] [PubMed] [Green Version]
  6. Simkova, A.; Busek, P.; Sedo, A.; Konvalinka, J. Molecular recognition of fibroblast activation protein for diagnostic and therapeutic applications. Biochim. Biophys. Acta Proteins Proteom. 2020, 1868, 140409. [Google Scholar] [CrossRef]
  7. Boonkawin, N.; Chotipanich, C. The first radiolabeled 68Ga-FAPI-46 for clinical PET applications using a fully automated iQS-TS synthesis system in Thailand. J. Chulabhorn R. Acad. 2021, 3, 180–188. Available online: https://he02.tci-thaijo.org/index.php/jcra/article/view/249531 (accessed on 22 July 2021).
  8. Loktev, A.; Lindner, T.; Mier, W.; Debus, J.; Altmann, A.; Jäger, D.; Giesel, F.; Kratochwil, C.; Barthe, P.; Roumestand, C.; et al. A tumor-imaging method targeting cancer-associated fibroblasts. J. Nucl. Med. 2018, 59, 1423–1429. [Google Scholar] [CrossRef] [Green Version]
  9. Loktev, A.; Lindner, T.; Burger, E.M.; Altmann, A.; Giesel, F.; Kratochwil, C.; Debus, J.; Marmé, F.; Jäger, D.; Mier, W.; et al. Development of fibroblast activation protein-targeted radiotracers with improved tumor retention. J. Nucl. Med. 2019, 60, 1421–1429. [Google Scholar] [CrossRef]
  10. Giesel, F.L.; Kratochwil, C.; Lindner, T.; Marschalek, M.M.; Loktev, A.; Lehnert, W.; Debus, J.; Jäger, D.; Flechsig, P.; Altmann, A.; et al. 68Ga-FAPI PET/CT: Biodistribution and preliminary dosimetry estimate of 2 DOTA-containing FAP-targeting agents in patients with various cancers. J. Nucl. Med. 2019, 60, 386–392. [Google Scholar] [CrossRef] [Green Version]
  11. Lindner, T.; Loktev, A.; Altmann, A.; Giesel, F.; Kratochwil, C.; Debus, J.; Jäger, D.; Mier, W.; Haberkorn, U. Development of quinoline-based theranostic ligands for the targeting of fibroblast activation protein. J. Nucl. Med. 2018, 59, 1415–1422. [Google Scholar] [CrossRef] [PubMed] [Green Version]
  12. Chen, H.J.; Zhao, L.; Ruan, D.; Pang, Y.Z.; Hao, B.; Dai, Y.Q.; Wu, X.R.; Guo, W.; Fan, C.L.; Wu, J.X.; et al. Usefulness of [68Ga]Ga-DOTA-FAPI-04 PET/CT in patients presenting with inconclusive [18F]FDG PET/CT findings. Eur. J. Nucl. Med. Mol. Imaging 2021, 48, 73–86. [Google Scholar] [CrossRef] [PubMed]
  13. Shi, X.M.; Xing, H.Q.; Yang, X.B.; Li, F.; Yao, S.B.; Jia, C.W.; Zhao, H.T.; Hacker, M.; Huo, L.; Li, X. Comparison of PET imaging of activated fibroblasts and 18F-FDG for diagnosis of primary hepatic tumours: A prospective pilot study. Eur. J. Nucl. Med. Mol. Imaging 2021, 48, 1593–1603. [Google Scholar] [CrossRef] [PubMed]
  14. Chen, H.J.; Pang, Y.Z.; Wu, J.X.; Zhao, L.; Hao, B.; Wu, J.; Wei, J.H.; Wu, S.M.; Zhao, L.; Luo, Z.M.; et al. Comparison of [68Ga]Ga-DOTA-FAPI-04 and [18F] FDG PET/CT for the diagnosis of primary and metastatic lesions in patients with various types of cancer. Eur. J. Nucl. Med. Mol. Imaging 2020, 47, 1820–1832. [Google Scholar] [CrossRef] [PubMed]
  15. Wang, S.L.; Zhou, X.; Xu, X.X.; Ding, J.; Liu, S.; Hou, X.G.; Li, N.; Zhu, H.; Yang, Z. Clinical translational evaluation of Al18F-NOTA-FAPI for fibroblast activation protein-targeted tumour imaging. Eur. J. Nucl. Med. Mol. Imaging 2021, 48, 4259–4271. [Google Scholar] [CrossRef]
  16. Hicks, R.J.; Roselt, P.J.; Kallur, K.G.; Tothill, R.W.; Mileshkin, L. FAPI PET/CT: Will It End the Hegemony of 18F-FDG in Oncology? J. Nucl. Med. 2021, 62, 296–302. [Google Scholar] [CrossRef] [PubMed]
  17. Eryilmaz, K.; Kilbas, B. Fully-automated synthesis of 177Lu labelled FAPI derivatives on the module modular lab-Eazy. EJNMMI Radiopharm. Chem. 2021, 6, 16–25. [Google Scholar] [CrossRef]
  18. Watabe, T.; Liu, Y.; Kaneda-Nakashima, K.; Shirakami, Y.; Lindner, T.; Ooe, K.; Toyoshima, A.; Nagata, K.; Shimosegawa, E.; Haberkorn, U.; et al. Theranostics targeting fibroblast activation protein in the tumor stroma: 64Cu- and 225Ac-labeled FAPI-04 in pancreatic cancer xenograft mouse models. J. Nucl. Med. 2020, 61, 563–569. [Google Scholar] [CrossRef]
  19. Giglio, J.; Rey, A. 99mTc labelling strategies for the development of potential nitroimidazolic hypoxia imaging agents. Inorganics 2019, 7, 128. [Google Scholar] [CrossRef] [Green Version]
  20. Ahmadpour, S.; Noaparast, Z.; Abedi, S.M.; Hosseinimehr, S.J. 99mTc-HYNIC-(tricine/EDDA)-FROP peptide for MCF-7 breast tumor targeting and imaging. J. Biomed. Sci. 2018, 25, 17–28. [Google Scholar] [CrossRef] [Green Version]
  21. Guggenberg, E.V.; Behe, M.; Behr, T.M.; Saurer, M.; Seppi, T.; Decristoforo, C. 99mTc-labeling and in vitro and in vivo evaluation of HYNIC- and (Nα-His)acetic acid-modified [D-Glu1]-minigastrin. Bioconjugate Chem. 2004, 15, 864–871. [Google Scholar] [CrossRef] [PubMed]
  22. Gandomkar, M.; Najafi, R.; Shafiei, M.; Mazidi, M.; Goudarzi, M.; Mirfallah, S.H.; Ebrahimi, F.; Heydarpor, H.R.; Abdie, N. Clinical evaluation of antimicrobial peptide [99mTc/Tricine/HYNIC0] ubiquicidin 29-41 as a human-specific infection imaging agent. Nucl. Med. Biol. 2009, 36, 199–205. [Google Scholar] [CrossRef] [PubMed]
  23. Zhang, J.P.; Zhang, J.G.; Xu, X.P.; Lu, L.J.; Hu, S.L.; Liu, C.; Cheng, J.Y.; Song, S.L.; Zhang, Y.J.; Shi, L.Q. Evaluation of Radiation dosimetry of 99mTc-HYNIC-PSMA and imaging in prostate cancer. Sci. Rep. 2020, 10, 4179–4188. [Google Scholar] [CrossRef] [PubMed] [Green Version]
  24. Franzese, E.; Falco, S.D.; Laterza, M.M.; Montella, L.; Facchini, S.; Liguori, C.; Coppola, P.; Diessa, Y.; Berretta, M.; Pisconti, S.; et al. The use of 68Ga prostate-specific membrane antigen PET-CT in prostate cancer: Diagnostic challenges and therapeutic opportunities. Future Sci. OA 2021, 7, FSO705. [Google Scholar] [CrossRef] [PubMed]
  25. Ruan, Q.; Feng, J.H.; Jiang, Y.H.; Zhang, X.; Duan, X.J.; Wang, Q.N.; Yin, G.X.; Xiao, D.; Zhang, J.B. Preparation and bioevaluation of Tc-99m-labeled FAP inhibitors as tumor radiotracers to target the fibroblast activation protein. Mol. Pharm. 2022, 19, 160–171. [Google Scholar] [CrossRef]
  26. Bernardes, E.; Caravan, P.; Dam, R.M.; Deuther-Conrad, W.; Ellis, B.; Furumoto, S.; Guillet, B.; Huang, Y.; Jia, H.; Laverman, P.; et al. Highlight selection of radiochemistry and radiopharmacy developments by editorial board. EJNMMI Radiopharm. Chem. 2022, 7, 9–26. [Google Scholar] [CrossRef]
  27. Eary, J.F. Nuclear medicine in cancer diagnosis. Lancet 1999, 354, 853–857. [Google Scholar] [CrossRef]
  28. Kramer-Marek, G.; Capala, J. The role of nuclear medicine in modern therapy of cancer. Tumor Biol. 2012, 33, 629–640. [Google Scholar] [CrossRef]
  29. Kang, P.M.; Seo, W.I.; Lee, S.S.; Bae, S.K.; Kwak, H.S.; Min, K.; Kim, W.; Kang, D.I. Incidental abnormal FDG uptake in the prostate on 18-fluoro2-deoxyglucose positron emission tomography-computed tomography scans. Asian Pac. J. Cancer Prev. 2014, 15, 8699–8703. [Google Scholar] [CrossRef] [Green Version]
  30. Dolan, R.D.; McLees, N.G.; Irfan, A.; McSorley, S.T.; Horgan, P.G.; Colville, D.; McMillan, D.C. The relationship between tumor glucose metabolism and host systemic inflammatory responses in patients with cancer: A systematic review. J. Nucl. Med. 2019, 60, 467–471. [Google Scholar] [CrossRef] [Green Version]
  31. Valkenburg, K.C.; de Groot, A.E.; Pienta, K.J. Targeting the tumour stroma to improve cancer therapy. Nat. Rev. Clin. Oncol. 2018, 15, 366–381. [Google Scholar] [CrossRef]
  32. Kalluri, R.; Zeisberg, M. Fibroblasts in cancer. Nat. Rev. Cancer 2006, 6, 392–401. [Google Scholar] [CrossRef] [PubMed]
  33. Lavely, W.C.; Goetze, S.; Friedman, K.P.; Leal, J.P.; Zhang, Z.; Garret-Mayer, E.; Dackiw, A.P.; Tufano, R.P.; Zeiger, M.A.; Ziessman, H.A. Comparison of SPECT/CT, SPECT, and planar imaging with single- and dual-phase 99mTc-sestamibi parathyroid scintigraphy. J. Nucl. Med. 2007, 48, 1084–1089. [Google Scholar] [CrossRef] [PubMed] [Green Version]
  34. Zhou, J.; Lu, D.Y.; Xia, L.; Cheng, X.J. Diagnosis performance of 99mTc-MIBI and multimodality imaging for hyperparathyroidism. J. Huazhong Univ. Sci. Technol. Med. Sci. 2017, 37, 582–586. [Google Scholar] [CrossRef]
  35. Castano, A.; DeLuca, A.; Weinberg, R.; Pozniakof, T.; Blaner, W.S.; Pirmohamed, A.; Bettencourt, B.; Gollob, J.; Karsten, V.; Vest, J.A.; et al. Serial scanning with technetium pyrophosphate (99mTc-PYP) in advanced ATTR cardiac amyloidosis. J. Nucl. Cardiol. Off. Publ. Am. Soc. Nucl. Cardiol. 2016, 23, 1355–1363. [Google Scholar] [CrossRef] [Green Version]
  36. Albalooshi, B.; Sharhan, M.A.; Bagheri, F.; Miyanath, S.; Ray, B.; Muhasin, M.; Zakavi, S.R. Direct comparison of 99mTc-PSMA SPECT/CT and 68Ga-PSMA PET/CT in patients with prostate cancer. Asia Ocean. J. Nucl. Med. Biol. 2020, 8, 1–7. [Google Scholar] [CrossRef]
  37. Zhang, Z.Y.; Jia, G.R.; Pan, G.X.; Cao, K.; Yang, Q.Q.; Meng, H.Y.; Yang, J.; Zhang, L.; Wang, T.; Cheng, C.; et al. Comparison of the diagnostic efficacy of 68Ga-FAPI-04 PET/MR and 18F-FDG PET/CT in patients with pancreatic cancer. Eur. J. Nucl. Med. Mol. Imaging 2022, 49, 2877–2888. [Google Scholar] [CrossRef] [PubMed]
Figure 1. Schematic preparation of 99mTc-HYNIC-FAPI-04, and the in vitro characteristics, including (A) the labeling rate, (B) time-dependent stability in PBS and 5% FBS, and (C) U87MG-specific cellular binding efficiency (EDDA: ethylenediamine diacetic acid, PBS: phosphate buffer solution, FBS: fetal bovine serum).
Pharmaceuticals 16 00423 g001
Figure 2. 99mTc-HYNIC-FAPI-04 SPECT images of rabbits at different time points. The coronal whole-body images at 1.5 h P.I. and 5 h P.I. (A) and radioactive counts (presented as %ID/mL) of ROIs on SPECT at 1.5 h P.I. and 5 h P.I. (B). The linear regression between radioactive counts of ROIs at 1.5 h P.I. and 5 h P.I. (these dots represented the ROIs above) (C).
Pharmaceuticals 16 00423 g002
Figure 3. 99mTc-HYNIC-FAPI-04 SPECT images of mice models with FAP-positive or FAP-negative xenografts at 1.5 h P.I. (A) and 5 h P.I. (B). The radioactive counts of FAP-positive or FAP-negative xenografts (C) and the ratios of xenografts to liver (D). The corresponding HE staining and quantitative analysis with immunohistochemical proves of FAP-positive (E) or FAP-negative tumors (F).
Pharmaceuticals 16 00423 g003
Figure 4. FDG PET of mice models of (A) U87MG and (B) HUH-7, and (C) the corresponding quantitative analysis, such as SUVmax and (D) tumor to liver ratio of SUVmax. The white dotted circles marked the FAP-positive or FAP-negative tumors.
Pharmaceuticals 16 00423 g004
Figure 5. 68Ga-FAPI-04 PET images of FAP-positive tumors at different time point (A,B) and 99mTc-HYNIC-FAPI-04 SPECT images of FAP-positive tumors at different time point (C,D). The comparison of ratios of tumor to muscle between 1.5 h P.I. and 5 h P.I. in 68Ga-FAPI-04 PET (E) and 99mTc-HYNIC-FAPI-04 SPECT (F). The white arrow and white dotted circles all pointed to FAP-positive tumors.
Pharmaceuticals 16 00423 g005
Figure 6. The correlation between 99mTc-HYNIC-FAPI-04 SPECT and tumor progression, including tumor volume and FAP expression quantified by signal intensity of immunohistochemical (IHC). The volume progression of tumor and corresponding FAP expression in IHC (AG), and correlation analysis result (D). Correlation between tracer uptake on 99mTc-HYNIC-FAPI-04 SPECT and FAP expression (H). The red arrow pointed to FAP-positive tumors.
Pharmaceuticals 16 00423 g006
Disclaimer/Publisher’s Note: The statements, opinions and data contained in all publications are solely those of the individual author(s) and contributor(s) and not of MDPI and/or the editor(s). MDPI and/or the editor(s) disclaim responsibility for any injury to people or property resulting from any ideas, methods, instructions or products referred to in the content.

