Article

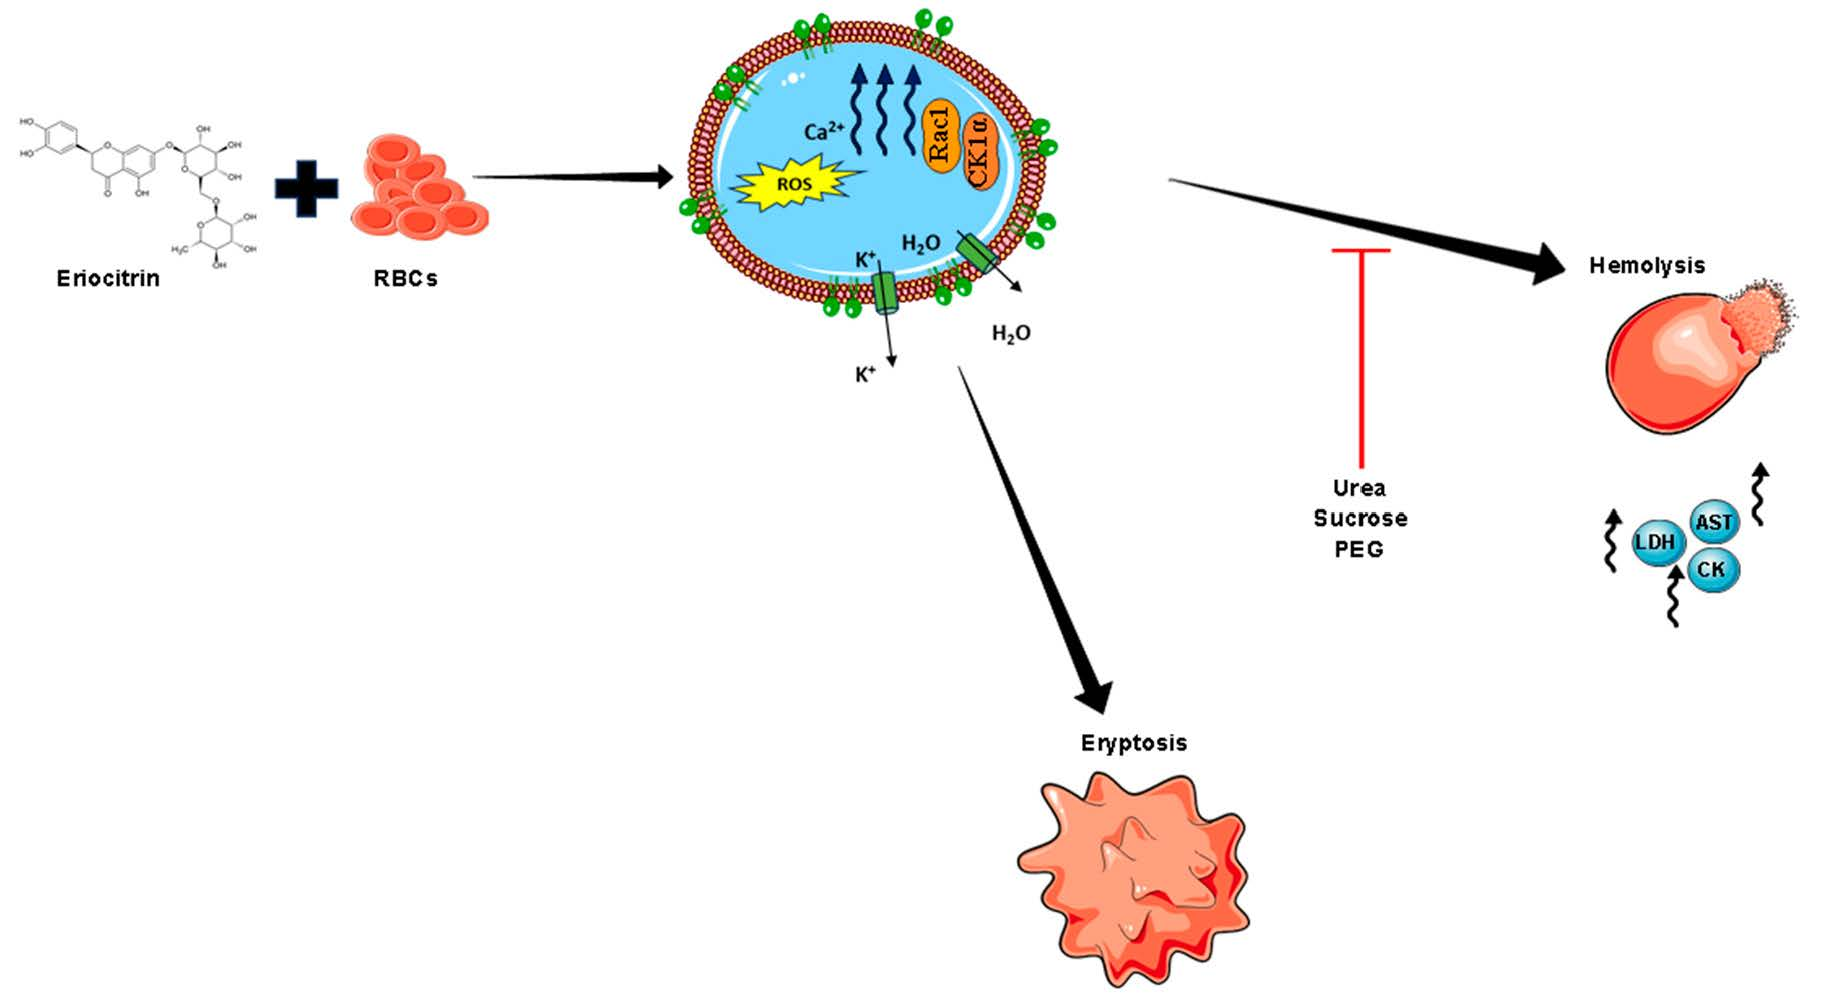
Eriocitrin Disrupts Erythrocyte Membrane Asymmetry through Oxidative Stress and Calcium Signaling and the Activation of Casein Kinase 1α and Rac1 GTPase

by
Sumiah A. Alghareeb
,
Jawaher Alsughayyir
and
Mohammad A. Alfhili
*
Department of Clinical Laboratory Sciences, College of Applied Medical Sciences, King Saud University, Riyadh 12372, Saudi Arabia
*
Author to whom correspondence should be addressed.
Pharmaceuticals 2023, 16(12), 1681; https://doi.org/10.3390/ph16121681
Submission received: 21 October 2023 / Revised: 21 November 2023 / Accepted: 1 December 2023 / Published: 2 December 2023

Abstract

:
Background: Hemolysis and eryptosis result in the premature elimination of circulating erythrocytes and thus contribute to chemotherapy-related anemia, which is extremely prevalent in cancer patients. Eriocitrin (ERN), a flavanone glycoside in citrus fruits, has shown great promise as an anticancer agent, but the potential toxicity of ERN to human erythrocytes remains unstudied. Methods: Erythrocytes were exposed to anticancer concentrations of ERN (10–100 μM) for 24 h at 37 °C, and hemolysis and associated markers were quantified using colorimetric assays. Eryptosis was assessed by flow cytometric analysis to detect phosphatidylserine (PS) exposure by annexin-V-FITC, intracellular Ca2+ using Fluo4/AM, and oxidative stress with 2-,7-dichlorodihydrofluorescin diacetate (H2DCFDA). ERN was also tested against specific signaling inhibitors and anti-hemolytic agents. Results: ERN caused significant, concentration-dependent hemolysis at 20–100 μM. ERN also significantly increased the percentage of eryptotic cells characterized by Ca2+ elevation and oxidative stress. Furthermore, the hemolytic activity of ERN was significantly ameliorated in the presence of D4476, NSC23766, isosmotic urea and sucrose, and polyethylene glycol 8000 (PEG). In whole blood, ERN significantly elevated MCV and ESR, with no appreciable effects on other peripheral blood cells. Conclusions: ERN promotes premature erythrocyte death through hemolysis and eryptosis characterized by PS externalization, Ca2+ accumulation, membrane blebbing, loss of cellular volume, and oxidative stress. These toxic effects, mediated through casein kinase 1α and Rac1 GTPase, can be ameliorated by urea, sucrose, and PEG. Altogether, these novel findings are relevant to the further development of ERN as an anticancer therapeutic.

Graphical Abstract

1. Introduction

Flavonoids, glycosides, carotenoids, alkaloids, and terpenes comprise the most significant categories of metabolites in medicinal plants and Citrus fruits [1,2]. Collectively, these active metabolites are responsible for the wide spectrum of pharmacological properties attributed to Citrus fruits, including antioxidant, anti-inflammatory, antidiabetic, antimicrobial, anticancer, neuroprotective, and cardioprotective activities [1,3,4]. In particular, a large number of studies have concluded that flavonoids improve the symptoms of a plethora of pathological conditions, including diabetes mellitus [5], neurodegenerative disease [6], and respiratory disease, among others [7]. Furthermore, flavonoids improve cognitive function in humans [8] and favorably influence gastrointestinal inflammation by interacting with the gut microbiome [9].
Eriocitrin (ERN) is a flavanone-7-O-glycoside with antioxidant, anti-inflammatory, anticancer, and anti-allergic properties [9]. When compared to other antioxidants, ERN was more effective in scavenging free radicals associated with diabetes mellitus and other chronic illnesses [10,11]. Notably, several studies have shown that ERN stimulates apoptosis in nucleated cells. In HL-60 cells, ERN causes caspase-dependent apoptosis characterized by DNA fragmentation and chromatin condensation [12]. ERN also inhibits the proliferation of HepG2 and Huh7 liver cells through the intrinsic apoptosis pathway and cell cycle arrest [13]. Moreover, ERN promotes intrinsic apoptosis in MCF-7 cells through JAK2/STAT3/Src inhibition and reactive oxygen species (ROS)-dependent JNK/p38 MAPK stimulation [14]. Very recently, ERN has been reported to trigger ferroptosis in A549 and H1299 lung adenocarcinoma cells [15], thereby circumventing cancer cell resistance to apoptosis. Altogether, mounting studies are arguing for the further development of ERN as an anticancer therapeutic.
The prevalence of chemotherapy-induced anemia (CIA) is at least 75% in cancer patients undergoing treatment [16]. Although poorly understood, CIA may be caused by bone marrow suppression, hemolysis, and eryptosis [17]. Eryptotic erythrocytes lose the asymmetrical arrangement of the phospholipids on their cell membrane, culminating in phosphatidylserine (PS) externalization. PS, in turn, serves as a binding site for phagocytes to eliminate aged, infected, and damaged cells from the circulation which prevents intravascular hemolysis. However, premature eryptosis, as instigated by chemotherapeutic drugs, leads to the excessive elimination of circulating RBCs, which gives rise to anemia [17]. Other hallmarks of eryptotic cells include dehydration and shrinkage, cytosolic calcium buildup, oxidative stress, ceramide accumulation, and metabolic exhaustion [18]. The signaling mediators involved in eryptosis include caspase, p38 MAPK, casein kinase 1α (CK1 α), protein kinase C, and Rac1 GTPase, among others [18,19].
Numerous chemotherapeutic drugs are known to cause anemia in patients; most notably paclitaxel and cisplatin, have been found to induce eryptosis [20,21]. However, the hemolytic and eryptotic potential of ERN against human RBCs remains unknown. The aim of the present study was to examine the potential toxic effects of ERN on erythrocytes and the associated molecular mechanisms to optimize the further development and validation of the flavanone as an anticancer agent.

2. Results

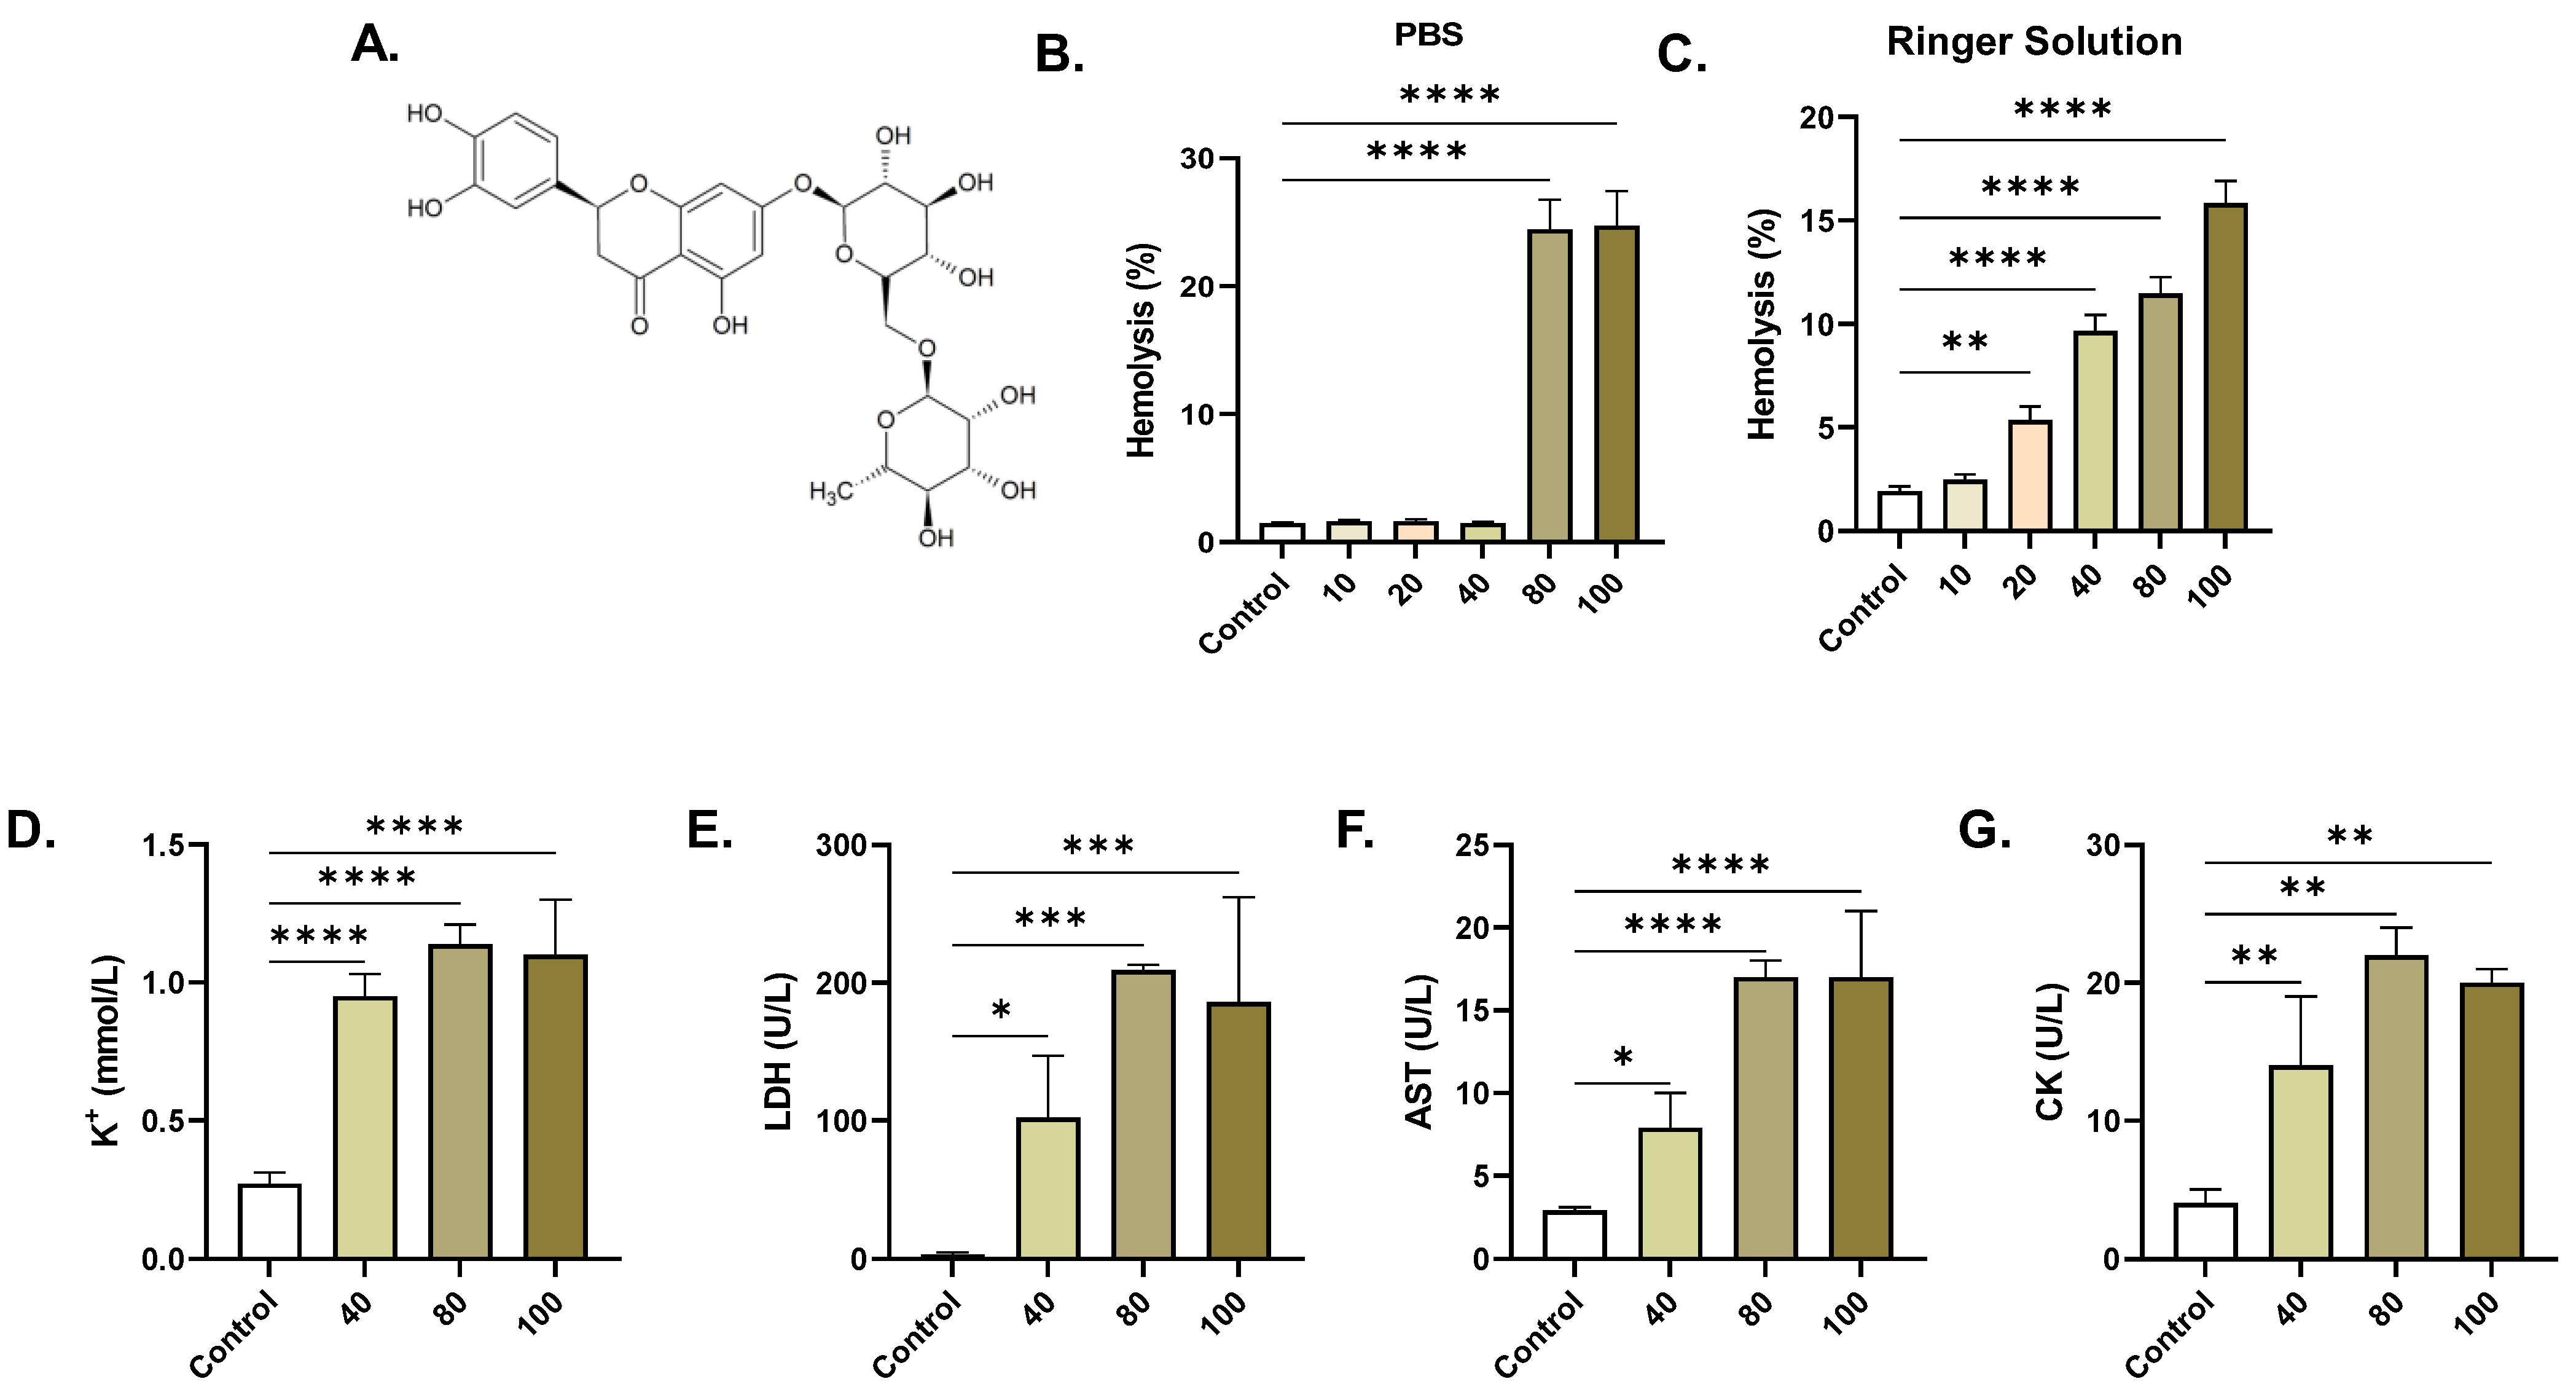
2.1. ERN Induces Concentration-Dependent Hemolysis

Relative to control values of 1.46% ± 0.09, the hemolytic rate of ERN in saline was significantly increased to 24.43% ± 2.31 (p < 0.0001) at 80 µM and to 24.73% ± 2.72 (p < 0.0001) at 100 µM, as seen in Figure 1B. In Ringer solution (Figure 1C), ERN elicited significant hemolysis, with increases in the control cells from 1.92% ± 0.68 to 5.35% ± 1.99 (p < 0.01, 20 μM), 9.65% ± 2.37 (p < 0.0001, 40 μM), 11.47% ± 2.35 (p < 0.0001, 80 μM), and 15.84% ± 3.22 (p < 0.0001). Accordingly, there was a significant release of K+ from 0.26 ± 0.03 to 0.97 ± 0.032 mmol/L, p < 0.0001 (40 µM), 1.15 ± 0.03 mmol/L, p < 0.0001 (80 µM), and 1.163 ± 0.068 mmol/L, p < 0.0001 (100 µM), as demonstrated in Figure 1D. LDH activity (Figure 1E) in the control supernatants (3.5 ± 0.72 U/L) similarly increased to 104.0 ± 24.27 U/L, p = 0.0168 (40 µM), 206.7 ± 4.49 U/L, p = 0.0002 (80 µM), and 203.0 ± 30.37 U/L, p = 0.0003 (100 µM). Furthermore, AST activity significantly increased from 2.5 ± 0.5 U/L in the supernatants of the control cells to 8.3 ± 0.86 U/L, p < 0.0001 (40 µM), 1.15 ± 0.03 U/L, p < 0.0001 (80 µM), and 1.163 ± 0.068 U/L, p < 0.0001 (100 µM), as shown in Figure 1F. CK activity (Figure 1G) followed a similar pattern, with a significant increase from 3.67 ± 0.88 (control) to 15.33 ± 1.86 U/L, p = 0.0083 (40 µM), 20.0 ± 3.06 U/L, p = 0.0011 (80 µM), and 19.0 ± 1.52 U/L, p = 0.0016 (100 µM).

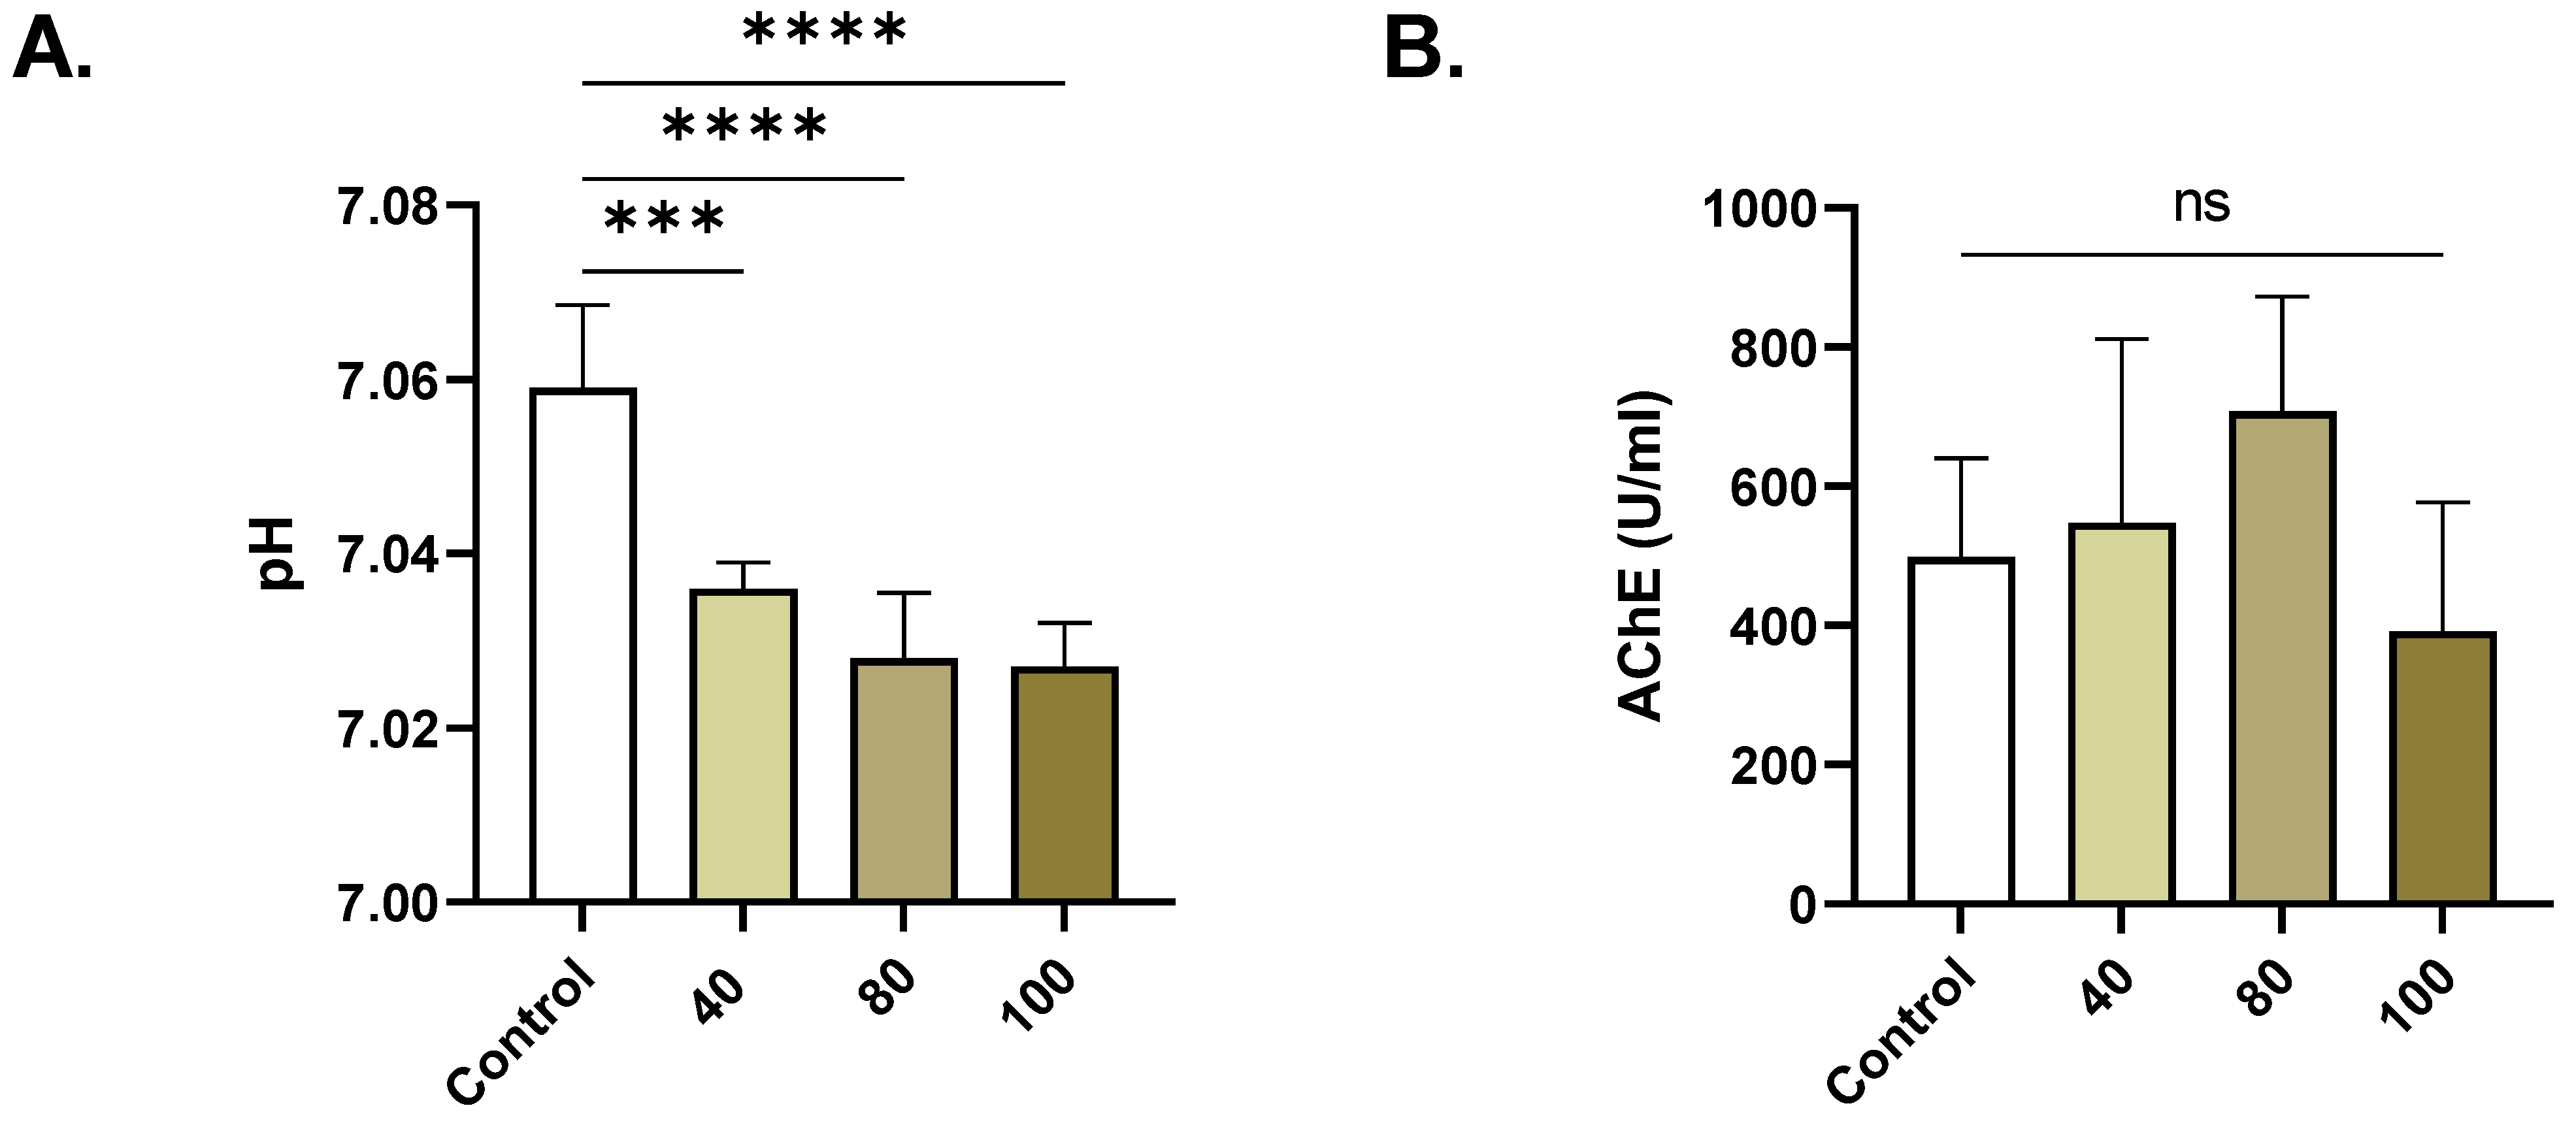
2.2. ERN Increases Extracellular Acidity

ERN at 40, 80, and 100 µM significantly decreased the pH (Figure 2A) from 7.06 ± 0.003 to 7.031% ± 0.004 (p = 0.0002), 7.024 ± 0.004 (p < 0.0001), and 7.021% ± 0.006 (p < 0.0001), respectively. No significant anticholinesterase activity was observed for ERN (Figure 2B).

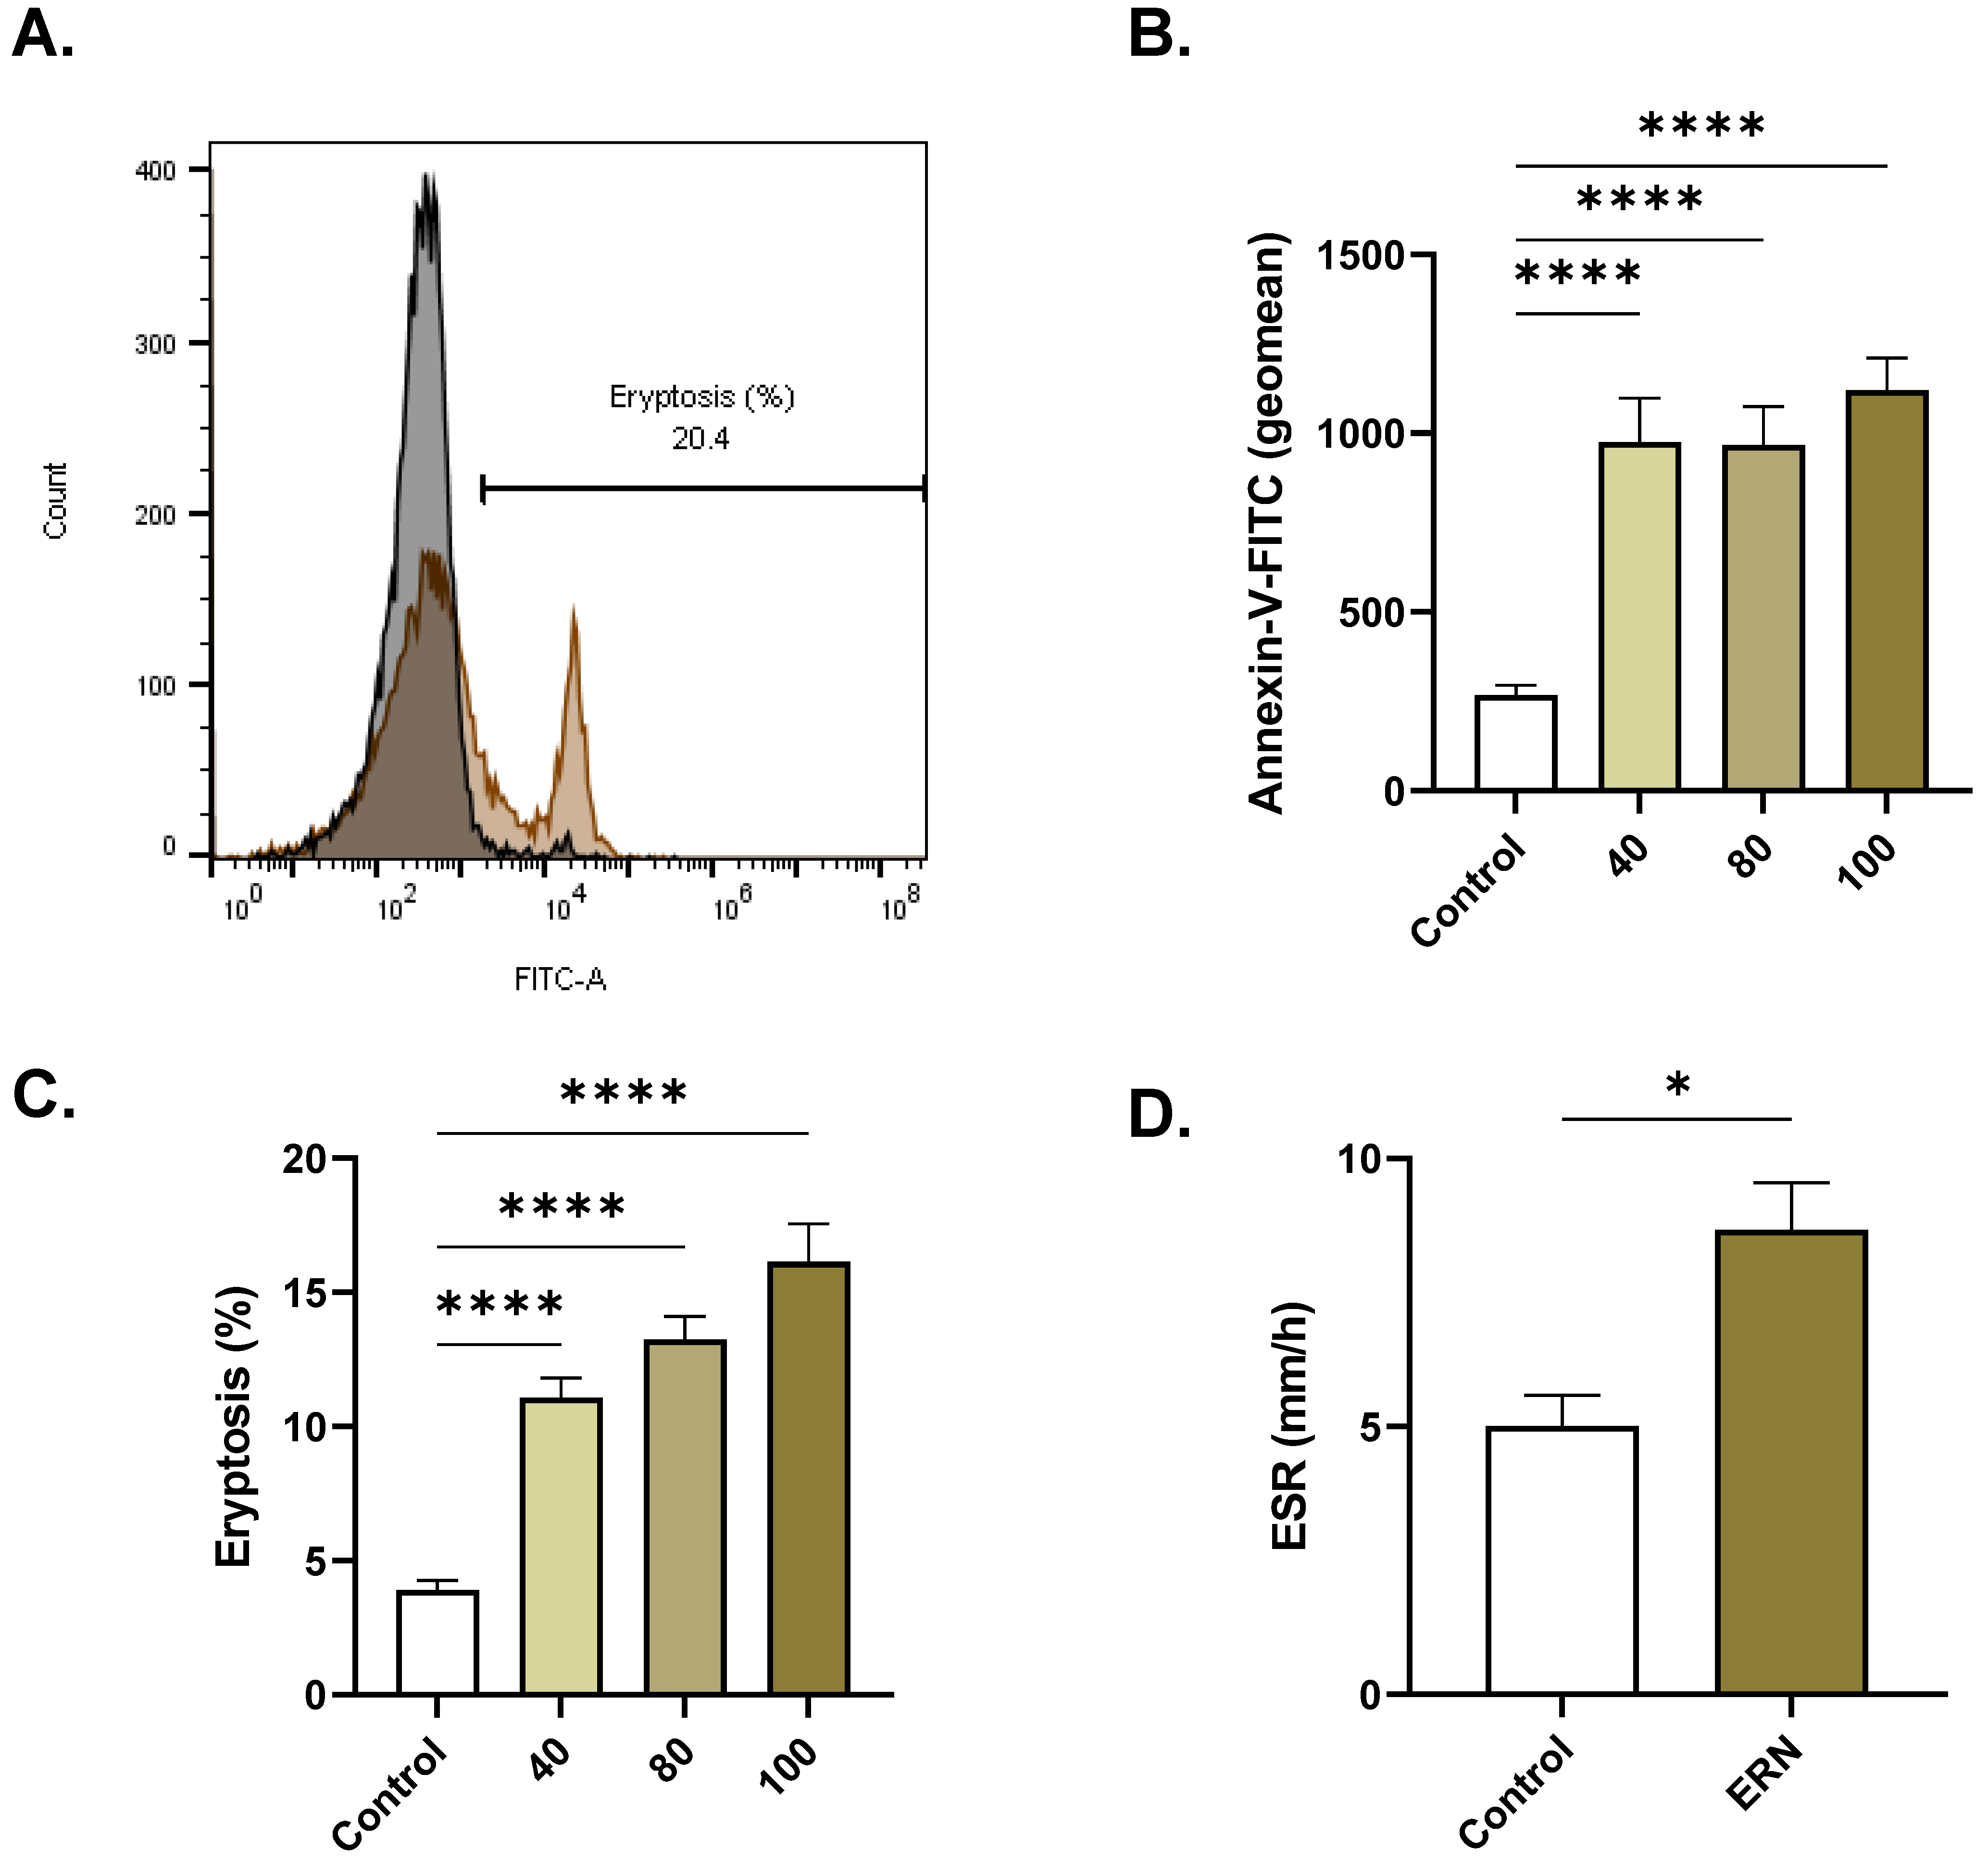
2.3. ERN Stimulates Eryptosis

In Figure 3B, the geometric mean of annexin-V-FITC fluorescence was significantly elevated from 267.7 ± 27.37 a.u. (control) to 976.2 ± 121.8 a.u. (40 µM, p < 0.0001), 967.2 ± 107.2 a.u. (80 µM, p < 0.0001), and 112.1 ± 89.51 a.u. (100 µM, p < 0.0001), as was the percentage of eryptotic cells (Figure 3C). The ESR (Figure 3D) of the ERN-treated cells (100 µM) showed a significant increase compared to that of the control cells (5.0 ± 0.58 mm/h to 8.67 ± 0.88 mm/h, p = 0.0254).

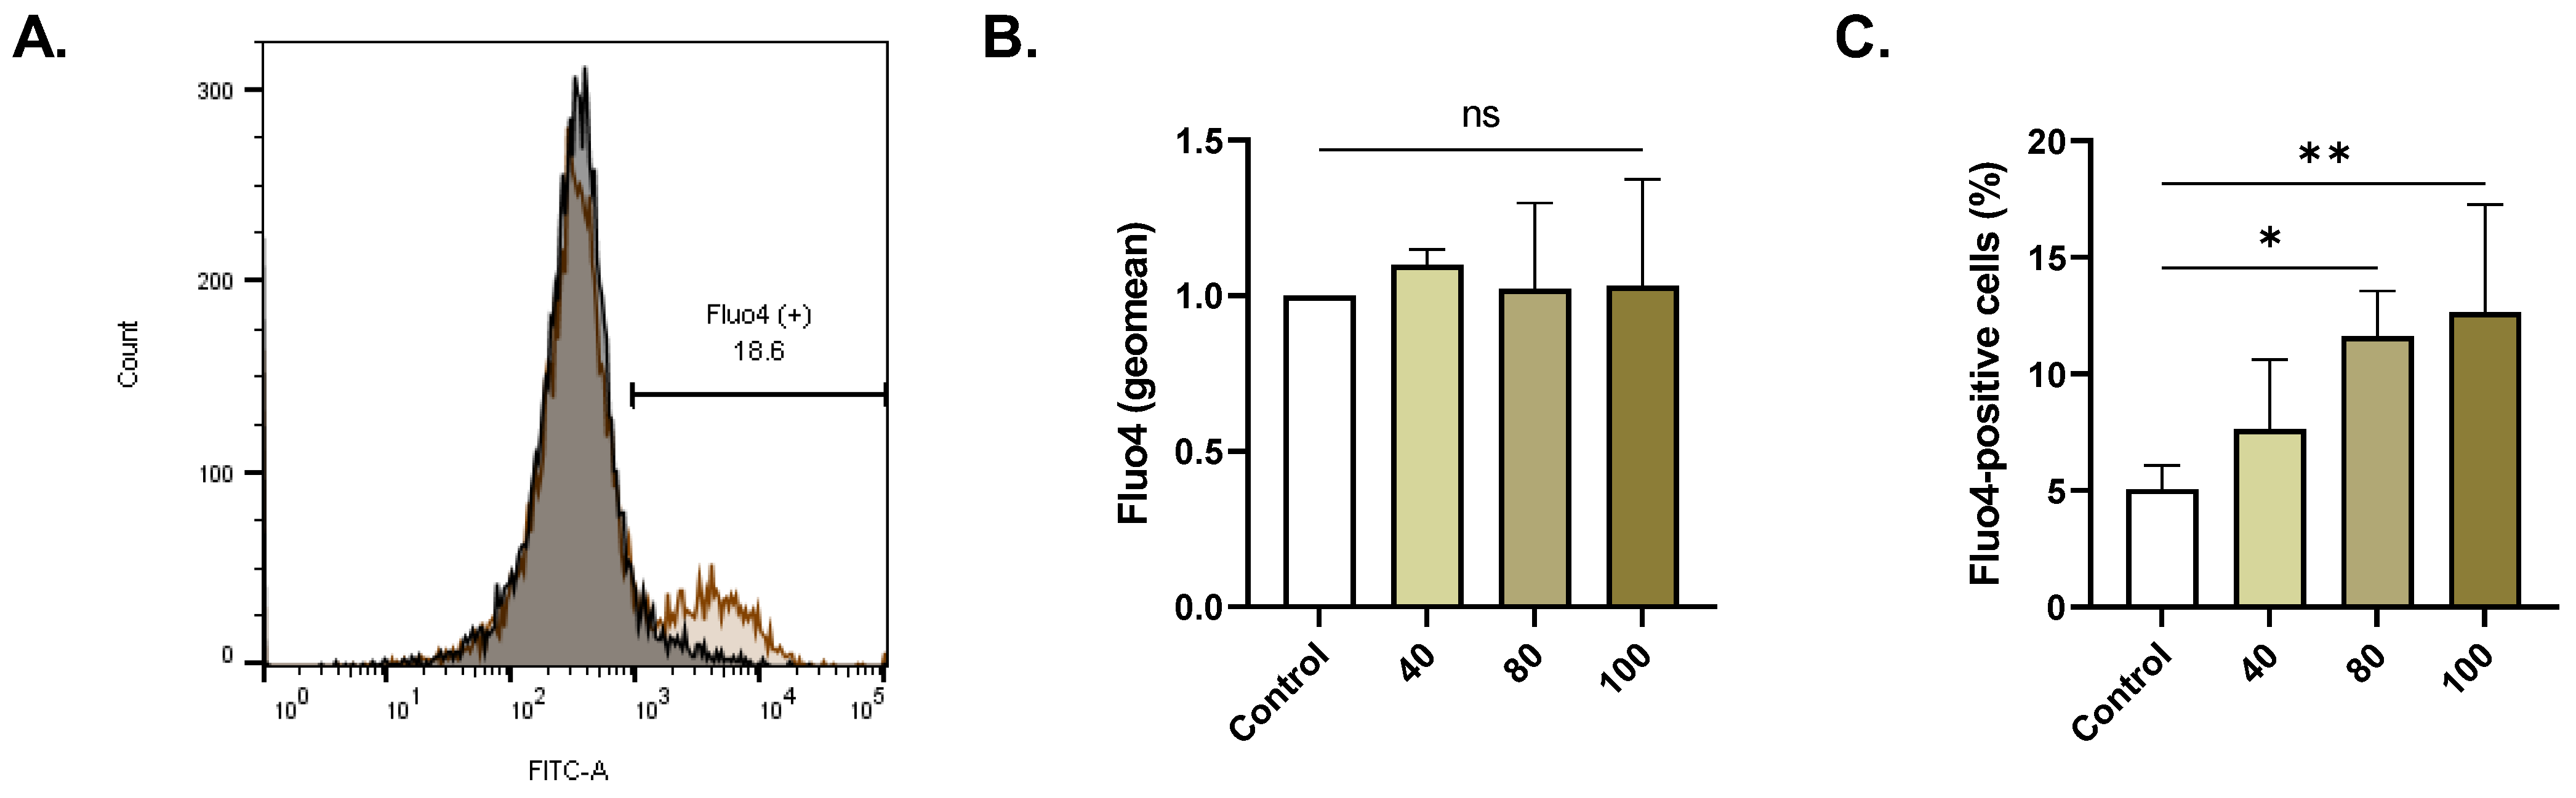
2.4. ERN Elevates Cytosolic Ca2+

As depicted in Figure 4C, the percentage of cells with increased intracellular Ca2+ significantly increased to 10.79% ± 1.28 (p < 0.05, 80 µM) and 12.62% ± 2.12 (p < 0.01, 100 µM) compared to a control value of 5.03% ± 0.58.

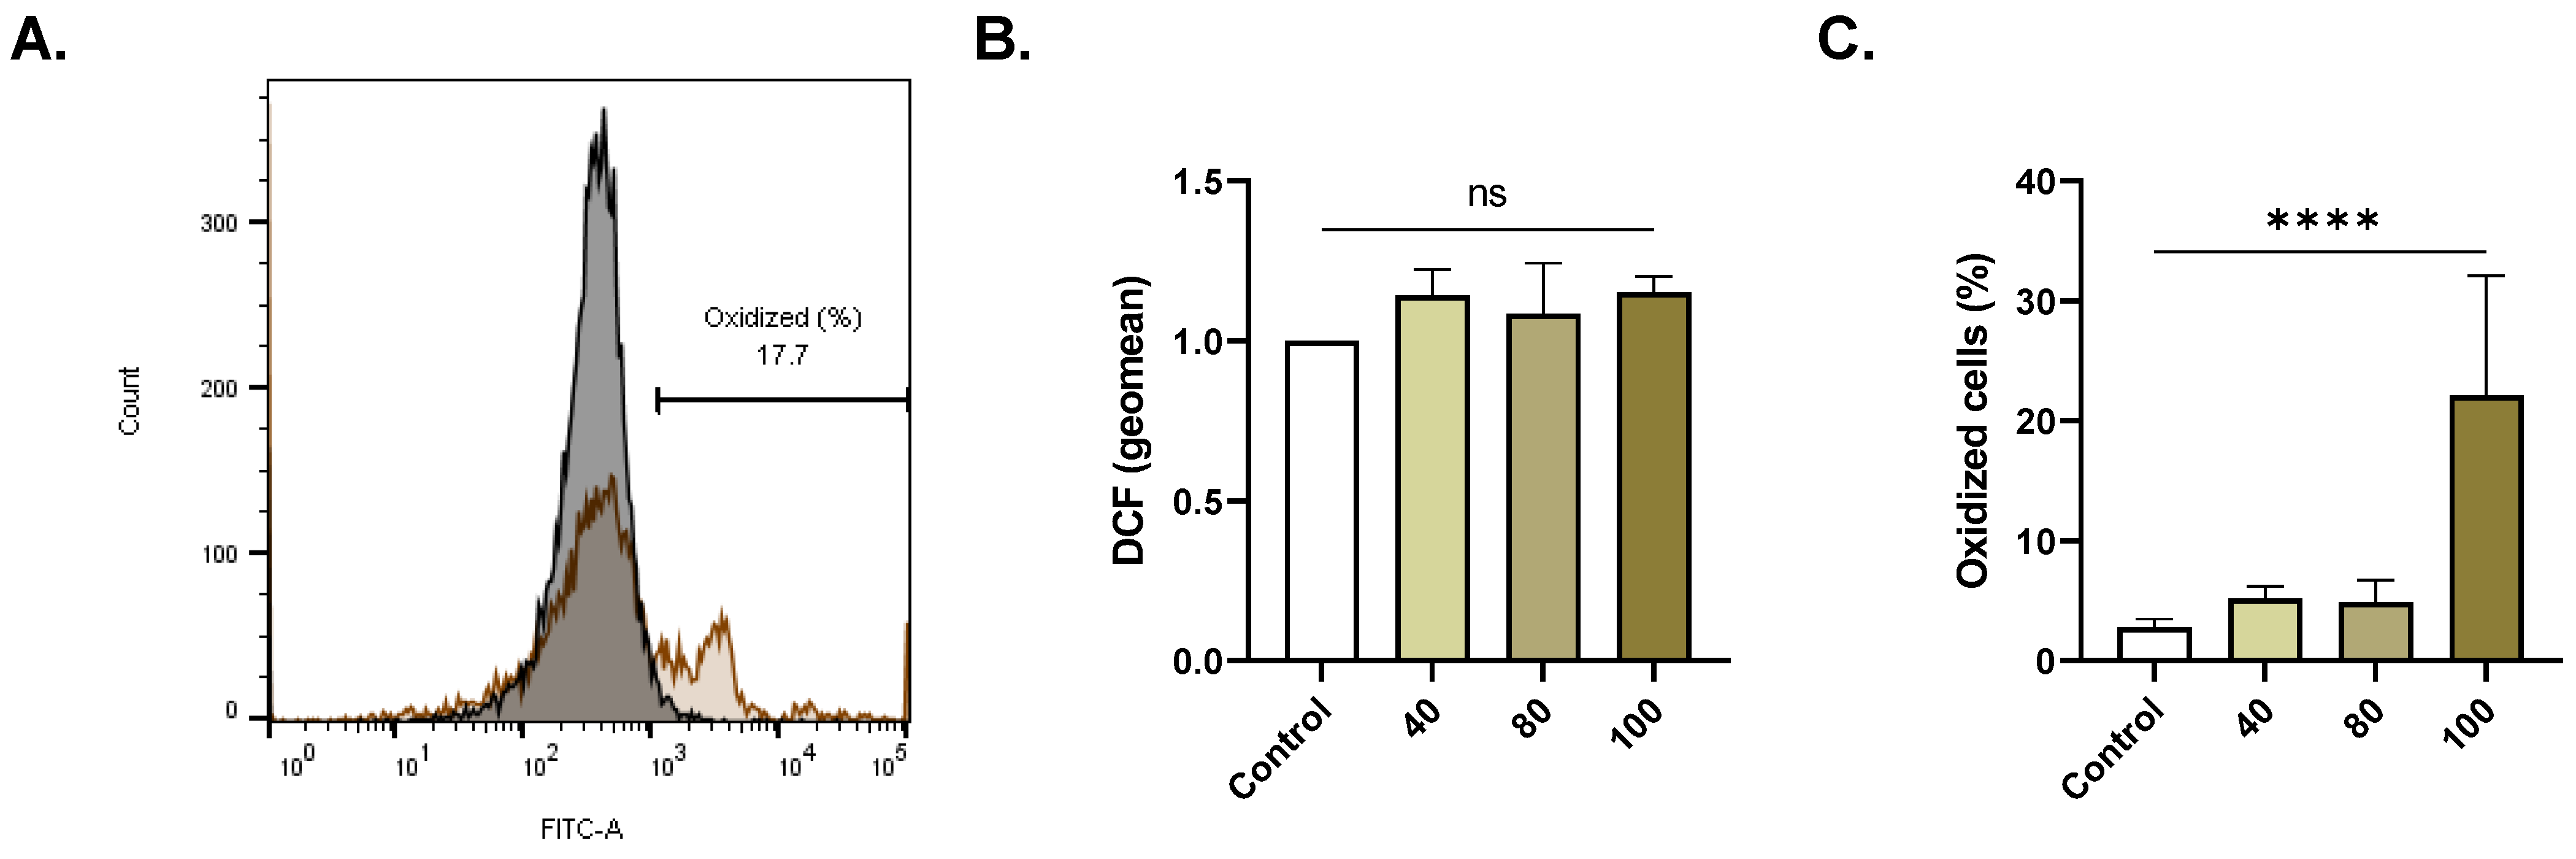
2.5. ERN Elicits Oxidative Stress

Figure 5C illustrates that exposure to 100 µM of ERN caused a significant increase in the proportion of cells with intracellular ROS (2.76% ± 0.33 to 21.0% ± 6.11, p < 0.0001).

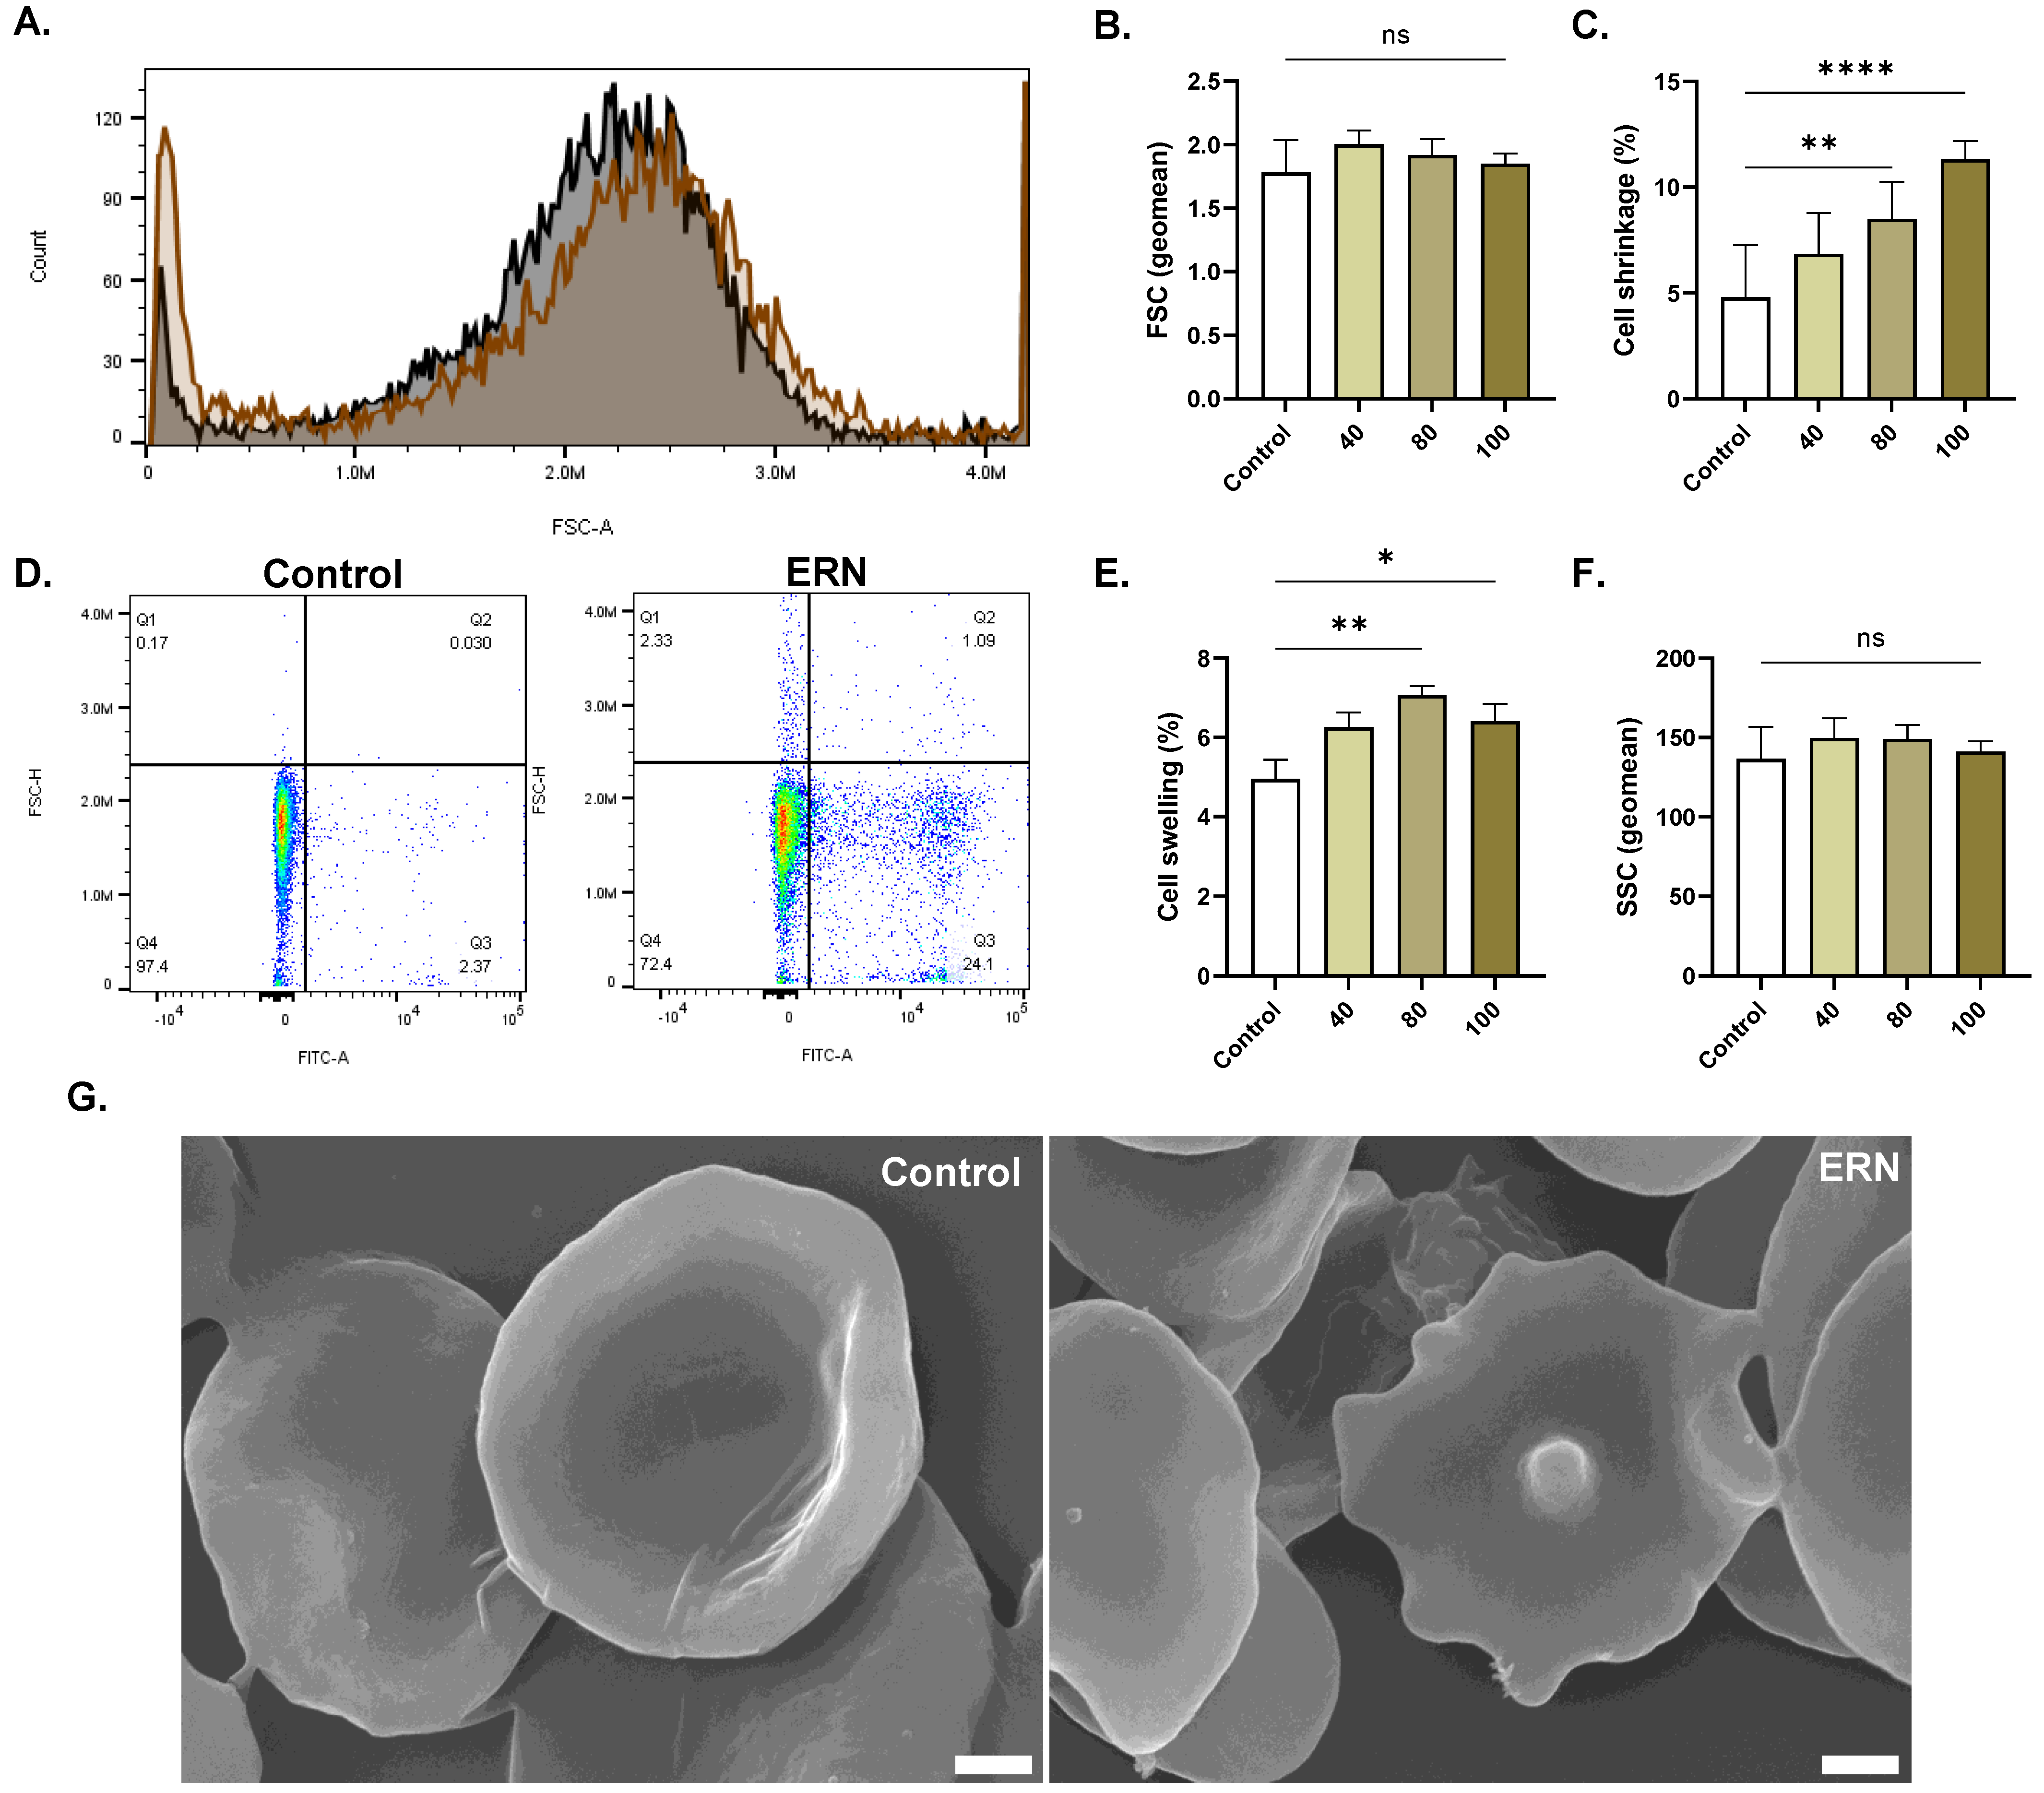
2.6. ERN Causes Cell Shrinkage and Swelling

The percentage of cells undergoing shrinkage (Figure 6C) was significantly increased from 5.55% ± 0.49 in the control group to 8.80% ± 0.79 (p = 0.0081) and 11.33% ± 0.85 (p < 0.0001) after treatment with 80 µM and 100 µM of ERN, respectively. Moreover, the proportion of swollen cells (Figure 6E) also significantly increased from 4.95% ± 0.49 to 7.06% ± 0.23 (80 µM, p = 0.0016) and to 6.41% ± 0.43 (100 µM, p = 0.033).

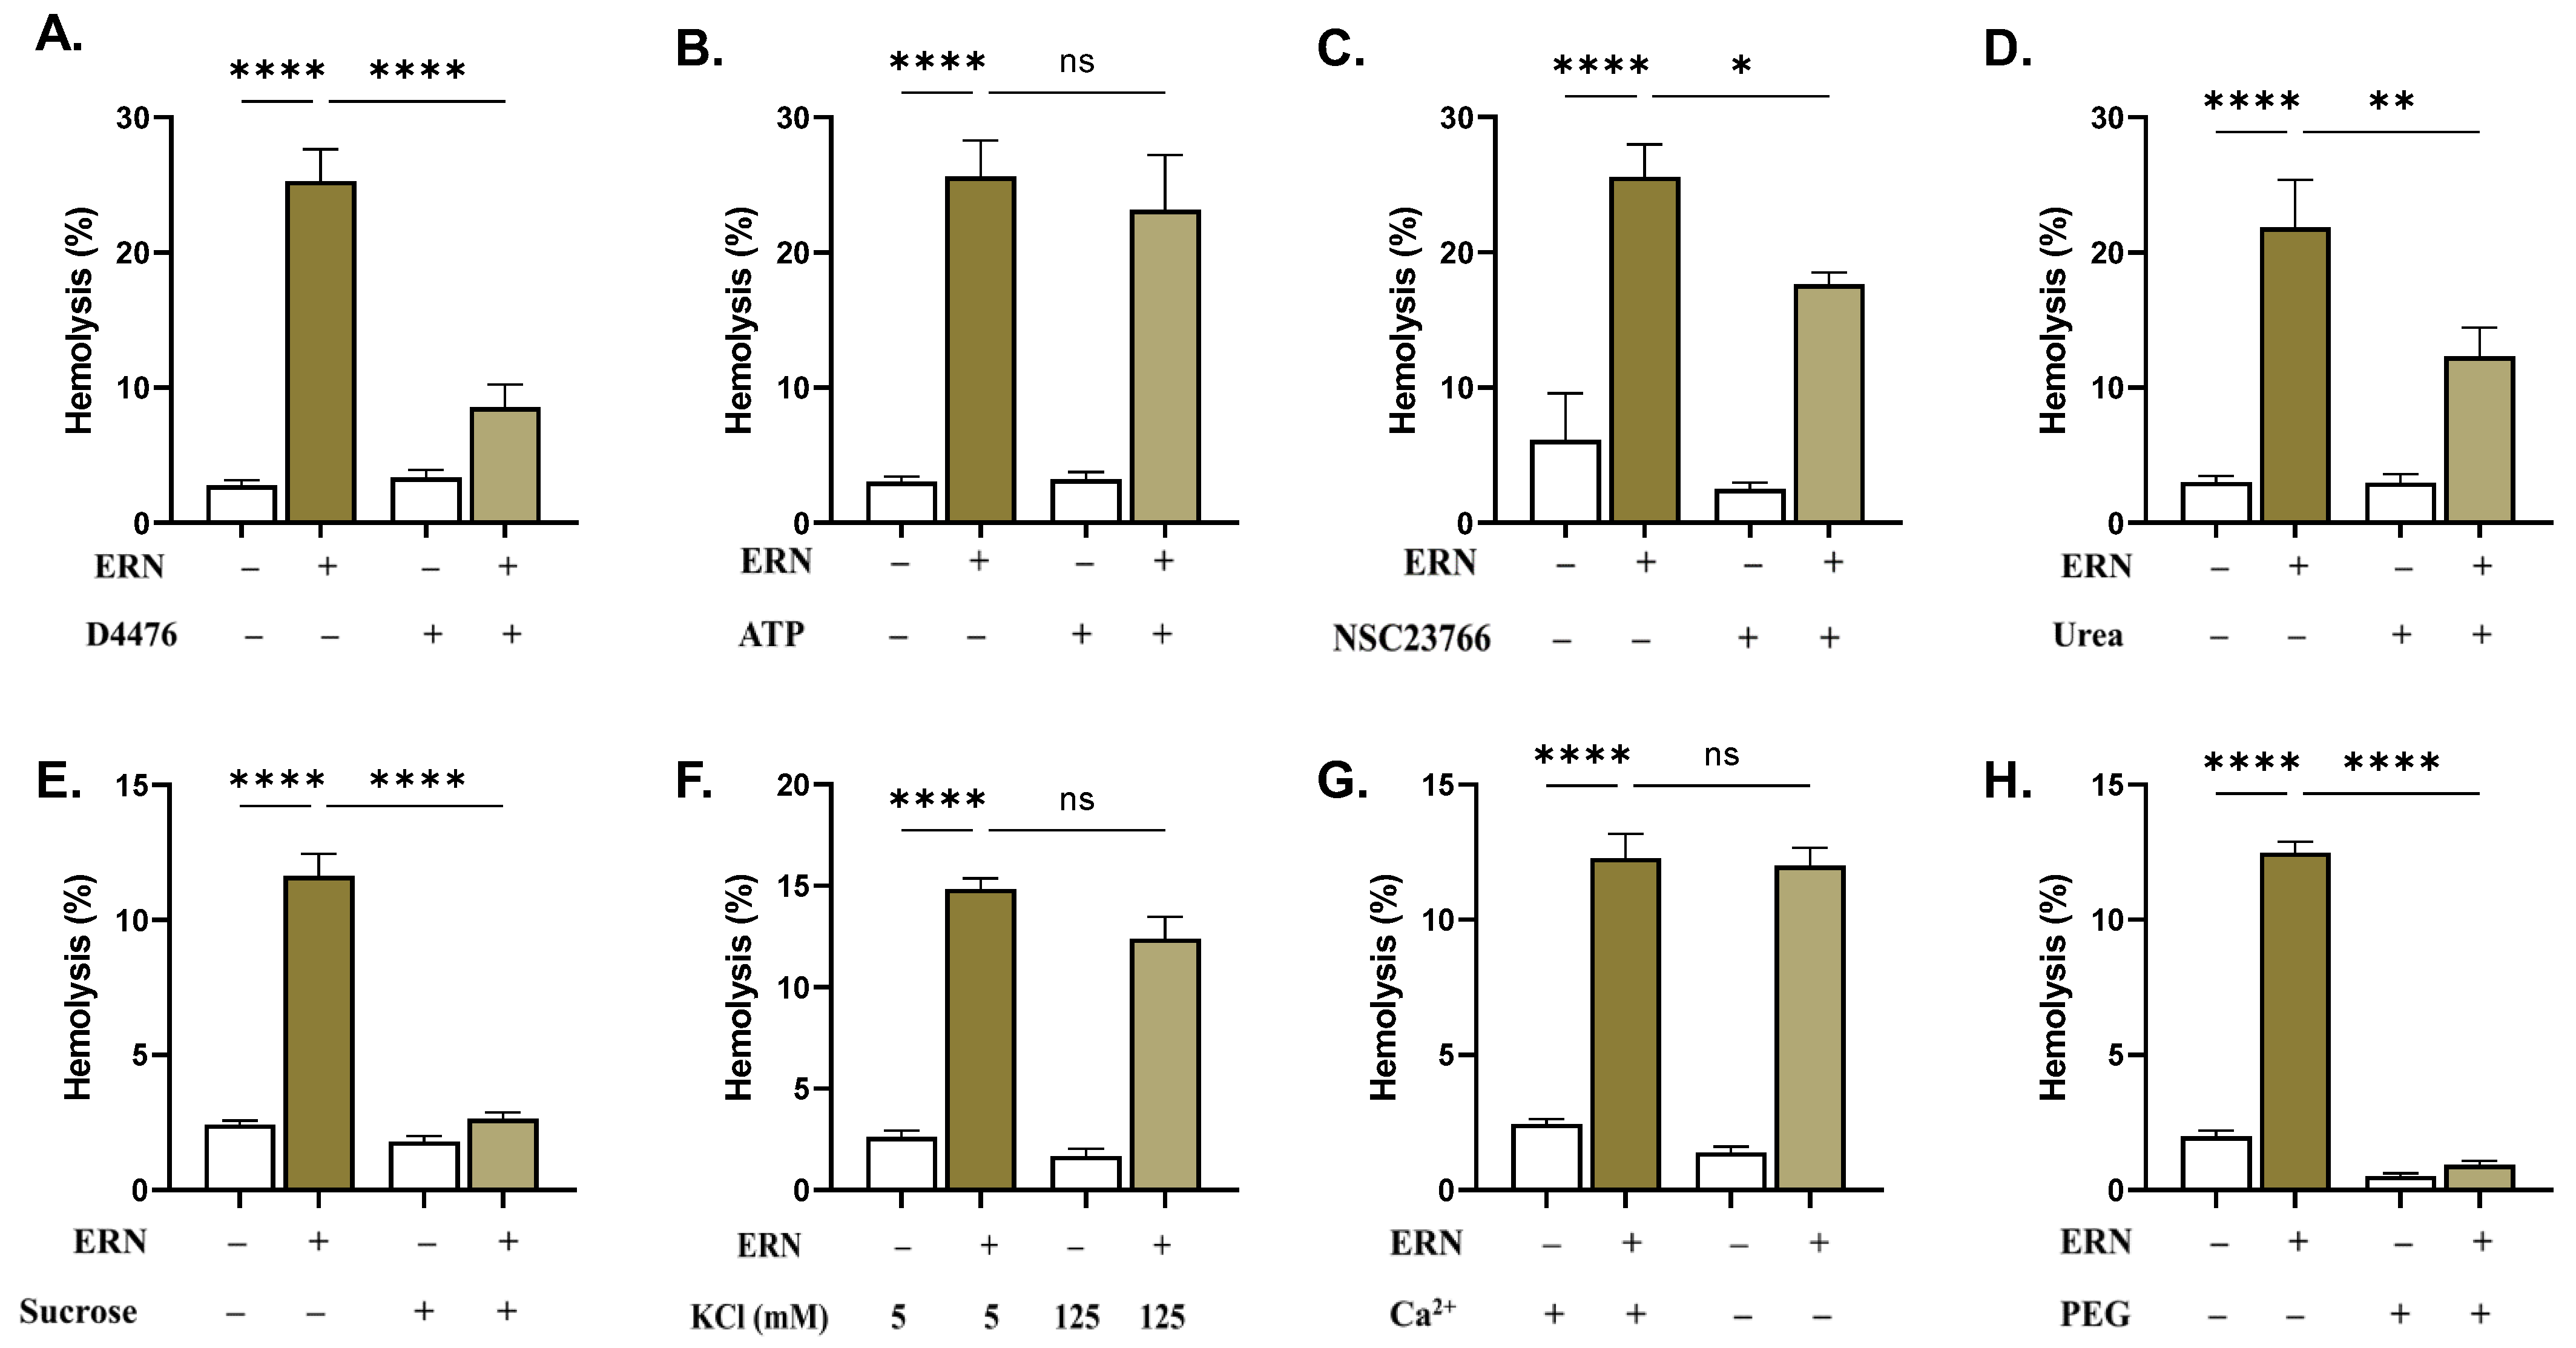
2.7. CK1α and Rac1 GTPase Mediate ERN-Induced Hemolysis

Compared to those treated with ERN, the cells exposed to a combination of ERN (80 μM) and D4476 exhibited significantly reduced hemolysis (25.28% ± 2.36 to 8.56% ± 1.68, p < 0.0001, Figure 7A). Likewise, cells were rescued from hemolysis in the presence of NSC23766 (25.58% ± 2.41 to 17.63% ± 0.89, p = 0.0376, Figure 7C). Additionally, hemolysis was significantly ameliorated by isosmotic urea (21.85% ± 3.51 to 12.3% ± 2.15, p = 0.0079) and sucrose (11.63% ± 0.82 to 2.62% ± 0.25, p < 0.0001), as revealed in in Figure 7D and 7E, respectively. Nevertheless, a complete inhibition of hemolysis was only seen with PEG 8000 (12.48% ± 0.41 to 0.94% ± 0.14, p < 0.0001, Figure 7H).

2.8. ERN Exhausts Intracellular Hb Stores

In whole blood, MCHC was significantly lower compared to the control samples (30.73 ± 0.13 g/dL to 30.03 ± 0.17 g/dL, p = 0.0068), as illustrated in Figure 8E. Additionally, ERN treatment resulted in a statistically significant increase in MCV (Figure 8F) from (from 98.98 ± 0.34 fL to 101.1 ± 0.31 fL, p = 0.0133) and monocytes (from 0.10 ± 0.02 × 10³/µL to 0.15 ± 0.01 × 10³/µL, p = 0.0453), as shown in Figure 9E.

3. Discussion

The current study reveals, for the first time, that anticancer concentrations of ERN (20–100 μM) [12,13,14,15] stimulate premature RBC death by both hemolysis and eryptosis. However, whether this concentration range is achievable in vivo remains to be determined in future studies. In this work, ERN was found to induce concentration-dependent hemolysis (Figure 1), indicating its detrimental effects on the integrity of the RBC membrane and the subsequent release of cellular contents including Hb, K+, LDH, AST, and CK. Extracellular Hb can potentially exacerbate inflammatory reactions and lead to excessive tissue damage and organ failure, as observed in hemolytic uremic syndrome [22,23]. Our results show that ERN significantly decreased extracellular pH (Figure 2), indicating the acidification of the cellular milieu, which appears to be associated with oxidative hemolysis (Figure 5) [24].
Loss of membrane asymmetry and PS externalization (Figure 3) flags cells for elimination from the bloodstream. Also, eryptotic cells lose membrane elasticity and adhere to endothelial cells which predisposes to thrombosis [18]—an observation further inferred from the high ESR in the treated cells (Figure 3). Eryptosis may be viewed as a defense mechanism that eliminates senescent and damaged RBCs to protect against hemolytic and thromboembolic events. However, inordinate or premature eryptosis, as demonstrated by ERN in this report, may exceed the bone marrow’s ability to upregulate erythropoiesis, resulting in anemia. It is important to mention that excessive eryptosis is also associated with various pathological conditions, including hypertension, dyslipidemia, diabetes mellitus, and hemolytic anemias [25].
Ca2+ signaling is perhaps the most important mechanism underlying PS translocation in RBCs [26]. Indeed, it was observed that ERN induced a substantial increase in cytosolic Ca2+ activity (Figure 4) which was seemingly independent of Ca2+ influx, as the exclusion of extracellular Ca2+ did not result in a significant decrease in cell death (Figure 7). Thus, Ca2+ channel activity does not appear to be necessary for ERN toxicity in RBCs, and the concurrent administration of Ca2+ channel blockers with ERN may not be of value. In response to an increase in intracellular Ca2+ activity, K+ channels mediate KCl efflux, membrane hyperpolarization, and water loss [27]. The consequence is significant cell shrinkage as a result of decreased cellular volume (Figure 6). Interestingly, we have also noted that ERN causes significant cell swelling, which is uncharacteristic of eryptotic cells. A possible explanation is that the loss of KCl was paralleled by Na+ entry leading to overhydration, as was observed in trifluoperazine-induced eryptosis [28]. Thus, the modulation of the Na+/K+-ATPase pump by ERN cannot be excluded, as it maintains cell volume by adjusting Na+ and K+ concentrations. This is likely given that ERN toxicity was blunted by isosmotic urea (Figure 7), which targets the Na+/K+-ATPase pump, KCl cotransport, and Na+-K+-2Cl- transporters [29].
One of the canonical characteristics of eryptotic cells is oxidative stress, which contributes to life-threatening conditions such as cancer, diabetes mellitus, and hepatic failure [30]. Previous studies have demonstrated that elevated levels of ROS are associated with the overactivity of cation channels and the induction of eryptosis—a process dependent on Ca2+ mobilization [31]. The failure of erythrocytes to neutralize ROS results in a reduced oxygen-carrying capacity and promotes premature cellular aging and death [32] due to the oxidation of cellular components, most notably the plasma membrane, which may cause increased permeability and subsequent cellular swelling (Figure 6 and Figure 8) [33].
The utilization of small-molecule inhibitors has facilitated the elucidation of specific molecular mediators targeted by therapeutic interventions in erythrocytes. It was observed that the hemolytic activity of ERN was significantly reversed when CK1α or Rac1 GTPase were blocked. The involvement of CK1α in cellular viability is well-documented. It has a crucial role in differentiation, proliferation, and multiple forms of cell death, including autophagy, necroptosis, and pyroptosis [34]. Since CK1α has been identified as a key factor in Ca2+ entry through Cl--responsive Ca2+ channels under conditions of energy depletion, oxidative stress, and osmotic shock [35], it is thus reasonable to assume the existence of an ATP/ROS-CK1α-Ca2+ molecular axis that drives erythrocyte death under certain stress conditions. Accordingly, AMPK, known to orchestrate a wide array of cell death modalities in nucleated cells and in erythrocytes [36,37], may be involved in the crosstalk between CK1α, Ca2+ mobilization, and metabolic exhaustion.
Rac GTPases are known to maintain the hexagonal architectural organization of the RBC cytoskeleton [38]. Previous studies have reported that Rac1 GTPase is essential for intracellular ROS formation by activating NADPH oxidases and nitric oxide synthase [39]. Inhibiting Rac1 GTPase activity with NSC23766 significantly reduced ERN-mediated hemolysis (Figure 7), suggesting that Rac1 GTPase participates in ERN toxicity to RBCs, most likely by promoting ROS formation [40]. Notably, oxysterols [41] and α-mangostin [42] have recently been reported as modulators of Rac1 GTPase in RBCs.
We have also identified other inhibitors of ERN toxicity, including sucrose, urea, and PEG 8000 (Figure 7). Although it still eludes us, the antihemolytic effect of sucrose is ascribed to multiple mechanisms. Sucrose may inhibit Cl- exit, prevent colloid osmotic swelling by blocking water entry, or bind to ERN reducing its potency. Urea is efficiently transported across the membrane of RBCs through facilitated diffusion. The rapid transport of urea is responsible for preserving the osmotic stability and facilitates deformability across osmotic gradients, especially in the renal lumen [43]. Besides modulating channel activity, the protective effect of urea may in part be related to sphingomyelinase inhibition [29]. Of note, structural modifications may potentially reduce the toxicity of ERN to off-target tissue while preserving or enhancing its anticancer properties [44]. Interestingly, oncolytic viruses may also be exploited as vehicles of chemotherapeutic agents, which augments their anticancer potential to overcome chemoresistance [45].

4. Methods

4.1. Chemicals and Reagents

Solarbio Life Science (Beijing, China) supplied all chemicals and reagents unless stated otherwise. A stock solution of 10 mM of ERN (CAS number: 13463-28-0) was prepared by dissolving 10 mg in 1.68 mL of dimethyl sulfoxide (DMSO). The ringer solution contained 125 mM NaCl, 5 mM KCl, 1 mM MgSO4, 32 mM HEPES, 5 mM glucose, and 1 mM CaCl2, whereas the phosphate-buffered saline (PBS) used was composed of 137 mM NaCl, 2.7 mM KCl, 10 mM Na2HPO4, and 1.8 mM KH2PO4.

4.2. RBC Purification

The Ethics Committee of King Saud University Medical City approved the protocol for this study (E-23-7764). All participants provided informed consent according to the Declaration of Helsinki. Lithium heparin- or EDTA-anticoagulated blood samples were collected from 28 healthy volunteers (19 males and 9 females) aged 29–37 years with a BMI of ≤25 and normal CBC to isolate RBCs via centrifugation at 2500 RPM for 15 min at room temperature. Cells were washed several times in PBS or Ca2+-free Ringer solution and maintained at 4 °C for up to 24 h [46].

4.3. Experimental Design

RBCs at 5% hematocrit were exposed to 10–100 μM of ERN for 24 h at 37 °C. Where indicated, cells were exposed to 80 μM of ERN with and without CK1α inhibitor D4476 (20 µM), Rac1 GTPase inhibitor NSC23766 (100 µM), or ATP (500 μM). In certain experiments, Ca2+ was removed from the extracellular space, NaCl was replaced by 125 mM of KCl or 250 mM of sucrose, urea was added at 300 mM, or PEG 8000 was added at 10% w/v [47].

4.4. Hemolysis

The light absorbance of the supernatants obtained from the control and treated cells was measured at 405 nm using a LMPR-A14 microplate reader (Labtron Equipment Ltd., Surrey, UK). The cells suspended in ddH2O were used as a positive control (i.e., 100% hemolysis) to derive percent hemolysis as follows:
H e m o l y s i s % = O D   b l a n k O D   u n k n o w n O D   b l a n k O D   p o s i t i v e c o n t r o l × 100

4.5. Potassium

Extracellular K+ in the supernatants of the control and treated cells was quantified using Solarbio’s Blood Potassium Content Assay Kit (catalog number: BC2775). In this assay, sodium tetraphenylborate combines with K+ in the sample to form a white K+ tetraphenylborate precipitate detected at 520 nm [48].

4.6. Lactate Dehydrogenase (LDH)

LDH activity was measured using Solarbio’s LDH Activity Assay Kit (catalog number: BC0685). In alkaline conditions, LDH converts NAD+ and lactic acid into NADH and pyruvate, which subsequently interacts with 2,4 dinitrophenylhydrazine to produce pyruvate dinitrobenzene (λmax = 450 nm) [49]. One unit of enzyme activity is the amount of enzyme required to generate 1 nM of pyruvate per min per mL supernatant.

4.7. Aspartate Aminotransferase (AST)

AST activity was determined using Solarbio’s AST Activity Assay Kit (catalog number: BC1565) based on the Reitman–Frankel colorimetric method [50]. In the reaction mixture, AST catalyzes the transfer of an amino group from aspartate to α-ketoglutarate, generating glutamate and oxaloacetate, which is decarboxylated by oxaloacetate decarboxylase to pyruvate. The latter was reacted with 2,4-dinitrophenylhydrazine in an alkaline solution to produce brown-red 2,4-dinitrophenylhydrazone detected at 505 nm. One unit of enzyme activity is the amount of enzyme necessary to produce 1 μM of pyruvate per min per mL supernatant.

4.8. Creatine Kinase (CK)

A CK Activity Assay Kit (Solarbio; catalog number: BC1145) was used to measure CK activity. In a series of reactions, CK phosphorylates ADP to ATP, which is added to glucose by hexokinase to form glucose-6-phosphate. Glucose-6-phosphate dehydrogenase then converted glucose-6-phosphate to gluconate-6-phosphate, while NADP+ was reduced to NADPH, whose generation can be monitored at 340 nm [51]. One unit of activity is the amount of CK required to generate 1 nM of NADPH at 37 °C and pH 7.0 per min per mL supernatant.

4.9. Extracellular Acidity

The pH of the supernatants of the control and treated RBCs was measured using the EXIAS e|1 analyzer (EXIAS Medical GmbH, Graz, Austria) [47].

4.10. Acetylcholine Esterase (AChE)

Solarbio’s AChE Activity Assay Kit (catalog number: BC2025), based on the Ellman’s method, was used to measure AChE activity. AChE hydrolyzes acetylthiocholine into thiocholine, which produces 5-mercaptonitrobenzoic acid (λmax = 412 nm) from 2-nitrobenzoic acid. One unit of activity is defined as the amount of AChE that generates 1 nM of 5-mercaptonitrobenzoic acid per min per mL hemolysate [52].

4.11. Membrane Asymmetry and Cellular Morphology

The control and experimental cells were stained with 1% annexin-V-FITC for 10 min at RT, and a total of 10,000 cells were analyzed using a Northern Lights flow cytometer (Cytek Biosciences, Fremont, CA, USA). FITC was stimulated using a blue laser at 488 nm, and the emitted green light was captured at 520 nm.
Cell size and granularity were determined from forward scatter (FSC) and side scatter (SSC) signals, respectively [53].
Samples were prepared for scanning electron microscopy (SEM) as previously detailed [18]. Briefly, the control and experimental cells (100 μM) were fixed in glutraldehyde, stained with osmium tetroxide, dried in ethanol, and examined using a JSM-7610F ultra-high resolution Schottky field emission scanning electron microscope (JEOL Co., Ltd., Akishima, Tokyo, Japan).

4.12. Intracellular Ca2+

Ca2+ in the control and treated cells was labeled with 2 µM of Fluo4/AM for 30 min at 37 °C and analyzed by flow cytometry at 512 nm [54].

4.13. Oxidative Stress

ROS were stained by 5 µM of 2′,7′-dichlorodihydrofluorescein diacetate (H2DCFDA) for 30 min at 37 °C and analyzed by flow cytometry at 520 nm [55].

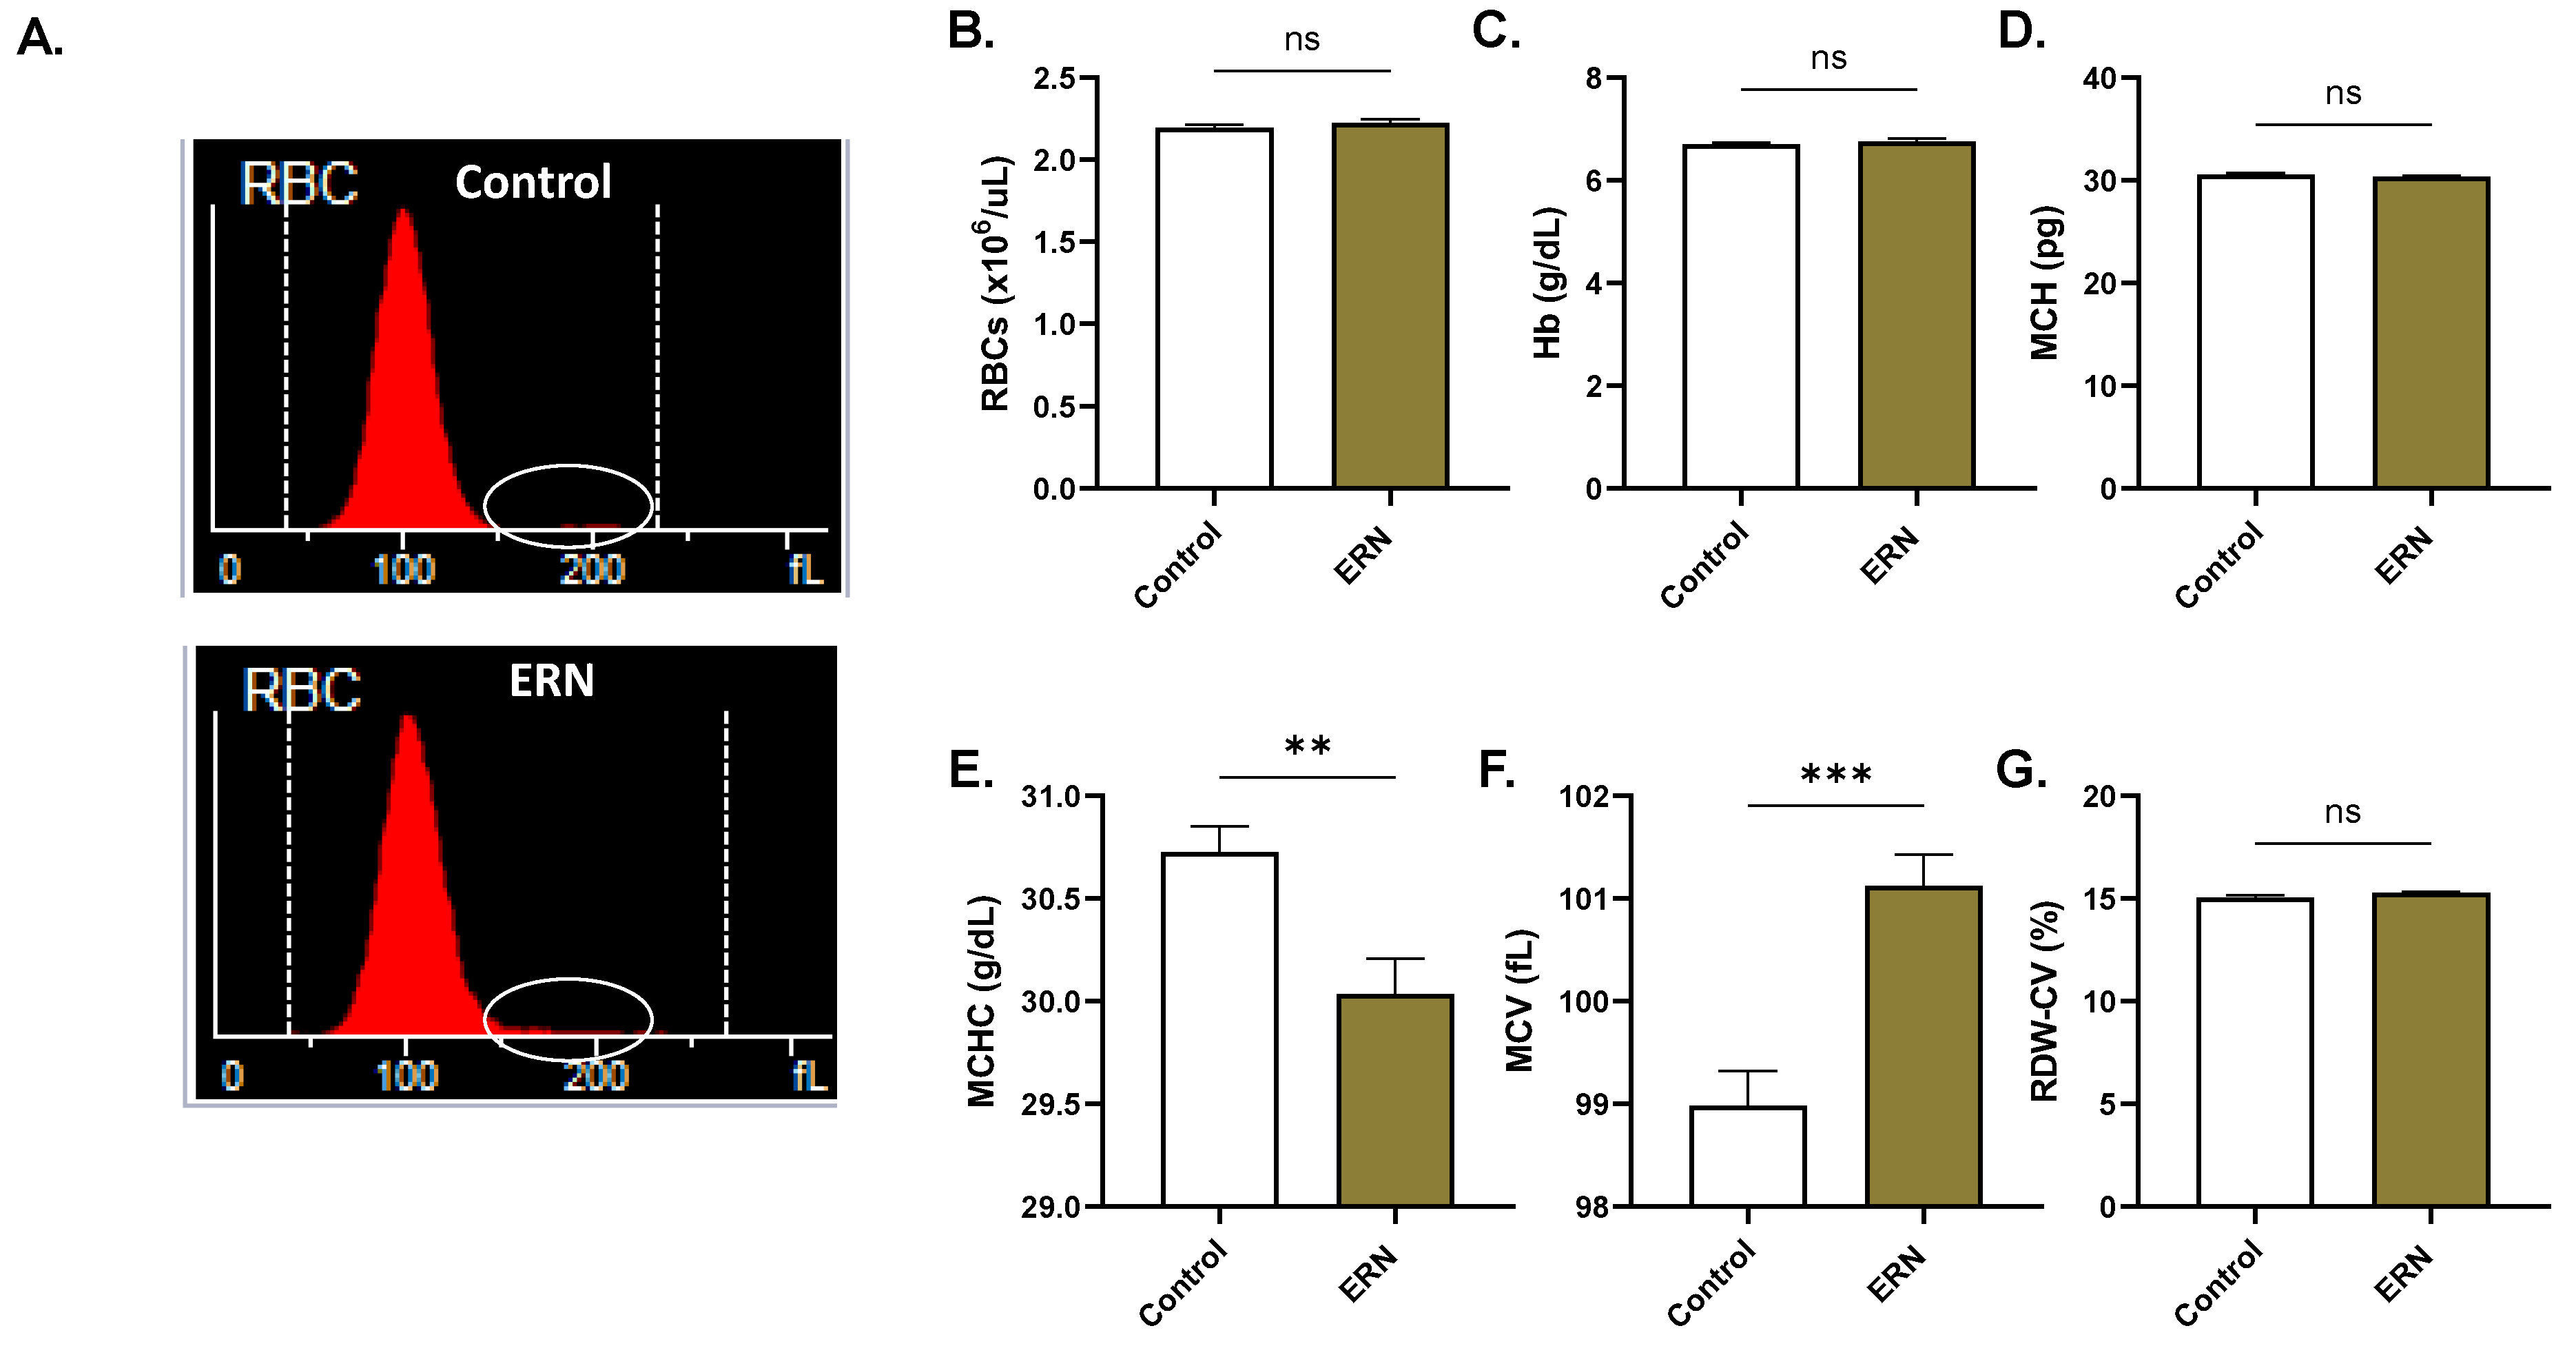
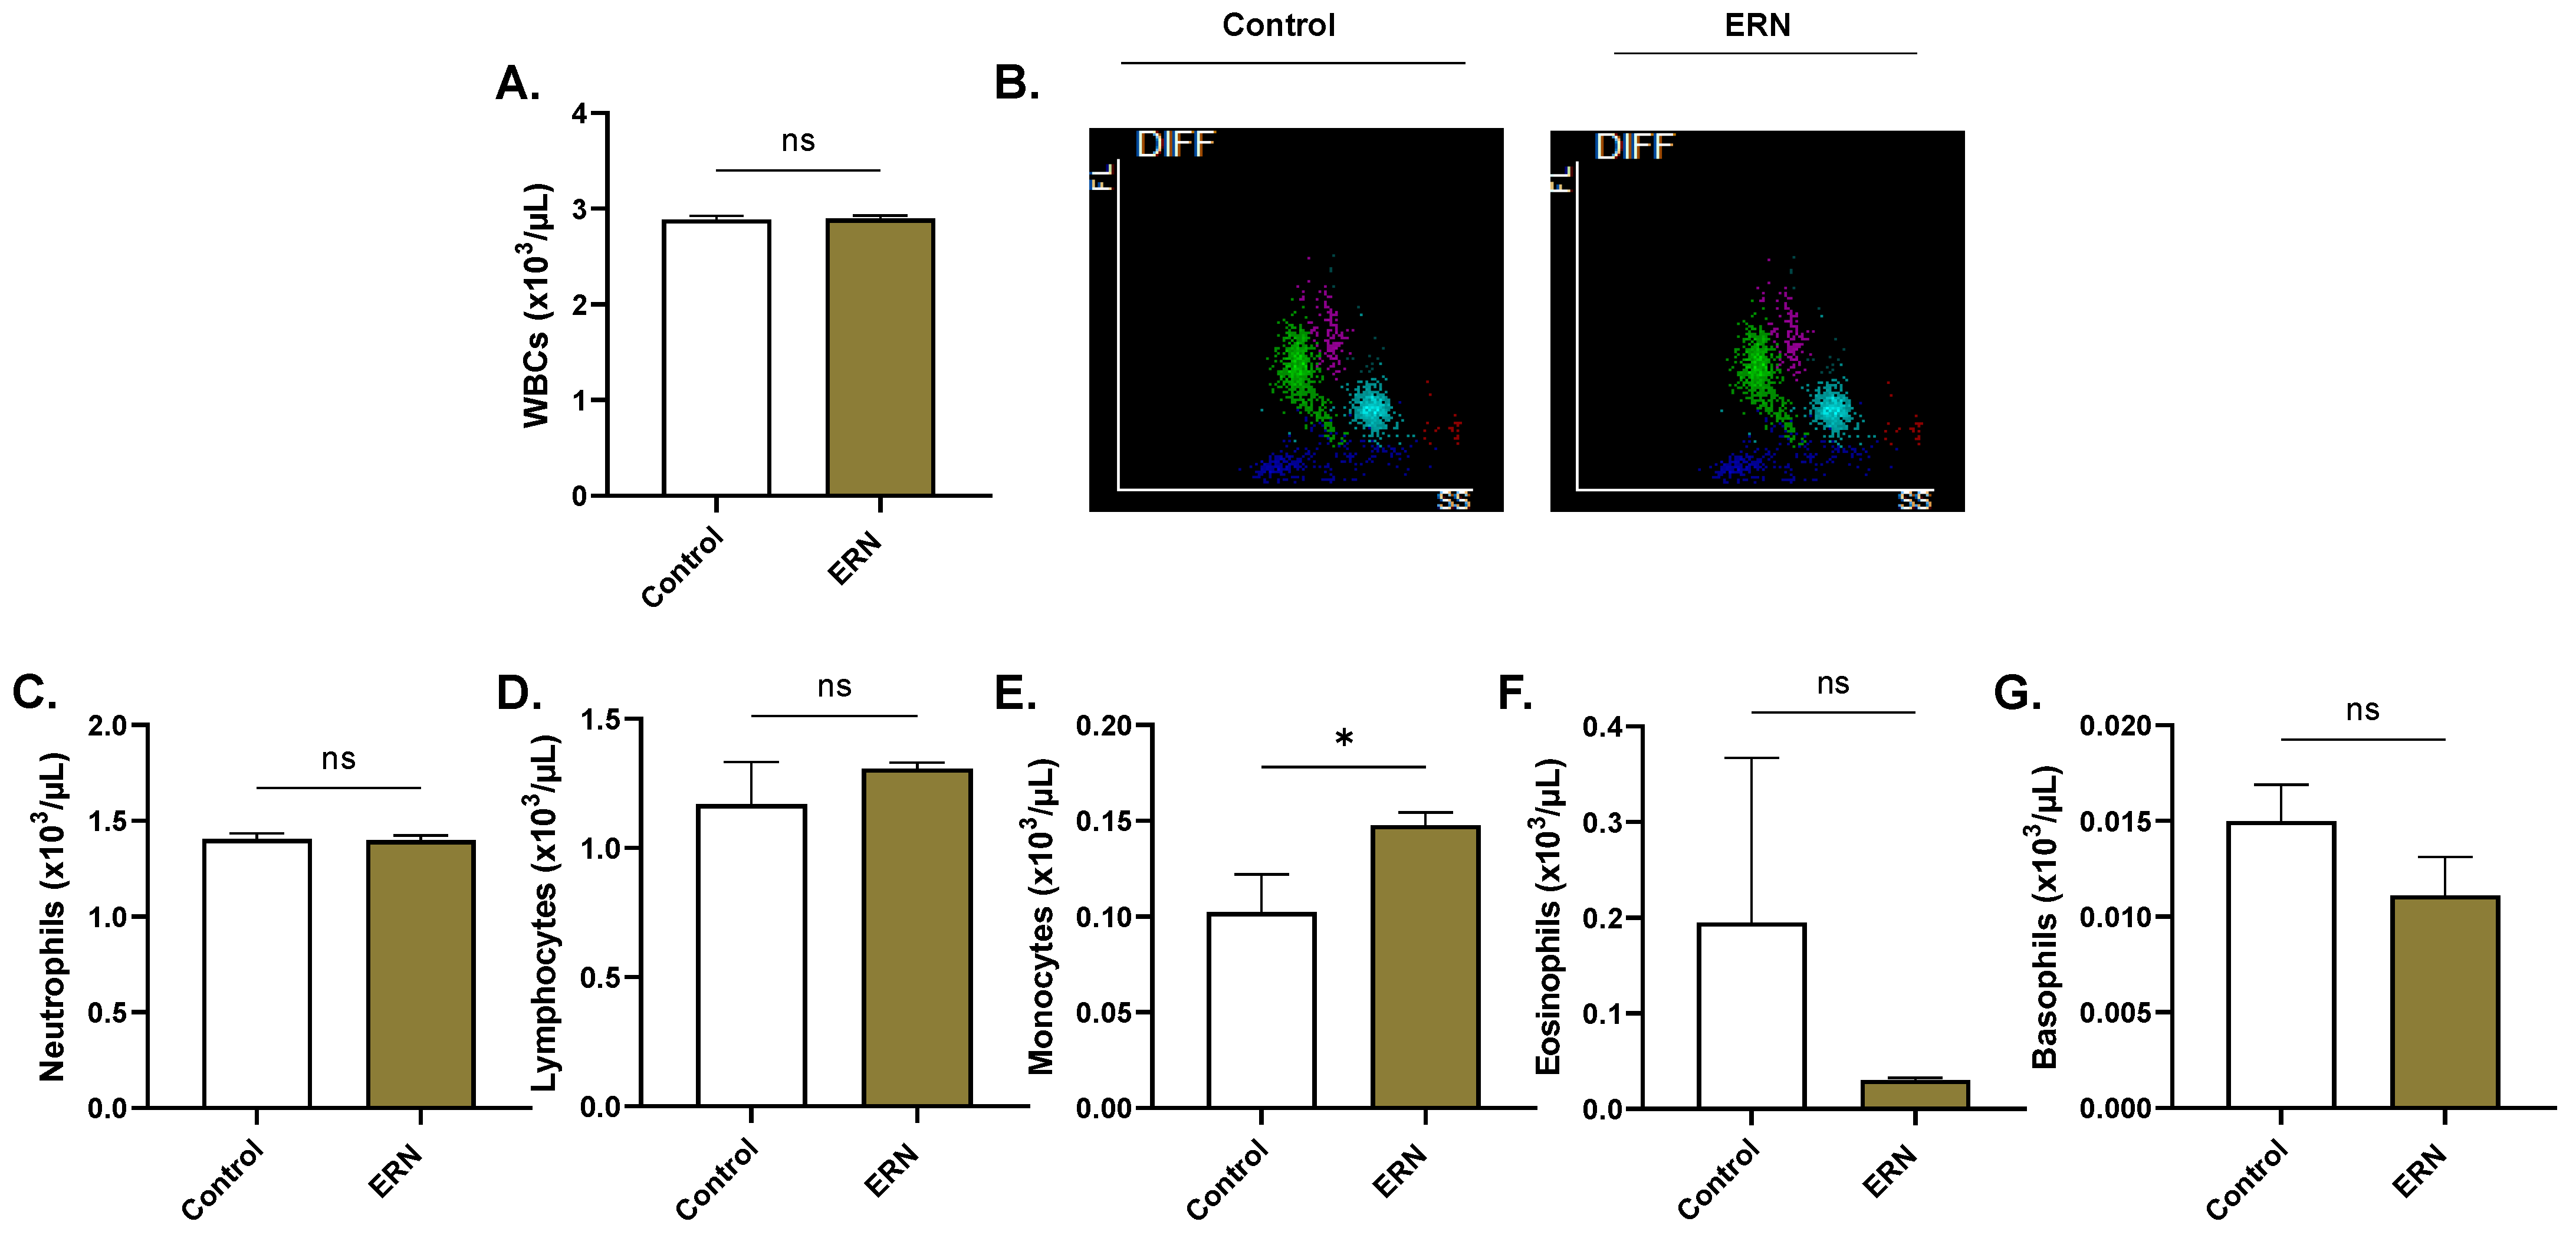
4.14. Systemic Toxicity

A CBC was performed on whole blood diluted 1:2 with PBS following incubation for 24 h at 37 °C with and without 100 µM of ERN using a BC-6200 hematology analyzer (Mindray Medical International Limited, Shenzhen, China) [42].

4.15. Erythrocyte Sedimentation Rate (ESR)

The distance travelled by the RBCs in control and treated whole blood sedimented in Westergren tubes for 60 min was recorded [42].

4.16. Statistics

Flow cytometric outputs, expressed as arbitrary units (a.u.) or percentages, were analyzed using FlowJoTM v10.7.2 (Becton, Dickinson and Company, Ashland, OR, USA), and GraphPad v9.5.1 (GraphPad Software, Inc., San Diego, CA, USA) was used to perform statistical analyses. Data are shown as means ± SEM of three independent experiments. Two groups were compared using Student’s t-test, while three or more were compared via a one-way ANOVA corrected by Dunnett’s post hoc test. Significance was set at a p value of <0.05.

5. Conclusions

In conclusion, this study reports that ERN elicits hemolysis and eryptosis characterized by a decrease in membrane asymmetry, Ca2+ mobilization, cell shrinkage and swelling, and oxidative injury. Moreover, CK1α and Rac1 GTPase have been identified as essential for the toxic effects of ERN in RBCs, which can be abrogated by isosmotic sucrose, urea, and PEG 8000. The further development and validation of ERN in anticancer therapy must be cautiously pursued.

Author Contributions

Conceptualization, M.A.A.; methodology, all authors; software, M.A.A.; validation, S.A.A. and M.A.A.; formal analysis, all authors; investigation, S.A.A. and J.A.; resources, M.A.A.; data curation, all authors; writing—original draft preparation, all authors; writing—review and editing, all authors; visualization, J.A.; supervision, M.A.A.; project administration, M.A.A.; funding acquisition, M.A.A. All authors have read and agreed to the published version of the manuscript.

Funding

This work was funded by the Deputyship for Research and Innovation, Ministry of Education, Saudi Arabia, through grant number IFKSUDR-H115.

Institutional Review Board Statement

The study was conducted in accordance with the Declaration of Helsinki, and approved by the Institutional Review Board of King Saud University Medical City (#E-23-7764, approved on 23 May 2023).

Informed Consent Statement

Informed consent was obtained from all subjects involved in the study.

Data Availability Statement

Data is contained within the article.

Acknowledgments

The authors extend their appreciation to the Deputyship for Research and Innovation, Ministry of Education, Saudi Arabia, for funding this work under grant number IFKSUDR-H115.

Conflicts of Interest

The authors declare no conflict of interest.

References

  1. Klimek-Szczykutowicz, M.; Szopa, A.; Ekiert, H. Citrus limon (Lemon) Phenomenon-A Review of the Chemistry, Pharmacological Properties, Applications in the Modern Pharmaceutical, Food, and Cosmetics Industries, and Biotechnological Studies. Plants 2020, 9, 119. [Google Scholar] [CrossRef] [PubMed]
  2. Maqsood, R.; Khan, F.; Ullah, S.; Khan, A.; Al-Jahdhami, H.; Hussain, J.; Weli, A.M.; Maqsood, D.; Rahman, S.M.; Hussain, A.; et al. Evaluation of Antiproliferative, Antimicrobial, Antioxidant, Antidiabetic and Phytochemical Analysis of Anogeissus dhofarica A. J. Scott. Antibiotics 2023, 12, 354. [Google Scholar] [CrossRef]
  3. Lv, X.; Zhao, S.; Ning, Z.; Zeng, H.; Shu, Y.; Tao, O.; Xiao, C.; Lu, C.; Liu, Y. Citrus fruits as a treasure trove of active natural metabolites that potentially provide benefits for human health. Chem. Cent. J. 2015, 9, 68. [Google Scholar] [CrossRef] [PubMed]
  4. Saini, R.K.; Ranjit, A.; Sharma, K.; Prasad, P.; Shang, X.; Gowda, K.G.M.; Keum, Y.S. Bioactive Compounds of Citrus Fruits: A Review of Composition and Health Benefits of Carotenoids, Flavonoids, Limonoids, and Terpenes. Antioxidants 2022, 11, 239. [Google Scholar] [CrossRef] [PubMed]
  5. Gandhi, G.R.; Vasconcelos, A.B.S.; Wu, D.T.; Li, H.B.; Antony, P.J.; Li, H.; Geng, F.; Gurgel, R.Q.; Narain, N.; Gan, R.Y. Citrus Flavonoids as Promising Phytochemicals Targeting Diabetes and Related Complications: A Systematic Review of In Vitro and In Vivo Studies. Nutrients 2020, 12, 2907. [Google Scholar] [CrossRef] [PubMed]
  6. Zaidun, N.H.; Thent, Z.C.; Latiff, A.A. Combating oxidative stress disorders with citrus flavonoid: Naringenin. Life Sci. 2018, 208, 111–122. [Google Scholar] [CrossRef] [PubMed]
  7. Lu, X.; Zhao, C.; Shi, H.; Liao, Y.; Xu, F.; Du, H.; Xiao, H.; Zheng, J. Nutrients and bioactives in citrus fruits: Different citrus varieties, fruit parts, and growth stages. Crit. Rev. Food Sci. Nutr. 2023, 63, 2018–2041. [Google Scholar] [CrossRef]
  8. Pontifex, M.G.; Malik, M.; Connell, E.; Müller, M.; Vauzour, D. Citrus Polyphenols in Brain Health and Disease: Current Perspectives. Front. Neurosci. 2021, 15, 640648. [Google Scholar] [CrossRef]
  9. Stevens, Y.; Rymenant, E.V.; Grootaert, C.; Camp, J.V.; Possemiers, S.; Masclee, A.; Jonkers, D. The Intestinal Fate of Citrus Flavanones and Their Effects on Gastrointestinal Health. Nutrients 2019, 11, 1464. [Google Scholar] [CrossRef]
  10. Minato, K.; Miyake, Y.; Fukumoto, S.; Yamamoto, K.; Kato, Y.; Shimomura, Y.; Osawa, T. Lemon flavonoid, eriocitrin, suppresses exercise-induced oxidative damage in rat liver. Life Sci. 2003, 72, 1609–1616. [Google Scholar] [CrossRef]
  11. Yao, L.; Liu, W.; Bashir, M.; Nisar, M.F.; Wan, C.C. Eriocitrin: A review of pharmacological effects. Biomed. Pharmacother. 2022, 154, 113563. [Google Scholar] [CrossRef] [PubMed]
  12. Ogata, S.; Miyake, Y.; Yamamoto, K.; Okumura, K.; Taguchi, H. Apoptosis induced by the flavonoid from lemon fruit (Citrus limon BURM. f.) and its metabolites in HL-60 cells. Biosci. Biotechnol. Biochem. 2000, 64, 1075–1078. [Google Scholar] [CrossRef]
  13. Wang, Z.; Zhang, H.; Zhou, J.; Zhang, X.; Chen, L.; Chen, K.; Huang, Z. Eriocitrin from lemon suppresses the proliferation of human hepatocellular carcinoma cells through inducing apoptosis and arresting cell cycle. Cancer Chemother. Pharmacol. 2016, 78, 1143–1150. [Google Scholar] [CrossRef] [PubMed]
  14. Yuan, C.; Chen, G.; Jing, C.; Liu, M.; Liang, B.; Gong, G.; Yu, M. Eriocitrin, a dietary flavonoid suppressed cell proliferation, induced apoptosis through modulation of JAK2/STAT3 and JNK/p38 MAPKs signaling pathway in MCF-7 cells. J. Biochem. Mol. Toxicol. 2022, 36, e22943. [Google Scholar] [CrossRef] [PubMed]
  15. Gao, M.; Lai, K.; Deng, Y.; Lu, Z.; Song, C.; Wang, W.; Xu, C.; Li, N.; Geng, Q. Eriocitrin inhibits epithelial-mesenchymal transformation (EMT) in lung adenocarcinoma cells via triggering ferroptosis. Aging 2023, 15, 10089–10104. [Google Scholar] [CrossRef]
  16. Visweshwar, N.; Jaglal, M.; Sokol, L.; Zuckerman, K. Chemotherapy-related anemia. Ann. Hematol. 2018, 97, 375–376. [Google Scholar] [CrossRef]
  17. Lang, E.; Bissinger, R.; Qadri, S.M.; Lang, F. Suicidal death of erythrocytes in cancer and its chemotherapy: A potential target in the treatment of tumor-associated anemia. Int. J. Cancer 2017, 141, 1522–1528. [Google Scholar] [CrossRef]
  18. Pretorius, E.; du Plooy, J.N.; Bester, J. A Comprehensive Review on Eryptosis. Cell Physiol. Biochem. 2016, 39, 1977–2000. [Google Scholar] [CrossRef]
  19. Restivo, I.; Attanzio, A.; Tesoriere, L.; Allegra, M. Suicidal Erythrocyte Death in Metabolic Syndrome. Antioxidants 2021, 10, 154. [Google Scholar] [CrossRef]
  20. Lang, P.A.; Huober, J.; Bachmann, C.; Kempe, D.S.; Sobiesiak, M.; Akel, A.; Niemoeller, O.M.; Dreischer, P.; Eisele, K.; Klarl, B.A.; et al. Stimulation of erythrocyte phosphatidylserine exposure by paclitaxel. Cell Physiol. Biochem. 2006, 18, 151–164. [Google Scholar] [CrossRef]
  21. Mahmud, H.; Föller, M.; Lang, F. Suicidal erythrocyte death triggered by cisplatin. Toxicology 2008, 249, 40–44. [Google Scholar] [CrossRef] [PubMed]
  22. Kato, G.J.; Steinberg, M.H.; Gladwin, M.T. Intravascular hemolysis and the pathophysiology of sickle cell disease. J. Clin. Invest. 2017, 127, 750–760. [Google Scholar] [CrossRef] [PubMed]
  23. Vishalakshi, G.J.; Hemshekhar, M.; Kemparaju, K.; Girish, K.S. Para-tertiary butyl catechol induces eryptosis in vitro via oxidative stress and hemoglobin leakage in human erythrocytes. Toxicol. Vitr. 2018, 52, 286–296. [Google Scholar] [CrossRef] [PubMed]
  24. Ivanov, I.T. Low pH-induced hemolysis of erythrocytes is related to the entry of the acid into cytosole and oxidative stress on cellular membranes. Biochim. Biophys. Acta 1999, 1415, 349–360. [Google Scholar] [CrossRef]
  25. Alghareeb, S.A.; Alfhili, M.A.; Fatima, S. Molecular Mechanisms and Pathophysiological Significance of Eryptosis. Int. J. Mol. Sci. 2023, 24, 5079. [Google Scholar] [CrossRef] [PubMed]
  26. Lang, F.; Qadri, S.M. Mechanisms and significance of eryptosis, the suicidal death of erythrocytes. Blood Purif. 2012, 33, 125–130. [Google Scholar] [CrossRef]
  27. Bortner, C.D.; Cidlowski, J.A. Ions, the Movement of Water and the Apoptotic Volume Decrease. Front. Cell Dev. Biol. 2020, 8, 611211. [Google Scholar] [CrossRef]
  28. Ghashghaeinia, M.; Wesseling, M.C.; Ramos, E.; Petkova-Kirova, P.; Waibel, S.; Lang, E.; Bissinger, R.; Alzoubi, K.; Edelmann, B.; Hosseinzadeh, Z.; et al. Trifluoperazine-Induced Suicidal Erythrocyte Death and S-Nitrosylation Inhibition, Reversed by the Nitric Oxide Donor Sodium Nitroprusside. Cell Physiol. Biochem. 2017, 42, 1985–1998. [Google Scholar] [CrossRef]
  29. Lang, K.S.; Myssina, S.; Lang, P.A.; Tanneur, V.; Kempe, D.S.; Mack, A.F.; Huber, S.M.; Wieder, T.; Lang, F.; Duranton, C. Inhibition of erythrocyte phosphatidylserine exposure by urea and Cl. Am. J. Physiol. Renal Physiol. 2004, 286, F1046–F1053. [Google Scholar] [CrossRef]
  30. Bissinger, R.; Bhuyan, A.A.M.; Qadri, S.M.; Lang, F. Oxidative stress, eryptosis and anemia: A pivotal mechanistic nexus in systemic diseases. FEBS J. 2019, 286, 826–854. [Google Scholar] [CrossRef]
  31. Repsold, L.; Joubert, A.M. Eryptosis: An Erythrocyte’s Suicidal Type of Cell Death. Biomed. Res. Int. 2018, 2018, 9405617. [Google Scholar] [CrossRef] [PubMed]
  32. Mohanty, J.G.; Nagababu, E.; Rifkind, J.M. Red blood cell oxidative stress impairs oxygen delivery and induces red blood cell aging. Front. Physiol. 2014, 5, 84. [Google Scholar] [CrossRef] [PubMed]
  33. Pribush, A.; Meyerstein, D.; Meyerstein, N. Kinetics of erythrocyte swelling and membrane hole formation in hypotonic media. Biochim. Biophys. Acta 2002, 1558, 119–132. [Google Scholar] [CrossRef]
  34. Tkachenko, A.; Onishchenko, A. Casein kinase 1alpha mediates eryptosis: A review. Apoptosis 2023, 28, 1–19. [Google Scholar] [CrossRef] [PubMed]
  35. Zelenak, C.; Eberhard, M.; Jilani, K.; Qadri, S.M.; Macek, B.; Lang, F. Protein kinase CK1alpha regulates erythrocyte survival. Cell Physiol. Biochem. 2012, 29, 171–180. [Google Scholar] [CrossRef] [PubMed]
  36. Khan, F.; Khan, H.; Khan, A.; Yamasaki, M.; Moustaid-Moussa, N.; Al-Harrasi, A.; Rahman, S.M. Autophagy in adipogenesis: Molecular mechanisms and regulation by bioactive compounds. Biomed. Pharmacother. 2022, 155, 113715. [Google Scholar] [CrossRef] [PubMed]
  37. Föller, M.; Sopjani, M.; Koka, S.; Gu, S.; Mahmud, H.; Wang, K.; Floride, E.; Schleicher, E.; Schulz, E.; Münzel, T.; et al. Regulation of erythrocyte survival by AMP-activated protein kinase. FASEB J. 2009, 23, 1072–1080. [Google Scholar] [CrossRef]
  38. Kalfa, T.A.; Pushkaran, S.; Mohandas, N.; Hartwig, J.H.; Fowler, V.M.; Johnson, J.F.; Joiner, C.H.; Williams, D.A.; Zheng, Y. Rac GTPases regulate the morphology and deformability of the erythrocyte cytoskeleton. Blood 2006, 108, 3637–3645. [Google Scholar] [CrossRef]
  39. George, A.; Pushkaran, S.; Konstantinidis, D.G.; Koochaki, S.; Malik, P.; Mohandas, N.; Zheng, Y.; Joiner, C.H.; Kalfa, T.A. Erythrocyte NADPH oxidase activity modulated by Rac GTPases, PKC, and plasma cytokines contributes to oxidative stress in sickle cell disease. Blood 2013, 121, 2099–2107. [Google Scholar] [CrossRef]
  40. Ferro, E.; Goitre, L.; Retta, S.F.; Trabalzini, L. The Interplay between ROS and Ras GTPases: Physiological and Pathological Implications. J. Signal Transduct. 2012, 2012, 365769. [Google Scholar] [CrossRef]
  41. Attanzio, A.; Frazzitta, A.; Cilla, A.; Livrea, M.A.; Tesoriere, L.; Allegra, M. 7-Keto-Cholesterol and Cholestan-3beta, 5alpha, 6beta-Triol Induce Eryptosis through Distinct Pathways Leading to NADPH Oxidase and Nitric Oxide Synthase Activation. Cell Physiol. Biochem. 2019, 53, 933–947. [Google Scholar] [CrossRef] [PubMed]
  42. Alghareeb, S.A.; Alsughayyir, J.; Alfhili, M.A. Stimulation of Hemolysis and Eryptosis by α-Mangostin through Rac1 GTPase and Oxidative Injury in Human Red Blood Cells. Molecules 2023, 28, 6495. [Google Scholar] [CrossRef] [PubMed]
  43. Sidoux-Walter, F.; Lucien, N.; Olives, B.; Gobin, R.; Rousselet, G.; Kamsteeg, E.J.; Ripoche, P.; Deen, P.M.; Cartron, J.P.; Bailly, P. At physiological expression levels the Kidd blood group/urea transporter protein is not a water channel. J. Biol. Chem. 1999, 274, 30228–30235. [Google Scholar] [CrossRef] [PubMed]
  44. Avula, S.K.; Rehman, N.U.; Khan, F.; Ullah, O.; Halim, S.A.; Khan, A.; Anwar, M.U.; Rahman, S.M.; Csuk, R.; Al-Harrasi, A. Triazole-tethered boswellic acid derivatives against breast cancer: Synthesis, in vitro, and in-silico studies. J. Mol. Struct. 2023, 1282, 135181. [Google Scholar] [CrossRef]
  45. Mozaffari Nejad, A.S.; Noor, T.; Munim, Z.H.; Alikhani, M.Y.; Ghaemi, A. A bibliometric review of oncolytic virus research as a novel approach for cancer therapy. Virol. J. 2021, 18, 98. [Google Scholar] [CrossRef]
  46. Alfhili, M.A.; Alsughayyir, J. Metabolic exhaustion and casein kinase 1alpha drive deguelin-induced premature red blood cell death. Xenobiotica 2023, 53, 445–453. [Google Scholar] [CrossRef]
  47. Alfhili, M.A.; Alyousef, A.M.; Alsughayyir, J. Tamoxifen induces eryptosis through calcium accumulation and oxidative stress. Med. Oncol. 2023, 40, 333. [Google Scholar] [CrossRef]
  48. Zeng, B.; Huang, Y.; Chen, S.; Xu, R.; Xu, L.; Qiu, J.; Shi, F.; Liu, S.; Zha, Q.; Ouyang, D.; et al. Dextran sodium sulfate potentiates NLRP3 inflammasome activation by modulating the KCa3.1 potassium channel in a mouse model of colitis. Cell Mol. Immunol. 2022, 19, 925–943. [Google Scholar] [CrossRef]
  49. Ramos-Martinez, E.; Vega-Sanchez, A.E.; Perez-Rubio, G.; Mejia, M.; Buendia-Roldan, I.; Gonzalez-Perez, M.I.; Mateos-Toledo, H.N.; Andrade, W.A.; Falfan-Valencia, R.; Rojas-Serrano, J. Enhanced Activity of NLRP3 Inflammasome in the Lung of Patients with Anti-Synthetase Syndrome. Cells 2022, 12, 60. [Google Scholar] [CrossRef]
  50. Reitman, S.; Frankel, S. A colorimetric method for the determination of serum glutamic oxalacetic and glutamic pyruvic transaminases. Am. J. Clin. Pathol. 1957, 28, 56–63. [Google Scholar] [CrossRef]
  51. Ueda, S.; Sakasegawa, S. Enzymatic cycling method using creatine kinase to measure creatine by real-time detection. Anal. Biochem. 2016, 506, 8–12. [Google Scholar] [CrossRef] [PubMed]
  52. Altaf, S.; Muhammad, F.; Aslam, B.; Faisal, M.N. Cell membrane enveloped polymeric nanosponge for detoxification of chlorpyrifos poison: In vitro and in vivo studies. Hum. Exp. Toxicol. 2021, 40, 1286–1295. [Google Scholar] [CrossRef] [PubMed]
  53. Marcello, M.; Virzi, G.M.; Marturano, D.; de Cal, M.; Marchionna, N.; Sgarabotto, L.; De Rosa, S.; Ronco, C.; Zanella, M. The Cytotoxic Effect of Septic Plasma on Healthy RBCs: Is Eryptosis a New Mechanism for Sepsis? Int. J. Mol. Sci. 2023, 24, 14176. [Google Scholar] [CrossRef] [PubMed]
  54. Rossi, A.M.; Taylor, C.W. Reliable measurement of free Ca(2+) concentrations in the ER lumen using Mag-Fluo-4. Cell Calcium 2020, 87, 102188. [Google Scholar] [CrossRef]
  55. Mozaffari Nejad, A.S.; Fotouhi, F.; Mehrbod, P.; Keshavarz, M.; Alikhani, M.Y.; Ghaemi, A. Oncolytic effects of Hitchner B1 strain of newcastle disease virus against cervical cancer cell proliferation is mediated by the increased expression of cytochrome C, autophagy and apoptotic pathways. Microb. Pathog. 2020, 147, 104438. [Google Scholar] [CrossRef]
Figure 1. ERN induces hemolysis. (A) Molecular structure of ERN. (B) Concentration-responsive hemolytic activity of ERN (10–100 μM) in PBS. (C) Concentration-responsive hemolytic activity of ERN (10–100 μM) in Ringer solution. ERN-induced (40–100 μM) leakage of hemolytic markers (D) K+, (E) LDH, (F) AST, and (G) CK. Results are shown as means ± SEM (n = 9). ns indicates no statistical significance, while * (p < 0.05), ** (p < 0.01), *** (p < 0.001), and **** (p < 0.0001).
Pharmaceuticals 16 01681 g001
Figure 2. Effect of ERN on extracellular pH and AChE. (A) pH and (B) AChE activity in control and ERN-treated (40–100 μM) cells. Results are shown as means ± SEM (n = 9). ns indicates no statistical significance. *** (p < 0.001); **** (p < 0.0001).
Pharmaceuticals 16 01681 g002
Figure 3. ERN induces eryptosis. (A) Representative histograms of annexin-V-FITC fluorescence of control (black line) and treated cells (100 μM; brown line). (B) Geomean annexin-V-FITC fluorescence (a.u.) of control and treated (40–100 μM) cells. (C) Percentage of eryptotic cells (40–100 μM). (D) ESR of control and treated (100 μM) cells. Results are shown as means ± SEM (n = 9). * (p < 0.05) and **** (p < 0.0001).
Pharmaceuticals 16 01681 g003
Figure 4. ERN raises cytosolic Ca2+ levels. (A) Representative histograms of Fluo4 fluorescence of control (black line) and treated cells (100 μM; brown line). (B) Geomean Fluo4 fluorescence (fold change) of control and treated (40–100 μM) cells. (C) Percentage of cells with excess Ca2+ accumulation (40–100 μM). Results are shown as means ± SEM (n = 9). ns indicates no statistical significance, while * (p < 0.05) and ** (p < 0.01).
Pharmaceuticals 16 01681 g004
Figure 5. ERN elicits oxidative damage. (A) Representative histograms of DCF fluorescence of control (black line) and treated cells (100 μM; brown line). (B) Geomean DCF fluorescence (fold change) of control and treated (40–100 μM) cells. (C) Percentage of oxidized cells (40–100 μM). Results are shown as means ± SEM (n = 9). ns indicates no statistical significance, while **** (p < 0.0001).
Pharmaceuticals 16 01681 g005
Figure 6. Effect of ERN on RBC morphology. (A) Representative histograms of FSC of control (black line) and treated cells (100 μM; brown line). (B) Geomean FSC (a.u.) of control and treated (40–100 μM) cells. (C) Percentage of shrinkage in control and treated (40–100 μM) cells. (D) Distribution of control and treated (100 μM) cells relative to FSC-H and annexin-V-FITC. (E) Percentage of swelling in control and treated cells (40–100 μM). (F) Geomean SSC (a.u.) of control and treated (40–100 μM) cells (G) SEM micrographs (×10,000; scale bar: 1 μM) of control and treated (100 μM) cells. Results are shown as means ± SEM (n = 9). ns indicates no statistical significance, while * (p < 0.05), ** (p < 0.01), and **** (p < 0.0001).
Pharmaceuticals 16 01681 g006
Figure 7. Inhibitors of ERN-induced RBC death. Effect of (A) D4476 (20 uM), (B) ATP (500 μM), (C) NSC23766 (100 uM), (D) urea (300 mM), (E) sucrose (250 mM), (F) KCl (125 mM), (G) extracellular Ca2+ (1 mM) removal, and (H) PEG 8000 (10%) on ERN-induced hemolysis (80 μM). Results are shown as means ± SEM (n = 9). ns indicates no statistical significance, while * (p < 0.05), ** (p < 0.01), and **** (p < 0.0001).
Pharmaceuticals 16 01681 g007
Figure 8. ERN exhausts corpuscular Hb in whole blood. (A) Representative histograms of RBC volume. (B) RBC count. (C) Hb. (D) MCH. (E) MCHC. (F) MCV. (G) RDW-CV. Results are shown as means ± SEM (n = 9) for control and treated (100 μM) whole blood. ns indicates no statistical significance. ** (p < 0.01); *** (p < 0.001).
Pharmaceuticals 16 01681 g008
Figure 9. Effect of ERN on white blood cells. (A) Leukocyte count. (B) Representative scattergrams of fluorescence and side scatter intensity of leukocytes. Viability of (C) neutrophils, (D) lymphocytes, (E) monocytes, (F) eosinophils, and (G) basophils. Results are shown as means ± SEM (n = 9) for control and treated (100 μM) whole blood. ns indicates no statistical significance, while * (p < 0.05).
Pharmaceuticals 16 01681 g009
Disclaimer/Publisher’s Note: The statements, opinions and data contained in all publications are solely those of the individual author(s) and contributor(s) and not of MDPI and/or the editor(s). MDPI and/or the editor(s) disclaim responsibility for any injury to people or property resulting from any ideas, methods, instructions or products referred to in the content.

