

Profiling Analysis of Tryptophan Metabolites in the Urine of Patients with Parkinson’s Disease Using LC–MS/MS

Abstract
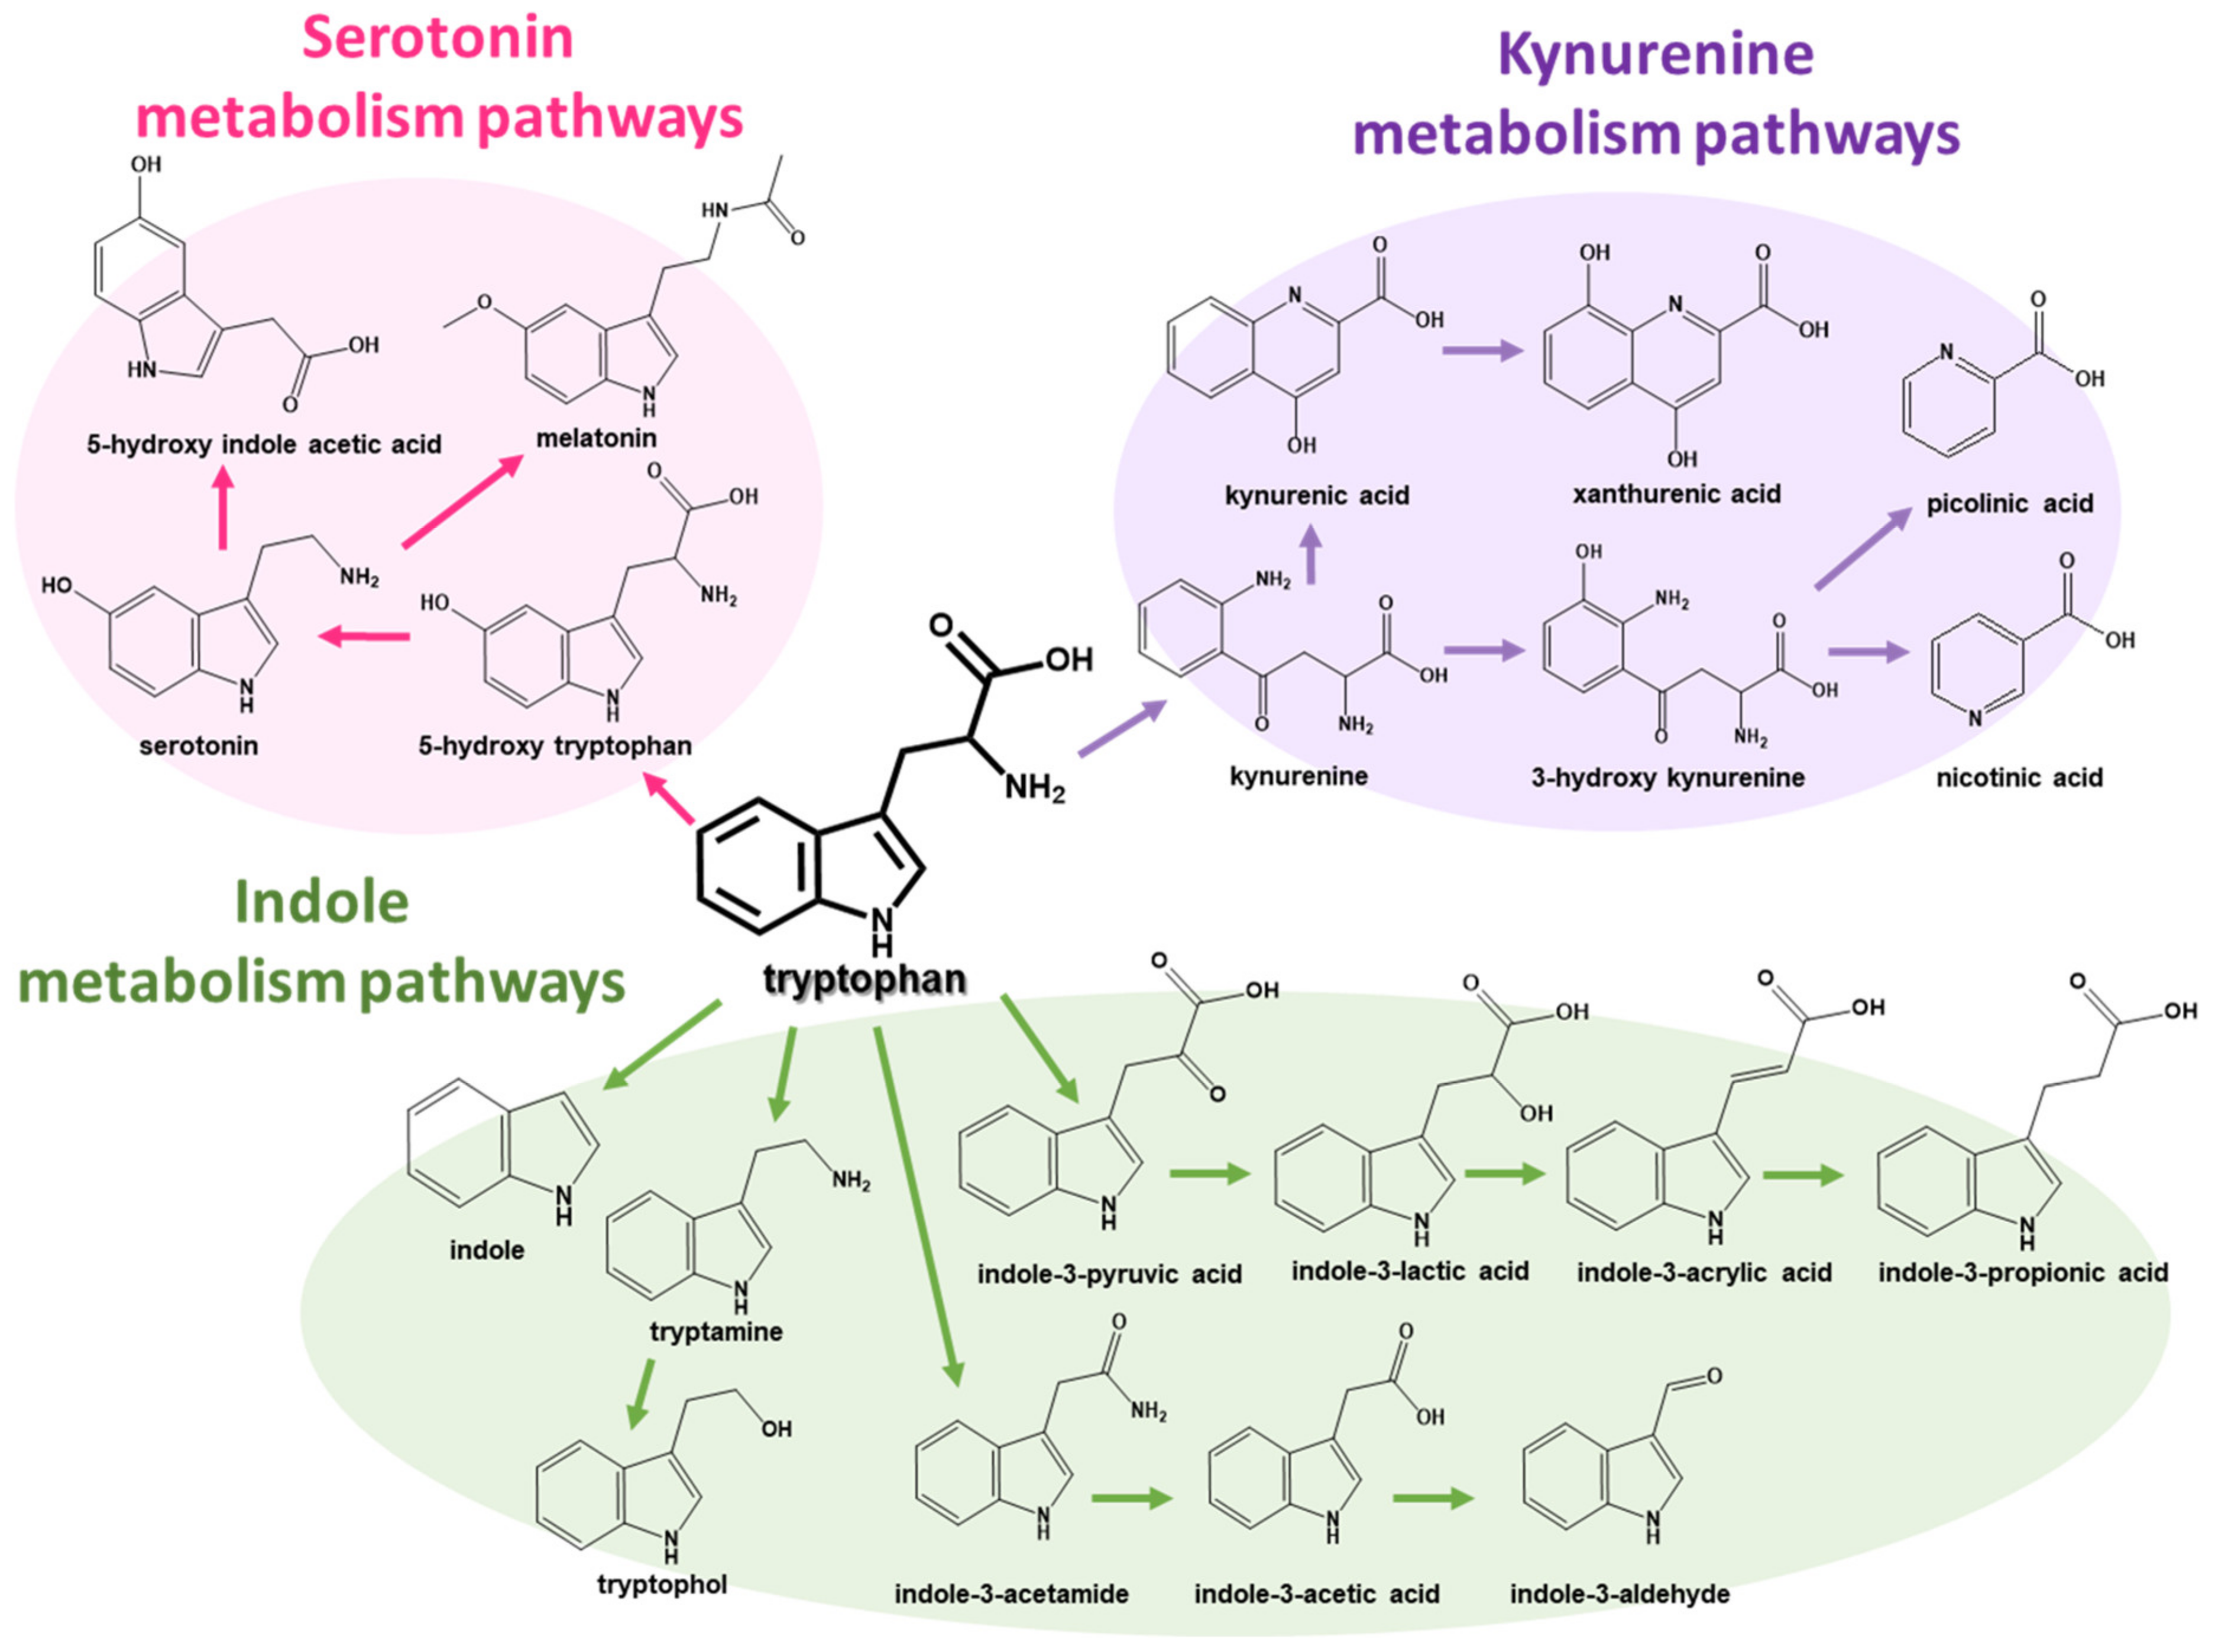
:1. Introduction
2. Results and Discussion
2.1. Optimization of an Analytical Method for Tryptophan Metabolism Pathways
2.2. Method Validation
2.3. Analysis of Human Urine to Find Potential Biomarkers for Parkinson’s Disease
3. Materials and Methods
3.1. Chemicals and Materials
3.2. Internal Standard and Stock Solution Preparation
3.3. Human Biological Samples
3.4. Sample Preparation
3.5. UPLC–MS/MS–MRM Conditions
3.6. Method Validation
4. Conclusions
Supplementary Materials
Author Contributions
Funding
Institutional Review Board Statement
Informed Consent Statement
Data Availability Statement
Conflicts of Interest
References
- Dauer, W.; Przedborski, S. Parkinson’s Disease: Mechanisms and Models. Neuron 2003, 39, 889–909. [Google Scholar] [CrossRef] [PubMed]
- Gallop, A.; Weagley, J.; Paracha, S.-U.; Grossberg, G. The Role of The Gut Microbiome in Parkinson’s Disease. J. Geriatr. Psychiatry Neurol. 2021, 34, 253–262. [Google Scholar] [CrossRef]
- Pfeiffer, R.F. Non-motor symptoms in Parkinson’s disease. Park. Relat. Disord. 2016, 22, S119–S122. [Google Scholar] [CrossRef] [PubMed]
- Klingelhoefer, L.; Reichmann, H. Parkinson’s disease as a multisystem disorder. J. Neural Transm. 2017, 124, 709–713. [Google Scholar] [CrossRef] [PubMed]
- Chen, Y.; Dalwadi, G.; Benson, H.A. Drug Delivery Across the Blood-Brain Barrier. Curr. Drug Deliv. 2004, 1, 361–376. [Google Scholar] [CrossRef]
- Shao, Y.; Le, W. Recent advances and perspectives of metabolomics-based investigations in Parkinson’s disease. Mol. Neurodegener. 2019, 14, 3. [Google Scholar] [CrossRef]
- Gosselet, F.; Loiola, R.A.; Roig, A.; Rosell, A.; Culot, M. Central nervous system delivery of molecules across the blood-brain barrier. Neurochem. Int. 2021, 144, 104952. [Google Scholar] [CrossRef] [PubMed]
- Rosario, D.; Boren, J.; Uhlen, M.; Proctor, G.; Aarsland, D.; Mardinoglu, A.; Shoaie, S. Systems Biology Approaches to Understand the Host–Microbiome Interactions in Neurodegenerative Diseases. Front. Neurosci. 2020, 14, 716. [Google Scholar] [CrossRef] [PubMed]
- Ma, Q.; Xing, C.; Long, W.; Wang, H.Y.; Liu, Q.; Wang, R.-F. Impact of microbiota on central nervous system and neurological diseases: The gut-brain axis. J. Neuroinflamm. 2019, 16, 53. [Google Scholar] [CrossRef]
- Liang, S.; Wu, X.; Jin, F. Gut-Brain Psychology: Rethinking Psychology From the Microbiota–Gut–Brain Axis. Front. Integr. Neurosci. 2018, 12, 33. [Google Scholar] [CrossRef]
- Felice, V.D.; Quigley, E.M.; Sullivan, A.M.; O’Keeffe, G.W.; O’Mahony, S.M. Microbiota-gut-brain signalling in Parkinson’s disease: Implications for non-motor symptoms. Park. Relat. Disord. 2016, 27, 1–8. [Google Scholar] [CrossRef] [PubMed]
- Lin, Y.-T.; Wu, P.-H.; Lee, H.-H.; Mubanga, M.; Chen, C.-S.; Kuo, M.-C.; Chiu, Y.-W.; Kuo, P.-L.; Hwang, S.-J. Indole-3 acetic acid increased risk of impaired cognitive function in patients receiving hemodialysis. NeuroToxicology 2019, 73, 85–91. [Google Scholar] [CrossRef]
- Chen, S.-J.; Lin, C.-H. Gut microenvironmental changes as a potential trigger in Parkinson’s disease through the gut–brain axis. J. Biomed. Sci. 2022, 29, 54. [Google Scholar] [CrossRef]
- Gheorghe, C.E.; Martin, J.A.; Manriquez, F.V.; Dinan, T.G.; Cryan, J.F.; Clarke, G. Focus on the essentials: Tryptophan metabolism and the microbiome-gut-brain axis. Curr. Opin. Pharmacol. 2019, 48, 137–145. [Google Scholar] [CrossRef]
- Protti, M.; Cirrincione, M.; Mandrioli, R.; Rudge, J.; Regazzoni, L.; Valsecchi, V.; Volpi, C.; Mercolini, L. Volumetric Absorptive Microsampling (VAMS) for Targeted LC-MS/MS Determination of Tryptophan-Related Biomarkers. Molecules 2022, 27, 5652. [Google Scholar] [CrossRef]
- Liao, H.-Y.; Wang, C.-Y.; Lee, C.-H.; Kao, H.-L.; Wu, W.-K.; Kuo, C.-H. Development of an Efficient and Sensitive Chemical Derivatization-Based LC–MS/MS Method for Quantifying Gut Microbiota-Derived Metabolites in Human Plasma and Its Application in Studying Cardiovascular Disease. J. Proteome Res. 2021, 20, 3508–3518. [Google Scholar] [CrossRef]
- Cong, M.; Song, J.; Chen, F.; Cao, C.; Wang, S. A surrogate analyte-based LC–MS/MS method for the determination of 5-hydroxytryptamine, kynurenine and tryptophan. Bioanalysis 2020, 12, 129–142. [Google Scholar] [CrossRef] [PubMed]
- Chen, S.-J.; Chen, C.-C.; Liao, H.-Y.; Wu, Y.-W.; Liou, J.-M.; Wu, M.-S.; Kuo, C.-H.; Lin, C.-H. Alteration of Gut Microbial Metabolites in the Systemic Circulation of Patients with Parkinson’s Disease. J. Park. Dis. 2022, 12, 1219–1230. [Google Scholar] [CrossRef] [PubMed]
- Zhou, L.; Yu, D.; Zheng, S.; Ouyang, R.; Wang, Y.; Xu, G. Gut microbiota-related metabolome analysis based on chromatography-mass spectrometry. TrAC Trends Anal. Chem. 2021, 143, 116375. [Google Scholar] [CrossRef]
- Zhou, J.; Yin, Y. Strategies for large-scale targeted metabolomics quantification by liquid chromatography-mass spectrometry. Analyst 2016, 141, 6362–6373. [Google Scholar] [CrossRef]
- Lee, S.Y.; Park, N.-H.; Jeong, E.-K.; Wi, J.-W.; Kim, C.-J.; Kim, J.Y.; In, M.K.; Hong, J. Comparison of GC/MS and LC/MS methods for the analysis of propofol and its metabolites in urine. J. Chromatogr. B 2012, 900, 1–10. [Google Scholar] [CrossRef] [PubMed]
- Chang, K.-H.; Cheng, M.-L.; Tang, H.-Y.; Huang, C.-Y.; Wu, Y.-R.; Chen, C.-M. Alternations of Metabolic Profile and Kynurenine Metabolism in the Plasma of Parkinson’s Disease. Mol. Neurobiol. 2018, 55, 6319–6328. [Google Scholar] [CrossRef]
- Fuertig, R.; Ceci, A.; Camus, S.M.; Bezard, E.; Luippold, A.H.; Hengerer, B.; Da Silva, L.; Collino, S.; Cominetti, O.; Martin, F.-P.; et al. LC–MS/MS-based quantification of kynurenine metabolites, tryptophan, monoamines and neopterin in plasma, cerebrospinal fluid and brain. Bioanalysis 2016, 8, 1903–1917. [Google Scholar] [CrossRef]
- Marcos, J.; Renau, N.; Valverde, O.; Aznar-Laín, G.; Gracia-Rubio, I.; Gonzalez-Sepulveda, M.; Pérez-Jurado, L.A.; Ventura, R.; Segura, J.; Pozo, O.J. Targeting tryptophan and tyrosine metabolism by liquid chromatography tandem mass spectrometry. J. Chromatogr. A 2016, 1434, 91–101. [Google Scholar] [CrossRef] [PubMed]
- Boulet, L.; Faure, P.; Flore, P.; Montérémal, J.; Ducros, V. Simultaneous determination of tryptophan and 8 metabolites in human plasma by liquid chromatography/tandem mass spectrometry. J. Chromatogr. B 2017, 1054, 36–43. [Google Scholar] [CrossRef] [PubMed]
- Huang, Y.; Louie, A.; Yang, Q.; Massenkoff, N.; Xu, C.; Hunt, P.W.; Gee, W.; Wang, W.; Zhuang, X.; Liu, W.; et al. A simple LC–MS/MS method for determination of kynurenine and tryptophan concentrations in human plasma from HIV-infected patients. Bioanalysis 2013, 5, 1397–1407. [Google Scholar] [CrossRef]
- Amirkhani, A.; Heldin, E.; E Markides, K.; Bergquist, J. Quantitation of tryptophan, kynurenine and kynurenic acid in human plasma by capillary liquid chromatography–electrospray ionization tandem mass spectrometry. J. Chromatogr. B 2002, 780, 381–387. [Google Scholar] [CrossRef]
- Zhu, W.; Stevens, A.P.; Dettmer, K.; Gottfried, E.; Hoves, S.; Kreutz, M.; Holler, E.; Canelas, A.B.; Kema, I.; Oefner, P.J. Quantitative profiling of tryptophan metabolites in serum, urine, and cell culture supernatants by liquid chromatography–tandem mass spectrometry. Anal. Bioanal. Chem. 2011, 401, 3249–3261. [Google Scholar] [CrossRef] [PubMed]
- Banerjee, S.; Mazumdar, S. Electrospray Ionization Mass Spectrometry: A Technique to Access the Information beyond the Molecular Weight of the Analyte. Int. J. Anal. Chem. 2012, 2012, 282574. [Google Scholar] [CrossRef]
- Agus, A.; Planchais, J.; Sokol, H. Gut Microbiota Regulation of Tryptophan Metabolism in Health and Disease. Cell Host Microbe 2018, 23, 716–724. [Google Scholar] [CrossRef]
- Kennedy, P.J.; Cryan, J.F.; Dinan, T.G.; Clarke, G. Kynurenine pathway metabolism and the microbiota-gut-brain axis. Neuropharmacology 2017, 112, 399–412. [Google Scholar] [CrossRef]
- O’Mahony, S.M.; Clarke, G.; Borre, Y.E.; Dinan, T.G.; Cryan, J.F. Serotonin, tryptophan metabolism and the brain-gut-microbiome axis. Behav. Brain Res. 2015, 277, 32–48. [Google Scholar] [CrossRef] [PubMed]
- van de Merbel, N.C. Quantitative determination of endogenous compounds in biological samples using chromatographic techniques. TrAC Trends Anal. Chem. 2008, 27, 924–933. [Google Scholar] [CrossRef]
- Zelante, T.; Iannitti, R.G.; Cunha, C.; De Luca, A.; Giovannini, G.; Pieraccini, G.; Zecchi, R.; D’Angelo, C.; Massi-Benedetti, C.; Fallarino, F.; et al. Tryptophan catabolites from microbiota engage aryl hydrocarbon receptor and balance mucosal reactivity via interleukin-22. Immunity 2013, 39, 372–385. [Google Scholar] [CrossRef] [PubMed]
- Connell, E.; Le Gall, G.; Pontifex, M.G.; Sami, S.; Cryan, J.F.; Clarke, G.; Müller, M.; Vauzour, D. Microbial-derived metabolites as a risk factor of age-related cognitive decline and dementia. Mol. Neurodegener. 2022, 17, 43. [Google Scholar] [CrossRef]
- Akahoshi, E.; Yoshimura, S.; Ishihara-Sugano, M. Over-expression of AhR (aryl hydrocarbon receptor) induces neural differentiation of Neuro2a cells: Neurotoxicology study. Environ. Heal. 2006, 5, 24. [Google Scholar] [CrossRef]
- Kim, D.; Kim, H.; Kim, K.; Roh, S. The Protective Effect of Indole-3-Acetic Acid (IAA) on H2O2-Damaged Human Dental Pulp Stem Cells Is Mediated by the AKT Pathway and Involves Increased Expression of the Transcription Factor Nuclear Factor-Erythroid 2-Related Factor 2 (Nrf2) and Its Downstream Target Heme Oxygenase 1 (HO-1). Oxidative Med. Cell. Longev. 2017, 2017, 8639485. [Google Scholar] [CrossRef]
- Galligan, J.J. Beneficial actions of microbiota-derived tryptophan metabolites. Neurogastroenterol. Motil. 2018, 30, e13283. [Google Scholar] [CrossRef]
- Lamas, B.; Natividad, J.M.; Sokol, H. Aryl hydrocarbon receptor and intestinal immunity. Mucosal Immunol. 2018, 11, 1025–1038. [Google Scholar] [CrossRef]
- Lamas, B.; Richard, M.L.; Leducq, V.; Pham, H.-P.; Michel, M.-L.; Da Costa, G.; Bridonneau, C.; Jegou, S.; Hoffmann, T.W.; Natividad, J.M.; et al. CARD9 impacts colitis by altering gut microbiota metabolism of tryptophan into aryl hydrocarbon receptor ligands. Nat. Med. 2016, 22, 598–605. [Google Scholar] [CrossRef]
- Zhao, J.; Chen, H.; Ni, P.; Xu, B.; Luo, X.; Zhan, Y.; Gao, P.; Zhu, D. Simultaneous determination of urinary tryptophan, tryptophan-related metabolites and creatinine by high performance liquid chromatography with ultraviolet and fluorimetric detection. J. Chromatogr. B 2011, 879, 2720–2725. [Google Scholar] [CrossRef] [PubMed]
- Food and Drug Administration. Guidance for Industry: Bioanalytical Method Validation; Food and Drug Administration: Silver Spring, MD, USA, 2018.


| Compound Name | Control Group (n = 20) | Patients with Parkinson’s Disease (n = 41) | p-Value * |
|---|---|---|---|
| 5-Hydroxyl Indole Acetic Acid | 2239.9 ± 1173.3 | 2985.1 ± 1451.1 | 0.06 |
| Melatonin | 4702.5 ± 2794.9 | 3373.2 ± 2685.5 | 0.11 |
| Serotonin | 301.7 ± 290.7 | 299.2 ± 203.5 | 0.55 |
| 5-Hydroxy Tryptophan | 92.1 ± 70.1 | 126.5 ± 68.9 | 0.06 |
| Tryptophan | 40,843.3 ± 16,040.2 | 48,382.3 ± 32,024.7 | 0.55 |
| Indole | 106.3 ± 230.2 | 106.3 ± 151.7 | 0.58 |
| Indole-3-Acetamide | 6.4 ± 28.5 | 2.8 ± 15.0 | 0.97 |
| Tryptamine | 694.3 ± 2903.3 | 1196.0 ± 7545.7 | 0.90 |
| Indole-3-Acetic Acid | 4028.0 ± 3527.9 | 6802.3 ± 5221.9 | 0.03 |
| Indole-3-Aldehyde | 140.8 ± 313.6 | 111.9 ± 160.5 | 0.90 |
| Tryptophol | 13.1 ± 26.9 | 9.2 ± 43.6 | 0.19 |
| Indole-3-Pyruvic Acid | 601.7 ± 400.2 | 996.3 ± 853.6 | 0.11 |
| Indole-3-Lactic Acid | 675.3 ± 444.0 | 563.2 ± 502.8 | 0.24 |
| Indole Acrylic Acid | 42,988.2 ± 16,733.7 | 53,624.8 ± 37,590.9 | 0.42 |
| Indole-3-Propionic Acid | 134.6 ± 348.0 | 9.3 ± 38.8 | 0.29 |
| Kynurenic Acid | 4126.7 ± 2080.4 | 3337.6 ± 2480.7 | 0.13 |
| Xanthurenic acid | 206.9 ± 143.1 | 175.3 ± 122.8 | 0.33 |
| Picolinic acid | 224.0 ± 69.7 | 254.1 ± 115.2 | 0.39 |
| Nicotinic acid | 555.2 ± 226.2 | 706.5 ± 314.2 | 0.06 |
| Kynurenine | 887.1 ± 553.0 | 1049.1 ± 1004.0 | 0.97 |
| 3-Hydroxy Kynurenine | 311.4 ± 142.0 | 424.6 ± 347.6 | 0.69 |
Disclaimer/Publisher’s Note: The statements, opinions and data contained in all publications are solely those of the individual author(s) and contributor(s) and not of MDPI and/or the editor(s). MDPI and/or the editor(s) disclaim responsibility for any injury to people or property resulting from any ideas, methods, instructions or products referred to in the content. |
© 2023 by the authors. Licensee MDPI, Basel, Switzerland. This article is an open access article distributed under the terms and conditions of the Creative Commons Attribution (CC BY) license (https://creativecommons.org/licenses/by/4.0/).
Share and Cite
Chung, S.H.; Yoo, D.; Ahn, T.-B.; Lee, W.; Hong, J. Profiling Analysis of Tryptophan Metabolites in the Urine of Patients with Parkinson’s Disease Using LC–MS/MS. Pharmaceuticals 2023, 16, 1495. https://doi.org/10.3390/ph16101495
Chung SH, Yoo D, Ahn T-B, Lee W, Hong J. Profiling Analysis of Tryptophan Metabolites in the Urine of Patients with Parkinson’s Disease Using LC–MS/MS. Pharmaceuticals. 2023; 16(10):1495. https://doi.org/10.3390/ph16101495
Chicago/Turabian StyleChung, So Hyeon, Dallah Yoo, Tae-Beom Ahn, Wonwoong Lee, and Jongki Hong. 2023. "Profiling Analysis of Tryptophan Metabolites in the Urine of Patients with Parkinson’s Disease Using LC–MS/MS" Pharmaceuticals 16, no. 10: 1495. https://doi.org/10.3390/ph16101495