
Synergistic Antitumoral Effect of Epigenetic Inhibitors and Gemcitabine in Pancreatic Cancer Cells

 ,
,  , , , and
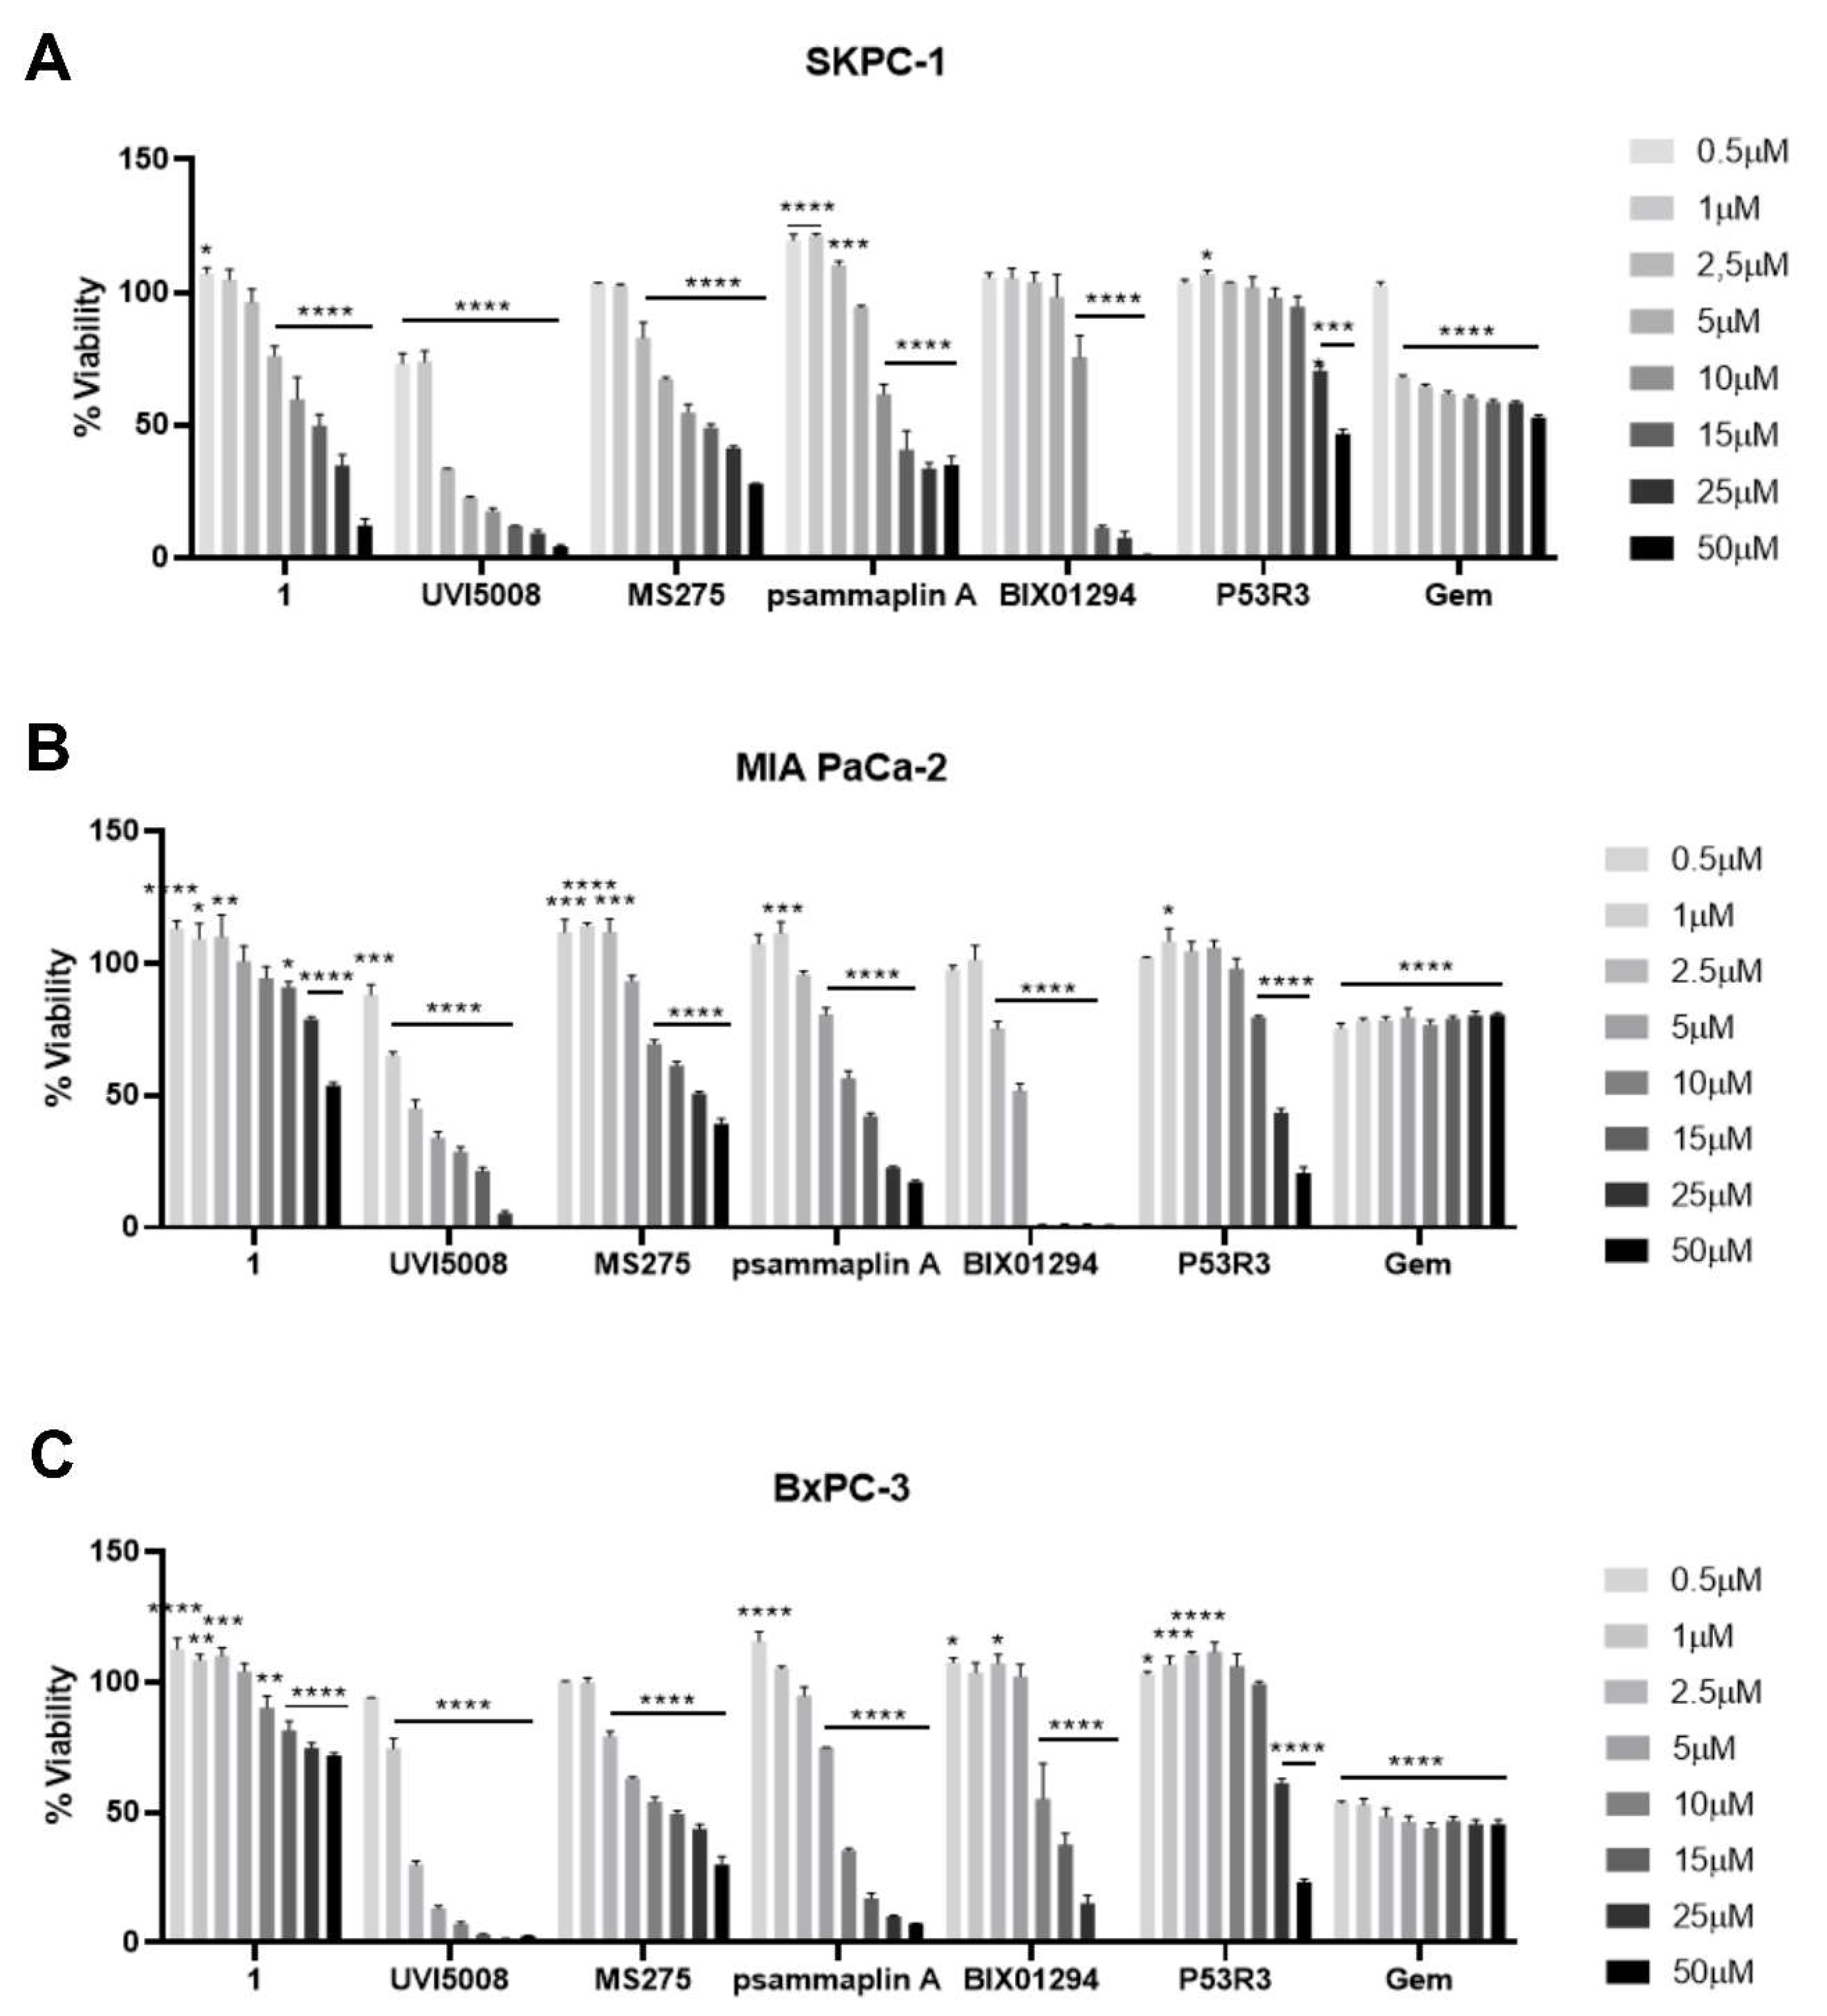
Abstract
:1. Introduction
2. Results and Discussion
2.1. Effect of Epigenetic Inhibitors and P53R3 on the Viability of Three Different Human Pancreatic Cells Lines in 2D Cell Cultures
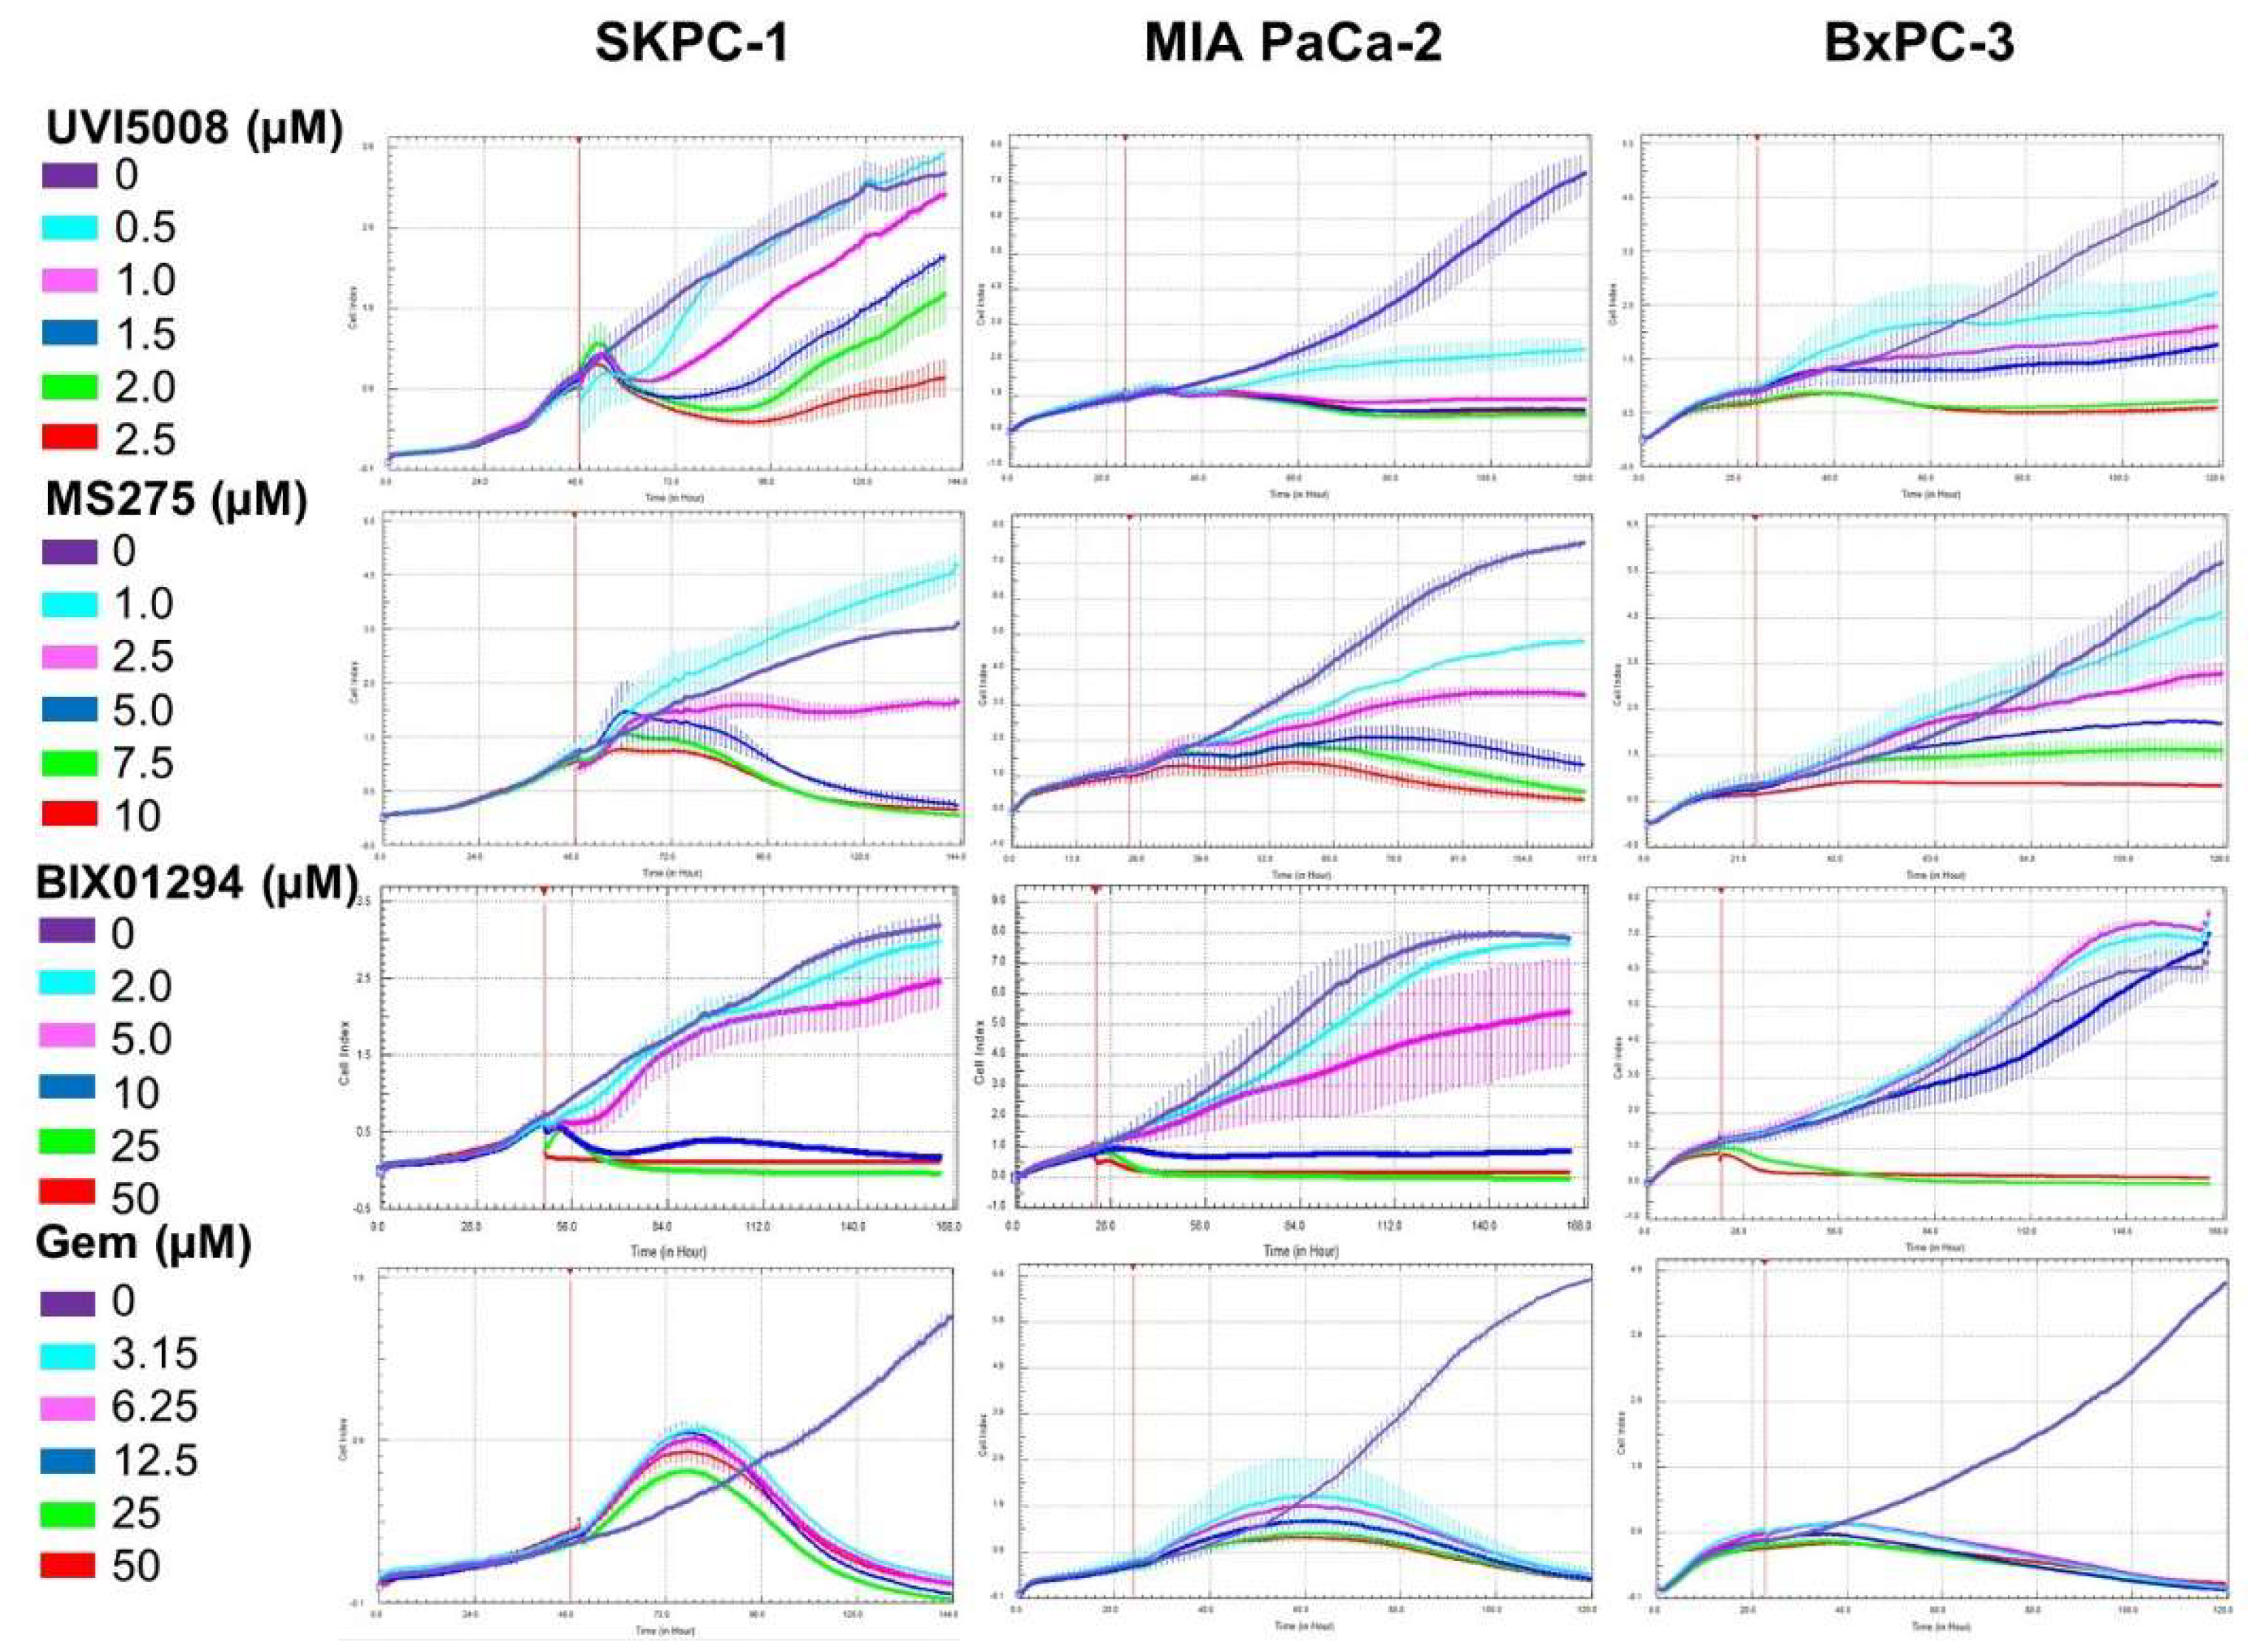
2.2. Kinetic Effect of the Anti-Tumoral Drugs in the Pancreatic Cell Lines
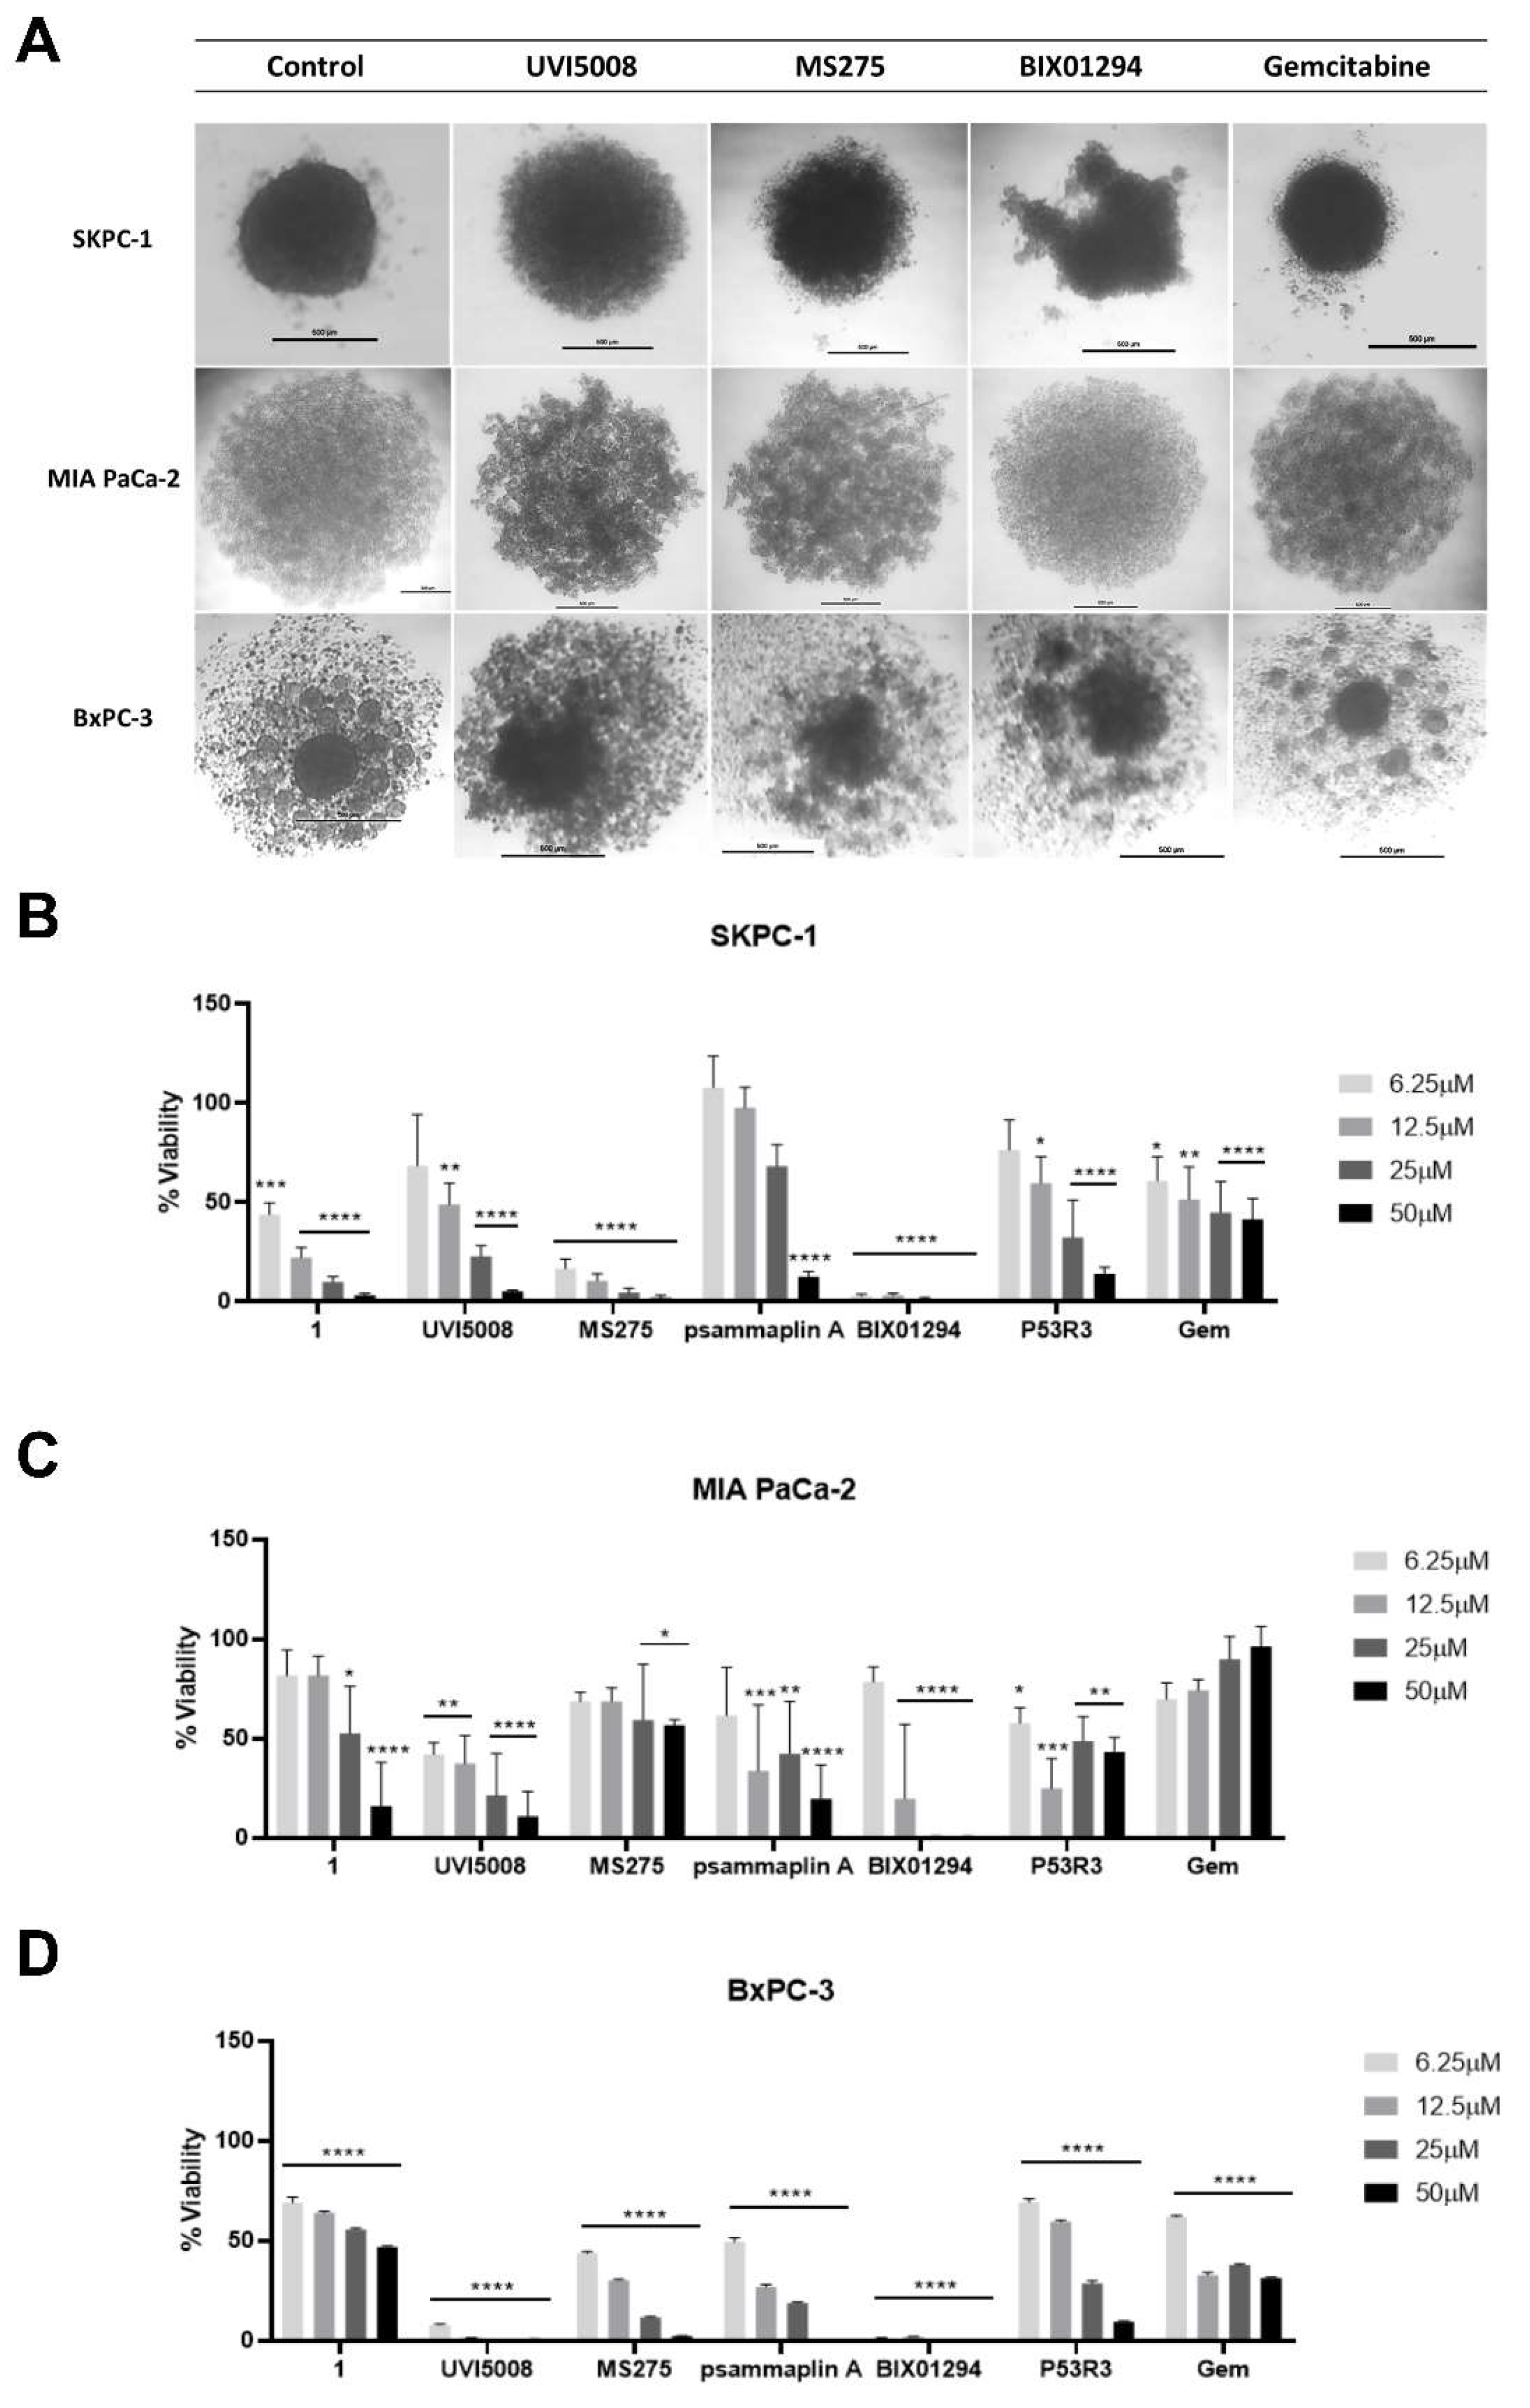
2.3. Effect of the Anti-Tumoral Drugs on 3D Cultures
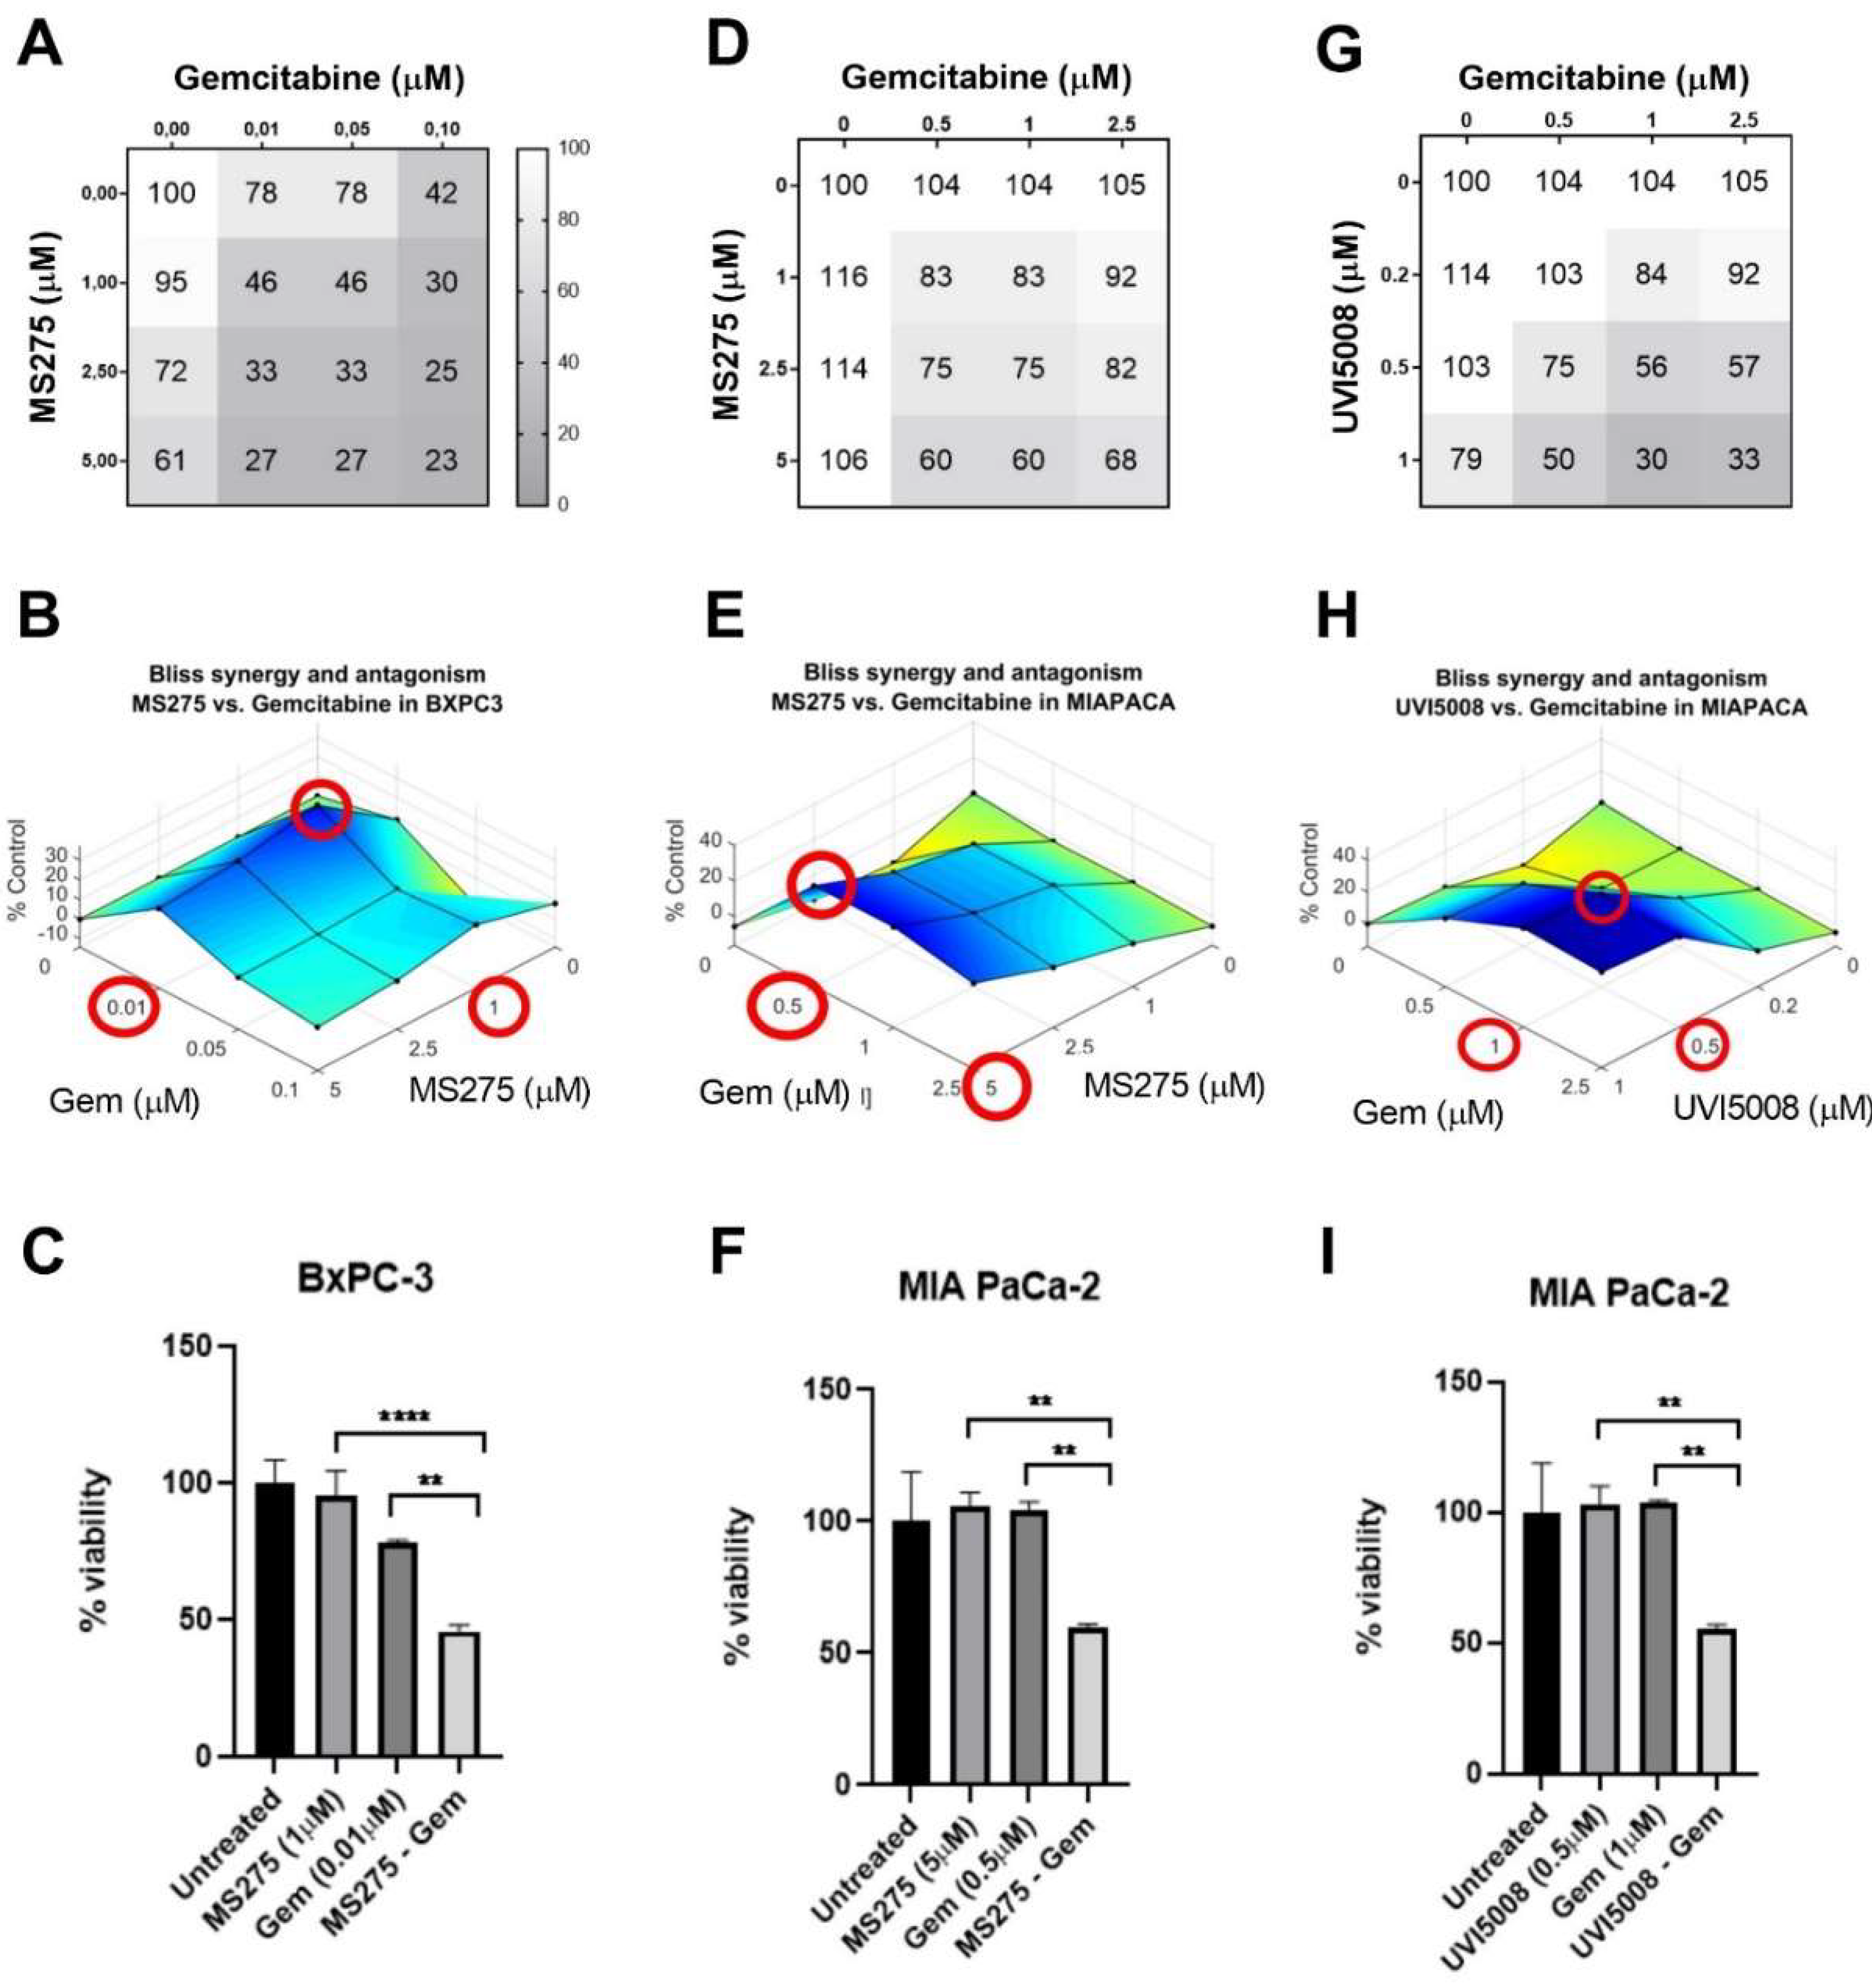
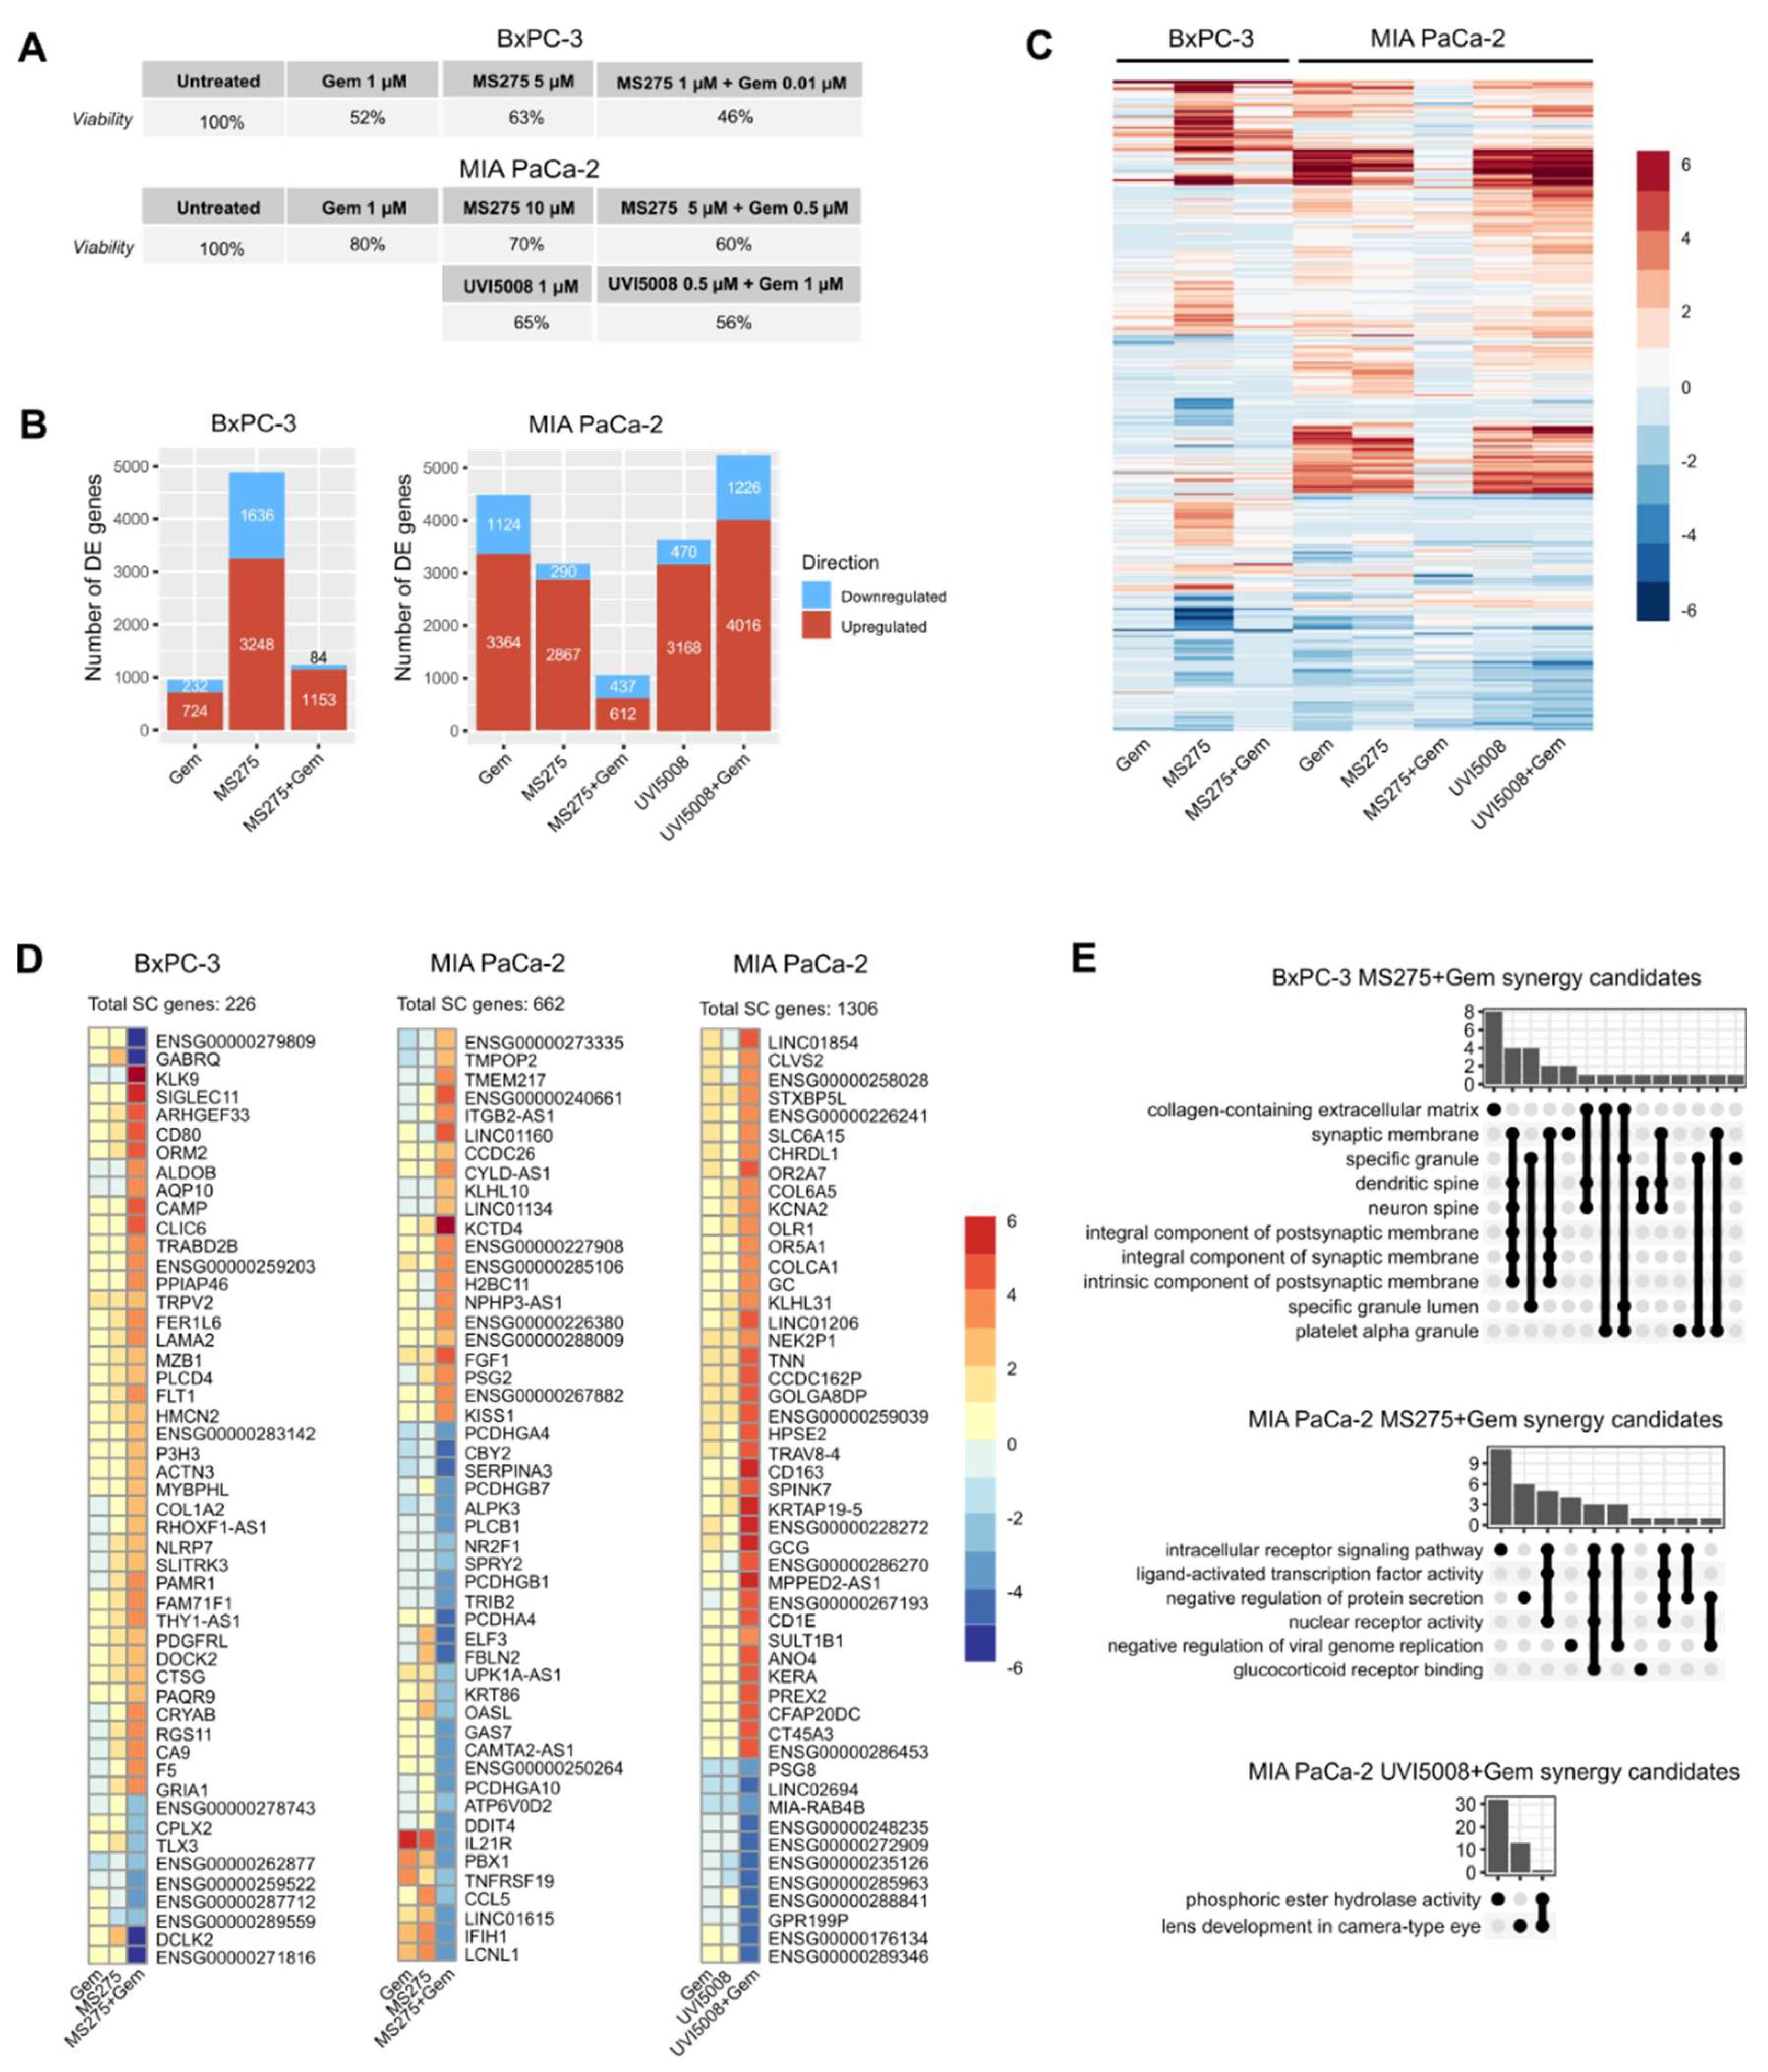
2.4. Synergistic Effect with Gemcitabine
2.5. Hemocompatibility of the Epigenetic Inhibitors
2.6. Transcriptome Analysis Shows Differences in Gene Expression among Treatments and Cell Lines
2.7. Gene Set Enrichment Analysis (GSEA) Differentiates Molecular Patterns among Treatments
2.8. Identification of Unique DE Genes in Combinatory Treatments
2.9. Shared SC Genes between Treatments
2.10. Kaplan–Meier Estimate of SC Genes’ Expression in PDAC Patients
3. Materials and Methods
3.1. Cell Culture
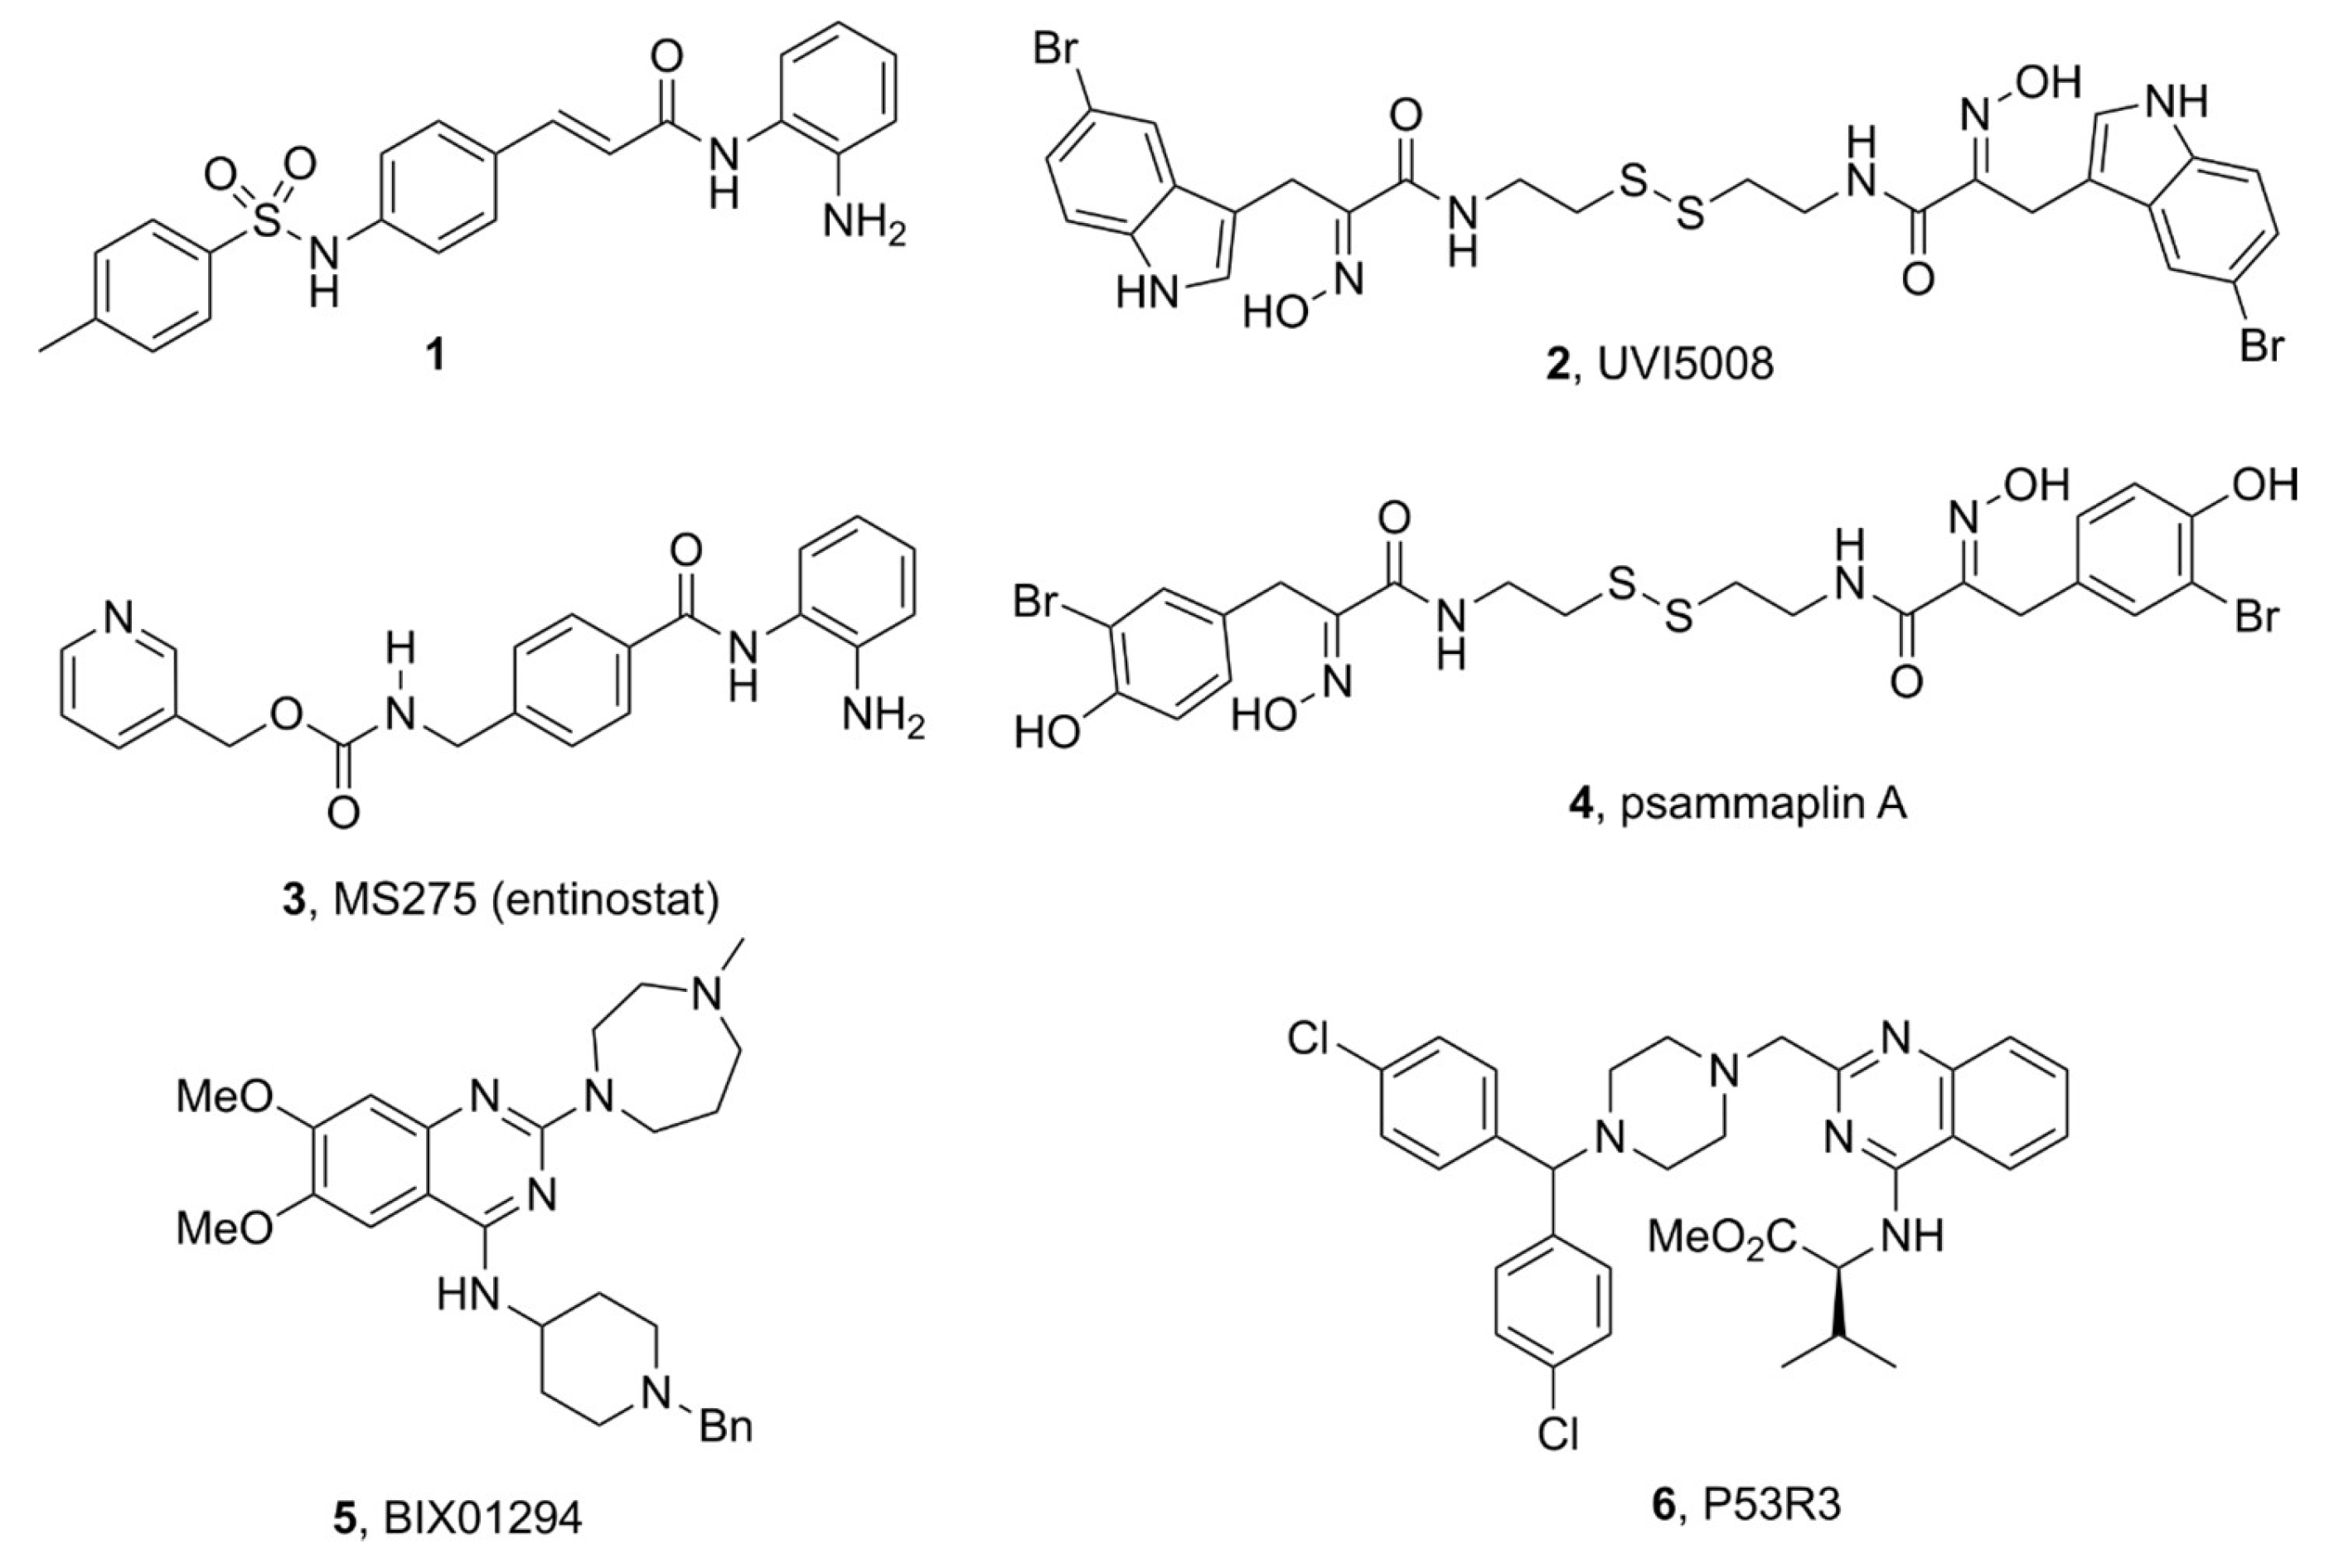
3.2. Anti-Tumoral Drugs
3.3. Cell Viability Assays
3.3.1. MTS Cell Proliferation Assay
3.3.2. xCELLigence Real-Time Cell Analyzer (RTCA)
3.3.3. Spheroid Formation and Cell Viability in 3D Cultures
3.3.4. Synergy Analysis
3.4. Statistical Analysis
3.5. RNA Sequencing
3.6. RNA-Seq Analysis
3.7. Kaplan–Meier Estimates
4. Conclusions
Supplementary Materials
Author Contributions
Funding
Institutional Review Board Statement
Informed Consent Statement
Data Availability Statement
Acknowledgments
Conflicts of Interest
References
- Orth, M.; Metzger, P.; Gerum, S.; Mayerle, J.; Schneider, G.; Belka, C.; Schnurr, M.; Lauber, K. Pancreatic Ductal Adenocarcinoma: Biological Hallmarks, Current Status, and Future Perspectives of Combined Modality Treatment Approaches. Radiat. Oncol. 2019, 14, 141. [Google Scholar] [CrossRef] [PubMed]
- Luo, J. KRAS Mutation in Pancreatic Cancer. Semin. Oncol. 2021, 48, 10–18. [Google Scholar] [CrossRef] [PubMed]
- Storz, P.; Crawford, H.C. Carcinogenesis of Pancreatic Ductal Adenocarcinoma. Gastroenterology 2020, 158, 2072–2081. [Google Scholar] [CrossRef]
- Grant, T.J.; Hua, K.; Singh, A. Molecular Pathogenesis of Pancreatic Cancer. Prog. Mol. Biol. Transl. Sci. 2016, 144, 241–275. [Google Scholar] [CrossRef] [PubMed]
- Indini, A.; Rijavec, E.; Ghidini, M.; Cortellini, A.; Grossi, F. Targeting Kras in Solid Tumors: Current Challenges and Future Opportunities of Novel Kras Inhibitors. Pharmaceutics 2021, 13, 653. [Google Scholar] [CrossRef]
- Ciernikova, S.; Earl, J.; Bermejo, M.L.G.; Stevurkova, V.; Carrato, A.; Smolkova, B. Epigenetic Landscape in Pancreatic Ductal Adenocarcinoma: On the Way to Overcoming Drug Resistance? Int. J. Mol. Sci. 2020, 21, 4091. [Google Scholar] [CrossRef] [PubMed]
- Wu, M.Y.; Shen, M.; Xu, M.D.; Yu, Z.Y.; Tao, M. FOLFIRINOX Regulated Tumor Immune Microenvironment to Extend the Survival of Patients with Resectable Pancreatic Ductal Adenocarcinoma. Gland Surg. 2020, 9, 2125–2135. [Google Scholar] [CrossRef] [PubMed]
- Antignano, F.; Braam, M.; Hughes, M.R.; Chenery, A.L.; Burrows, K.; Gold, M.J.; Oudhoff, M.J.; Rattray, D.; Halim, T.Y.; Cait, A.; et al. G9a Regulates Group 2 Innate Lymphoid Cell Development by Repressing the Group 3 Innate Lymphoid Cell Program. J. Exp. Med. 2016, 213, 1153–1162. [Google Scholar] [CrossRef] [Green Version]
- Koutsounas, I.; Giaginis, C.; Patsouris, E.; Theocharis, S. Current Evidence for Histone Deacetylase Inhibitors in Pancreatic Cancer. World J. Gastroenterol. 2013, 19, 813–828. [Google Scholar] [CrossRef]
- Lomberk, G.A.; Iovanna, J.; Urrutia, R. The Promise of Epigenomic Therapeutics in Pancreatic Cancer. Epigenomics 2016, 8, 831–842. [Google Scholar] [CrossRef] [Green Version]
- García-Morales, P.; Gómez-Martínez, A.; Carrato, A.; Martínez-Lacaci, I.; Barberá, V.M.; Soto, J.L.; Carrasco-García, E.; Menéndez-Gutierrez, M.P.; Castro-Galache, M.D.; Ferragut, J.A.; et al. Histone Deacetylase Inhibitors Induced Caspase-Independent Apoptosis in Human Pancreatic Adenocarcinoma Cell Lines. Mol. Cancer Ther. 2005, 4, 1222–1230. [Google Scholar] [CrossRef] [PubMed] [Green Version]
- Park, J.K.; Ryu, J.K.; Lee, J.K.; Yoon, W.J.; Lee, S.H.; Kim, Y.T.; Yoon, Y.B. Gemcitabine Chemotherapy versus 5-Fluorouracil-Based Concurrent Chemoradiotherapy in Locally Advanced Unresectable Pancreatic Cancer. Pancreas 2006, 33, 397–402. [Google Scholar] [CrossRef] [PubMed] [Green Version]
- Perri, G.; Prakash, L.; Qiao, W.; Varadhachary, G.R.; Wolff, R.; Fogelman, D.; Overman, M.; Pant, S.; Javle, M.; Koay, E.J.; et al. Response and Survival Associated with First-Line FOLFIRINOX vs Gemcitabine and Nab-Paclitaxel Chemotherapy for Localized Pancreatic Ductal Adenocarcinoma. JAMA Surg. 2020, 155, 832–839. [Google Scholar] [CrossRef]
- Hong, S.; Zhang, Y.; Yu, G.; Peng, P.; Peng, J.; Jia, J.; Wu, X.; Huang, Y.; Yang, Y.; Lin, Q.; et al. Gemcitabine Plus Cisplatin Versus Fluorouracil Plus Cisplatin as First-Line Therapy for Recurrent or Metastatic Nasopharyngeal Carcinoma: Final Overall Survival Analysis of GEM20110714 Phase III Study. J. Clin. Oncol. 2021, 39, 3273–3282. [Google Scholar] [CrossRef] [PubMed]
- Maddalena, M.; Mallel, G.; Nataraj, N.B.; Shreberk-Shaked, M.; Hassin, O.; Mukherjee, S.; Arandkar, S.; Rotkopf, R.; Kapsack, A.; Lambiase, G.; et al. TP53 Missense Mutations in PDAC Are Associated with Enhanced Fibrosis and an Immunosuppressive Microenvironment. Proc. Natl. Acad. Sci. USA 2021, 118, e2025631118. [Google Scholar] [CrossRef]
- Bouchain, G.; Leit, S.; Frechette, S.; Abou Khalil, E.; Lavoie, R.; Moradei, O.; Woo, S.H.; Fournel, M.; Yan, P.T.; Kalita, A.; et al. Development of Potential Antitumor Agents. Synthesis and Biological Evaluation of a New Set of Sulfonamide Derivatives as Histone Deacetylase Inhibitors. J. Med. Chem. 2003, 46, 820–830. [Google Scholar] [CrossRef] [PubMed]
- Franci, G.; Folliero, V.; Cammarota, M.; Zannella, C.; Sarno, F.; Schiraldi, C.; de Lera, A.R.; Altucci, L.; Galdiero, M. Epigenetic Modulator UVI5008 Inhibits MRSA by Interfering with Bacterial Gyrase. Sci. Rep. 2018, 8, 13117. [Google Scholar] [CrossRef]
- Nebbioso, A.; Pereira, R.; Khanwalkar, H.; Matarese, F.; García-Rodríguez, J.; Miceli, M.; Logie, C.; Kedinger, V.; Ferrara, F.; Stunnenberg, H.G.; et al. Death Receptor Pathway Activation and Increase of ROS Production by the Triple Epigenetic Inhibitor UVI5008. Mol. Cancer Ther. 2011, 10, 2394–2404. [Google Scholar] [CrossRef] [Green Version]
- Ma, Y.T.; Leonard, S.M.; Gordon, N.; Anderton, J.; James, C.; Huen, D.; Woodman, C.B.; Palmer, D.H. Use of a Genome-Wide Haploid Genetic Screen to Identify Treatment Predicting Factors: A Proof-of-Principle Study in Pancreatic Cancer. Oncotarget 2017, 8, 63635–63645. [Google Scholar] [CrossRef] [Green Version]
- Christmas, B.J.; Rafie, C.I.; Hopkins, A.C.; Scott, B.A.; Ma, H.S.; Cruz, K.A.; Woolman, S.; Armstrong, T.D.; Connolly, R.M.; Azad, N.A.; et al. Entinostat Converts Immune-Resistant Breast and Pancreatic Cancers into Checkpoint-Responsive Tumors by Reprogramming Tumor-Infiltrating MDSCs. Cancer Immunol. Res. 2018, 6, 1561. [Google Scholar] [CrossRef] [Green Version]
- Baud, M.G.J.; Leiser, T.; Haus, P.; Samlal, S.; Wong, A.C.; Wood, R.J.; Petrucci, V.; Gunaratnam, M.; Hughes, S.M.; Buluwela, L.; et al. Defining the Mechanism of Action and Enzymatic Selectivity of Psammaplin A against Its Epigenetic Targets. J. Med. Chem. 2012, 55, 1731–1750. [Google Scholar] [CrossRef] [PubMed]
- García, J.; Franci, G.; Pereira, R.; Benedetti, R.; Nebbioso, A.; Rodríguez-Barrios, F.; Gronemeyer, H.; Altucci, L.; Lera, A.R.D. Epigenetic Profiling of the Antitumor Natural Product Psammaplin A and Its Analogues. Bioorganic Med. Chem. 2011, 19, 3637–3649. [Google Scholar] [CrossRef] [PubMed] [Green Version]
- Jing, Q.; Hu, X.; Ma, Y.; Mu, J.; Liu, W.; Xu, F.; Li, Z.; Bai, J.; Hua, H.; Li, D. Marine-Derived Natural Lead Compound Disulfide-Linked Dimer Psammaplin A: Biological Activity and Structural Modification. Mar. Drugs 2019, 17, 384. [Google Scholar] [CrossRef] [Green Version]
- Kubicek, S.; O’Sullivan, R.J.; August, E.M.; Hickey, E.R.; Zhang, Q.; Teodoro, M.L.L.; Rea, S.; Mechtler, K.; Kowalski, J.A.; Homon, C.A.; et al. Reversal of H3K9me2 by a Small-Molecule Inhibitor for the G9a Histone Methyltransferase. Mol. Cell 2007, 25, 473–481. [Google Scholar] [CrossRef] [PubMed]
- Cho, H.S.; Kelly, J.D.; Hayami, S.; Toyokawa, G.; Takawa, M.; Yoshimatsu, M.; Tsunoda, T.; Field, H.I.; Neal, D.E.; Ponder, B.A.J.; et al. Enhanced Expression of EHMT2 Is Involved in the Proliferation of Cancer Cells through Negative Regulation of SIAH1. Neoplasia 2011, 13, 676–684. [Google Scholar] [CrossRef] [Green Version]
- Wang, Y.F.; Zhang, J.; Su, Y.; Shen, Y.Y.; Jiang, D.X.; Hou, Y.Y.; Geng, M.Y.; Ding, J.; Chen, Y. Author Correction: G9a Regulates Breast Cancer Growth by Modulating Iron Homeostasis through the Repression of Ferroxidase Hephaestin (Nature Communications, (2017), 8, 1, (274), 10.1038/S41467-017-00350-9). Nat. Commun. 2020, 11, 3789. [Google Scholar] [CrossRef] [PubMed]
- Weinmann, L.; Wischhusen, J.; Demma, M.J.; Naumann, U.; Roth, P.; DasMahapatra, B.; Weller, M. A Novel P53 Rescue Compound Induces P53-Dependent Growth Arrest and Sensitises Glioma Cells to Apo2L/TRAIL-Induced Apoptosis. Cell Death Differ. 2008, 15, 718–729. [Google Scholar] [CrossRef]
- Delpu, Y.; Hanoun, N.; Lulka, H.; Sicard, F.; Selves, J.; Buscail, L.; Torrisani, J.; Cordelier, P. Genetic and Epigenetic Alterations in Pancreatic Carcinogenesis. Curr. Genomics 2011, 12, 15. [Google Scholar] [CrossRef] [Green Version]
- Yang, C.; Wang, K.; Liang, Q.; Tian, T.T.; Zhong, Z. Role of NSD1 as Potential Therapeutic Target in Tumor. Pharmacol. Res. 2021, 173, 105888. [Google Scholar] [CrossRef]
- Li, Q.; Wang, L.; Ji, D.; Bao, X.; Tan, G.; Liang, X.; Deng, P.; Pi, H.; Lu, Y.; Chen, C.; et al. BIX-01294, a G9a Inhibitor, Suppresses Cell Proliferation by Inhibiting Autophagic Flux in Nasopharyngeal Carcinoma Cells. Investig. New Drugs 2021, 39, 686–696. [Google Scholar] [CrossRef]
- Wu, G.; Peng, H.; Tang, M.; Yang, M.; Wang, J.; Hu, Y.; Li, Z.; Li, J.; Li, Z.; Song, L. ZNF711 Down-Regulation Promotes CISPLATIN Resistance in Epithelial Ovarian Cancer via Interacting with JHDM2A and Suppressing SLC31A1 Expression. EBioMedicine 2021, 71, 103558. [Google Scholar] [CrossRef] [PubMed]
- Colyn, L.; Bárcena-Varela, M.; Álvarez-Sola, G.; Latasa, M.U.; Uriarte, I.; Santamaría, E.; Herranz, J.M.; Santos-Laso, A.; Arechederra, M.; Ruiz de Gauna, M.; et al. Dual Targeting of G9a and DNA Methyltransferase-1 for the Treatment of Experimental Cholangiocarcinoma. Hepatology 2021, 73, 2380–2396. [Google Scholar] [CrossRef] [PubMed]
- Truong, A.S.; Zhou, M.; Krishnan, B.; Utsumi, T.; Manocha, U.; Stewart, K.G.; Beck, W.; Rose, T.L.; Milowsky, M.I.; He, X.; et al. Entinostat Induces Antitumor Immune Responses through Immune Editing of Tumor Neoantigens. J. Clin. Investig. 2021, 131, e138560. [Google Scholar] [CrossRef] [PubMed]
- Roussos Torres, E.T.; Rafie, C.; Wang, C.; Lim, D.; Brufsky, A.; LoRusso, P.; Eder, J.P.; Chung, V.; Downs, M.; Geare, M.; et al. Phase I Study of Entinostat and Nivolumab with or without Ipilimumab in Advanced Solid Tumors (ETCTN-9844). Clin. Cancer Res. 2021, 27, 5828–5837. [Google Scholar] [CrossRef]
- Connolly, R.M.; Rudek, M.A.; Piekarz, R. Entinostat: A Promising Treatment Option for Patients with Advanced Breast Cancer. Futur. Oncol. 2017, 13, 1137–1148. [Google Scholar] [CrossRef]
- Hicks, K.C.; Chariou, P.L.; Ozawa, Y.; Minnar, C.M.; Knudson, K.M.; Meyer, T.J.; Bian, J.; Cam, M.; Schlom, J.; Gameiro, S.R. Tumour-Targeted Interleukin-12 and Entinostat Combination Therapy Improves Cancer Survival by Reprogramming the Tumour Immune Cell Landscape. Nat. Commun. 2021, 12, 5151. [Google Scholar] [CrossRef]
- Nebbioso, A.; Clarke, N.; Voltz, E.; Germain, E.; Ambrosino, C.; Bontempo, P.; Alvarez, R.; Schiavone, E.M.; Ferrara, F.; Bresciani, F.; et al. Tumor-Selective Action of HDAC Inhibitors Involves TRAIL Induction in Acute Myeloid Leukemia Cells. Nat. Med. 2005, 11, 77–84. [Google Scholar] [CrossRef]
- Navas, C.; Hernández-Porras, I.; Schuhmacher, A.J.; Sibilia, M.; Guerra, C.; Barbacid, M. EGF Receptor Signaling Is Essential for K-Ras Oncogene-Driven Pancreatic Ductal Adenocarcinoma. Cancer Cell 2012, 22, 318–330. [Google Scholar] [CrossRef] [Green Version]
- Bhutia, Y.D.; Hung, S.W.; Patel, B.; Lovin, D.; Govindarajan, R. CNT1 Expression Influences Proliferation and Chemosensitivity in Drug-Resistant Pancreatic Cancer Cells. Cancer Res. 2011, 71, 1825–1835. [Google Scholar] [CrossRef] [Green Version]
- Moore, P.S.; Sipos, B.; Orlandini, S.; Sorio, C.; Real, F.X.; Lemoine, N.R.; Gress, T.; Bassi, C.; Klöppel, G.; Kalthoff, H.; et al. Genetic Profile of 22 Pancreatic Carcinoma Cell Lines. Virchows Arch. 2014, 439, 798–802. [Google Scholar] [CrossRef]
- Sipos, B.; Möser, S.; Kalthoff, H.; Török, V.; Löhr, M.; Klöppel, G. A Comprehensive Characterization of Pancreatic Ductal Carcinoma Cell Lines: Towards the Establishment of an in Vitro Research Platform. Virchows Arch. 2003, 442, 444–452. [Google Scholar] [CrossRef] [PubMed]
- Deer, E.L.; González-Hernández, J.; Coursen, J.D.; Shea, J.E.; Ngatia, J.; Scaife, C.L.; Firpo, M.A.; Mulvihill, S.J. Phenotype and Genotype of Pancreatic Cancer Cell Lines. Pancreas 2010, 39, 425. [Google Scholar] [CrossRef] [Green Version]
- Langhans, S.A. Three-Dimensional in Vitro Cell Culture Models in Drug Discovery and Drug Repositioning. Front. Pharmacol. 2018, 9, 6. [Google Scholar] [CrossRef] [PubMed]
- Cardoso, A.A.; Jiang, Y.; Luo, M.; Reed, A.M.; Shahda, S.; He, Y.; Maitra, A.; Kelley, M.R.; Fishel, M.L. APE1/Ref-1 Regulates STAT3 Transcriptional Activity and APE1/Ref-1-STAT3 Dual-Targeting Effectively Inhibits Pancreatic Cancer Cell Survival. PLoS ONE 2012, 7, e47462. [Google Scholar] [CrossRef] [PubMed]
- Chuang, S.M.; Lee, Y.H.; Liang, R.Y.; Roam, G.D.; Zeng, Z.M.; Tu, H.F.; Wang, S.K.; Chueh, P.J. Extensive Evaluations of the Cytotoxic Effects of Gold Nanoparticles. Biochim. Biophys. Acta Gen. Subj. 2013, 1830, 4960–4973. [Google Scholar] [CrossRef] [PubMed]
- Ware, M.J.; Colbert, K.; Keshishian, V.; Ho, J.; Corr, S.J.; Curley, S.A.; Godin, B. Generation of Homogenous Three-Dimensional Pancreatic Cancer Cell Spheroids Using an Improved Hanging Drop Technique. Tissue Eng. Part C Methods 2016, 22, 312–321. [Google Scholar] [CrossRef] [PubMed] [Green Version]
- Cavo, M.; Delle Cave, D.; D’Amone, E.; Gigli, G.; Lonardo, E.; del Mercato, L.L. A Synergic Approach to Enhance Long-Term Culture and Manipulation of MiaPaCa-2 Pancreatic Cancer Spheroids. Sci. Reports 2020, 10, 1–11. [Google Scholar] [CrossRef] [PubMed]
- Amatangelo, M.D.; Garipov, A.; Li, H.; Conejo-Garcia, J.R.; Speicher, D.W.; Zhang, R. Three-Dimensional Culture Sensitizes Epithelial Ovarian Cancer Cells to EZH2 Methyltransferase Inhibition. Cell Cycle 2013, 12, 2113–2119. [Google Scholar] [CrossRef] [Green Version]
- Fujita-Sato, S.; Galeas, J.; Truitt, M.; Pitt, C.; Urisman, A.; Bandyopadhyay, S.; Ruggero, D.; McCormick, F. Enhanced MET Translation and Signaling Sustains K-Ras-Driven Proliferation under Anchorage-Independent Growth Conditions. Cancer Res. 2015, 75, 2851–2862. [Google Scholar] [CrossRef] [Green Version]
- Wang, P.; Guan, D.; Zhang, X.P.; Liu, F.; Wang, W. Modeling the Regulation of P53 Activation by HIF-1 upon Hypoxia. FEBS Lett. 2019, 593, 2596–2611. [Google Scholar] [CrossRef]
- Lee, H.S.; Park, S.B.; Kim, S.A.; Kwon, S.K.; Cha, H.; Lee, D.Y.; Ro, S.; Cho, J.M.; Song, S.Y. A Novel HDAC Inhibitor, CG200745, Inhibits Pancreatic Cancer Cell Growth and Overcomes Gemcitabine Resistance. Sci. Rep. 2017, 7, 1–9. [Google Scholar] [CrossRef] [PubMed] [Green Version]
- Takehara, A.; Hosokawa, M.; Eguchi, H.; Ohigashi, H.; Ishikawa, O.; Nakamura, Y.; Nakagawa, H. γ-Aminobutyric Acid (GABA) Stimulates Pancreatic Cancer Growth through Overexpressing GABAA Receptor π Subunit. Cancer Res. 2007, 67, 9704–9712. [Google Scholar] [CrossRef] [PubMed] [Green Version]
- Li, Y.H.; Liu, Y.; Li, Y.D.; Liu, Y.H.; Li, F.; Ju, Q.; Xie, P.L.; Li, G.C. GABA Stimulates Human Hepatocellular Carcinoma Growth through over Expressed GABAA Receptor Theta Subunit. World J. Gastroenterol. 2012, 18, 2704–2711. [Google Scholar] [CrossRef] [PubMed]
- Ferguson, F.M.; Nabet, B.; Raghavan, S.; Liu, Y.; Leggett, A.L.; Kuljanin, M.; Kalekar, R.L.; Yang, A.; He, S.; Wang, J.; et al. Discovery of a Selective Inhibitor of Doublecortin like Kinase 1. Nat. Chem. Biol. 2020, 16, 635–643. [Google Scholar] [CrossRef] [PubMed]
- Yousef, G.M.; Kyriakopoulou, L.G.; Scorilas, A.; Fracchioli, S.; Ghiringhello, B.; Zarghooni, M.; Chang, A.; Diamandis, M.; Giardina, G.; Hartwick, W.J.; et al. Quantitative Expression of the Human Kallikrein Gene 9 (KLK9) in Ovarian Cancer: A New Independent and Favorable Prognostic Marker. Cancer Res. 2001, 61, 7811–7818. [Google Scholar]
- Fang, T.; Cui, M.; Sun, J.; Ge, C.; Zhao, F.; Zhang, L.; Tian, H.; Zhang, L.; Chen, T.; Jiang, G.; et al. Orosomucoid 2 Inhibits Tumor Metastasis and Is Upregulated by CCAAT/Enhancer Binding Protein β in Hepatocellular Carcinomas. Oncotarget 2015, 6, 16106–16119. [Google Scholar] [CrossRef] [Green Version]
- Stratford, J.K.; Bentrem, D.J.; Anderson, J.M.; Fan, C.; Volmar, K.A.; Marron, J.S.; Routh, E.D.; Caskey, L.S.; Samuel, J.C.; Der, C.J.; et al. A Six-Gene Signature Predicts Survival of Patients with Localized Pancreatic Ductal Adenocarcinoma. PLoS Med. 2010, 7, e1000307. [Google Scholar] [CrossRef] [Green Version]
- Kuroda, K.; Okumura, K.; Isogai, H.; Isogai, E. The Human Cathelicidin Antimicrobial Peptide LL-37 and Mimics Are Potential Anticancer Drugs. Front. Oncol. 2015, 5, 144. [Google Scholar] [CrossRef] [Green Version]
- Vackova, J.; Polakova, I.; Johari, S.D.; Smahel, M. Cd80 Expression on Tumor Cells Alters Tumor Microenvironment and Efficacy of Cancer Immunotherapy by Ctla-4 Blockade. Cancers 2021, 13, 1935. [Google Scholar] [CrossRef]
- Magouliotis, D.E.; Sakellaridis, N.; Dimas, K.; Tasiopoulou, V.S.; Svokos, K.A.; Svokos, A.A.; Zacharoulis, D. In Silico Transcriptomic Analysis of the Chloride Intracellular Channels (CLIC) Interactome Identifies a Molecular Panel of Seven Prognostic Markers in Patients with Pancreatic Ductal Adenocarcinoma. Curr. Genomics 2020, 21, 119–127. [Google Scholar] [CrossRef]
- Angrisani, A.; Di Fiore, A.; De Smaele, E.; Moretti, M. The Emerging Role of the KCTD Proteins in Cancer. Cell Commun. Signal. 2021, 19, 56. [Google Scholar] [CrossRef]
- Bhattacharyya, S.; Oon, C.; Kothari, A.; Horton, W.; Link, J.; Sears, R.C.; Sherman, M.H. Acidic Fibroblast Growth Factor Underlies Microenvironmental Regulation of Myc in Pancreatic Cancer. J. Exp. Med. 2020, 217, e20191805. [Google Scholar] [CrossRef] [PubMed]
- Adesso, L.; Calabretta, S.; Barbagallo, F.; Capurso, G.; Pilozzi, E.; Geremia, R.; Delle Fave, G.; Sette, C. Gemcitabine Triggers a Pro-Survival Response in Pancreatic Cancer Cells through Activation of the MNK2/EIF4E Pathway. Oncogene 2012, 32, 2848–2857. [Google Scholar] [CrossRef] [PubMed] [Green Version]
- Mahon, F.X.; Hayette, S.; Lagarde, V.; Belloc, F.; Turcq, B.; Nicolini, F.; Belanger, C.; Manley, P.W.; Leroy, C.; Etienne, G.; et al. Evidence That Resistance to Nilotinib May Be Due to BCR-ABL, Pgp, or Src Kinase Overexpression. Cancer Res. 2008, 68, 9809–9816. [Google Scholar] [CrossRef] [PubMed] [Green Version]
- Sun, S.Y.; Rosenberg, L.M.; Wang, X.; Zhou, Z.; Yue, P.; Fu, H.; Khuri, F.R. Activation of Akt and EIF4E Survival Pathways by Rapamycin-Mediated Mammalian Target of Rapamycin Inhibition. Cancer Res. 2005, 65, 7052–7058. [Google Scholar] [CrossRef] [Green Version]
- Choi, M.; Bien, H.; Mofunanya, A.; Powers, S. Challenges in Ras Therapeutics in Pancreatic Cancer. Semin. Cancer Biol. 2019, 54, 101–108. [Google Scholar] [CrossRef]
- Gee, J.M.W.; Shaw, V.E.; Hiscox, S.E.; McClelland, R.A.; Rushmere, N.K.; Nicholson, R.I. Deciphering Antihormone-Induced Compensatory Mechanisms in Breast Cancer and Their Therapeutic Implications. Endocr. Relat. Cancer 2006, 13 (Suppl. 1), S77–S88. [Google Scholar] [CrossRef]
- Huang, H.C.; Mallidi, S.; Liu, J.; Chiang, C.T.; Mai, Z.; Goldschmidt, R.; Ebrahim-Zadeh, N.; Rizvi, I.; Hasan, T. Photodynamic Therapy Synergizes with Irinotecan to Overcome Compensatory Mechanisms and Improve Treatment Outcomes in Pancreatic Cancer. Cancer Res. 2016, 76, 1066–1077. [Google Scholar] [CrossRef] [Green Version]
- Kong, L.; Liu, P.; Zheng, M.; Wang, Z.; Gao, Y.; Liang, K.; Wang, H.; Tan, X. The MiR-1224-5p/Elf3 Axis Regulates Malignant Behaviors of Pancreatic Cancer via Pi3k/Akt/ Notch Signaling Pathways. Onco. Targets. Ther. 2020, 13, 3449–3466. [Google Scholar] [CrossRef] [Green Version]
- Yang, G.D.; Yang, X.M.; Lu, H.; Ren, Y.; Ma, M.Z.; Zhu, L.Y.; Wang, J.H.; Song, W.W.; Zhang, W.M.; Zhang, R.; et al. SERPINA3 Promotes Endometrial Cancer Cells Growth by Regulating G2/M Cell Cycle Checkpoint and Apoptosis. Int. J. Clin. Exp. Pathol. 2014, 7, 1348–1358. [Google Scholar]
- Zhou, J.; Cheng, Y.; Tang, L.; Martinka, M.; Kalia, S. Up-Regulation of SERPINA3 Correlates with High Mortality of Melanoma Patients and Increased Migration and Invasion of Cancer Cells. Oncotarget 2017, 8, 18712–18725. [Google Scholar] [CrossRef] [PubMed] [Green Version]
- Zhang, H.; Hui, D.; Fu, X. Roles of Fibulin-2 in Carcinogenesis. Med. Sci. Monit. 2020, 26, e918099-1–e918099-9. [Google Scholar] [CrossRef] [PubMed]
- Yan, L.; Zhang, J.; Guo, D.; Ma, J.; Shui, S.F.; Han, X.W. IL-21R Functions as an Oncogenic Factor and Is Regulated by the LncRNA MALAT1/MiR-125a-3p Axis in Gastric Cancer. Int. J. Oncol. 2019, 54, 7–16. [Google Scholar] [CrossRef] [PubMed]
- Berx, G.; van Roy, F. Involvement of Members of the Cadherin Superfamily in Cancer. Cold Spring Harb. Perspect. Biol. 2009, 1, a003129. [Google Scholar] [CrossRef] [PubMed]
- Ke, J.; Wu, R.; Chen, Y.; Abba, M.L. Inhibitor of DNA Binding Proteins: Implications in Human Cancer Progression and Metastasis. Am. J. Transl. Res. 2018, 10, 3887–3910. [Google Scholar]
- Langdon, S.P. Estrogen Receptor Signaling in Cancer. Cancers 2020, 116, 2744. [Google Scholar] [CrossRef]
- Zhang, H.; Xu, C.; Shi, C.; Zhang, J.; Qian, T.; Wang, Z.; Ma, R.; Wu, J.; Jiang, F.; Feng, J. Hypermethylation of Heparanase 2 Promotes Colorectal Cancer Proliferation and Is Associated with Poor Prognosis. J. Transl. Med. 2021, 19, 98. [Google Scholar] [CrossRef]
- Zhang, Q.; Wei, T.; Shim, K.; Wright, K.; Xu, K.; Palka-Hamblin, H.L.; Jurkevich, A.; Khare, S. Atypical Role of Sprouty in Colorectal Cancer: Sprouty Repression Inhibits Epithelial-Mesenchymal Transition. Oncogene 2016, 35, 3151–3162. [Google Scholar] [CrossRef] [Green Version]
- Huang, C.; Du, R.; Jia, X.; Liu, K.; Qiao, Y.; Wu, Q.; Yao, N.; Yang, L.; Zhou, L.; Liu, X.; et al. CDK15 Promotes Colorectal Cancer Progression via Phosphorylating PAK4 and Regulating β-Catenin/ MEK-ERK Signaling Pathway. Cell Death Differ. 2022, 29, 14–27. [Google Scholar] [CrossRef]
- Mendez, M.G.; Kojima, S.; Goldman, R.D. Vimentin Induces Changes in Cell Shape, Motility, and Adhesion during the Epithelial to Mesenchymal Transition. FASEB J. 2010, 24, 1838–1851. [Google Scholar] [CrossRef] [Green Version]
- Contardi, E.; Palmisano, G.L.; Tazzari, P.L.; Martelli, A.M.; Falà, F.; Fabbi, M.; Kato, T.; Lucarelli, E.; Donati, D.; Polito, L.; et al. CTLA-4 Is Constitutively Expressed on Tumor Cells and Can Trigger Apoptosis upon Ligand Interaction. Int. J. Cancer 2005, 117, 538–550. [Google Scholar] [CrossRef] [PubMed]
- Qiu, C.; Bu, X.; Jiang, Z. Protocadherin-10 Acts as a Tumor Suppressor Gene, and Is Frequently Downregulated by Promoter Methylation in Pancreatic Cancer Cells. Oncol. Rep. 2016, 36, 383–389. [Google Scholar] [CrossRef] [PubMed] [Green Version]
- Yagi, M.; Kabata, M.; Tanaka, A.; Ukai, T.; Ohta, S.; Nakabayashi, K.; Shimizu, M.; Hata, K.; Meissner, A.; Yamamoto, T.; et al. Identification of Distinct Loci for de Novo DNA Methylation by DNMT3A and DNMT3B during Mammalian Development. Nat. Commun. 2020, 11, 1–14. [Google Scholar] [CrossRef] [PubMed]
- Di Veroli, G.Y.; Fornari, C.; Wang, D.; Mollard, S.; Bramhall, J.L.; Richards, F.M.; Jodrell, D.I. Combenefit: An Interactive Platform for the Analysis and Visualization of Drug Combinations. Bioinformatics 2016, 32, 2866–2868. [Google Scholar] [CrossRef] [PubMed]
- Kashif, M.; Andersson, C.; Mansoori, S.; Larsson, R.; Nygren, P.; Gustafsson, M.G. Bliss and Loewe Interaction Analyses of Clinically Relevant Drug Combinations in Human Colon Cancer Cell Lines Reveal Complex Patterns of Synergy and Antagonism. Oncotarget 2017, 8, 103952–103967. [Google Scholar] [CrossRef] [Green Version]
- Chou, T.-C.; Talalay, P. Generalized Equations for the Analysis of Inhibitions of Michaelis-Menten and Higher-Order Kinetic Systems with Two or More Mutually Exclusive and Nonexclusive Inhibitors. Eur. J. Biochem. 1981, 115, 207–216. [Google Scholar] [CrossRef]
- Stephens, M. False Discovery Rates: A New Deal. Biostatistics 2017, 18, 275–294. [Google Scholar] [CrossRef] [Green Version]
- Yu, G.; Wang, L.G.; Han, Y.; He, Q.Y. ClusterProfiler: An R Package for Comparing Biological Themes among Gene Clusters. Omi. A J. Integr. Biol. 2012, 16, 284–287. [Google Scholar] [CrossRef]
- Wu, T.; Hu, E.; Xu, S.; Chen, M.; Guo, P.; Dai, Z.; Feng, T.; Zhou, L.; Tang, W.; Zhan, L.; et al. ClusterProfiler 4.0: A Universal Enrichment Tool for Interpreting Omics Data. Innovation 2021, 2, 100141. [Google Scholar] [CrossRef]
- Nagy, Á.; Munkácsy, G.; Győrffy, B. Pancancer survival analysis of cancer hallmark genes. Sci Rep. 2021, 11, 6047. [Google Scholar] [CrossRef]


Publisher’s Note: MDPI stays neutral with regard to jurisdictional claims in published maps and institutional affiliations. |
© 2022 by the authors. Licensee MDPI, Basel, Switzerland. This article is an open access article distributed under the terms and conditions of the Creative Commons Attribution (CC BY) license (https://creativecommons.org/licenses/by/4.0/).
Share and Cite
Maietta, I.; Martínez-Pérez, A.; Álvarez, R.; De Lera, Á.R.; González-Fernández, Á.; Simón-Vázquez, R. Synergistic Antitumoral Effect of Epigenetic Inhibitors and Gemcitabine in Pancreatic Cancer Cells. Pharmaceuticals 2022, 15, 824. https://doi.org/10.3390/ph15070824
Maietta I, Martínez-Pérez A, Álvarez R, De Lera ÁR, González-Fernández Á, Simón-Vázquez R. Synergistic Antitumoral Effect of Epigenetic Inhibitors and Gemcitabine in Pancreatic Cancer Cells. Pharmaceuticals. 2022; 15(7):824. https://doi.org/10.3390/ph15070824
Chicago/Turabian StyleMaietta, Immacolata, Amparo Martínez-Pérez, Rosana Álvarez, Ángel R. De Lera, África González-Fernández, and Rosana Simón-Vázquez. 2022. "Synergistic Antitumoral Effect of Epigenetic Inhibitors and Gemcitabine in Pancreatic Cancer Cells" Pharmaceuticals 15, no. 7: 824. https://doi.org/10.3390/ph15070824