
Model-Based Prediction of Acid Suppression and Proposal of a New Dosing Regimen of Fexuprazan in Humans

 , ,
, ,
Abstract
:1. Introduction
2. Materials and Methods
2.1. Pharmacokinetic Analysis
2.1.1. Moment Analysis
2.1.2. One-Compartment Model
2.1.3. Physiologically Based Pharmacokinetic (PBPK) Model
2.2. Pharmacodynamic Analysis
2.2.1. Indirect Response Model
2.2.2. Simple Direct Effect Model
2.3. Pharmacokinetic–Pharmacodynamic Modeling
2.4. Statistics
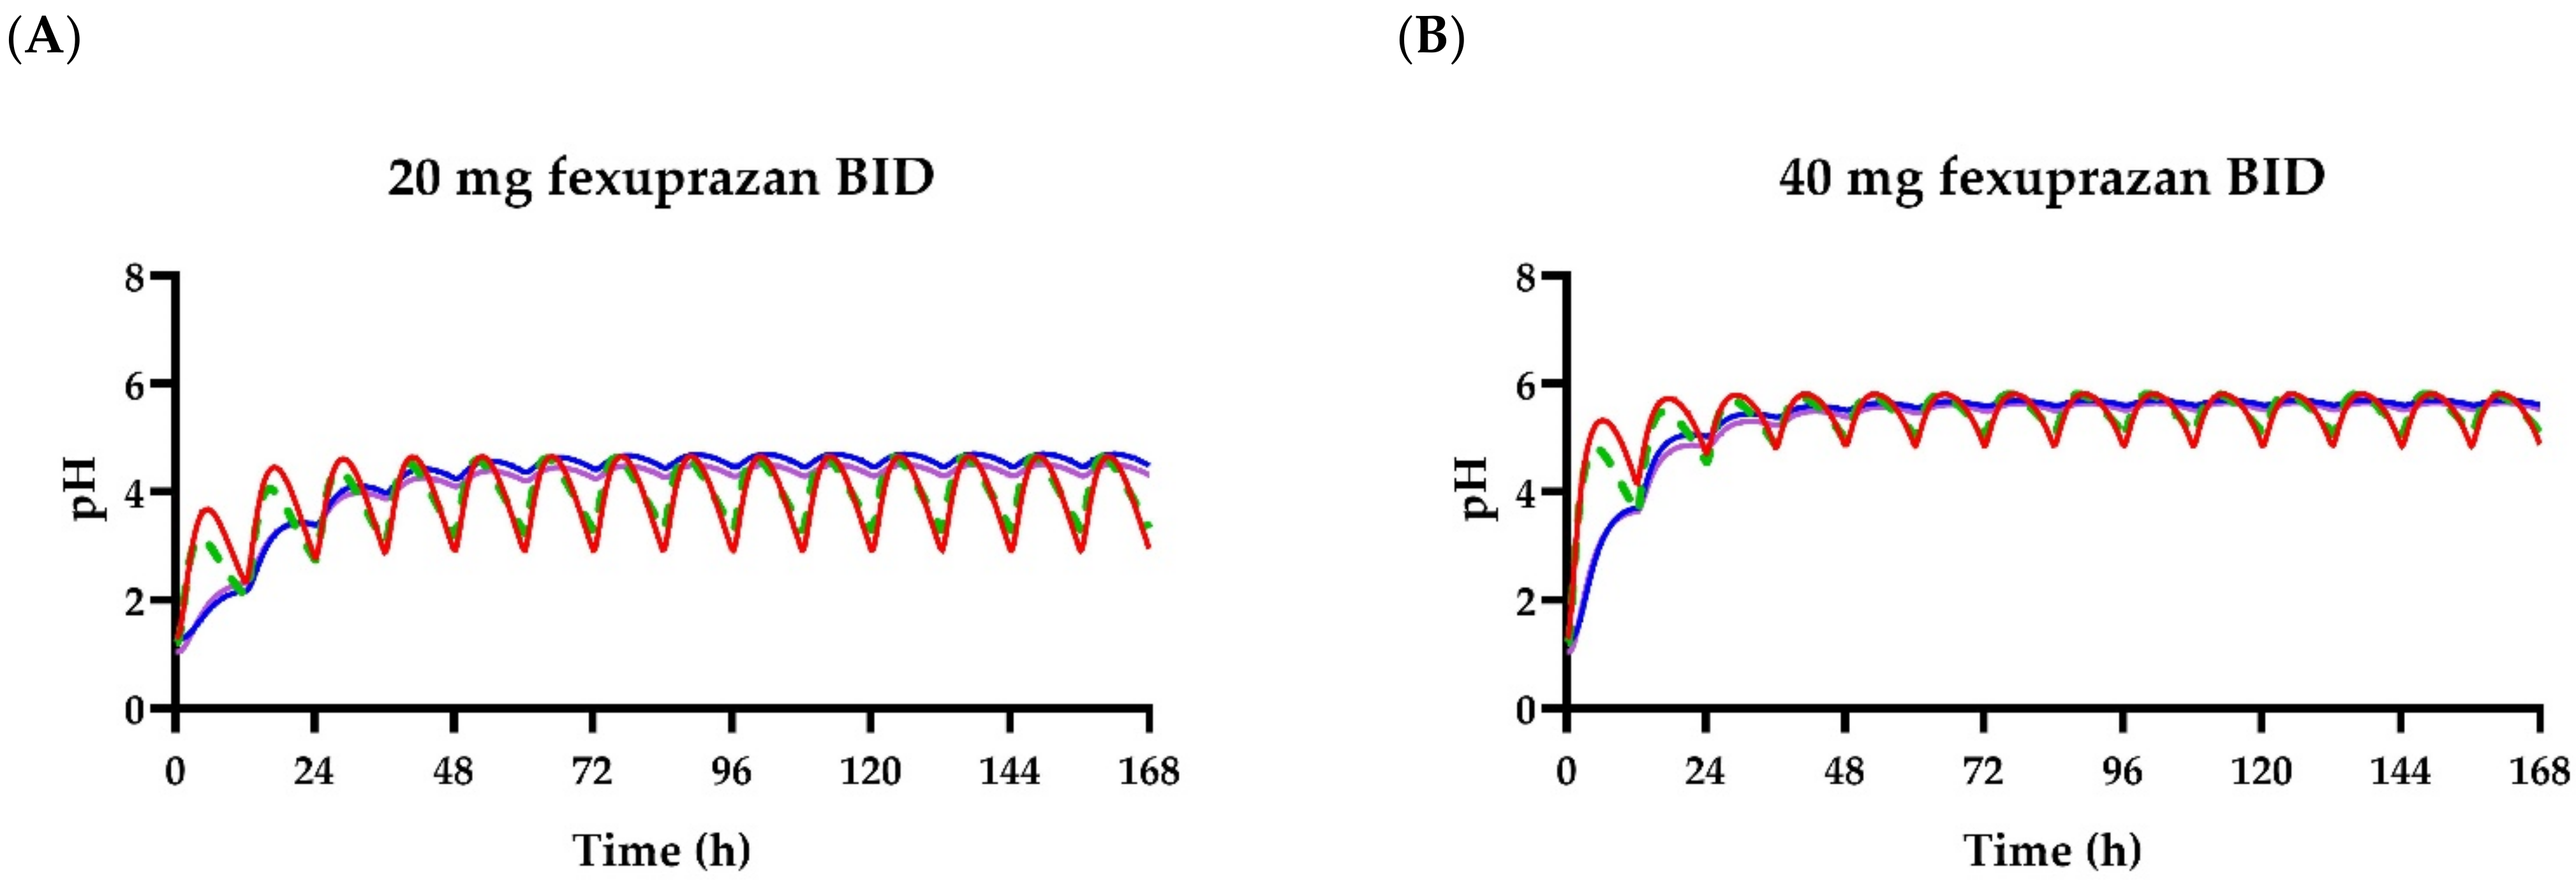
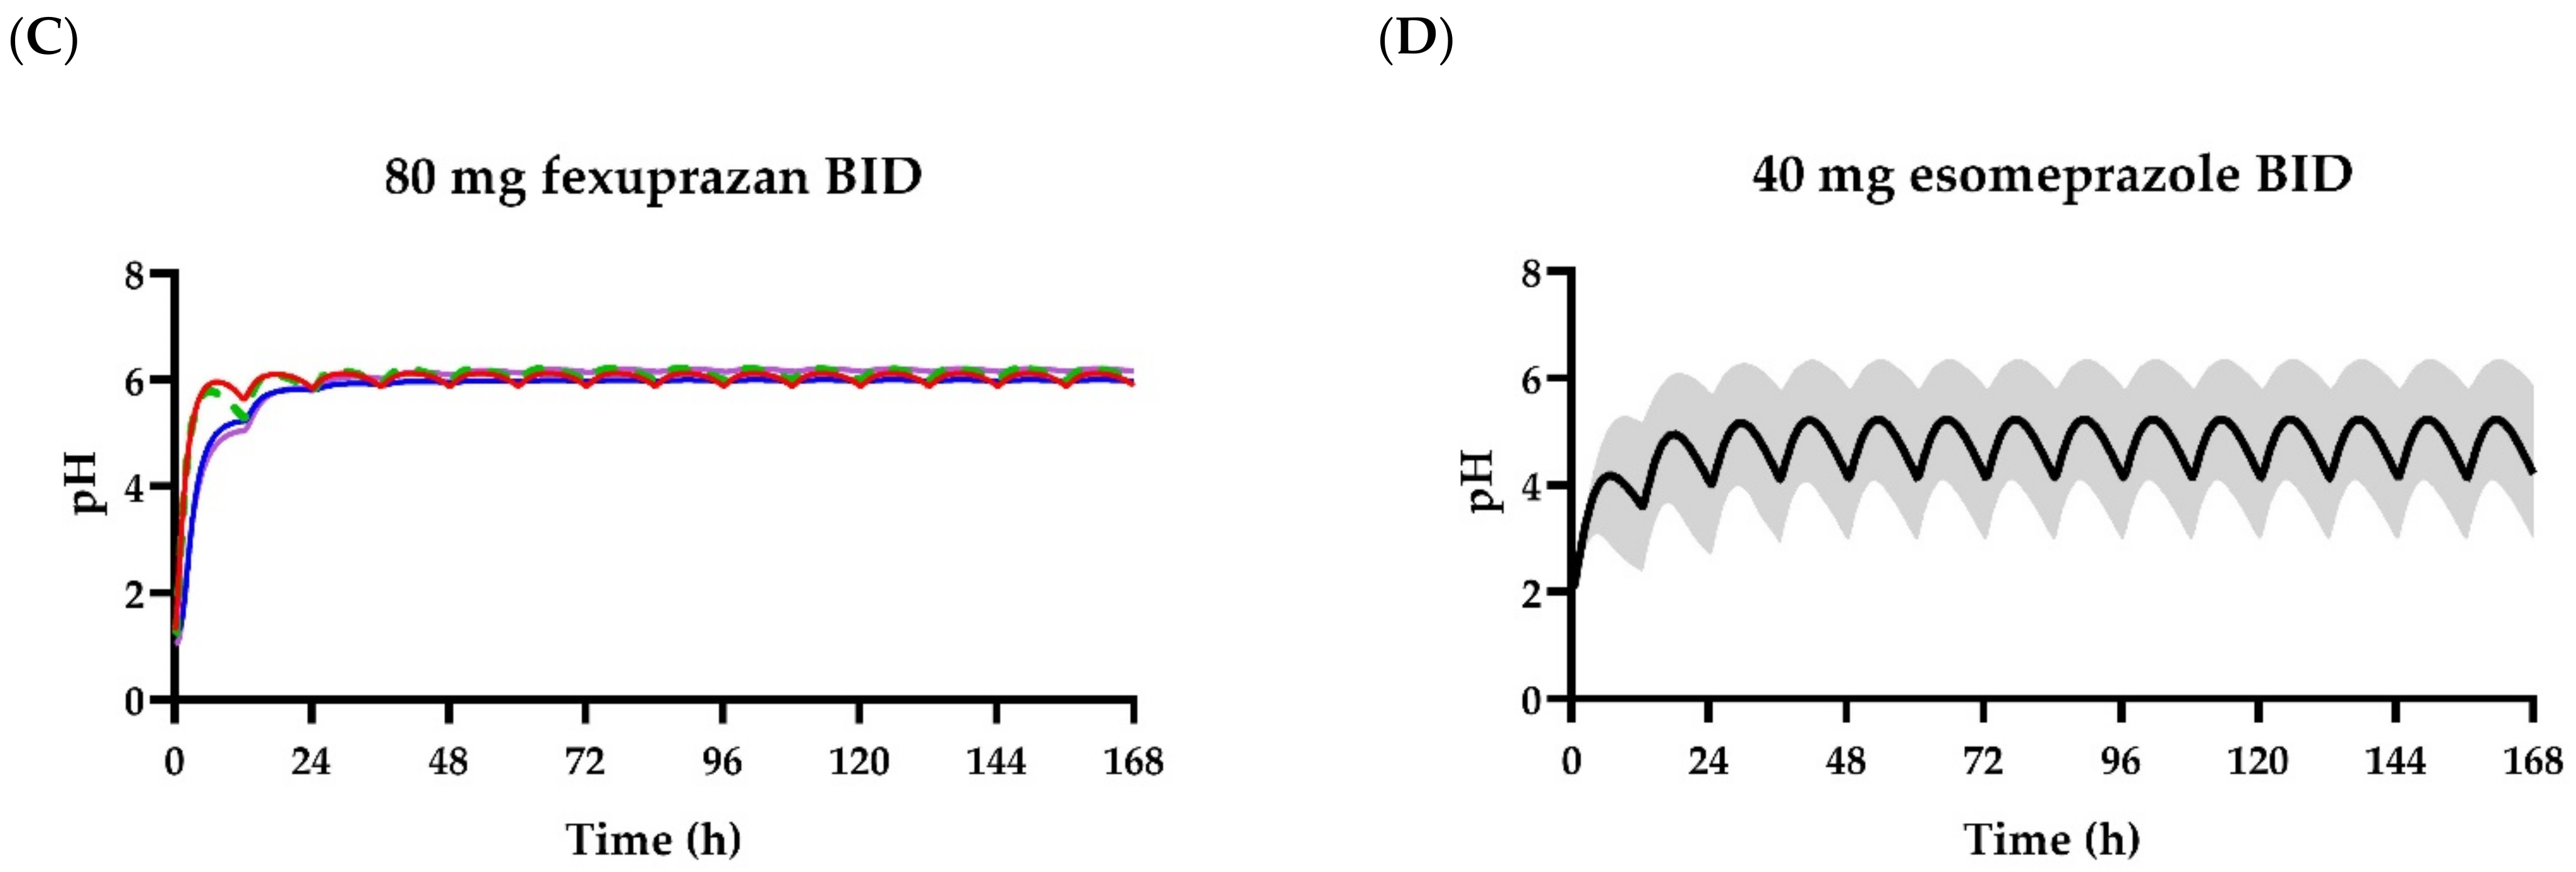
3. Results
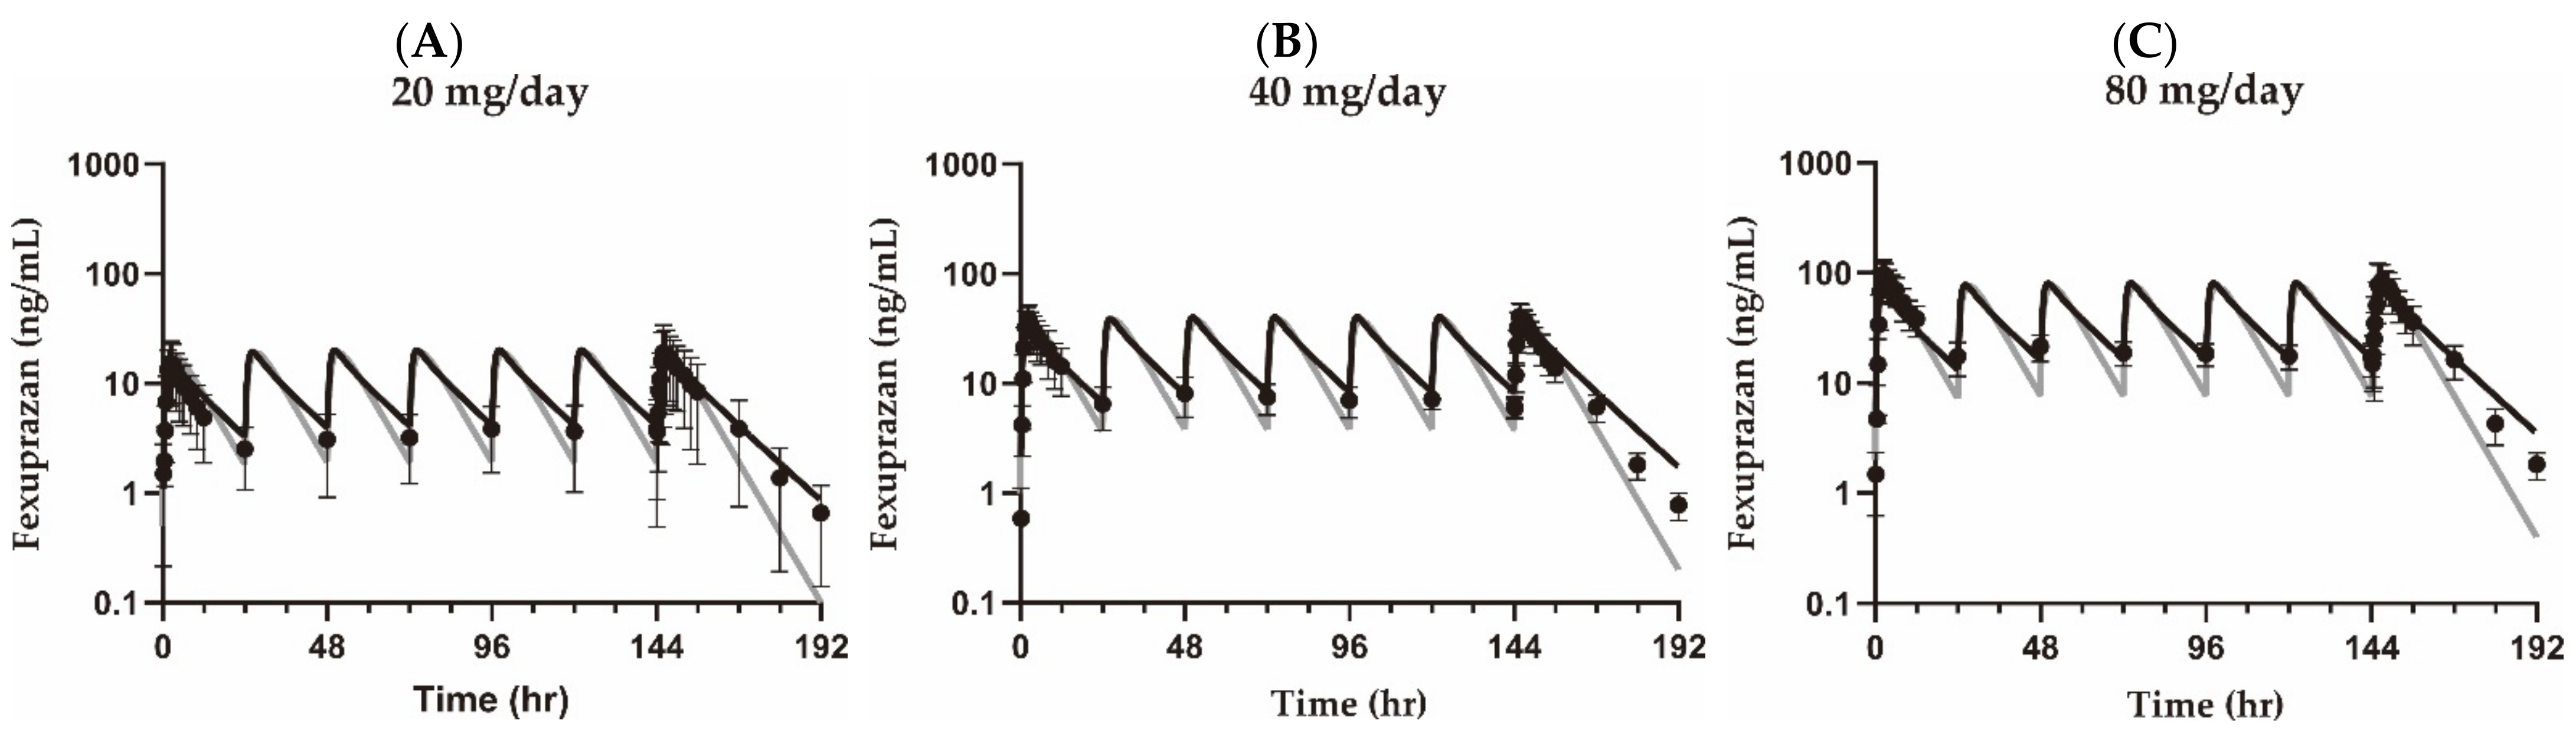
3.1. Pharmacokinetic Analysis
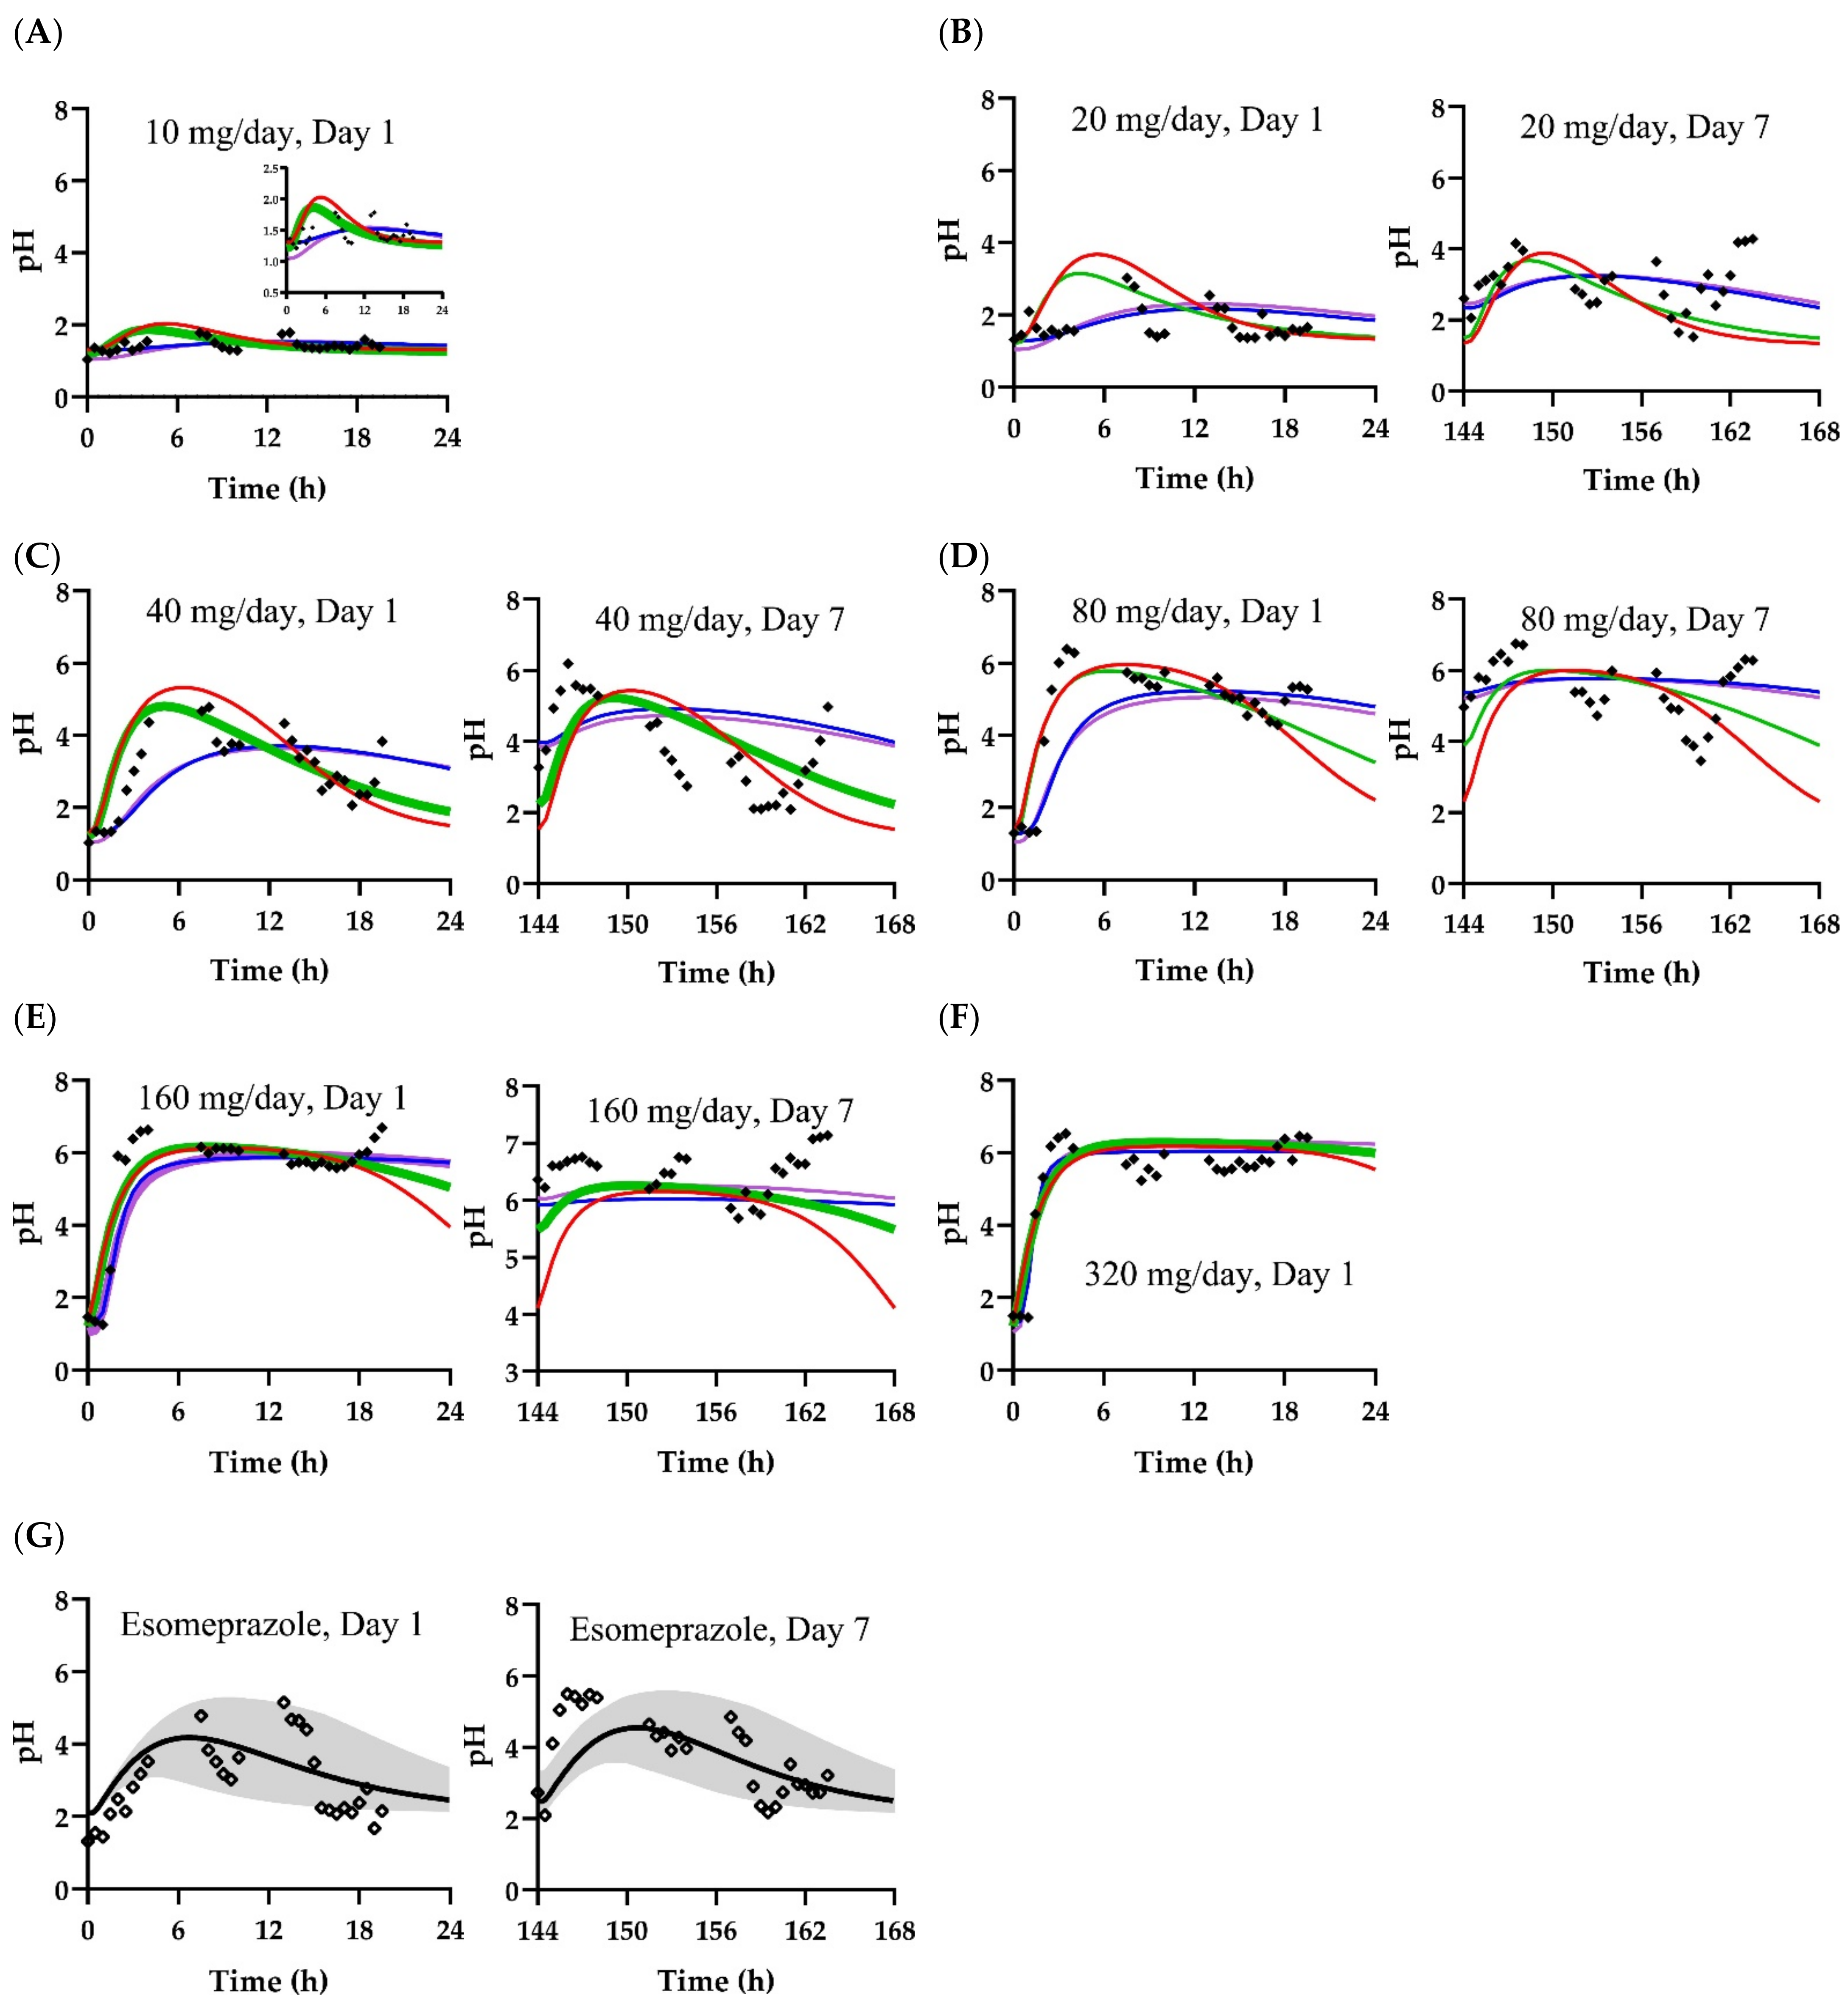
3.2. Pharmacodynamic Models
4. Discussion
5. Conclusions
Author Contributions
Funding
Institutional Review Board Statement
Informed Consent Statement
Data Availability Statement
Acknowledgments
Conflicts of Interest
References
- Sunwoo, J.; Oh, J.; Moon, S.J.; Ji, S.C.; Lee, S.H.; Yu, K.S.; Kim, H.S.; Lee, A.; Jang, I.J. Safety, Tolerability, Pharmacodynamics and Pharmacokinetics of DWP14012, a Novel Potassium-Competitive Acid Blocker, in Healthy Male Subjects. Aliment. Pharmacol. Ther. 2018, 48, 206–218. [Google Scholar] [CrossRef] [PubMed] [Green Version]
- Hwang, J.G.; Jeon, I.; Park, S.A.; Lee, A.; Yu, K.-S.; Jang, I.-J.; Lee, S. Pharmacodynamics and Pharmacokinetics of DWP14012 (Fexuprazan) in Healthy Subjects with Different Ethnicities. Aliment. Pharmacol. Ther. 2020, 52, 1648–1657. [Google Scholar] [CrossRef] [PubMed]
- Jeong, Y.-S.; Kim, M.-S.; Lee, N.; Lee, A.; Chae, Y.-J.; Chung, S.-J.; Lee, K.-R. Development of Physiologically Based Pharmacokinetic Model for Orally Administered Fexuprazan in Humans. Pharmaceutics 2021, 13, 813. [Google Scholar] [CrossRef] [PubMed]
- Daewoong Pharmaceutical Co., Ltd. ClinicalTrials.gov (NCT03574415): Safety, Tolerability, Pharmacokinetics and Pharmacodynamics of DWP14012 after Oral Administration in Healthy Japanese, Caucasian and Korean; Daewoong Pharmaceutical Co., Ltd.: Seoul, Korea, 2019. [Google Scholar]
- Daewoong Pharmaceutical Co., Ltd. ClinicalTrials.gov (NCT03736369): Study to Evaluate the Efficacy and Safety of DWP14012 in Patients with Erosive Gastroesophageal Reflux Disease (Phase 3); Daewoong Pharmaceutical Co., Ltd.: Seoul, Korea, 2020. [Google Scholar]
- Daewoong Pharmaceutical Co., Ltd. Fexuclu Tablet 40 mg. Package Insert; Daewoong Pharmaceutical Co., Ltd.: Seoul, Korea, 2021. [Google Scholar]
- Hunt, R.H. Importance of pH Control in the Management of GERD. Arch. Intern. Med. 1999, 159, 649–657. [Google Scholar] [CrossRef] [PubMed] [Green Version]
- Barradell, L.B.; Faulds, D.; McTavish, D. Lansoprazole. Drugs 1992, 44, 225–250. [Google Scholar] [CrossRef] [PubMed]
- AstraZeneca Korea. Nexium Tablet 20 mg. Package Insert; AstraZeneca Korea: Seoul, Korea, 2021. [Google Scholar]
- Langtry, H.D.; Grant, S.M.; Goa, K.L. Famotidine. Drugs 1989, 38, 551–590. [Google Scholar] [CrossRef]
- McKeage, K.; Blick, S.K.A.; Croxtall, J.D.; Lyseng-Williamson, K.A.; Keating, G.M. Esomeprazole. Drugs 2008, 68, 1571–1607. [Google Scholar] [CrossRef]
- Wagner, J.G. History of Pharmacokinetics. Pharmacol. Ther. 1981, 12, 537–562. [Google Scholar] [CrossRef] [Green Version]
- Zou, H.; Banerjee, P.; Leung, S.S.Y.; Yan, X. Application of Pharmacokinetic-Pharmacodynamic Modeling in Drug Delivery: Development and Challenges. Front. Pharmacol. 2020, 11, 997. [Google Scholar] [CrossRef]
- Yim, C.-S.; Jeong, Y.-S.; Lee, S.-Y.; Pyeon, W.; Ryu, H.-M.; Lee, J.-H.; Lee, K.-R.; Maeng, H.-J.; Chung, S.-J. Specific Inhibition of the Distribution of Lobeglitazone to the Liver by Atorvastatin in Rats: Evidence for a Rat Organic Anion Transporting Polypeptide 1B2–Mediated Interaction in Hepatic Transport. Drug Metab. Dispos. 2017, 45, 246–259. [Google Scholar] [CrossRef] [PubMed] [Green Version]
- Oh, Y.; Jeong, Y.-S.; Kim, M.-S.; Min, J.S.; Ryoo, G.; Park, J.E.; Jun, Y.; Song, Y.-K.; Chun, S.-E.; Han, S.; et al. Inhibition of Organic Anion Transporting Polypeptide 1B1 and 1B3 by Betulinic Acid: Effects of Preincubation and Albumin in the Media. J. Pharm. Sci. 2018, 107, 1713–1723. [Google Scholar] [CrossRef] [PubMed]
- Jamei, M.; Marciniak, S.; Feng, K.; Barnett, A.; Tucker, G.; Rostami-Hodjegan, A. The Simcyp® Population-Based ADME Simulator. Expert Opin. Drug Metab. Toxicol. 2009, 5, 211–223. [Google Scholar] [CrossRef] [PubMed]
- Gibaldi, M.; Perrier, D. Pharmacokinetics, 2nd ed.; Marcel Dekker: New York, NY, USA, 1982. [Google Scholar]
- Yun, H.-Y.; In-Hwan, B.; Seo, J.-W.; Bae, K.-J.; Lee, M.H.; Kang, W.; Kwon, K.-I. The Role of PK/PD Modeling and Simulation in Model-based New Drug Development. Korean J. Clin. Pharm. 2008, 18, 84–96. [Google Scholar]
- Felmlee, M.A.; Morris, M.E.; Mager, D.E. Mechanism-Based Pharmacodynamic Modeling. Methods Mol. Biol. 2012, 929, 583–600. [Google Scholar] [CrossRef] [Green Version]
- Sostek, M.B.; Chen, Y.; Skammer, W.; Winter, H.; Zhao, J.; Andersson, T. Esomeprazole Administered Through a Nasogastric Tube Provides Bioavailability Similar to Oral Dosing. Aliment. Pharmacol. Ther. 2003, 18, 581–586. [Google Scholar] [CrossRef]
- Brown, R.P.; Delp, M.D.; Lindstedt, S.L.; Rhomberg, L.R.; Beliles, R.P. Physiological Parameter Values for Physiologically Based Pharmacokinetic Models. Toxicol. Ind. Health 1997, 13, 407–484. [Google Scholar] [CrossRef]
- Kim, Y.; Hatley, O.; Rhee, S.-J.; Yi, S.; Lee, H.A.; Yoon, S.; Chung, J.-Y.; Yu, K.-S.; Lee, H. Development of a Korean-Specific Virtual Population for Physiologically Based Pharmacokinetic Modelling and Simulation. Biopharm. Drug Dispos. 2019, 40, 135–150. [Google Scholar] [CrossRef]
- Rodgers, T.; Leahy, D.; Rowland, M. Physiologically Based Pharmacokinetic Modeling 1: Predicting the Tissue Distribution of Moderate-to-Strong Bases. J. Pharm. Sci. 2005, 94, 1259–1276. [Google Scholar] [CrossRef]
- Rodgers, T.; Rowland, M. Physiologically Based Pharmacokinetic Modelling 2: Predicting the Tissue Distribution of Acids, Very Weak Bases, Neutrals and Zwitterions. J. Pharm. Sci. 2006, 95, 1238–1257. [Google Scholar] [CrossRef]
- Sharma, A.; Jusko, W.J. Characteristics of Indirect Pharmacodynamic Models and Applications to Clinical Drug Responses. Br. J. Clin. Pharmacol. 1998, 45, 229–239. [Google Scholar] [CrossRef] [PubMed] [Green Version]
- Jachner, S.; Gerald van den Boogaart, K.; Petzoldt, T. Statistical Methods for the Qualitative Assessment of Dynamic Models with Time Delay (R Package qualV). J. Stat. Softw. 2007, 22, 1–30. [Google Scholar] [CrossRef] [Green Version]
- HK inno.N Corp. K-CAB Tablet 50 mg. Package Insert; HK inno.N Corp: Seoul, Korea, 2020. [Google Scholar]
- Moore, J.G.; Halberg, F. Circadian Rhythm of Gastric Acid Secretion in Men with Active Duodenal Ulcer. Dig. Dis. Sci. 1986, 31, 1185–1191. [Google Scholar] [CrossRef]
- Duroux, P.; Bauerfeind, P.; Emde, C.; Koelz, H.R.; Blum, A.L. Early Dinner Reduces Nocturnal Gastric Acidity. Gut 1989, 30, 1063–1067. [Google Scholar] [CrossRef] [Green Version]
- Lee, H.A.; Lee, K.-R.; Jang, S.B.; Chung, S.Y.; Yu, K.-S.; Lee, H. A Physiologically-Based Pharmacokinetic Model Adequately Predicted the Human Pharmacokinetic Profiles of yh4808, a Novel K+-Competitive Acid Blocker. Eur. J. Pharm. Sci. 2019, 130, 1–10. [Google Scholar] [CrossRef]
- Takahashi, N.; Take, Y. Tegoprazan, a Novel Potassium-Competitive Acid Blocker to Control Gastric Acid Secretion and Motility. J. Pharmacol. Exp. Ther. 2018, 364, 275. [Google Scholar] [CrossRef] [Green Version]
- Suzuki, T.; Kagami, T.; Uotani, T.; Yamade, M.; Hamaya, Y.; Iwaizumi, M.; Osawa, S.; Sugimoto, K.; Miyajima, H.; Furuta, T. Comparison of Effect of an Increased Dosage of Vonoprazan Versus Vonoprazan Plus Lafutidine on Gastric Acid Inhibition and Serum Gastrin. Eur. J. Clin. Pharmacol. 2018, 74, 45–52. [Google Scholar] [CrossRef]
- Daewoong Pharmaceutical Co., Ltd. Investigator’s Brochure DWP14012; Daewoong Pharmaceutical Co., Ltd.: Seoul, Korea, 2018. [Google Scholar]
- Benesty, J.; Chen, J.; Huang, Y.; Cohen, I. Pearson Correlation Coefficient. In Noise Reduction in Speech Processing; Springer: Cham, Switzerland, 2009; pp. 1–4. [Google Scholar]
- Nikolić, D.; Mureşan, R.C.; Feng, W.; Singer, W. Scaled Correlation Analysis: A Better Way to Compute a Cross-Correlogram. Eur. J. Neurosci. 2012, 35, 742–762. [Google Scholar] [CrossRef]
- Pan, F.; Chernew, M.E.; Fendrick, A.M. Impact of Fixed-Dose Combination Drugs on Adherence to Prescription Medications. J. Gen. Intern. Med. 2008, 23, 611–614. [Google Scholar] [CrossRef]
- Bangalore, S.; Kamalakkannan, G.; Parkar, S.; Messerli, F.H. Fixed-Dose Combinations Improve Medication Compliance: A Meta-Analysis. Am. J. Med. 2007, 120, 713–719. [Google Scholar] [CrossRef] [PubMed]
- Takeda Pharmaceutical Company Limited. Lanston LFDT Tablet 15 mg (Lansoprazole); Package Insert; Takeda Pharmaceutical Company Limited: Doshomachi, Japan, 2021. [Google Scholar]


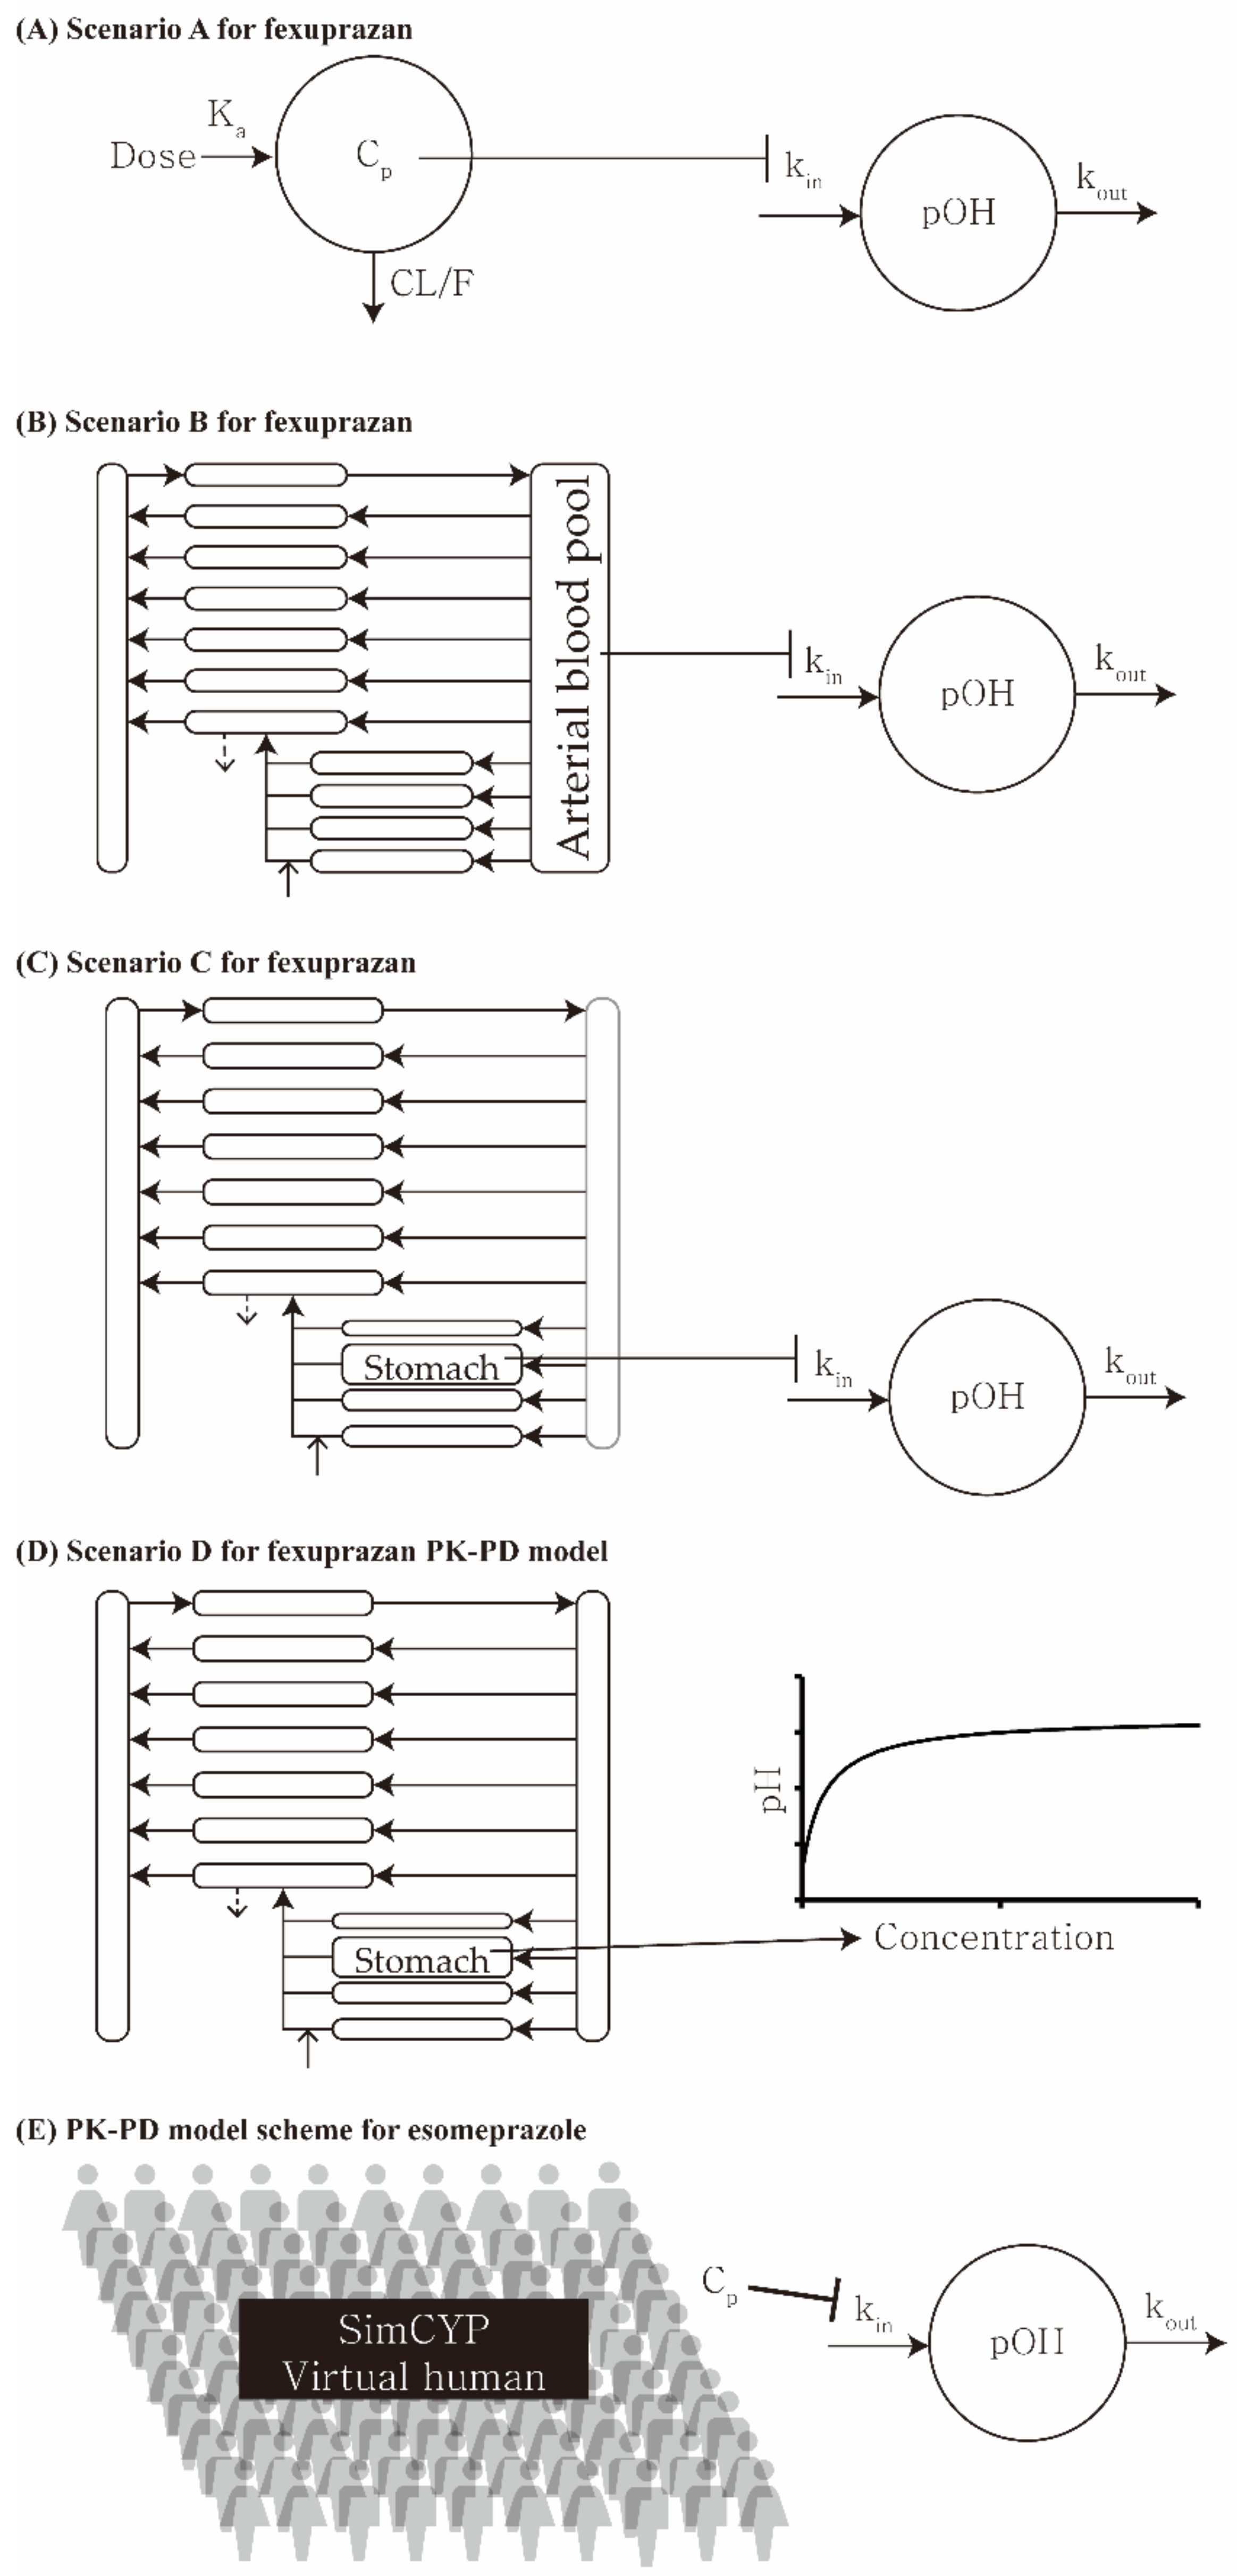
| Scenario | Pharmacokinetic Model | Pharmacodynamic Model |
|---|---|---|
| A | One-compartment (plasma) | Indirect response |
| B | PBPK (plasma) | Indirect response |
| C | PBPK (stomach) | Indirect response |
| D | PBPK (stomach) | Simple direct effect |
| Parameter (Unit) | Group | 20 mg QD | 40 mg QD | 80 mg QD | |
|---|---|---|---|---|---|
| AUCτ (min × ng/mL) | Observed | Training set | 1.36 × 10⁴ ± 9.65 × 10³ | 2.51 × 10⁴ ± 6.12 × 10³ | 5.91 × 10⁴ ± 2.08 × 10⁴ |
| Validation set | - | 2.34 × 10⁴ ± 1.16 × 10⁴ | 5.18 × 10⁴ ± 1.87 × 10⁴ | ||
| Simulated | Compartment model | 1.32 × 10⁴ | 2.65 × 10⁴ | 5.30 × 10⁴ | |
| PBPK model | 1.49 × 10⁴ | 3.00 × 10⁴ | 6.04 × 10⁴ | ||
| AUCratio | Compartment model | 1.03 | 0.947 | 1.12 | |
| - | 0.883 | 0.977 | |||
| PBPK model | 0.913 | 0.837 | 0.978 | ||
| - | 0.780 | 0.858 | |||
| Cmax,SS (ng/mL) | Observed | Training set | 20.8 ± 14.4 | 43.2 ± 11.6 | 94.4 ± 36.5 |
| Validation set | - | 35.5 ± 19.3 | 78.9 ± 34.0 | ||
| Simulated | Compartment model | 19.0 | 37.9 | 75.9 | |
| PBPK model | 20.2 | 40.4 | 81.2 | ||
| Cmax,ratio | Compartment model | 1.09 | 1.14 | 1.24 | |
| - | 0.937 | 1.04 | |||
| PBPK model | 1.03 | 1.07 | 1.16 | ||
| - | 0.878 | 0.972 | |||
| Scenario | Parameter | Value |
|---|---|---|
| A | pHbaseline | 1.30 |
| kin (pOH/min) | 0.132 | |
| Imax (ratio) | 0.386 | |
| IC50 (ng/mL) | 1.06 | |
| γ | 2.51 | |
| B | pHbaseline | 1.22 |
| kin (pOH/min) | 0.139 | |
| Imax (ratio) | 0.401 | |
| IC50 (ng/mL) | 1.16 | |
| γ | 2.14 | |
| C | pHbaseline | 1.29 |
| kin (pOH/min) | 1760 | |
| Imax (ratio) | 0.378 | |
| IC50 (ng/g tissue) | 0.919 | |
| γ | 2.16 | |
| D | pHbaseline | 1.04 |
| Emax (pH) | 5.50 | |
| 1.58 | ||
| EC50 (ng/g tissue) | 0.992 |
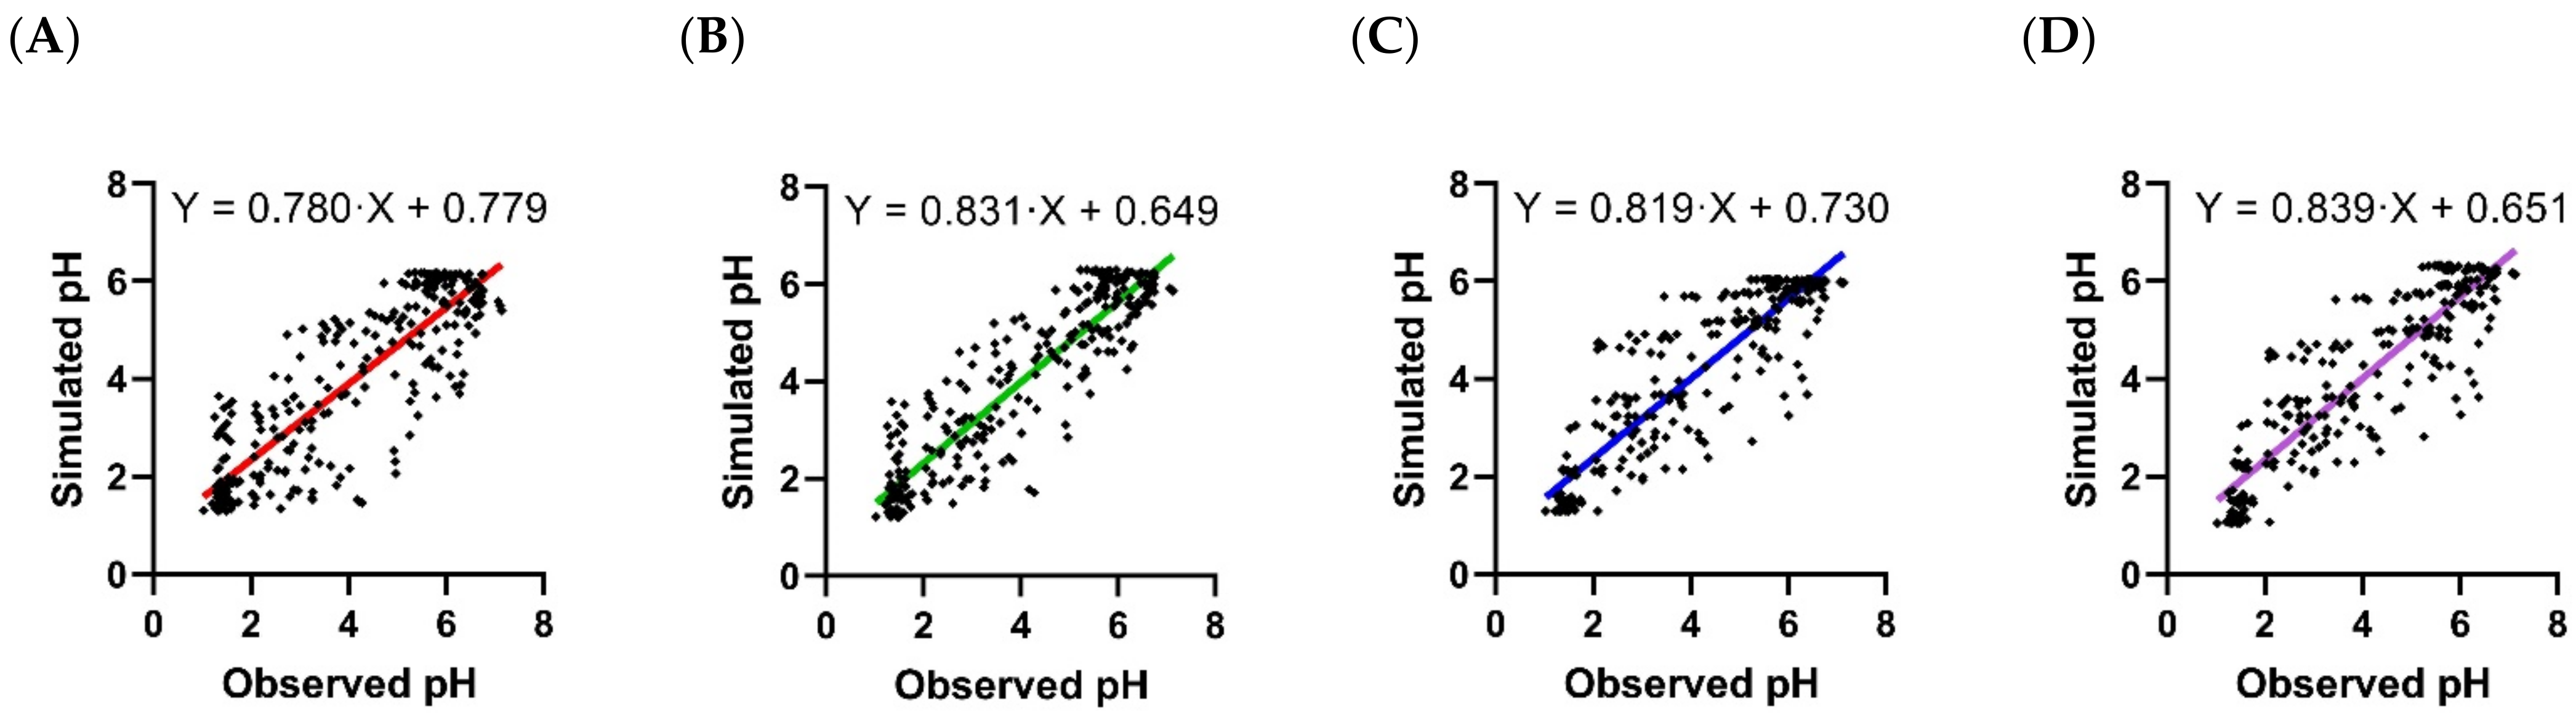
| Scenario | Scenario A | Scenario B | Scenario C | Scenario D |
|---|---|---|---|---|
| Fold difference | 1.00 (0.572, 1.64) | 0996 (0.688, 1.67) | 0.992 (0.691, 1.59) | 0.988 (0.696, 1.62) |
| RMSLE | 0.315 | 0.262 | 0.243 | 0.249 |
| RMSE | 0.992 | 0.800 | 0.853 | 0.845 |
| r2 | 0.738 | 0.827 | 0.803 | 0.808 |
Publisher’s Note: MDPI stays neutral with regard to jurisdictional claims in published maps and institutional affiliations. |
© 2022 by the authors. Licensee MDPI, Basel, Switzerland. This article is an open access article distributed under the terms and conditions of the Creative Commons Attribution (CC BY) license (https://creativecommons.org/licenses/by/4.0/).
Share and Cite
Kim, M.-S.; Lee, N.; Lee, A.; Chae, Y.-J.; Chung, S.-J.; Lee, K.-R. Model-Based Prediction of Acid Suppression and Proposal of a New Dosing Regimen of Fexuprazan in Humans. Pharmaceuticals 2022, 15, 709. https://doi.org/10.3390/ph15060709
Kim M-S, Lee N, Lee A, Chae Y-J, Chung S-J, Lee K-R. Model-Based Prediction of Acid Suppression and Proposal of a New Dosing Regimen of Fexuprazan in Humans. Pharmaceuticals. 2022; 15(6):709. https://doi.org/10.3390/ph15060709
Chicago/Turabian StyleKim, Min-Soo, Nora Lee, Areum Lee, Yoon-Jee Chae, Suk-Jae Chung, and Kyeong-Ryoon Lee. 2022. "Model-Based Prediction of Acid Suppression and Proposal of a New Dosing Regimen of Fexuprazan in Humans" Pharmaceuticals 15, no. 6: 709. https://doi.org/10.3390/ph15060709