
Application of Liquid Chromatography Coupled to Mass Spectrometry in Quality Assessment of Dietary Supplements—A Case Study of Tryptophan Supplements: Release Assay, Targeted and Untargeted Studies


Abstract
:1. Introduction
2. Results and Discussion
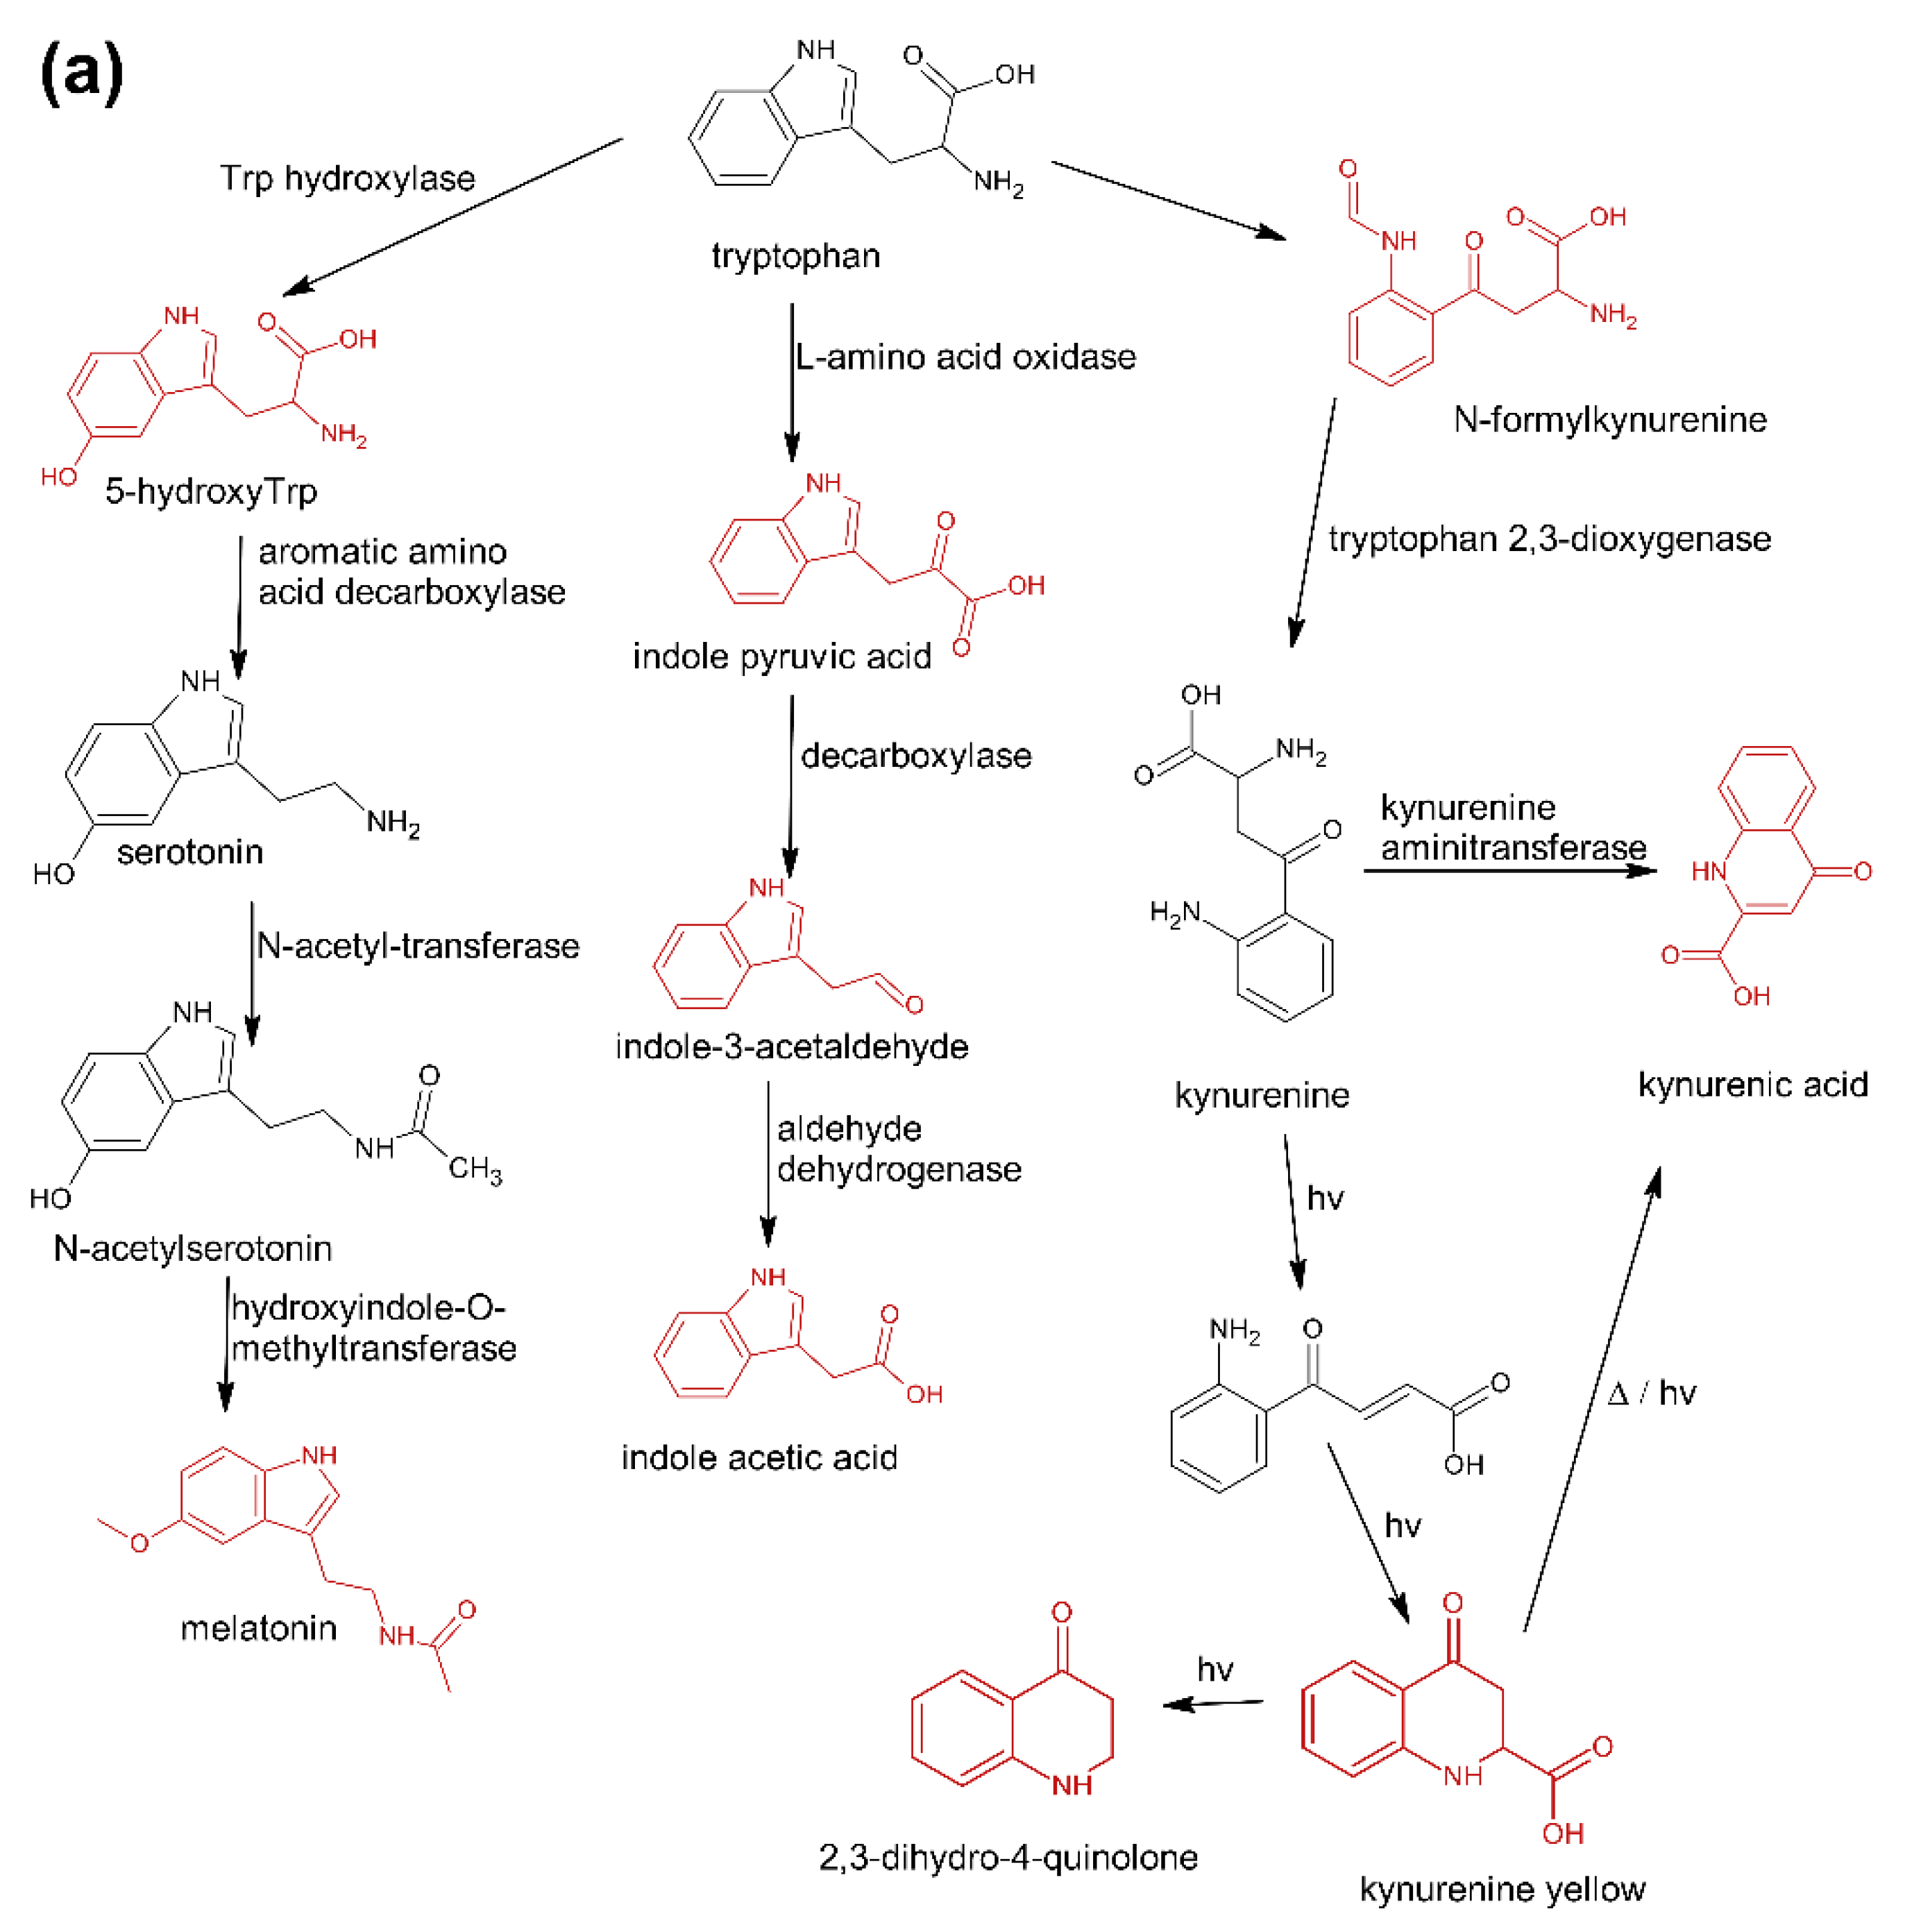
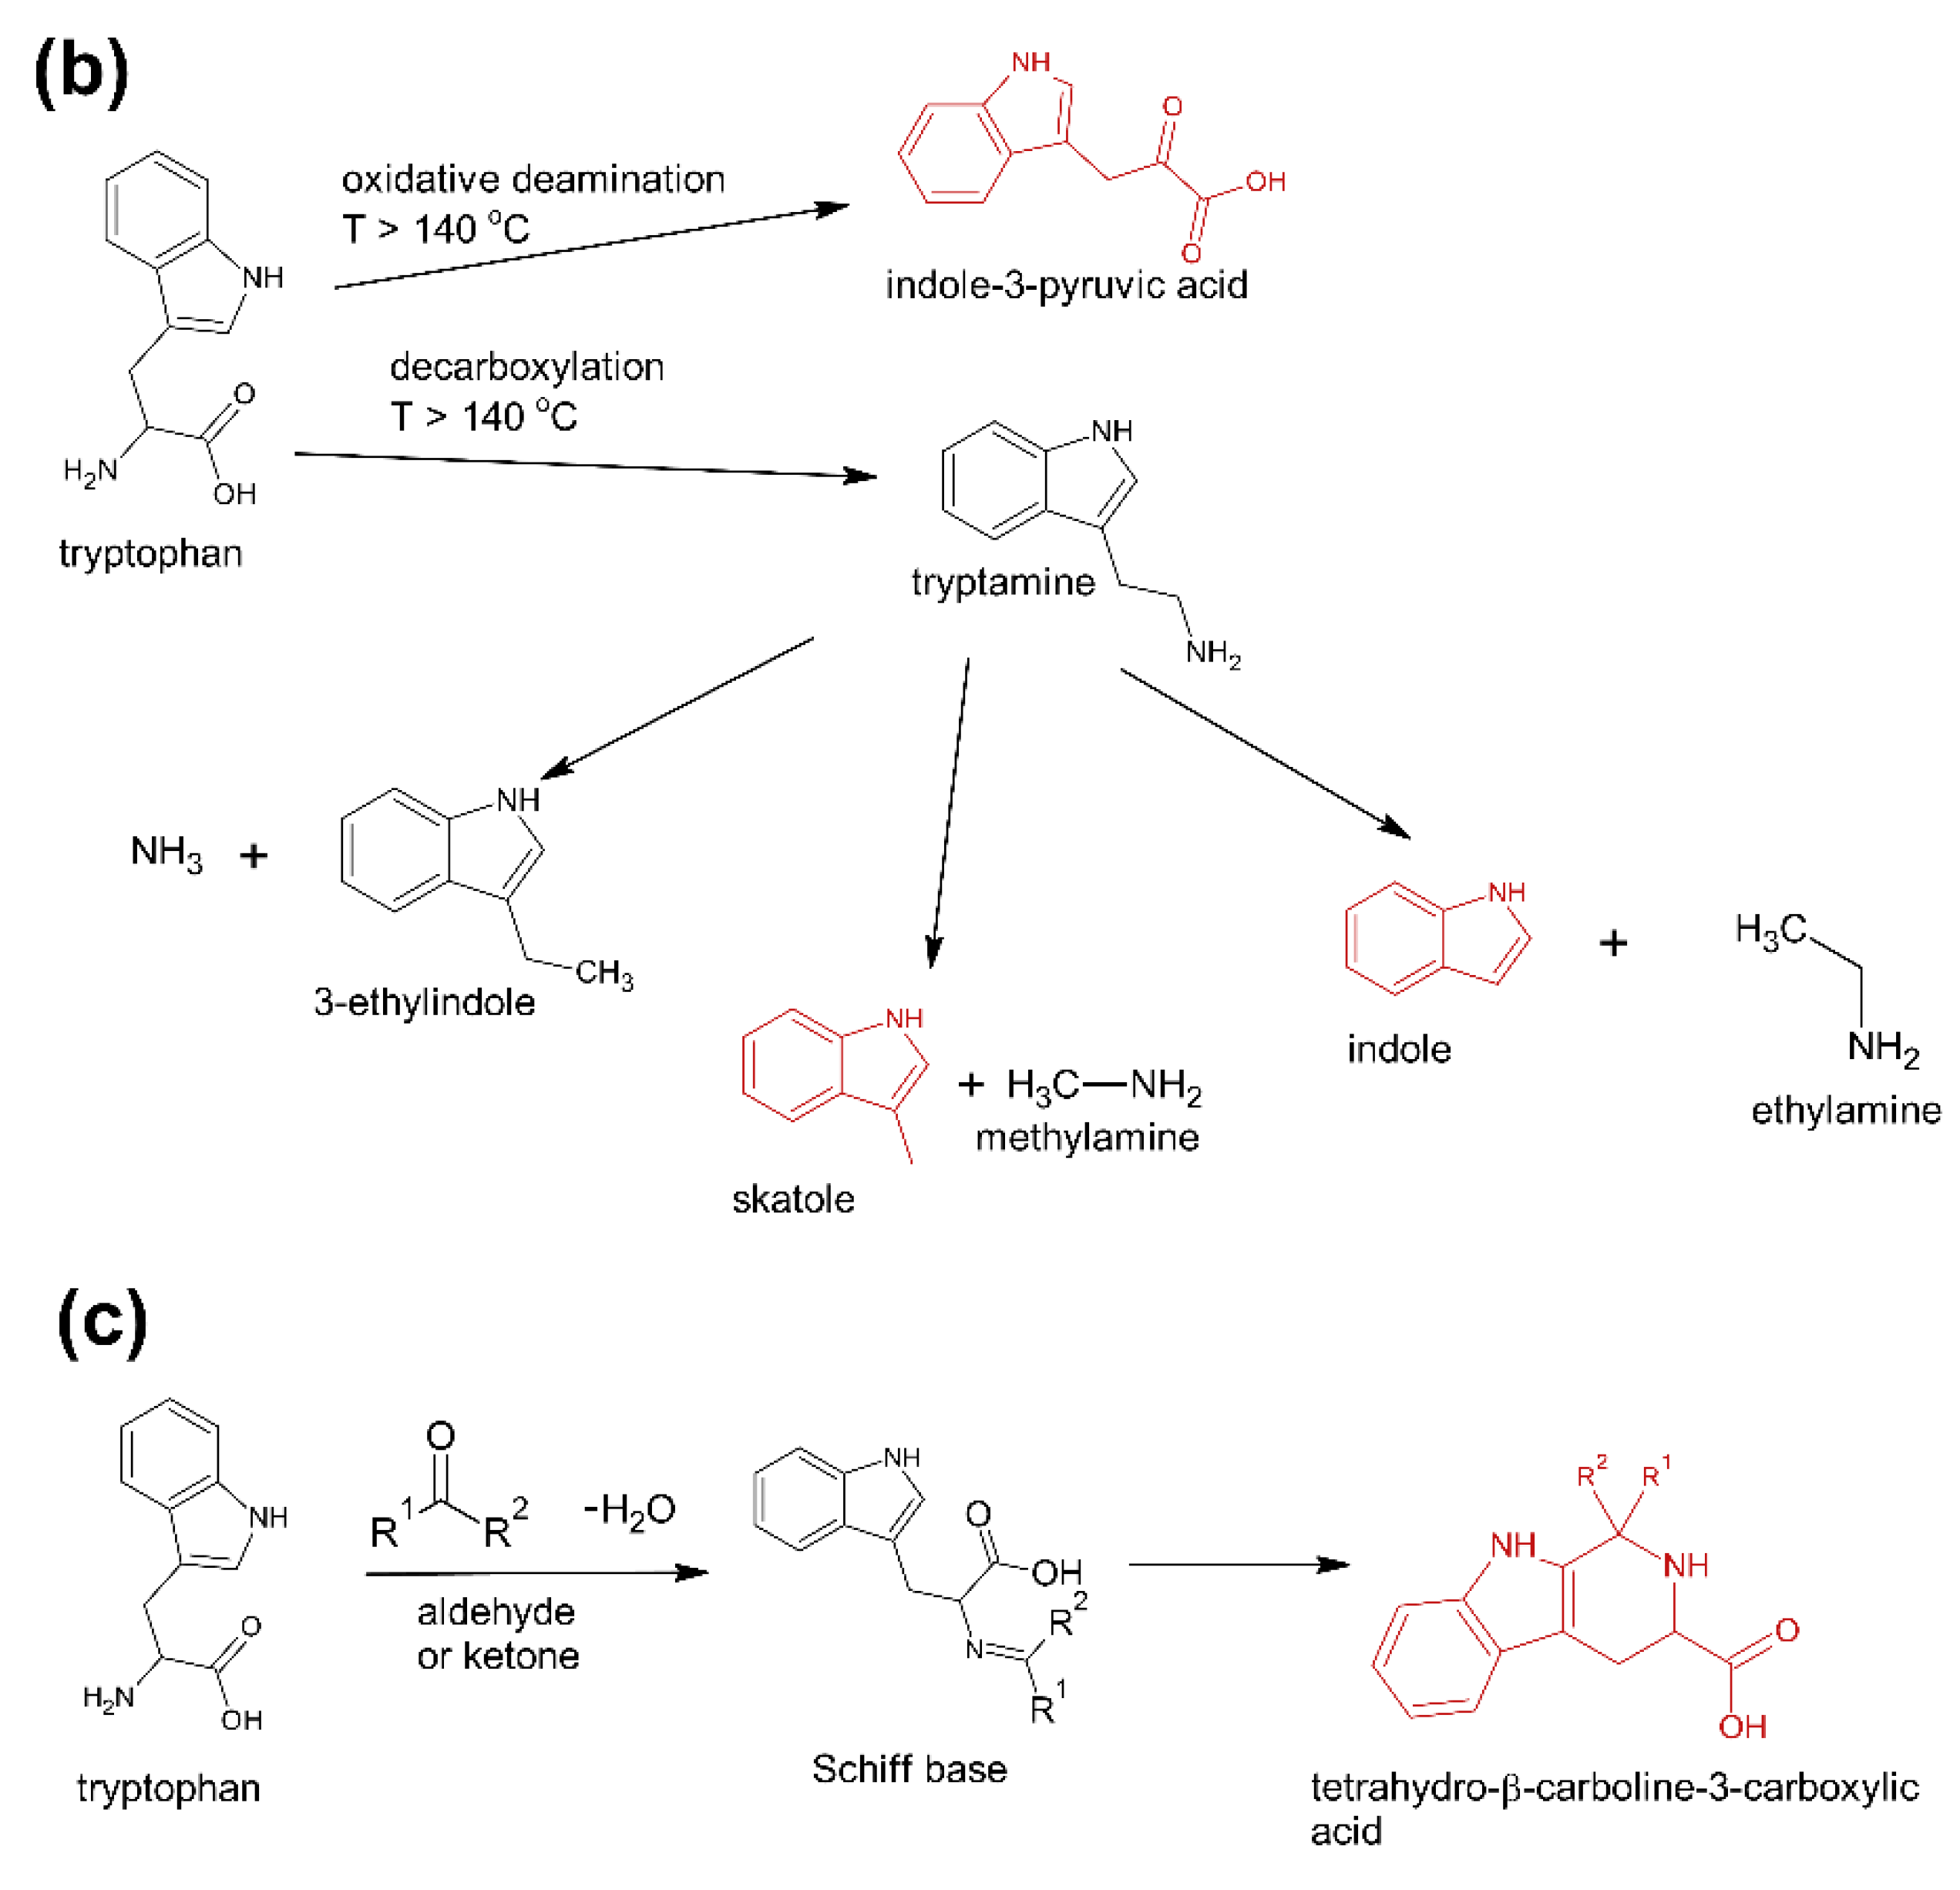
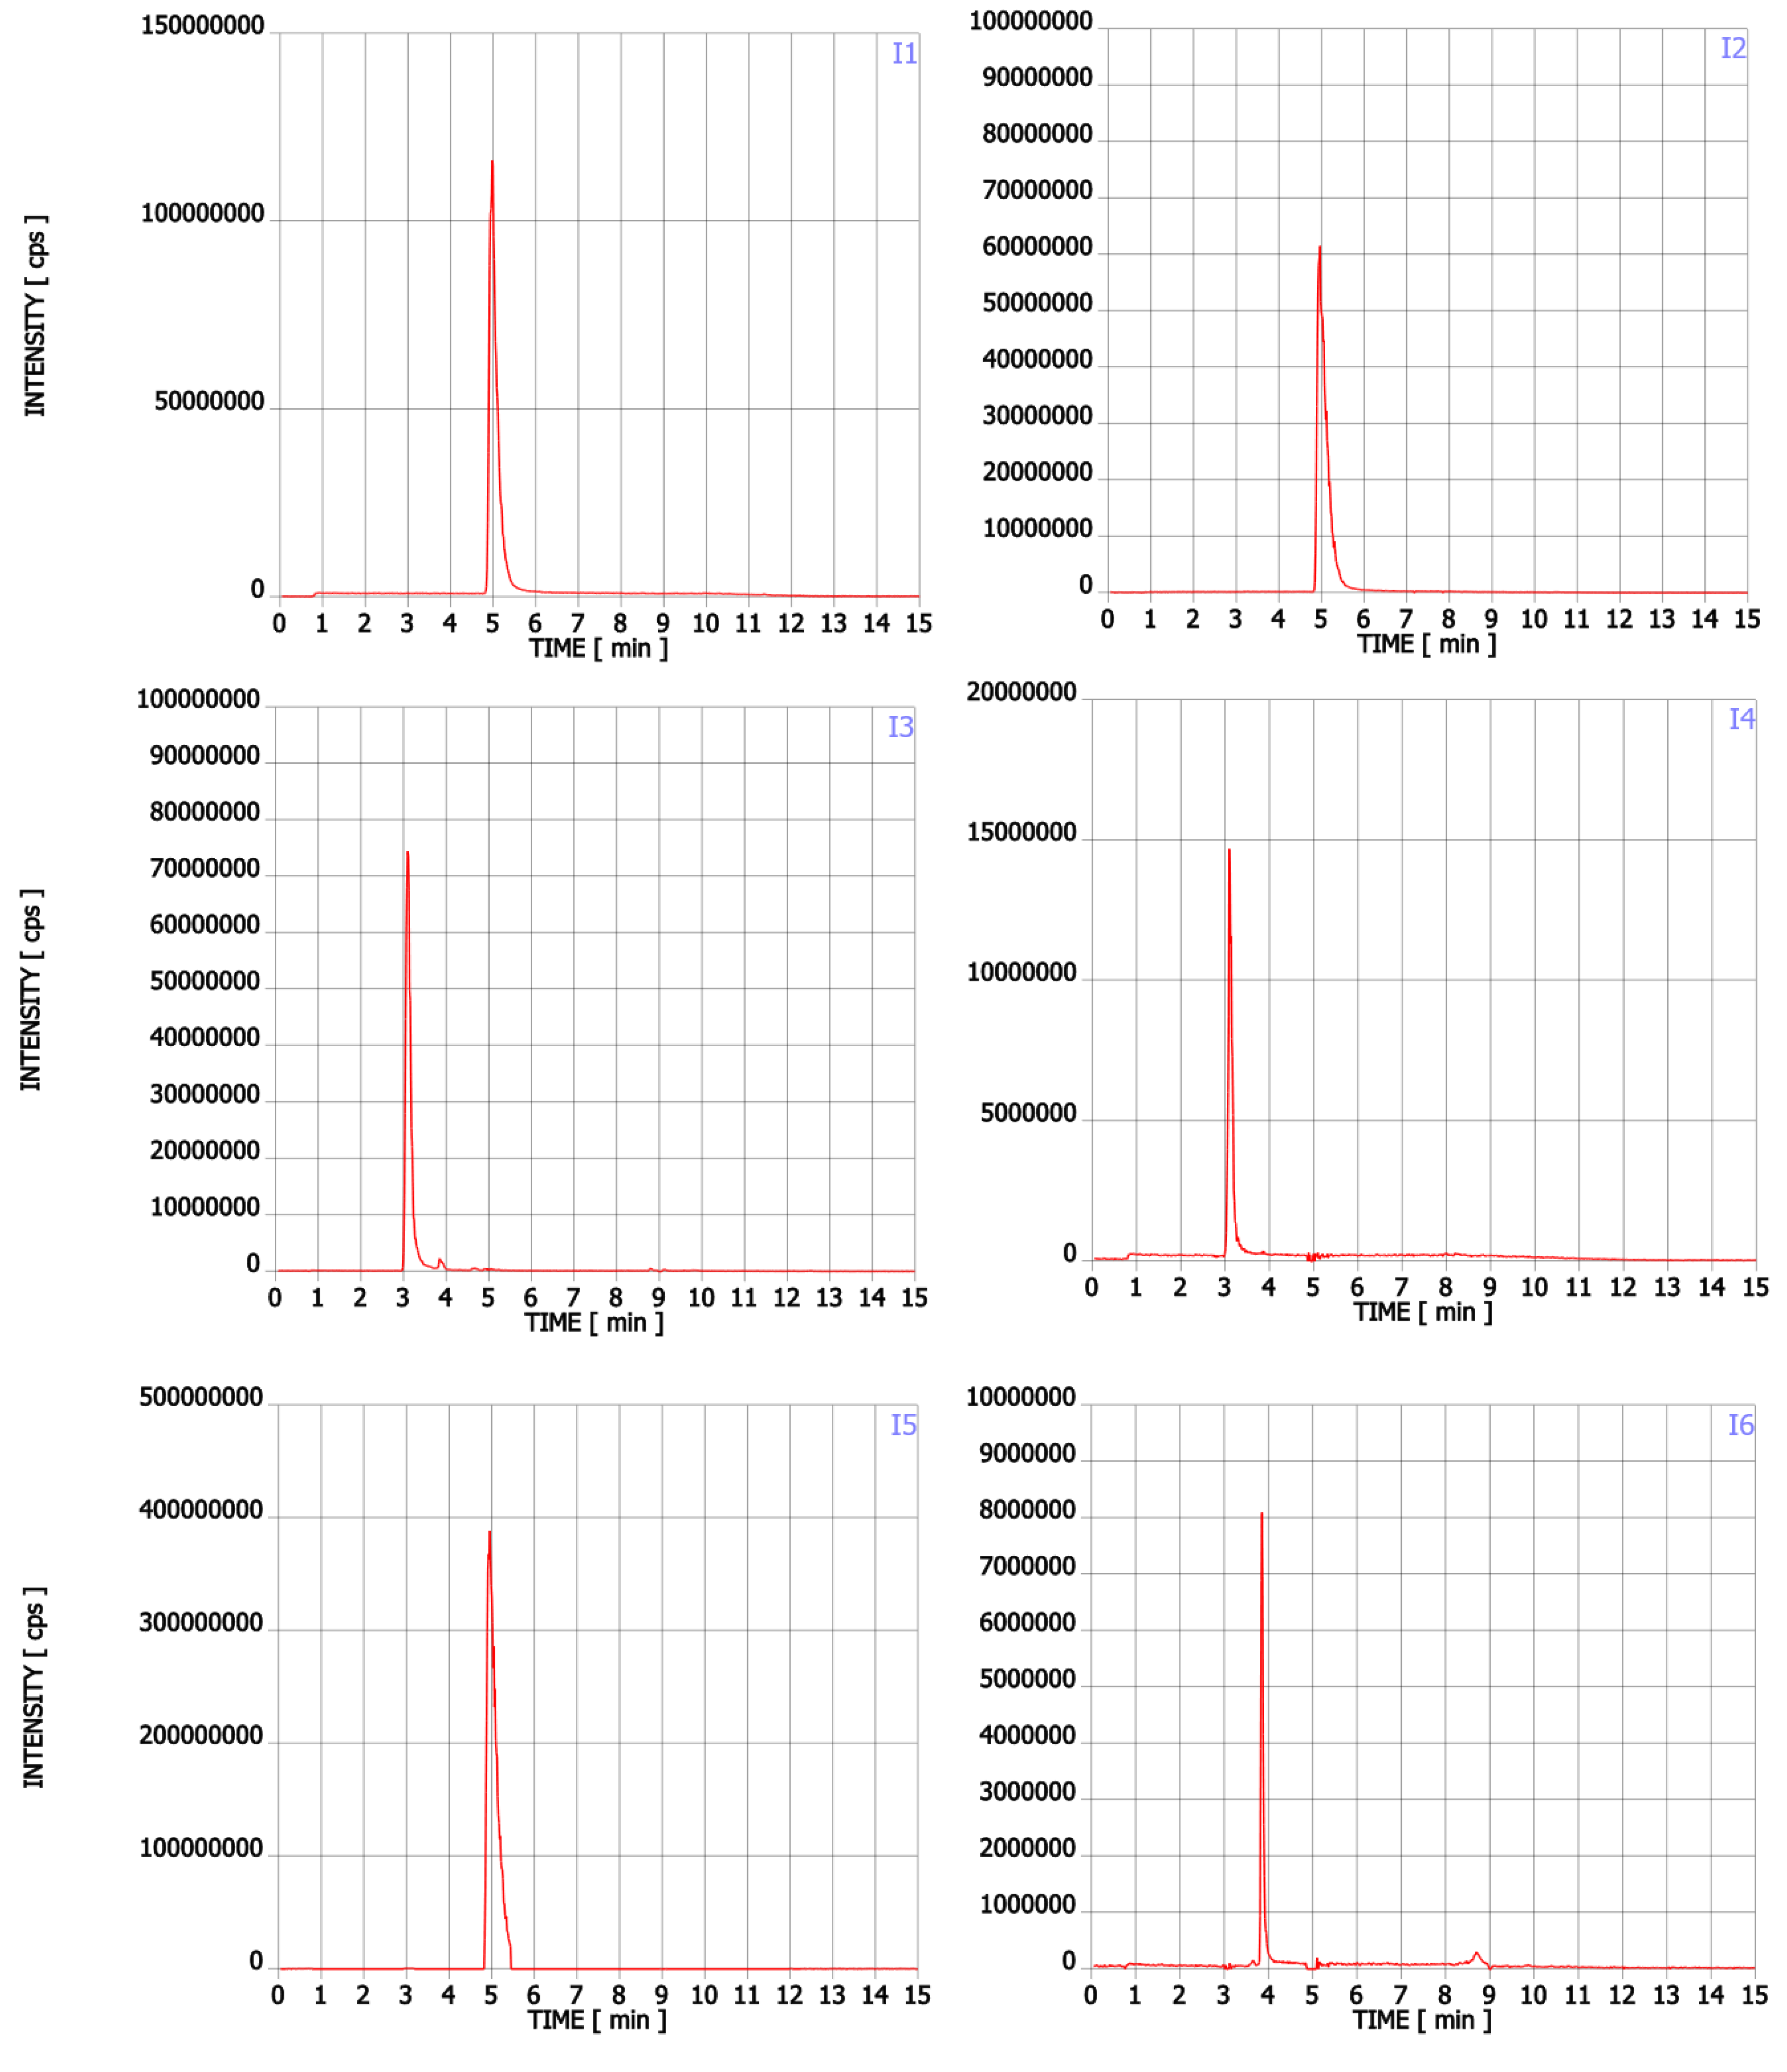
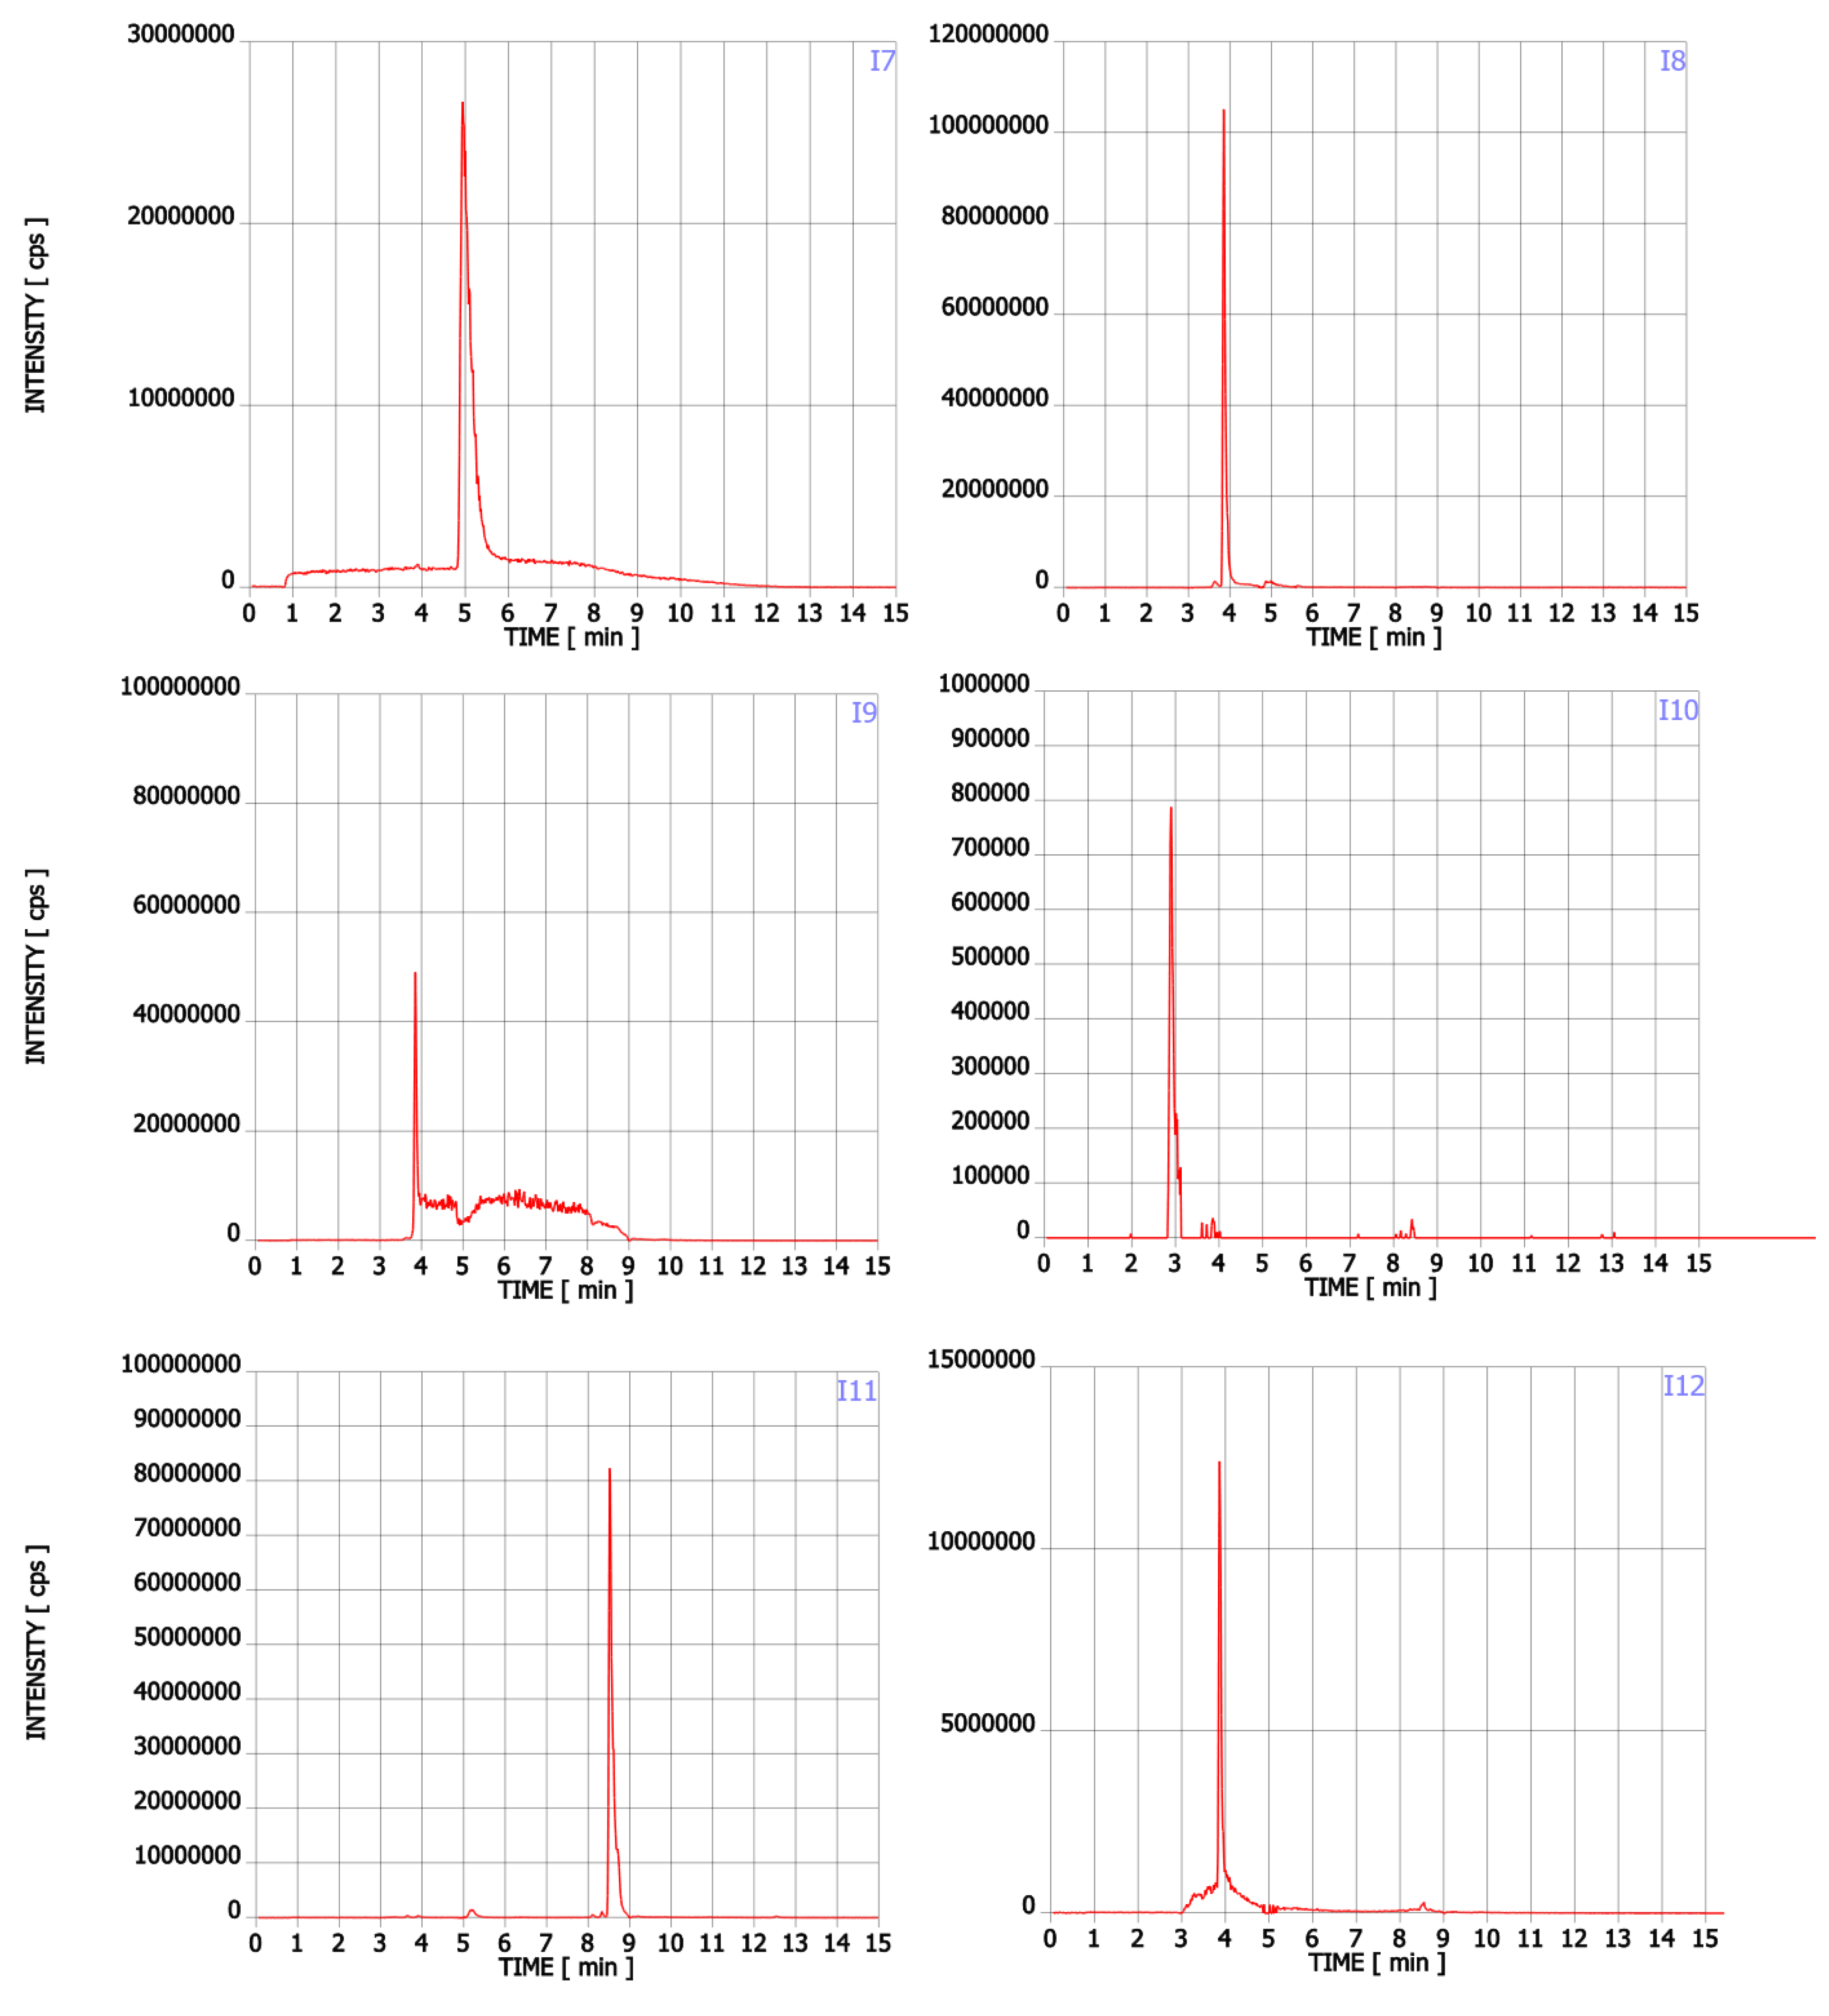
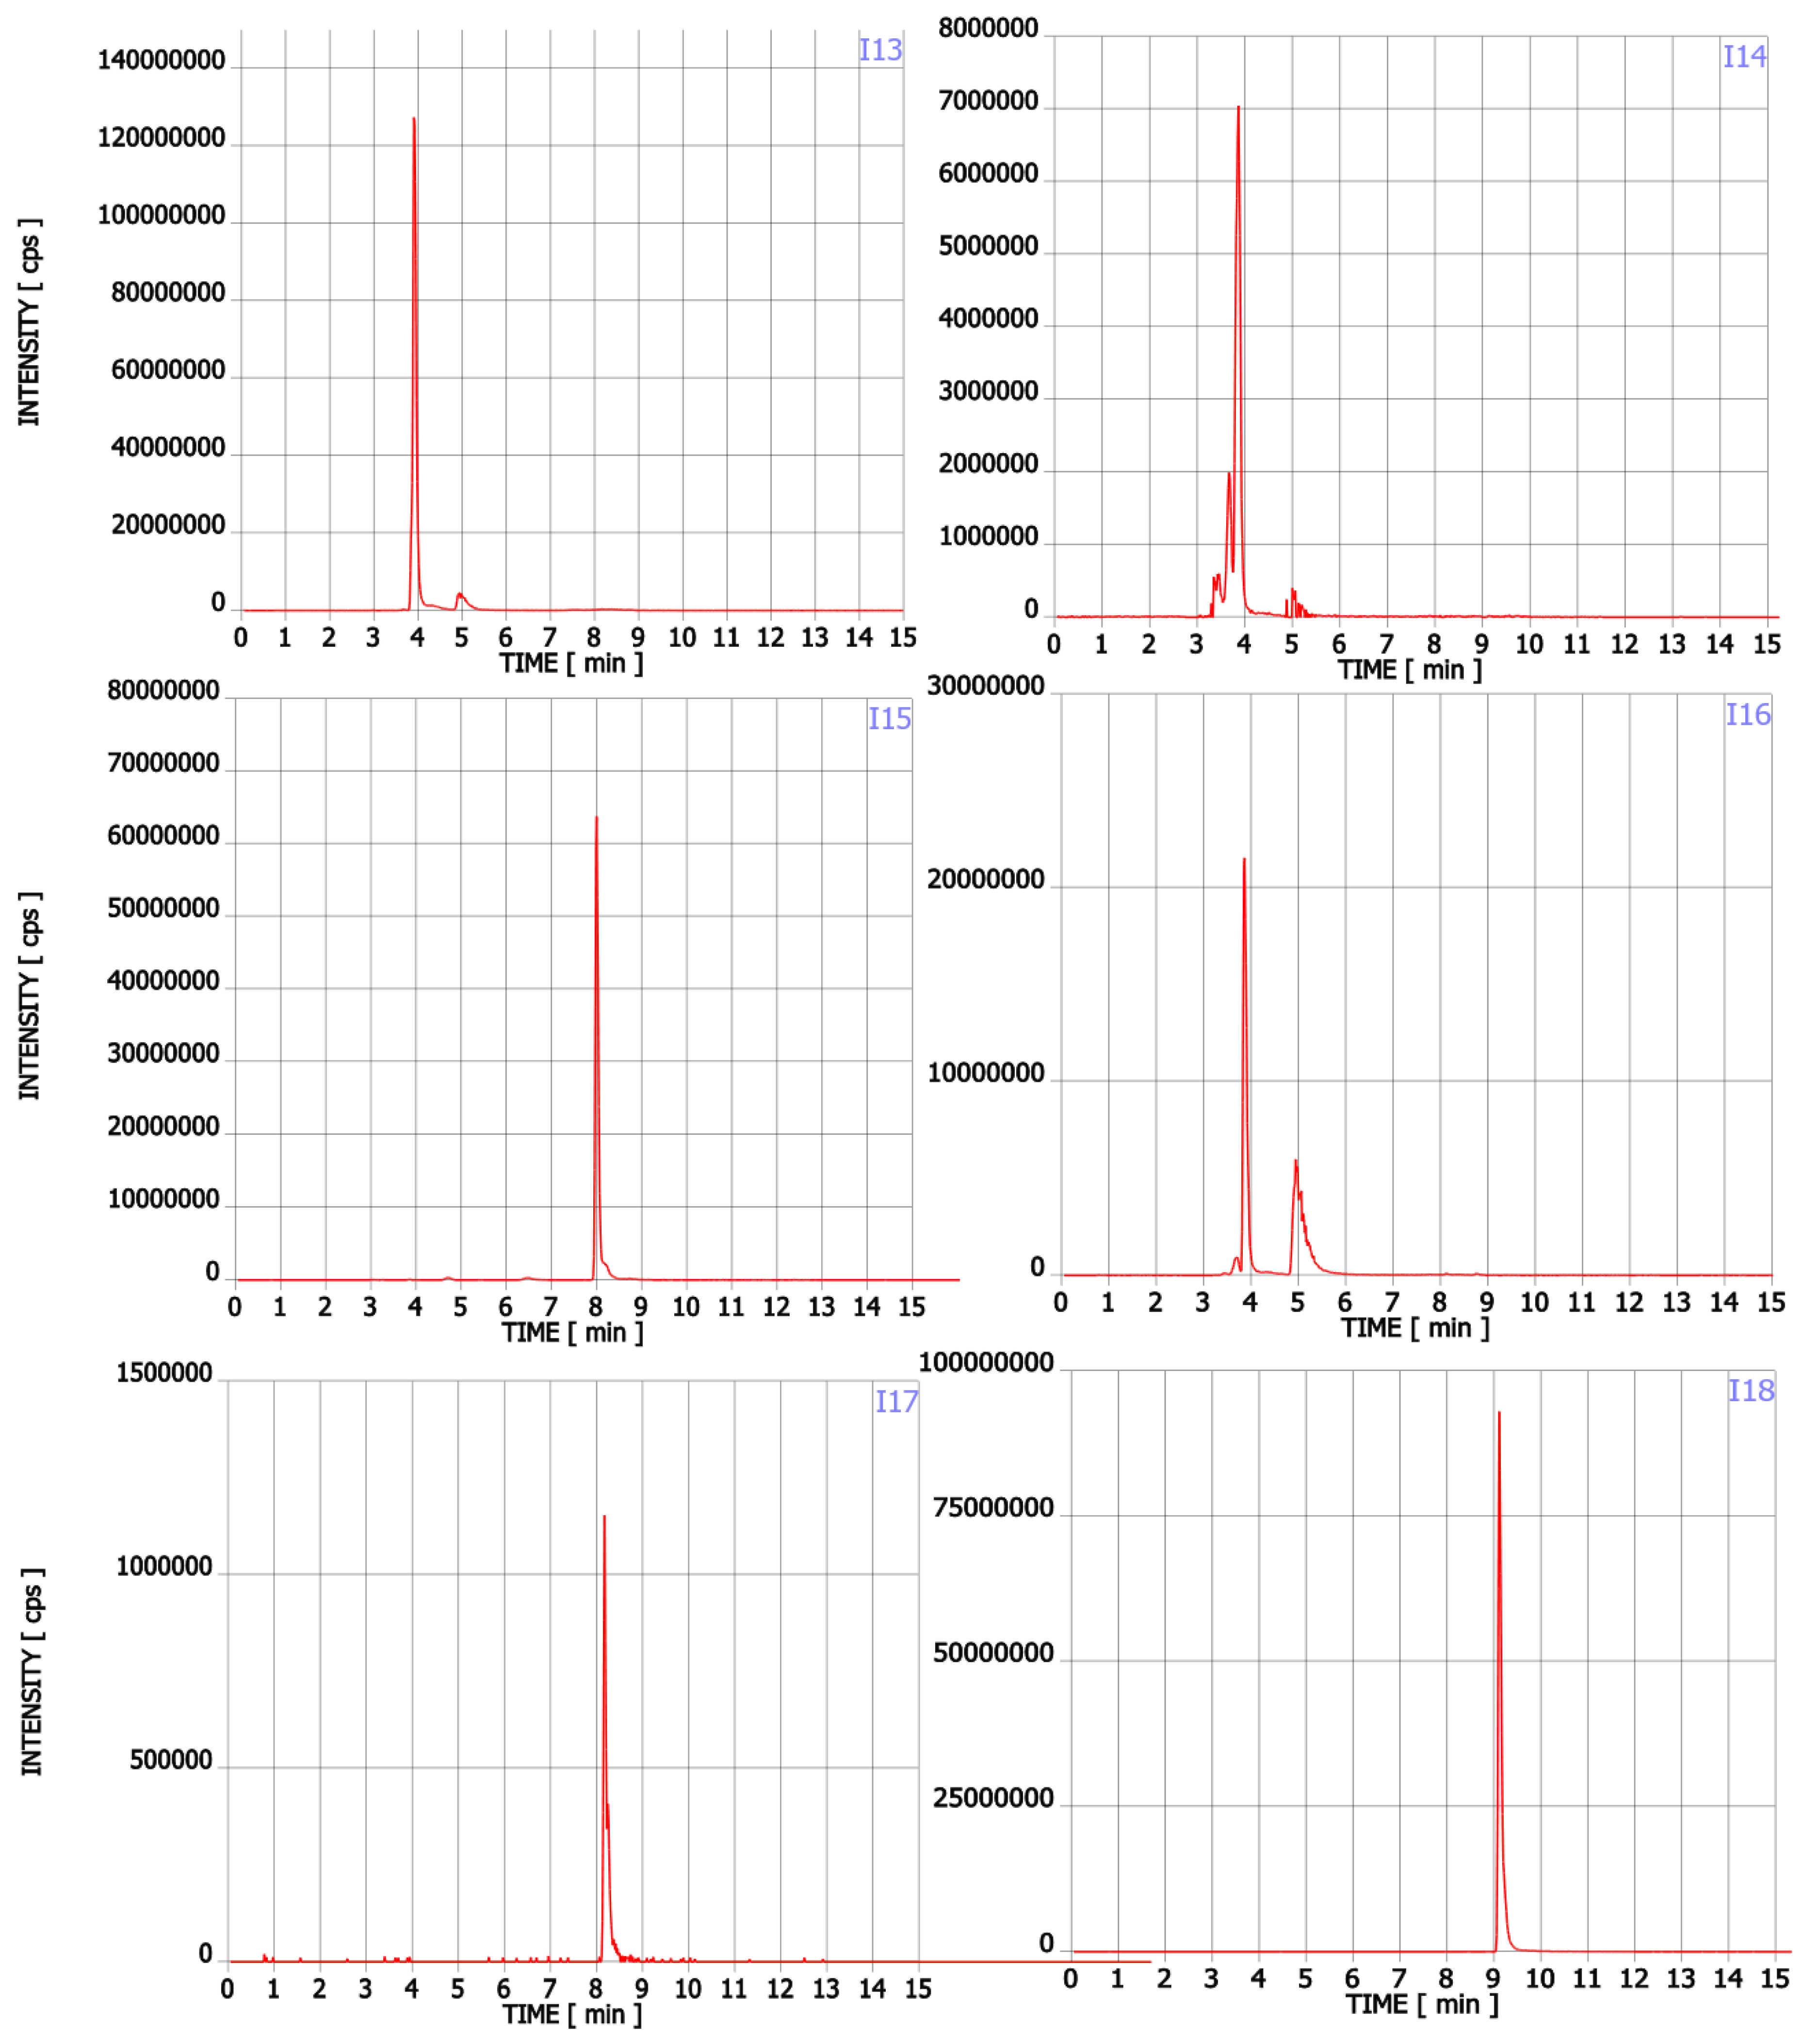
2.1. Tentative Contaminants Present in Trp Supplements
- a)
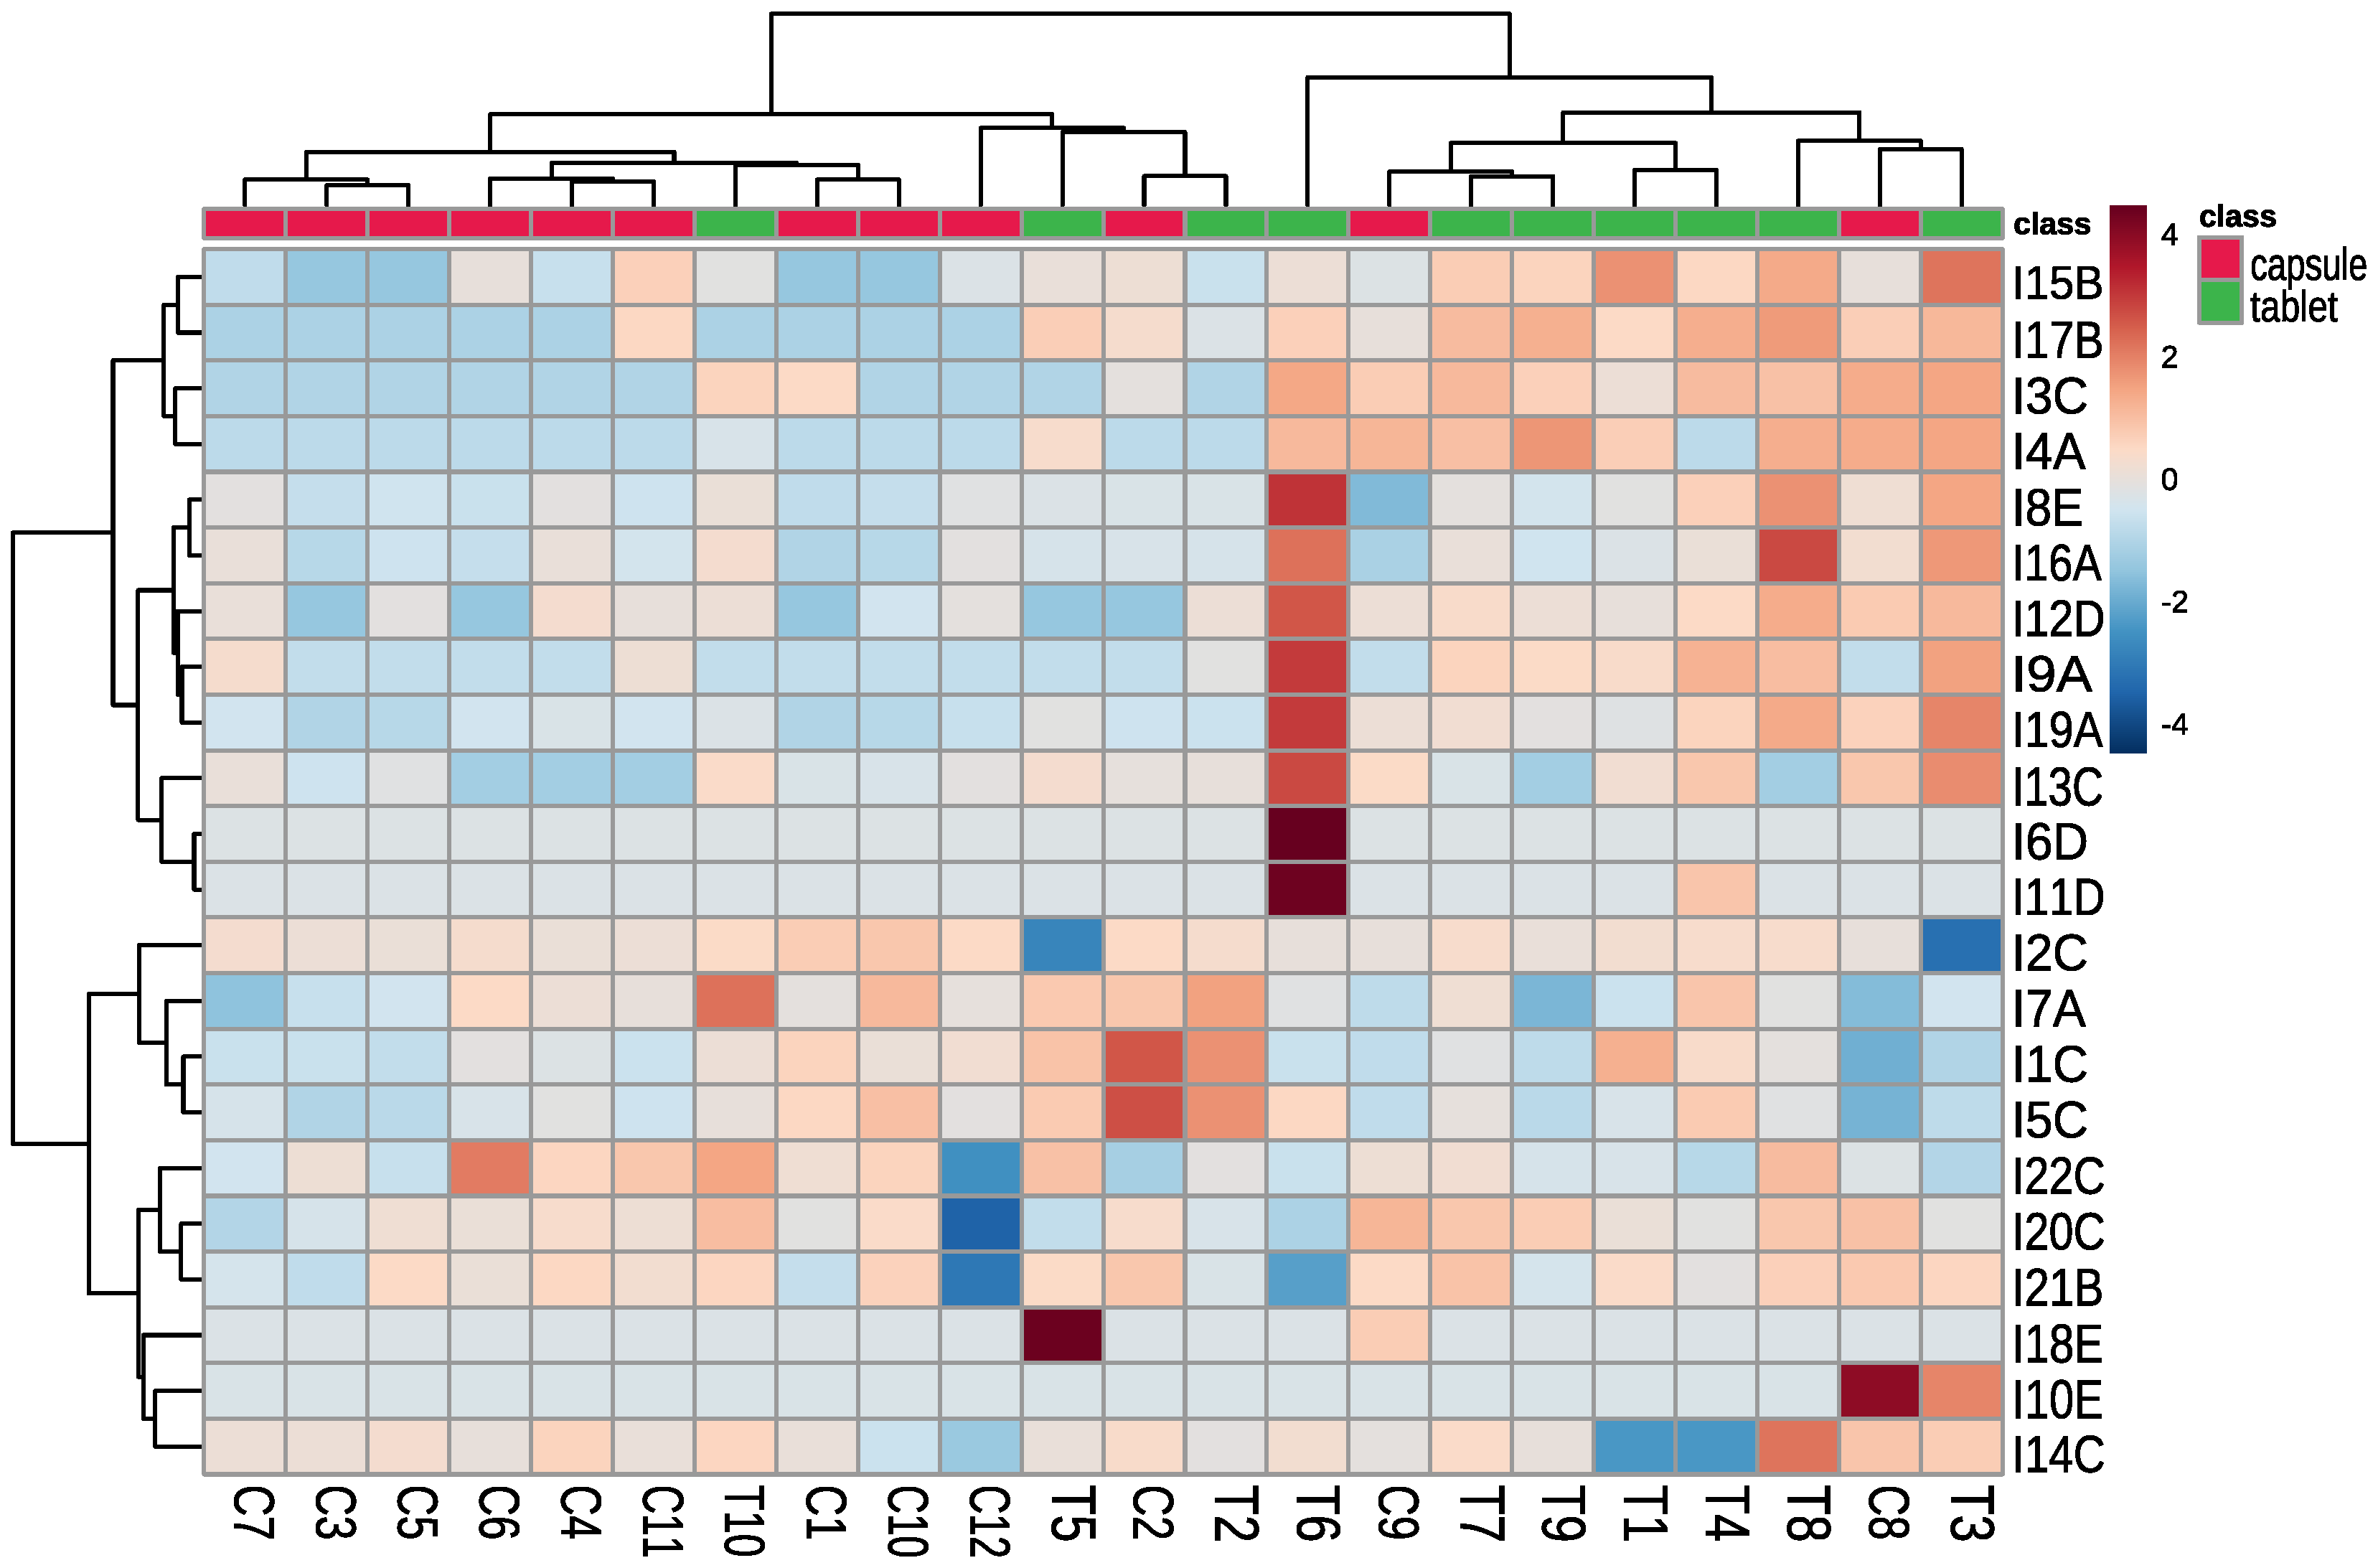
- Dietary supplements in capsules contained mainly contaminants from group C (Trp degradation products), which may indicate that Trp was obtained by chemical synthesis;
- b)
- Dietary supplements in tablets contained mainly contaminants belonging to groups A (Trp’s metabolites) and B (condensation products of Trp and carbonyls), which may indicate that Trp was obtained by biotechnology;
- c)
- Trp from C1 and C3 dietary supplements might be produced by the same manufacturer. The supplements contained the same contaminants (difference in I3—Trp degradation product, which may be related to different storage conditions);
- d)
- Trp from C6 and C11 dietary supplements were produced by the same manufacturer, supplements contained the same contaminants (difference I17—condensation product of Trp and carbonyls);
- e)
- Trp from C5 and C10 dietary supplements were produced by the same manufacturer, supplements contained similar contaminants, the differentiating contaminants were classified as Trp degradation products and can be generated during supplement storage.
2.2. Determination of Trp in Dietary Supplements
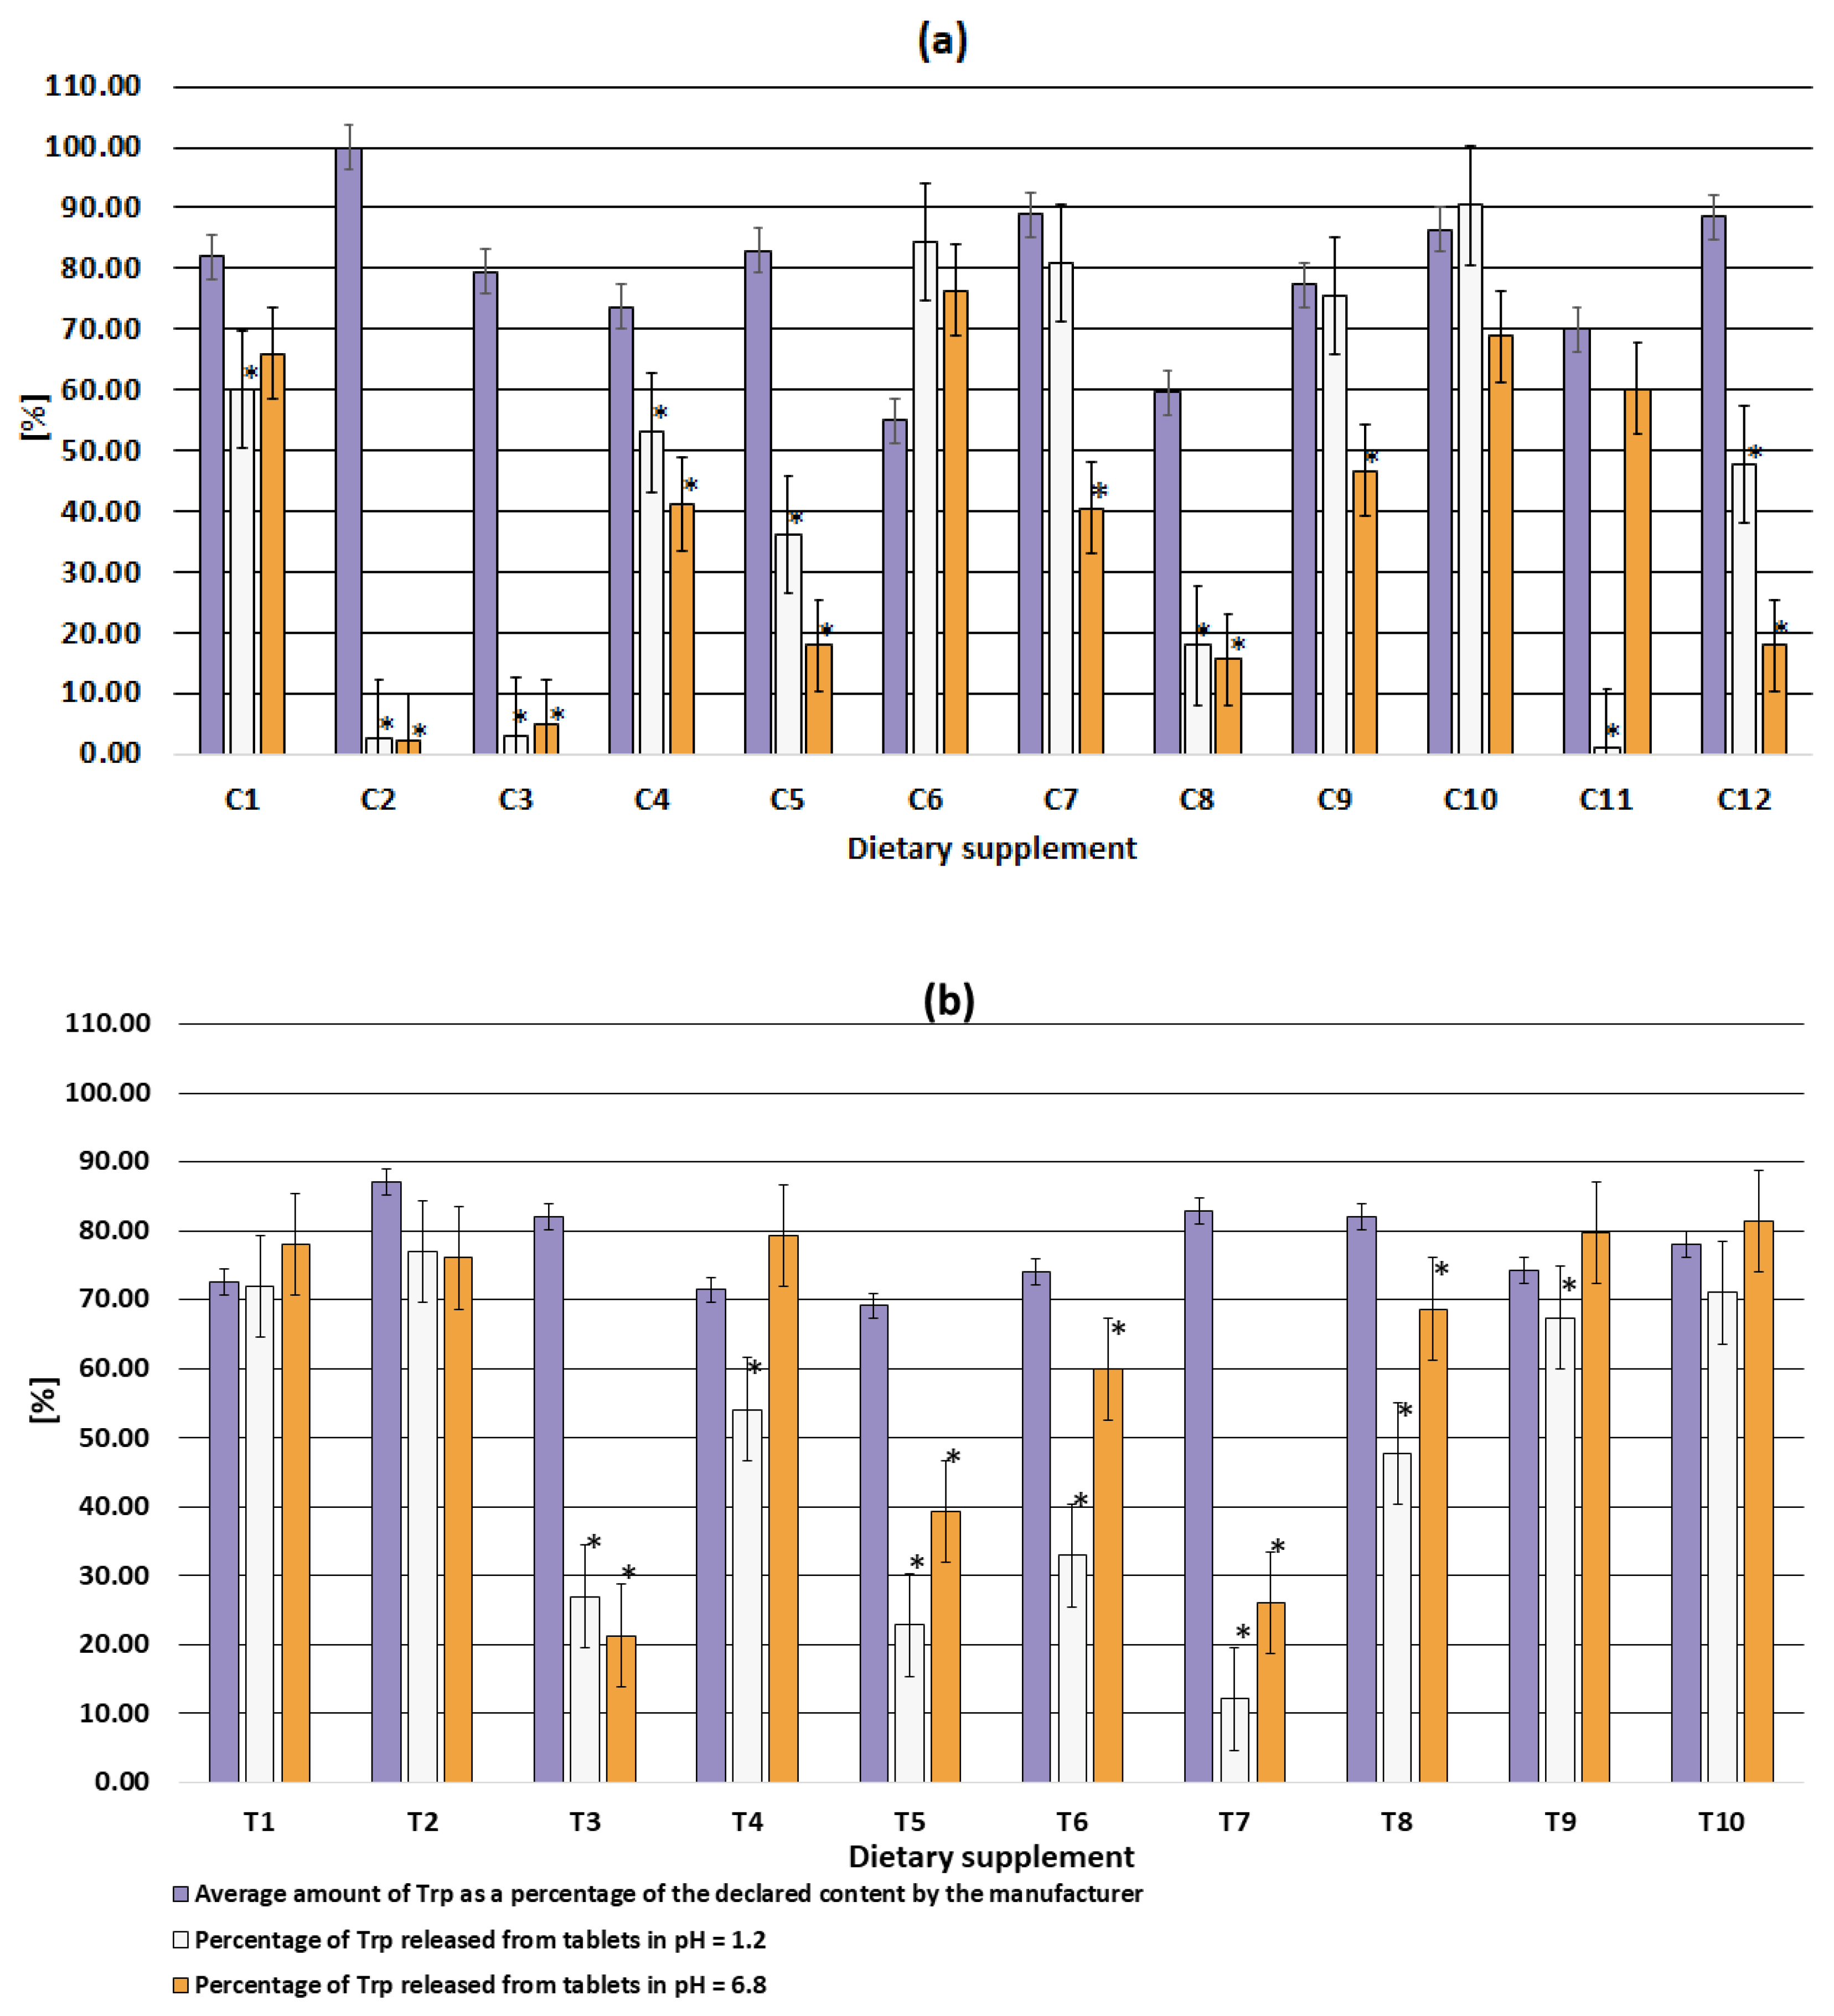
2.3. Dissolution Test for Trp Tablets and Capsules
3. Materials and Methods
3.1. Samples
3.2. Reagents
3.3. Sample Preparation
3.4. Qualitative Analysis
- The m/z of the compound. The difference between experimental and theoretical molecular weight should be no higher than 5 ppm;
- The isotopic pattern. The relative intensity tolerance to be used for the isotope search was set at 30%;
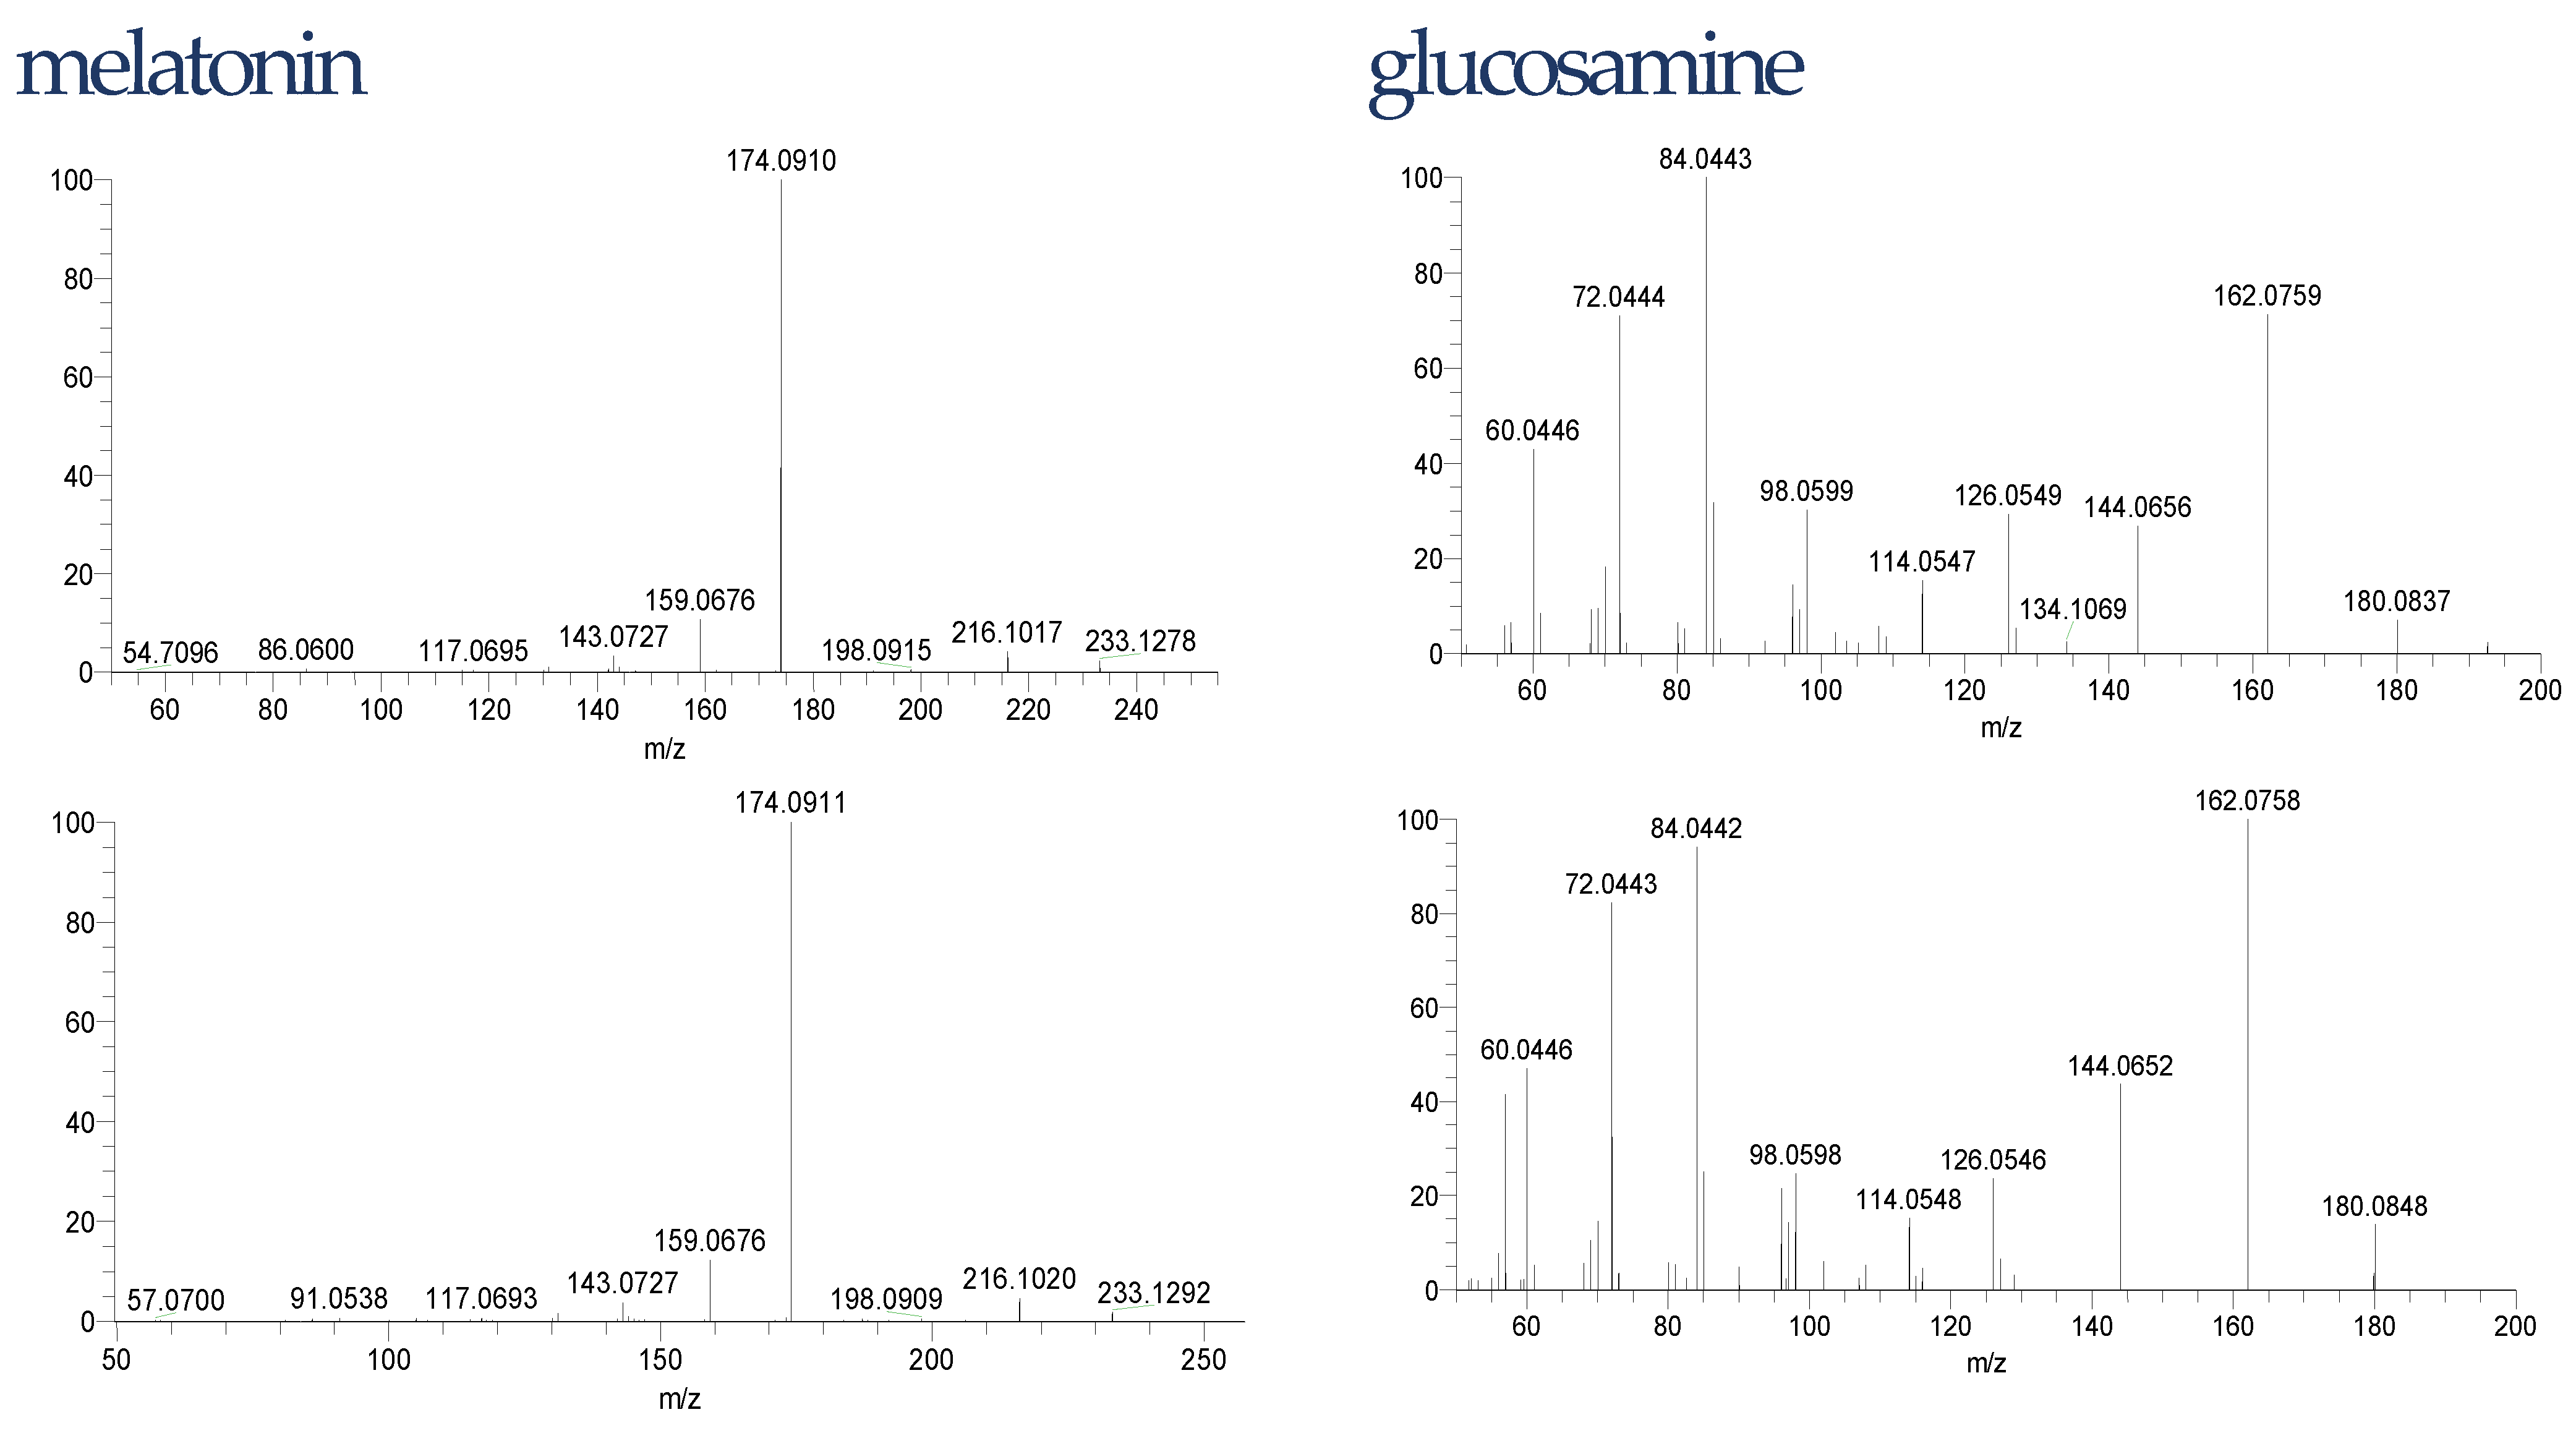
- Fragmentation of the compound. The fragmentation spectrum was compared with experimental data found in the mass spectra library or the literature (confidence level 2), in silico fragmentation (confidence level 3) or reference standard (confidence level 1).
3.5. Quantitative Analysis
3.6. Dissolution Test for Tablets or Capsules
3.7. Expanded Uncertainty
4. Conclusions
Author Contributions
Funding
Institutional Review Board Statement
Informed Consent Statement
Data Availability Statement
Acknowledgments
Conflicts of Interest
Appendix A


| Type of Dietary Supplement | Number of Supplements | Contaminants | Country of Sale | Year | Method Applied | Ref. |
|---|---|---|---|---|---|---|
| Plant based (e.g., Ginkgo biloba, Ginseng, flower pollen), algae | 24 | Cd, Pb, Hg | Mexico | 2007 | ASA | [75] |
| Mainly plant-based (herbs or botanicals as major components) | 95 | As, Cd, Pb, Hg | USA | 2003 | ICP-MS | [76] |
| Mainly plant-based (e.g., ginger, gingko biloba, ephedra), minerals | 40 | Hg | USA | 2005 | ASA | [77] |
| Plant-based and algae (e.g., gingko biloba) | 16 | As | Denmark | 2013 | ICP-MS, LC-ICP-MS | [78] |
| Iron supplements | 15 | As | Brazil/Spain | 2017 | LC-ICP-MS | [79] |
| Multimineral supplements | 168 | Pb | Poland | 2018 | MIP-OES | [80] |
| Herbal (improve hair, skin, and nails; regulate glucose levels) | 24 | Hg | Poland | 2018 | ASA | [81] |
| Prenatal and children supplements | 10 | As | USA | 2014 | IC-ICP-MS | [82] |
| Prenatal vitamin supplements | 51 | As, Cd, Pb, Hg | Canada | 2018 | ICP-MS | [83] |
| Health clays products | 27 | As, Cd, Pb, Hg | Netherlands | 2013 | ICP-MS | [84] |
| Calcium supplements | 45 | Pb | USA | 2007 | ICP-MS | [85] |
| Shark cartilage powder | 16 | Cyanobacterial toxin (N-methylamino-L-alanine) and its isomers (2,4-diaminobutyric acid and N(2-aminoethy) glycine)), Hg | USA | 2014 | LC-FLD, LC–MS, CVAFS | [86] |
| Ginkgo | 9 | 250 toxic substances including pesticides (e.g., hymexazol, tebufenozide) and mycotoxins (e.g., aflatoxin B1, aflatoxin B2, T-2 toxin), Insecticides, Fungicides, Herbicides | Spain, Poland, USA | 2015 | LC-HRMS | [46] |
| Grape | 24 | Mycotoxin (Ochratoxin A) | Italy | 2015 | LC–FLD | [87] |
| Different plants (used for liver problems, menopause, for general health improvement) | 69 | 57 mycotoxins (e.g., zearalenone, enniatins) | Czech Republic, USA | 2015 | LC-MS | [88] |
| Brewer’s yeast | 51 | Mycotoxin (Ochratoxin A) | Germany | 2002 | LC-FLD | [89] |
| Blue green algae | 17 | Microcystins | Italy | 2012 | LC–MS, ELISA | [90] |
| Blue green algae and Chlorella | 18 | Microcystins | Germany | 2012 | PPIA, ELISA, LC–MS | [91] |
| Ginseng | 23 | Insecticide, Fungicides | USA | 2016 | GC-MS | [44] |
| Soya | 14 | Herbicides | Spain | 2016 | LC-MS | [92] |
| Fish, seal and vegetable | 30 | Insecticides | Canada | 2009 | GC-MS | [93] |
| Omega-3 | 9 | Polychlorinated dibenzo-p-dioxins | Spain | 2017 | GC-MS | [94] |
| Plant-based (weight loss) | 11 | Sibutramine and its analogues, phenolphthalein | China | 2008 | LC-MS | [95] |
| Plant-based (weight loss) | 24 | Sibutramine and its analogues, rimonabant, phenolphthalein | Netherland | 24 | LC-DAD-MS | [96] |
| Plant-based (naturally enhance sexual performance) | 74 | PDE-5 inhibitors and their analogues | USA | 2013 | LC-DAD-MS | [97] |
| Plant-based (enhance sexual potency) | 23 | PDE-5 inhibitors and their analogues | Netherland | 2013 | LC-DAD-MS | [98] |
| Tryptophan | 22 | Untargeted screening, Trp products generated during production, storage, transport | Poland | 2022 | LC-HRMS | Current study |
| Main of Ingredient Dietary Supplement | Year | Country of Sale | Dosage Form | Number of Supplements | Dissolution Test | The Average Percentage of Trp Amount Released from a Dosage Form (Dissolution Medium) | Reference |
|---|---|---|---|---|---|---|---|
| Calcium Carbonate | 1990 | USA | tablet | 27 | Yes | 5/27—below 75% (HCl pH 1.0) 4/27—between 33–75% (HCl pH 1.0) 18/27—less than 33% (HCl pH 1.0) | [13] |
| Melatonin | 1999 | USA | Immediate-release | 9 | Yes | 4/9 above 75% (HCl pH 1.0) | [14] |
| Controlled-release | 2 | ½ above 90% (HCl pH 1.0) | |||||
| Folic Acid | 2001 | United Kingdom | capsule tablet | 11 | Yes | 6/11—below 70% (0.1 M sodium hydroxide) 4/11—above 70% (0.1 M sodium hydroxide) | [15] |
| Folic Acid | 2009 | USA | tablet | 14 | 45.0% (NaCl, pH 1.5) 104.5% (phosphate buffer, pH 7.5) | [16] | |
| capsule | 1 | 15.2% (NaCl, pH 1.5) 47.4% (phosphate buffer, pH 7.5) | |||||
| Iron, zinc, manganase | 2016 | Poland | tablet | 4 | Yes | Iron—¼ above 80% (HCl, pH 1.2) Zinc—¼ above 80% (HCl, pH 1.2) Manganase—4/4–60% or less (HCl, pH 1.2) | [17] |
| Lutein | 2018 | Brazil USA | tablet | 4 | Yes | 41.7% (2% polysorbate 80) | [8] |
| capsule | 6 | 122.5% (2% polysorbate 80 with 25% ethanol) | |||||
| Triiodothyronine | 2019 | United Kingdom | tablet | 3 | Yes | Above 93.5% (fasted-state simulated gastric fluid) | [18] |
| Prehormone thyroxine | 2019 | United Kingdom | tablet | 1 | Yes | Above 97.4% (fasted-state simulated gastric fluid) | [18] |
| Grape seed extract | 2021 | USA | capsule | 1 | Yes | 73.09, 67.9, 71.06, 59.75% of gallic acid, catechin, procyanidin B2, and epicatechin, respectively (acetate buffer pH 4.6), 96.49, 89.09, 87.65, 78.84% of gallic acid, catechin, procyanidin B2, and epicatechinin, respectively (HCl pH 1.2) | [19] |
| Trans-resveratrol | 2021 | China | capsule | 1 | Yes | Above 75% (acetate buffer pH 4.6) Above 75% (HCl pH 1.2) | [19] |
| Tryptophan | 2022 | Poland | tablet | 10 | Yes | 48.5% (HCl, pH 1.2) 61.0% (phosphate buffer pH 6.8) | Current study |
| capsule | 12 | 46.1% (HCl, pH 1.2) 38.2% (phosphate buffer pH 6.8) |
References
- Cerezo, A.B.; Leal, Á.; Álvarez-Fernández, M.A.; Hornedo-Ortega, R.; Troncoso, A.M.; García-Parrilla, M.C. Quality control and determination of melatonin in food supplements. J. Food Compos. Anal. 2016, 45, 80–86. [Google Scholar] [CrossRef]
- EC. Directive 2002/46/EC of the European parliament and of the council of 10 June 2002 on the approximation of the laws of the member states relating to food supplements. Off. J. Eur. Communities Legis. 2002, 45, 51–57. [Google Scholar]
- FDA. Dietary Supplement Health and Education Act of 1994; FDA: St. Louis, MO, USA, 1995; Volume 1. [Google Scholar]
- Moret, S.; Prevarin, A.; Tubaro, F. Levels of creatine, organic contaminants and heavy metals in creatine dietary supplements. Food Chem. 2011, 126, 1232–1238. [Google Scholar] [CrossRef]
- Tumir, H.; Bošnir, J.; Vedrina-Dragojević, I.; Dragun, Z.; Tomić, S.; Puntarić, D.; Jurak, G. Monitoring of metal and metalloid content in dietary supplements on the Croatian market. Food Control 2010, 21, 885–889. [Google Scholar] [CrossRef]
- Andrews, K.W.; Roseland, J.M.; Gusev, P.A.; Palachuvattil, J.; Dang, P.T.; Savarala, S.; Han, F.; Pehrsson, P.R.; Douglass, L.W.; Dwyer, J.T.; et al. Analytical ingredient content and variability of adult multivitamin/mineral products: National estimates for the dietary supplement ingredient database. Am. J. Clin. Nutr. 2017, 105, 526–539. [Google Scholar] [CrossRef]
- De Ceglie, C.; Calvano, C.D.; Zambonin, C.G. MALDI-TOF MS for quality control of high protein content sport supplements. Food Chem. 2015, 176, 396–402. [Google Scholar] [CrossRef] [PubMed]
- Anselmo, C.S.; Mendes, T.C.; Cabral, L.M.; Sousa, V.P. Physicochemical quality profiles of commercial oral tablets and capsules containing lutein—Impact of insufficient specific sanitary regulations. An. Acad. Bras. Cienc. 2018, 90, 3063–3073. [Google Scholar] [CrossRef] [PubMed] [Green Version]
- Kowalski, A.; Frankowski, M. Levels and potential health risks of mercury in prescription, non-prescription medicines and dietary supplements in Poland. Regul Toxicol. Pharm. 2015, 73, 396–400. [Google Scholar] [CrossRef] [PubMed]
- Martinez-Sanz, J.M.; Sospedra, I.; Ortiz, C.M.; Baladia, E.; Gil-Izquierdo, A.; Ortiz-Moncada, R. Intended or unintended doping? A review of the presence of doping substances in dietary supplements used in sports. Nutrients 2017, 9, 1093. [Google Scholar] [CrossRef] [PubMed] [Green Version]
- Fernandes, A.R.; Rose, M.; White, S.; Mortimer, D.; Gem, M. Dioxins and polychlorinated biphenyls (PCBs) in fish oil dietary supplements: Occurrence and human exposure in the UK. Food Addit. Contam. 2006, 23, 939–947. [Google Scholar] [CrossRef] [Green Version]
- Bengtson Nash, S.M.; Schlabach, M.; Nichols, P.D. A nutritional-toxicological assessment of Antarctic krill oil versus fish oil dietary supplements. Nutrients 2014, 6, 3382–3402. [Google Scholar] [CrossRef] [PubMed] [Green Version]
- Brennan, M.J.; Duncan, W.E.; Wartofsky, L.; Butler, V.M.; Wray, H.L. In vitro dissolution of calcium carbonate preparations. Calcif. Tissue Int. 1991, 49, 308–312. [Google Scholar] [CrossRef] [PubMed]
- Hahm, H.; Kujawa, J.; Augsburger, L. Comparison of melatonin products against USP’s nutritional supplements standards and other criteria. J. Am. Pharm. Assoc. 1999, 39, 27–31. [Google Scholar] [CrossRef]
- Sculthorpe, N.; Davies, B.; Ashton, T.; Allison, S.; McGuire, D.; Malhi, J. Commercially available folic acid supplements and their compliance with the British pharmacopoeia test for dissolution. J. Public Health 2001, 23, 195–197. [Google Scholar] [CrossRef] [PubMed] [Green Version]
- Younis, I.R.; Stamatakis, M.K.; Callery, P.S.; Meyer-Stout, P.J. Influence of pH on the dissolution of folic acid supplements. Int. J. Pharm. 2009, 367, 97–102. [Google Scholar] [CrossRef]
- Blicharska, E.; Szczęsna, B.; Kocjan, R.; Gumieniczek, A.; Komsta, Ł. Analysis of dissolution profiles of iron, zinc, and manganese from complex dietary supplements by ion chromatography and chemometrics. J. Liq. Chromatogr. Relat. Technol. 2016, 39, 30–34. [Google Scholar] [CrossRef]
- Bowerbank, S.L.; Carlin, M.G.; Dean, J.R. Dissolution testing of single-and dual-component thyroid hormone supplements. Separations 2019, 6, 18. [Google Scholar] [CrossRef] [Green Version]
- Lyu, W.; Omar, T.; Patel, H.; Rodriguez, D.; Ferruzzi, M.G.; Pasinetti, G.M.; Murrough, J.W.; Muzzio, F.J.; Simon, J.E.; Wu, Q. Dissolution study on grape polyphenol hard gelatin capsule dietary supplements. Front. Nutr. 2021, 8, 780260. [Google Scholar] [CrossRef] [PubMed]
- Palaric, C.; Pilard, S.; Fontaine, J.-X.; Cailleu, D.; Mesnard, F.; Renaud, T.; Petit, A.; Molinié, R. Combined MS-NMR approach for the quality control of food supplements containing amino acids. Food Control 2018, 88, 217–228. [Google Scholar] [CrossRef]
- Dwyer, J.T.; Coates, P.M.; Smith, M.J. Dietary supplements: Regulatory challenges and research resources. Nutrients 2018, 10, 41. [Google Scholar] [CrossRef] [PubMed] [Green Version]
- Marozoff, S.; Veugelers, P.J.; Dabravolskaj, J.; Eurich, D.T.; Ye, M.; Maximova, K. Diet quality and health service utilization for depression: A prospective investigation of adults in alberta’s tomorrow project. Nutrients 2020, 12, 2437. [Google Scholar] [CrossRef] [PubMed]
- Park, S.J.; Lee, D.K.; Kim, B.; Na, K.S.; Lee, C.H.; Son, Y.D.; Lee, H.J. The association between omega-3 fatty acid intake and human brain connectivity in middle-aged depressed women. Nutrients 2020, 12, 2191. [Google Scholar] [CrossRef] [PubMed]
- Galts, C.P.C.; Bettio, L.E.B.; Jewett, D.C.; Yang, C.C.; Brocardo, P.S.; Rodrigues, A.L.S.; Thacker, J.S.; Gil-Mohapel, J. Depression in neurodegenerative diseases: Common mechanisms and current treatment options. Neurosci. Biobehav. Rev. 2019, 102, 56–84. [Google Scholar] [CrossRef]
- Lieberman, H.R.; Agarwal, S.; Fulgoni, V.L., 3rd. Tryptophan intake in the US adult population is not related to liver or kidney function but is associated with depression and sleep outcomes. J. Nutr. 2016, 146, 2609S–2615S. [Google Scholar] [CrossRef] [PubMed] [Green Version]
- Palego, L.; Betti, L.; Rossi, A.; Giannaccini, G. Tryptophan biochemistry: Structural, nutritional, metabolic, and medical aspects in humans. J. Amino Acids 2016, 2016, 8952520. [Google Scholar] [CrossRef] [PubMed] [Green Version]
- Fukuwatari, T. Possibility of amino acid treatment to prevent the psychiatric disorders via modulation of the production of tryptophan metabolite kynurenic acid. Nutrients 2020, 12, 1403. [Google Scholar] [CrossRef] [PubMed]
- Soh, N.L.; Walter, G. Tryptophan and depression: Can diet alone be the answer? Acta Neuropsychiatr. 2014, 23, 3–11. [Google Scholar] [CrossRef]
- Samad, N.; Yasmin, F.; Manzoor, N. Biomarkers in drug free subjects with depression: Correlation with tryptophan. Psychiatry Investig. 2019, 16, 948–953. [Google Scholar] [CrossRef] [PubMed]
- Jenkins, T.A.; Nguyen, J.C.; Polglaze, K.E.; Bertrand, P.P. Influence of tryptophan and serotonin on mood and cognition with a possible role of the gut-brain axis. Nutrients 2016, 8, 56. [Google Scholar] [CrossRef]
- Binks, H.; Vincent, G.E.; Gupta, C.; Irwin, C.; Khalesi, S. Effects of Diet on Sleep: A Narrative Review. Nutrients 2020, 12, 936. [Google Scholar] [CrossRef] [Green Version]
- Strasser, B.; Fuchs, D. Diet versus Exercise in Weight Loss and Maintenance: Focus on Tryptophan. Int. J. Tryptophan Res. 2016, 9, 9–16. [Google Scholar] [CrossRef] [PubMed] [Green Version]
- Gibson, E.L. Tryptophan supplementation and serotonin function: Genetic variations in behavioural effects. Proc. Nutr. Soc. 2018, 77, 174–188. [Google Scholar] [CrossRef] [PubMed] [Green Version]
- Thomas, S.R. l-Tryptophan as an antidepressive agent in the management of treatment-resistant unipolar depression in borderline personality disorder: Three case reports. Adv. Integr. Med. 2015, 2, 68–71. [Google Scholar] [CrossRef]
- European Parliament; Council of the European Union. Regulation (EU) No 609/2013 of the European parliament and of the council of 12 June 2013 on food intended for infants and young children, food for special medical purposes, and total diet replacement for weight control and repealing council directive 92/52/EEC, commission directives 96/8/EC, 1999/21/EC, 2006/125/EC and 2006/141/EC, directive 2009/39/EC of the European parliament and of the council and commission regulations (EC) No 41/2009 and (EC) No 953/2009. Off. J. Eur. Union 2013, 181, 35–56. [Google Scholar]
- Simat, T.J.; Kleeberg, K.K.; Müller, B.; Sierts, A. Contamination of commercially available L-tryptophan by related substances. Eur. Food Res. Technol. 2003, 216, 241–252. [Google Scholar] [CrossRef]
- Bellmaine, S.; Schnellbaecher, A.; Zimmer, A. Reactivity and degradation products of tryptophan in solution and proteins. Free. Radic. Biol. Med. 2020, 160, 696–718. [Google Scholar] [CrossRef] [PubMed]
- Sheng, X.; Himo, F. Enzymatic pictet-spengler reaction: Computational study of the mechanism and enantioselectivity of norcoclaurine synthase. J. Am. Chem. Soc. 2019, 141, 11230–11238. [Google Scholar] [CrossRef]
- Simat, T.; Van Wickern, B.; Eulitz, K.; Steinhart, H. Contaminants in biotechnologically manufactured L-tryptophan. J. Chromatogr. B Biomed. Sci. Appl. 1996, 685, 41–51. [Google Scholar] [CrossRef]
- Zelentsova, E.A.; Sherin, P.S.; Snytnikova, O.A.; Kaptein, R.; Vauthey, E.; Tsentalovich, Y.P. Photochemistry of aqueous solutions of kynurenic acid and kynurenine yellow. Photochem. Photobiol. Sci. 2013, 12, 546–558. [Google Scholar] [CrossRef] [PubMed] [Green Version]
- Gugliandolo, E.; Peritore, A.F.; Impellizzeri, D.; Cordaro, M.; Siracusa, R.; Fusco, R.; D’Amico, R.; Di Paola, R.; Schievano, C.; Cuzzocrea, S. Dietary supplementation with palmitoyl-glucosamine co-micronized with curcumin relieves osteoarthritis pain and benefits joint mobility. Animals 2020, 10, 1827. [Google Scholar] [CrossRef] [PubMed]
- Amaral, F.G.d.; Cipolla-Neto, J. A brief review about melatonin, a pineal hormone. Arch. Endocrinol. Metab. 2018, 62, 472–479. [Google Scholar] [CrossRef] [Green Version]
- Nieto-García, A.J.; Romero-González, R.; Frenich, A.G. Multi-pesticide residue analysis in nutraceuticals from grape seed extracts by gas chromatography coupled to triple quadrupole mass spectrometry. Food Control. 2015, 47, 369–380. [Google Scholar] [CrossRef]
- Chen, Y.; Lopez, S.; Hayward, D.G.; Park, H.Y.; Wong, J.W.; Kim, S.S.; Wan, J.; Reddy, R.M.; Quinn, D.J.; Steiniger, D. Determination of multiresidue pesticides in botanical dietary supplements using gas chromatography–Triple-quadrupole mass spectrometry (GC-MS/MS). J. Agric. Food Chem. 2016, 64, 6125–6132. [Google Scholar] [CrossRef] [PubMed]
- Martínez-Domínguez, G.; Romero-González, R.; Arrebola, F.J.; Frenich, A.G. Multi-class determination of pesticides and mycotoxins in isoflavones supplements obtained from soy by liquid chromatography coupled to orbitrap high resolution mass spectrometry. Food Control 2016, 59, 218–224. [Google Scholar] [CrossRef]
- Martinez-Dominguez, G.; Romero-Gonzalez, R.; Frenich, A.G. Determination of toxic substances, pesticides and mycotoxins, in ginkgo biloba nutraceutical products by liquid chromatography orbitrap-mass spectrometry. Microchem. J. 2015, 118, 124–130. [Google Scholar] [CrossRef]
- Yue, K.X.; Li, H.L.; Pi, Z.F.; Song, F.R.; Wang, Y.P.; Liu, Z.Y. Multi-residue screening of pesticides in panax ginseng CA meyer by ultra-high-performance liquid chromatography with quadrupole time-of-flight mass spectrometry. J. Sep. Science. 2022, 1–9. [Google Scholar] [CrossRef]
- Hou, X.; Liu, L.; Wei, L.; Feng, D.; Lv, M.; Wang, X.; Yu, X.; Lu, Z.; Hou, Z. A Novel Analysis Method for Simultaneous Determination of 31 Pesticides by High-Performance Liquid Chromatography-Tandem Mass Spectrometry in Ginseng. J. Anal. Methods Chem. 2022, 2022, 4208243. [Google Scholar] [CrossRef]
- Nasiri, M.; Ahmadzadeh, H.; Amiri, A. Sample preparation and extraction methods for pesticides in aquatic environments: A review. TrAC Trends Anal. Chem. 2020, 123, 115772. [Google Scholar] [CrossRef]
- Montone, C.M.; Moneta, B.G.; Aita, S.E.; Aulenta, F.; Cavaliere, C.; Cerrato, A.; Fazi, S.; Laganà, A.; Paolini, V.; Petracchini, F. Untargeted analysis of contaminants in river water samples: Comparison between two different sorbents for solid-phase extraction followed by liquid chromatography-high-resolution mass spectrometry determination. Microchem. J. 2022, 172, 106979. [Google Scholar] [CrossRef]
- Nemati, M.; Tuzen, M.; Farazajdeh, M.A.; Kaya, S.; Mogaddam, M.R.A. Development of dispersive solid-liquid extraction method based on organic polymers followed by deep eutectic solvents elution; application in extraction of some pesticides from milk samples prior to their determination by HPLC-MS/MS. Anal. Chim. Acta 2022, 1199, 339570. [Google Scholar] [CrossRef]
- Zohrabi, P.; Shamsipur, M.; Hashemi, M.; Hashemi, B. Liquid-phase microextraction of organophosphorus pesticides using supramolecular solvent as a carrier for ferrofluid. Talanta 2016, 160, 340–346. [Google Scholar] [CrossRef] [PubMed]
- Alvi, T.; Asif, Z.; Khan, M.K.I. Clean label extraction of bioactive compounds from food waste through microwave-assisted extraction technique-A review. Food Biosci. 2022, 46, 101580. [Google Scholar] [CrossRef]
- Moret, S.; Scolaro, M.; Barp, L.; Purcaro, G.; Conte, L.S. Microwave assisted saponification (MAS) followed by on-line liquid chromatography (LC)—Gas chromatography (GC) for high-throughput and high-sensitivity determination of mineral oil in different cereal-based foodstuffs. Food Chem. 2016, 196, 50–57. [Google Scholar] [CrossRef] [PubMed]
- Zhou, Z.; Zhang, J.; Zhang, W.; Bai, Y.; Liu, H. Rapid screening for synthetic antidiabetic drug adulteration in herbal dietary supplements using direct analysis in real time mass spectrometry. Analyst 2011, 136, 2613–2618. [Google Scholar] [CrossRef]
- Patel, D.N.; Li, L.; Kee, C.-L.; Ge, X.; Low, M.-Y.; Koh, H.-L. Screening of synthetic PDE-5 inhibitors and their analogues as adulterants: Analytical techniques and challenges. J. Pharm. Biomed. Anal. 2014, 87, 176–190. [Google Scholar] [CrossRef] [PubMed]
- Haller, C.A.; Benowitz, N.L. Adverse cardiovascular and central nervous system events associated with dietary supplements containing ephedra alkaloids. N. Engl. J. Med. 2000, 343, 1833–1838. [Google Scholar] [CrossRef] [PubMed]
- Schymanski, E.L.; Jeon, J.; Gulde, R.; Fenner, K.; Ruff, M.; Singer, H.P.; Hollender, J. Identifying small molecules via high resolution mass spectrometry: Communicating confidence. Environ. Sci. Technol. 2014, 48, 2097–2098. [Google Scholar] [CrossRef] [PubMed]
- Rochat, B. Proposed confidence scale and ID score in the identification of known-unknown compounds using high resolution MS data. J. Am. Soc. Mass Spectrom. 2017, 28, 709–723. [Google Scholar] [CrossRef] [PubMed]
- Jakubowska, E.; Ciepluch, N. Blend segregation in tablets manufacturing and its effect on drug content uniformity—A review. Pharmaceutics 2021, 13, 1909. [Google Scholar] [CrossRef]
- Farquharson, A.; Gladding, Z.; Ritchie, G.; Shende, C.; Cosgrove, J.; Smith, W.; Brouillette, C.; Farquharson, S. Drug content uniformity: Quantifying loratadine in tablets using a created raman excipient spectrum. Pharmaceutics 2021, 13, 309. [Google Scholar] [CrossRef]
- Khashaba, P.Y.; Abdelgaleel, M.; Derayea, S.M.; Nagi, D.M. Development of a simple validated spectrofluorometric method for the assay of midodrine in tablets dosage form; Application to content uniformity testing. Spectrochim. Acta Part A Mol. Biomol. Spectrosc. 2022, 273, 121046. [Google Scholar] [CrossRef] [PubMed]
- Ganzetti, R.; Logrippo, S.; Sestili, M.; Caraffa, A.; Cespi, M.; Pelliccioni, G.; Blasi, P.; Bonacucina, G. Tablet splitting in elderly patients with dementia: The case of quetiapine. Pharmaceutics 2021, 13, 1523. [Google Scholar] [CrossRef] [PubMed]
- Peeters, M.; Peeters, E.; De Leersnyder, F.; Van Hauwermeiren, D.; Cogoni, G.; Liu, Y.; De Beer, T. Determination and understanding of dynamic lead lag between in-line nir tablet press feed frame and off-line nir tablet measurements. In Proceedings of the 2019 AIChE Annual Meeting, Orlando, FL, USA, 12 November 2019. [Google Scholar]
- FDA. Dissolution Testing and Acceptance Criteria for Immediate-Release Solid Oral Dosage form Drug Products Containing High Solubility Drug Substances Guidance For Industry; FDA: Rockville, MD, USA, 2018. [Google Scholar]
- Yu, L.X.; Amidon, G.; Khan, M.A.; Hoag, S.W.; Polli, J.; Raju, G.; Woodcock, J. Understanding pharmaceutical quality by design. AAPS J. 2014, 16, 771–783. [Google Scholar] [CrossRef] [Green Version]
- Al-Gousous, J.; Langguth, P. Oral solid dosage form disintegration testing—The forgotten test. J. Pharm. Sci. 2015, 104, 2664–2675. [Google Scholar] [CrossRef] [PubMed] [Green Version]
- Gray, V.A. Power of the dissolution test in distinguishing a change in dosage form critical quality attributes. AAPS PharmSciTech 2018, 19, 3328–3332. [Google Scholar] [CrossRef] [PubMed] [Green Version]
- Binns, C.W.; Lee, M.K.; Lee, A.H. Problems and prospects: Public health regulation of dietary supplements. Annu. Rev. Public Health 2018, 39, 403–420. [Google Scholar] [CrossRef] [PubMed] [Green Version]
- Jędrejko, K.; Lazur, J.; Muszyńska, B. Risk associated with the use of selected ingredients in food supplements. Chem. Biodivers. 2021, 18, e2000686. [Google Scholar] [CrossRef] [PubMed]
- Moses, G. The safety of commonly used vitamins and minerals. Aust. Prescr. 2021, 44, 119. [Google Scholar] [CrossRef]
- Fibigr, J.; Šatínský, D.; Solich, P. Current trends in the analysis and quality control of food supplements based on plant extracts. Anal. Chim. Acta 2018, 1036, 1–15. [Google Scholar] [CrossRef] [PubMed]
- Rautiainen, S.; Manson, J.E.; Lichtenstein, A.H.; Sesso, H.D. Dietary supplements and disease prevention—A global overview. Nat. Rev. Endocrinol. 2016, 12, 407–420. [Google Scholar] [CrossRef] [PubMed]
- Costa, J.G.; Vidovic, B.; Saraiva, N.; do Ceu Costa, M.; Del Favero, G.; Marko, D.; Oliveira, N.G.; Fernandes, A.S. Contaminants: A dark side of food supplements? Free Radic. Res. 2019, 53, 1113–1135. [Google Scholar] [CrossRef] [PubMed]
- Garcia-Rico, L.; Leyva-Perez, J.; Jara-Marini, M.E. Content and daily intake of copper, zinc, lead, cadmium, and mercury from dietary supplements in Mexico. Food Chem. Toxicol. 2007, 45, 1599–1605. [Google Scholar] [CrossRef] [PubMed]
- Dolan, S.P.; Nortrup, D.A.; Bolger, P.M.; Capar, S.G. Analysis of dietary supplements for arsenic, cadmium, mercury, and lead using inductively coupled plasma mass spectrometry. J. Agric. Food Chem. 2003, 51, 1307–1312. [Google Scholar] [CrossRef] [PubMed]
- Levine, K.E.; Levine, M.A.; Weber, F.X.; Hu, Y.; Perlmutter, J.; Grohse, P.M. Determination of mercury in an assortment of dietary supplements using an inexpensive combustion atomic absorption spectrometry technique. J. Autom. Methods Manag. Chem. 2005, 2005, 211–216. [Google Scholar] [CrossRef] [PubMed] [Green Version]
- Hedegaard, R.V.; Rokkjær, I.; Sloth, J.J. Total and inorganic arsenic in dietary supplements based on herbs, other botanicals and algae—A possible contributor to inorganic arsenic exposure. Anal. Bioanal. Chem. 2013, 405, 4429–4435. [Google Scholar] [CrossRef] [PubMed]
- Araujo-Barbosa, U.; Peña-Vazquez, E.; Barciela-Alonso, M.C.; Ferreira, S.L.C.; Dos Santos, A.M.P.; Bermejo-Barrera, P. Simultaneous determination and speciation analysis of arsenic and chromium in iron supplements used for iron-deficiency anemia treatment by HPLC-ICP-MS. Talanta 2017, 170, 523–529. [Google Scholar] [CrossRef]
- Poniedziałek, B.; Niedzielski, P.; Kozak, L.; Rzymski, P.; Wachelka, M.; Rzymska, I.; Karczewski, J.; Rzymski, P. Monitoring of essential and toxic elements in multi-ingredient food supplements produced in European union. J. Consum. Prot. Food Saf. 2018, 13, 41–48. [Google Scholar] [CrossRef] [Green Version]
- Brodziak-Dopierała, B.; Fischer, A.; Szczelina, W.; Stojko, J. The content of mercury in herbal dietary supplements. Biol. Trace Elem. Res. 2018, 185, 236–243. [Google Scholar] [CrossRef] [PubMed] [Green Version]
- Wolle, M.M.; Rahman, G.M.; Pamuku, M. Speciation analysis of arsenic in prenatal and children’s dietary supplements using microwave-enhanced extraction and ion chromatography—Inductively coupled plasma mass spectrometry. Anal. Chim. Acta 2014, 818, 23–31. [Google Scholar] [CrossRef]
- Schwalfenberg, G.; Rodushkin, I.; Genuis, S.J. Heavy metal contamination of prenatal vitamins. Toxicol. Rep. 2018, 5, 390–395. [Google Scholar] [CrossRef] [PubMed]
- Reeuwijk, N.M.; KLerx, W.N.; Kooijman, M.; Hoogenboom, L.; Rietjens, I.M.; Martena, M.J. Levels of lead, arsenic, mercury and cadmium in clays for oral use on the Dutch market and estimation of associated risks. Food Addit. Contam. Part A 2013, 30, 1535–1545. [Google Scholar] [CrossRef] [PubMed]
- Kauffman, J.F.; Westenberger, B.J.; Robertson, J.D.; Guthrie, J.; Jacobs, A.; Cummins, S.K. Lead in pharmaceutical products and dietary supplements. Regul. Toxicol. Pharmacol. 2007, 48, 128–134. [Google Scholar] [CrossRef] [PubMed]
- Mondo, K.; Glover, W.B.; Murch, S.J.; Liu, G.; Cai, Y.; Davis, D.A.; Mash, D.C. Environmental neurotoxins β-N-methylamino-l-alanine (BMAA) and mercury in shark cartilage dietary supplements. Food Chem. Toxicol. 2014, 70, 26–32. [Google Scholar] [CrossRef] [PubMed]
- Solfrizzo, M.; Piemontese, L.; Gambacorta, L.; Zivoli, R.; Longobardi, F. Food coloring agents and plant food supplements derived from Vitis vinifera: A new source of human exposure to ochratoxin A. J. Agric. Food Chem. 2015, 63, 3609–3614. [Google Scholar] [CrossRef] [PubMed]
- Veprikova, Z.; Zachariasova, M.; Dzuman, Z.; Zachariasova, A.; Fenclova, M.; Slavikova, P.; Vaclavikova, M.; Mastovska, K.; Hengst, D.; Hajslova, J. Mycotoxins in plant-based dietary supplements: Hidden health risk for consumers. J. Agric. Food Chem. 2015, 63, 6633–6643. [Google Scholar] [CrossRef] [PubMed]
- Gareis, M. Ochratoxin a in brewer’s yeast used as nutrient supplement. Mycotoxin Res. 2002, 18, 128–131. [Google Scholar] [CrossRef] [PubMed]
- Vichi, S.; Lavorini, P.; Funari, E.; Scardala, S.; Testai, E. Contamination by microcystis and microcystins of blue–green algae food supplements (BGAS) on the italian market and possible risk for the exposed population. Food Chem. Toxicol. 2012, 50, 4493–4499. [Google Scholar] [CrossRef] [PubMed]
- Heussner, A.H.; Mazija, L.; Fastner, J.; Dietrich, D.R. Toxin content and cytotoxicity of algal dietary supplements. Toxicol. Appl. Pharmacol. 2012, 265, 263–271. [Google Scholar] [CrossRef] [Green Version]
- Domingos Alves, R.; Romero-González, R.; López-Ruiz, R.; Jiménez-Medina, M.; Garrido Frenich, A. Fast determination of four polar contaminants in soy nutraceutical products by liquid chromatography coupled to tandem mass spectrometry. Anal. Bioanal. Chem. 2016, 408, 8089–8098. [Google Scholar] [CrossRef] [PubMed]
- Rawn, D.F.; Breakell, K.; Verigin, V.; Nicolidakis, H.; Sit, D.; Feeley, M. Persistent organic pollutants in fish oil supplements on the Canadian market: Polychlorinated biphenyls and organochlorine insecticides. J. Food Sci. 2009, 74, T14–T19. [Google Scholar] [CrossRef] [PubMed]
- Garcia-Bermejo, A.; Herrero, L.; Gonzalez, M.-J.; Gomara, B. Occurrence and estimated dietary intake of PCBs and PCDD/Fs in functional foods enriched with omega-3 from Spain. J. Agric. Food Chem. 2017, 65, 3396–3405. [Google Scholar] [CrossRef] [PubMed]
- Wang, J.; Chen, B.; Yao, S. Analysis of six synthetic adulterants in herbal weight-reducing dietary supplements by LC electrospray ionization-MS. Food Addit. Contam. 2008, 25, 822–830. [Google Scholar] [CrossRef] [PubMed]
- Reeuwijk, N.M.; Venhuis, B.J.; de Kaste, D.; Hoogenboom, R.L.; Rietjens, I.M.; Martena, M.J. Active pharmaceutical ingredients detected in herbal food supplements for weight loss sampled on the Dutch market. Food Addit. Contam. Part A 2014, 31, 1783–1793. [Google Scholar] [CrossRef] [PubMed]
- Campbell, N.; Clark, J.P.; Stecher, V.J.; Thomas, J.W.; Callanan, A.C.; Donnelly, B.F.; Goldstein, I.; Kaminetsky, J.C. Adulteration of purported herbal and natural sexual performance enhancement dietary supplements with synthetic phosphodiesterase type 5 inhibitors. J. Sex. Med. 2013, 10, 1842–1849. [Google Scholar] [CrossRef] [PubMed]
- Reeuwijk, N.M.; Venhuis, B.J.; de Kaste, D.; Hoogenboom, L.; Rietjens, I.M.; Martena, M.J. Sildenafil and analogous phosphodiesterase type 5 (PDE-5) inhibitors in herbal food supplements sampled on the Dutch market. Food Addit. Contam. Part A 2013, 30, 2027–2034. [Google Scholar] [CrossRef] [PubMed]


| Code | Formula | Neutral Mass Calculated from the Formula [Da] | Neutral Mass Calculated from the Measured m/z [Da] | ΔMass [ppm] | RT [min] | Identification Confidence Level | Fragments [m/z] | Dietary Supplements Containing Contaminant (% of the Analysed) | Tentative Name | % of the Main Ingredient Area |
|---|---|---|---|---|---|---|---|---|---|---|
| I1 | C8H7N | 117.05785 | 117.05792 | 0.6 | 5.0 | 3 | 91.05414 | All, (100%) | Indole | 23.19 |
| I2 | C9H9N | 131.07350 | 131.07350 | 0.0 | 5.0 | 2 | 117.06720; 130.06493; 131.07260 | All (100%) | Skatole | 6.68 |
| I3 | C8H7NO | 133.05276 | 133.05243 | 2.5 | 3.1 | 2 | 79.05412; 106.06493 | C1; C2; C8; C9; T1; T3; T4; T6; T7; T8; T9; T10 (55%) | Oxindole | 2.41 |
| I4 | C7H7NO2 | 137.04768 | 137.04766 | 0.2 | 3.1 | 2 | 92.04936; 94.06511; 110.06001 | C8; C9; T1; T3; T5; T6; T7; T8; T9; T10 (45%) | Anthranilic acid | 0.42 |
| I5 | C9H7NO | 145.05276 | 145.05284 | 0.6 | 5.0 | 2 | 91.05412; 117.05762; 118.06503 | All (100%) | 3-formylindole | 43.89 |
| I6 | C9H9NO | 147.06841 | 147.06827 | 1.0 | 3.9 | 3 | 120.04422; 130.03930; 130.06487 | T6 (4.5%) | 2,3-dihydro-4-quinolone | 0.02 |
| I7 | C10H9NO | 159.06841 | 159.06845 | 0.3 | 5.0 | 2 | 130.06490; 132.080610; 142.06616 | All (100%) | Indole-3-acetaldehyde | 2.50 |
| I8 | C10H10N2O | 174.07931 | 174.07924 | 0.4 | 3.9 | 3 | 132.04401; 147.09129; 157.07565 | C1, C2, C3, C4, C5, C6, C7, C8, C10, C11, C12, T1, T2, T3, T4, T5, T6, T7, T8, T9, T10 (95%) | 1-Phenyl-3-methyl-5-pyrazolone | 0.20 |
| I9 | C10H9NO2 | 175.06333 | 175.06326 | 0.4 | 3.9 | 2 | 130.06479; 146.05980; 158.05960 | C7, C11, T1, T2, T3, T4, T6, T7, T8, T8 (45%) | Indole acetic acid | 0.15 |
| I10 | C6H13NO5 | 179.07937 | 179.07938 | 0.1 | 3.1 | 1 | 127.03854; 144.06540; 145.04945 | C8, T3 (9%) | Glucosamine | 0.07 |
| I11 | C10H7NO3 | 189.04259 | 189.04239 | 1.1 | 8.5 | 2 | 162.05463; 172.03886; 173.04672 | T4, T6 (9%) | Kynurenic acid | 2.33 |
| I12 | C10H9NO3 | 191.05824 | 191.05811 | 0.7 | 4.0 | 3 | 150.05463; 164.07000; 174.05472 | C4, C5, C7, C8, C9, C10, C11, C12, T1, T2, T3, T4, T6, T7, T8, T9, T10 (77%) | Kynurenine yellow | 0.03 |
| I13 | C11H10N202 | 202.07423 | 202.07414 | 0.4 | 3.9 | 3 | 130.06480; 157.07570; 185.07106 | C1, C2, C3, C5, C7, C8, C9, C10, C12, T1, T2, T3, T4, T5, T6, T7, T10 (77%) | Unsaturated Trp | 0.38 |
| I14 | C11H9NO3 | 203.05824 | 203.05849 | 1.2 | 3.9 | 3 | 160.07555; 176.07080; 186.05499 | C1, C2, C3, C4, C5, C6, C7, C8, C9, C10, C11, C12, T2, T3, T5, T6, T7, T8, T9, T10 (91%) | Indole pyruvic acid | 0.03 |
| I15 | C12H12N2O2 | 216.08988 | 216.08986 | 0.1 | 8.0 | 3 | 171.09120; 173.10748; 188.07051 | C2, C4, C6, C7, C8, C9, C11, C12, T1, T2, T3, T4, T5, T6, T7, T8, T9, T10 (82%) | Tetrahydro-β-carboline-3-carboxylic acid | 0.23 |
| I16 | C11H12N2O3 | 220.08479 | 220.08467 | 0.5 | 3.9 | 2 | 130.06488; 158.05981; 175.08636 | All (100%) | 5-hydroxyTrp | 0.18 |
| I17 | C13H14N2O2 | 230.10553 | 230.10533 | 0.9 | 8.2 | 3 | 168.08034; 188.07034; 214.08580 | C2, C8, C9, C11, T1, T2, T3, T4, T5, T6, T7, T8, T9 (59%) | 1-methyl-tetrahydro-β-carboline-3-carboxylic acid | 0.02 |
| I18 | C13H16N2O2 | 232.12118 | 232.12099 | 0.8 | 9.1 | 1 | 174.09070; 204.10060; 216.10116 | C9 (4.5%) | Melatonin | 1.62 |
| I19 | C11H12N2O4 | 236.07971 | 236.07932 | 1.6 | 3.9 | 3 | 146.05975; 173.06980; 203.08099 | All (100%) | n-formylkynurenine | 0.49 |
| I20 | C20H19N3O2 | 333.14773 | 333.14739 | 1.0 | 8.8 | 3 | 188.07037; 205.09702; 217.09743 | C1, C2, C3, C4, C5, C6, C7, C8, C9, C10, C11, T1, T2, T3, T4, T5, T6, T7, T8, T9, T10 (95%) | 2-(3-Methyleneindole)Trp | 0.02 |
| I21 | C21H19N3O2 | 345.14773 | 345.14745 | 0.8 | 9.0 | 3 | 283.12204; 285.13794; 329.12610 | C1, C2, C3, C4, C5, C6, C7, C8, C9, C10, C11, T1, T2, T3, T4, T5, T6, T7, T8, T9, T10 (95%) | 1-(3-methyleneindole)-tetrahydro-β-carboline -3-carboxylic acid | 0.10 |
| I22 | C22H23N3O4 | 393.16886 | 393.16878 | 0.2 | 8.5 | 3 | 251.31799; 277.11810; 358.15448 | C1, C2, C3, C4, C5, C6, C7, C8, C9, C10, C11, T1, T2, T3, T4, T5, T6, T7, T8, T9, T10 (95%) | 1-(2-Trp)-1-(3-indole)propane diol | 0.03 |
| Code | Dosage Form | Source | Declared Trp Content [mg/unit] | Determined Trp Content [mg/unit] a | Maximum Error [%] |
|---|---|---|---|---|---|
| C1 | capsule | United Kingdom | 250 | 205 (CV = 5.0%) | −21 |
| C2 b | capsule | France | 220 | 221 (CV = 19%) | −21 |
| C3 | capsule | United States | 500 | 398 (CV = 4.1%) | −24 |
| C4 | capsule | Poland | 500 | 368 (CV = 4.1%) | −29 |
| C5 | capsule | Poland | 500 | 415 (CV = 13%) | −27 |
| C6 | capsule | No label | 500 | 277 (CV = 32%) | −74 |
| C7 | capsule | Czech Republic | 160 | 143 (CV = 16%) | −29 |
| C8 | capsule | Germany | 50 | 29.8 (CV = 6.6%) | −47 |
| C9 | capsule | Poland | 100 | 77.3 (CV = 8.4%) | −32 |
| C10 | capsule | United Kingdom | 500 | 432 (CV = 5.4%) | −19 |
| C11 | capsule | United States | 500 | 350 (CV = 14%) | −44 |
| C12 | capsule | United States | 500 | 443 (CV = 8.7%) | −20 |
| T1 | tablet | Poland | 100 | 72.6 (CV = 10%) | −32 |
| T2 | tablet | United States | 1000 | 870 (CV = 35%) | −48 |
| T3 | tablet | Poland | 40 | 32.6 (CV = 14%) | −27 |
| T4 | tablet | Poland | 100 | 71.4 (CV = 7.0%) | −33 |
| T5 | tablet | Poland | 167 | 115.5 (CV = 7.1%) | −36 |
| T6 | tablet | Poland | 50 | 37.0 (CV = 9.0%) | −33 |
| T7 | tablet | Poland | 50 | 41.4 (CV = 8.1%) | −24 |
| T8 | tablet | Poland | 50 | 41.1 (CV = 16%) | −29 |
| T9 | tablet | Poland | 50 | 37.1 (CV = 3.6%) | −29 |
| T10 | tablet | No label | 200 | 155 (CV = 15%) | −35 |
| Code | The Average Percentage of Trp Amount Released from a Dosage Form (Standard Deviation n = 6) | Expanded Uncertainty Parameters | ||||||
|---|---|---|---|---|---|---|---|---|
| pH 1.2 | pH 6.8 | |||||||
| pH 1.2 | pH 6.8 | Equal a | Equal a | |||||
| C1 | 60 (11) | 66.0 (8.1) | 55.38 | 25.29 | No | 39.99 | 136.07 | Yes |
| C2 | 2.65 (0.55) | 2.3 (2.2) | 215.43 | 48.12 | No | 216.31 | 8.53 | No |
| C3 | 3.08 (0.76) | 4.8 (2.6) | 382.17 | 19.07 | No | 373.66 | 57.22 | No |
| C4 | 53 (13) | 41.2 (3.8) | 100.87 | 52.04 | No | 162.59 | 117.62 | No |
| C5 | 36.2 (7.5) | 17.9 (3.7) | 234.17 | 68.74 | No | 325.37 | 113.25 | No |
| C6 | 84.3 (8.3) | 76.4 (2.2) | 144.78 | 187.05 | Yes | 105.26 | 233.65 | Yes |
| C7 | 81 (18) | 40.6 (3.3) | 13.18 | 37.53 | Yes | 77.73 | 9.87 | No |
| C8 | 17.9 (1.8) | 15.58 (0.70) | 20.81 | 3.89 | No | 21.98 | 0.29 | No |
| C9 | 75.5 (3.1) | 46.6 (6.6) | 1.75 | 10.06 | Yes | 30.65 | 15.13 | No |
| C10 | 90.4 (9.4) | 68.9 (7.3) | 19.93 | 49.18 | Yes | 87.62 | 435.58 | Yes |
| C11 | 1.22 (0.31) | 60.2 (8.1) | 344.27 | 80.11 | No | 49.64 | 541.99 | Yes |
| C12 | 47.7 (5.8) | 18.0 (1.5) | 204.17 | 55.25 | No | 352.75 | 17.95 | No |
| T1 | 71.9 (9.1) | 78.0 (5.1) | 0.7 | 11.42 | Yes | 5.41 | 9.64 | Yes |
| T2 | 77.9 (5.4) | 76.0 (5.7) | 91.2 | 355.46 | Yes | 109.37 | 1071.86 | Yes |
| T3 | 27 (16) | 21.3 (6.9) | 21.9 | 7.22 | No | 24.12 | 3.37 | No |
| T4 | 54.1 (12.2) | 79.3 (8.8) | 17.3 | 11.55 | No | 7.93 | 26.61 | Yes |
| T5 | 22.8 (2.9) | 39.3 (6.2) | 77.3 | 10.29 | No | 49.75 | 36.69 | No |
| T6 | 32.9 (4.9) | 59.9 (6.1) | 20.5 | 4.31 | No | 7.01 | 3.94 | No |
| T7 | 12.1 (1.0) | 26.1 (2.4) | 35.3 | 3.87 | No | 28.37 | 1.06 | No |
| T8 | 47.7 (3.6) | 68.3 (5.0) | 17.3 | 7.84 | No | 6.80 | 2.85 | No |
| T9 | 67.4 (7.1) | 80.0 (5.9) | 3.4 | 3.26 | No | 2.76 | 3.74 | Yes |
| T10 | 71.0 (7.0) | 81.4 (2.9) | 13.3 | 28.43 | Yes | 7.49 | 11.42 | Yes |
Publisher’s Note: MDPI stays neutral with regard to jurisdictional claims in published maps and institutional affiliations. |
© 2022 by the authors. Licensee MDPI, Basel, Switzerland. This article is an open access article distributed under the terms and conditions of the Creative Commons Attribution (CC BY) license (https://creativecommons.org/licenses/by/4.0/).
Share and Cite
Stępień, K.A.; Giebułtowicz, J. Application of Liquid Chromatography Coupled to Mass Spectrometry in Quality Assessment of Dietary Supplements—A Case Study of Tryptophan Supplements: Release Assay, Targeted and Untargeted Studies. Pharmaceuticals 2022, 15, 448. https://doi.org/10.3390/ph15040448
Stępień KA, Giebułtowicz J. Application of Liquid Chromatography Coupled to Mass Spectrometry in Quality Assessment of Dietary Supplements—A Case Study of Tryptophan Supplements: Release Assay, Targeted and Untargeted Studies. Pharmaceuticals. 2022; 15(4):448. https://doi.org/10.3390/ph15040448
Chicago/Turabian StyleStępień, Krzysztof Adam, and Joanna Giebułtowicz. 2022. "Application of Liquid Chromatography Coupled to Mass Spectrometry in Quality Assessment of Dietary Supplements—A Case Study of Tryptophan Supplements: Release Assay, Targeted and Untargeted Studies" Pharmaceuticals 15, no. 4: 448. https://doi.org/10.3390/ph15040448