

Quantitative Mass Spectrometry Imaging of Bleomycin in Skin Using a Mimetic Tissue Model for Calibration
 , and
, and 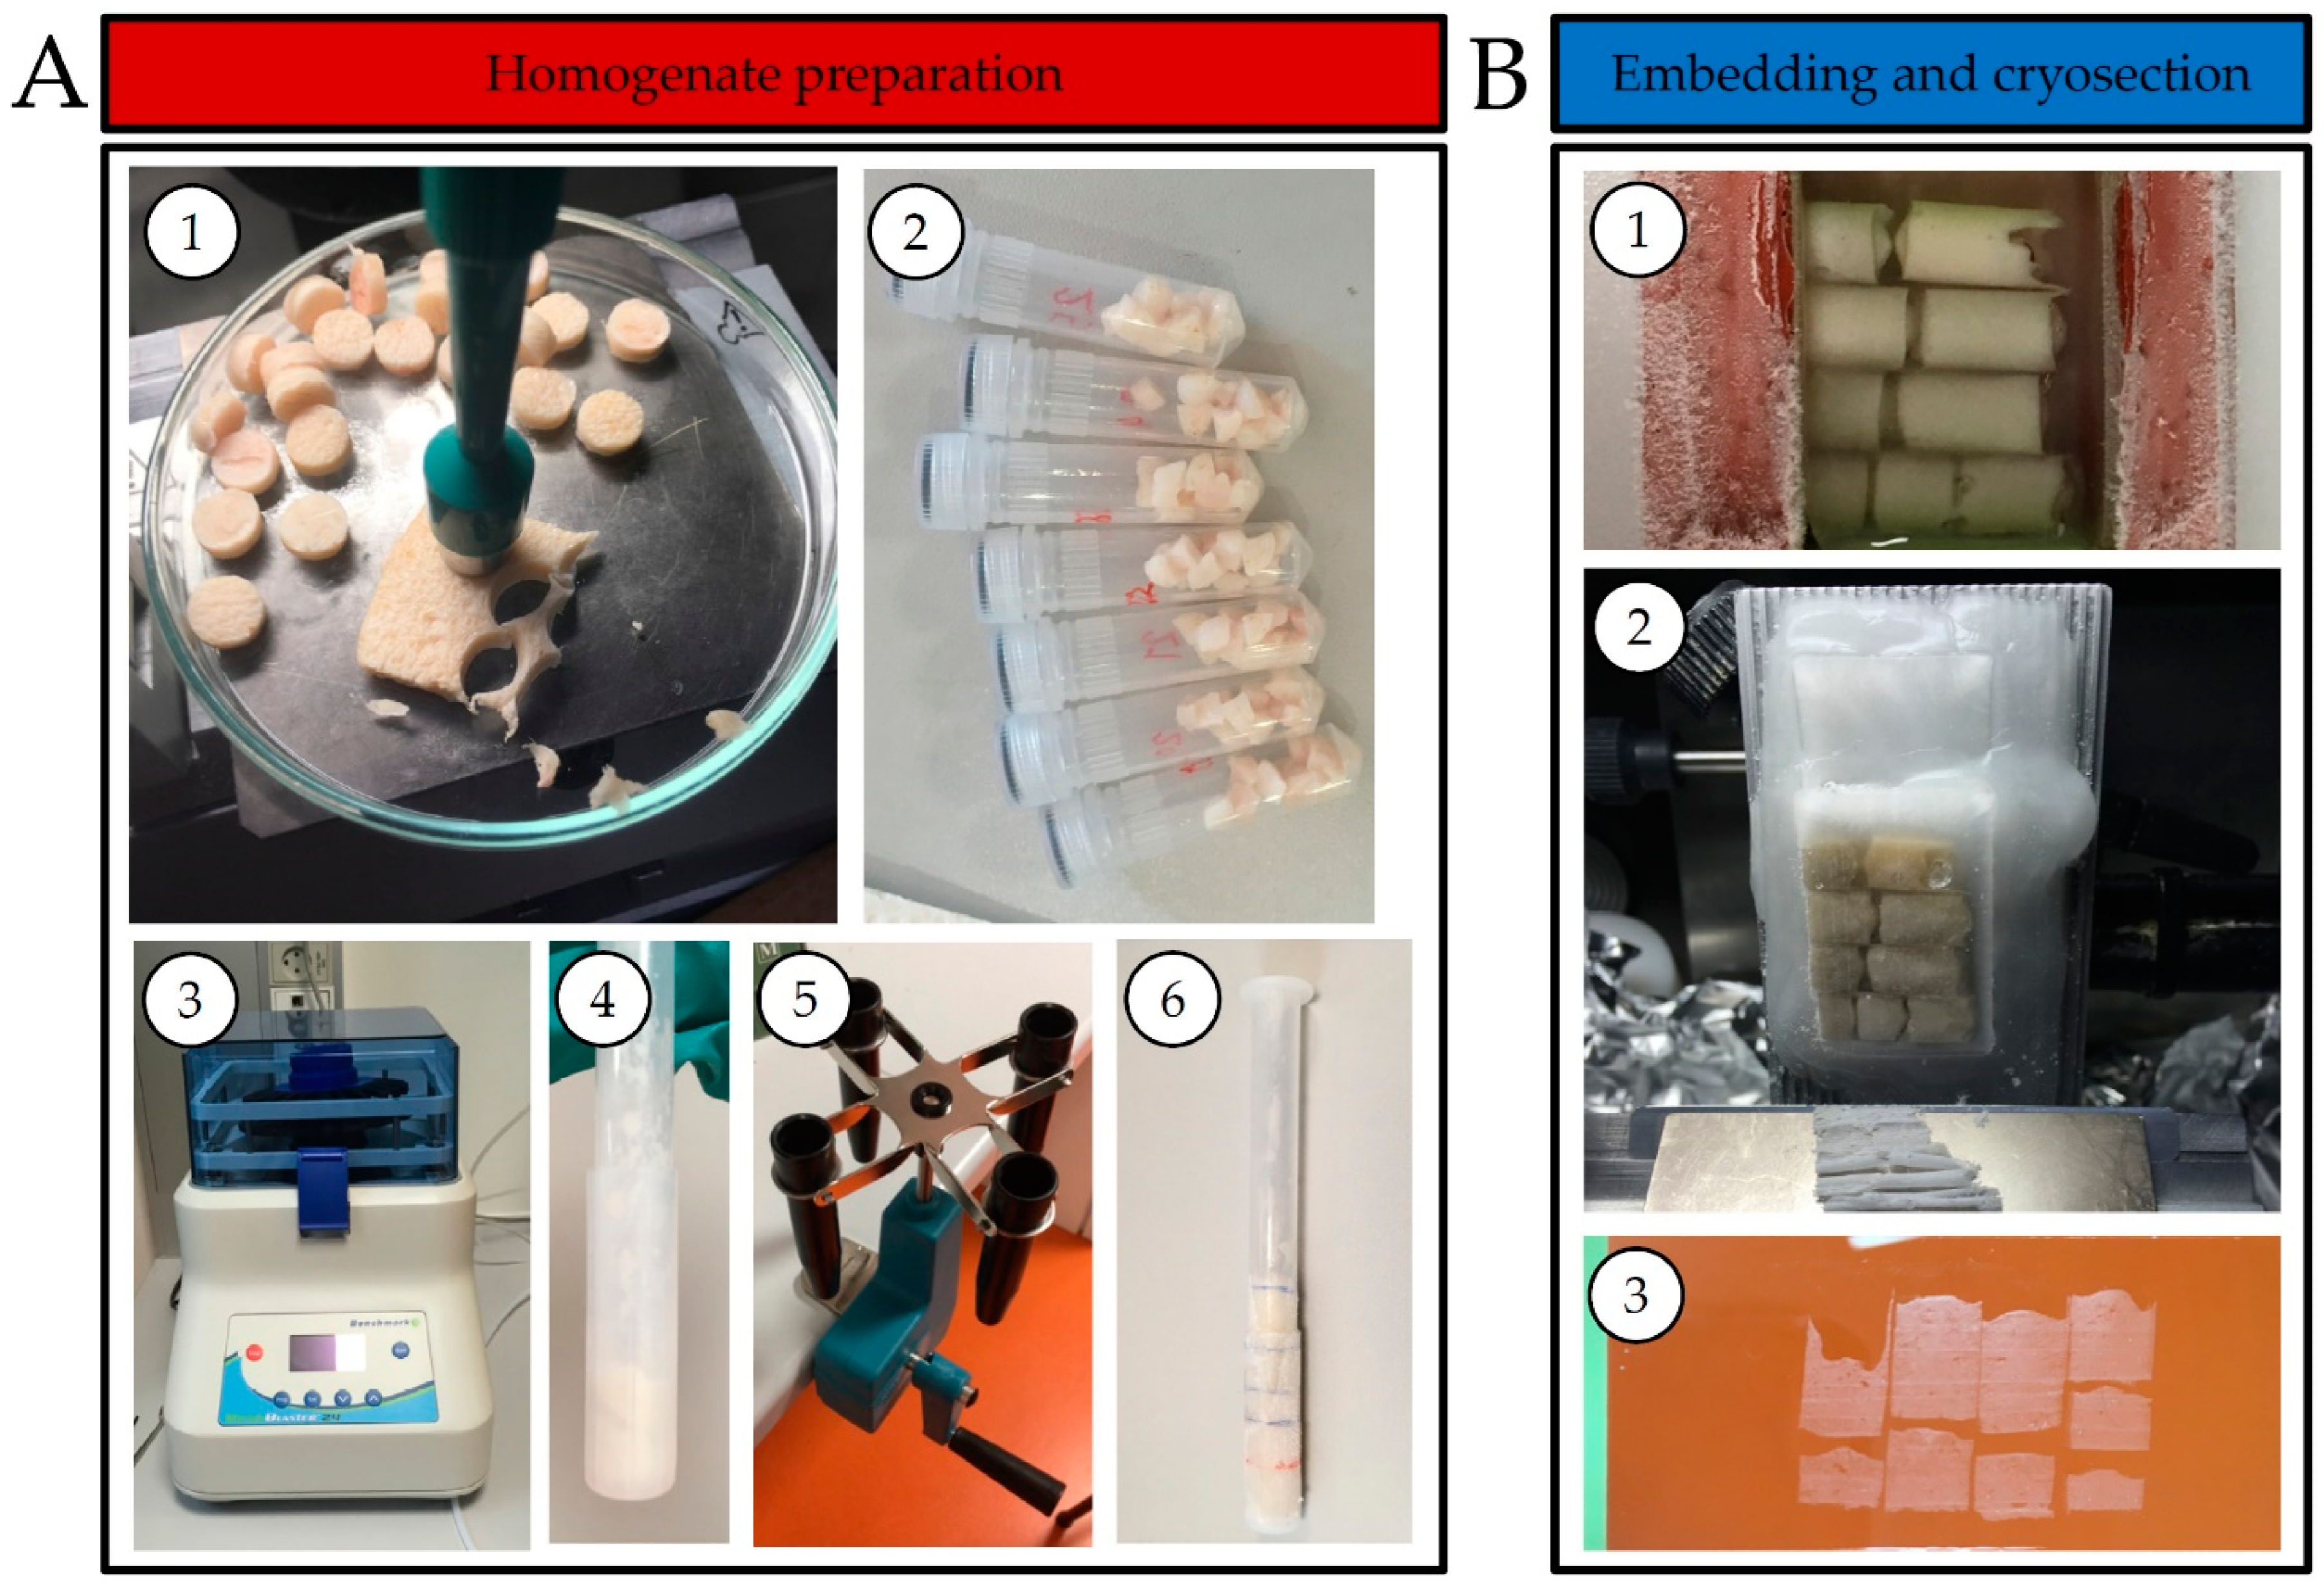
Abstract
:1. Introduction
2. Results
2.1. Development of a Mimetic Tissue Model for Skin
2.2. Introduction of the Internal Standard
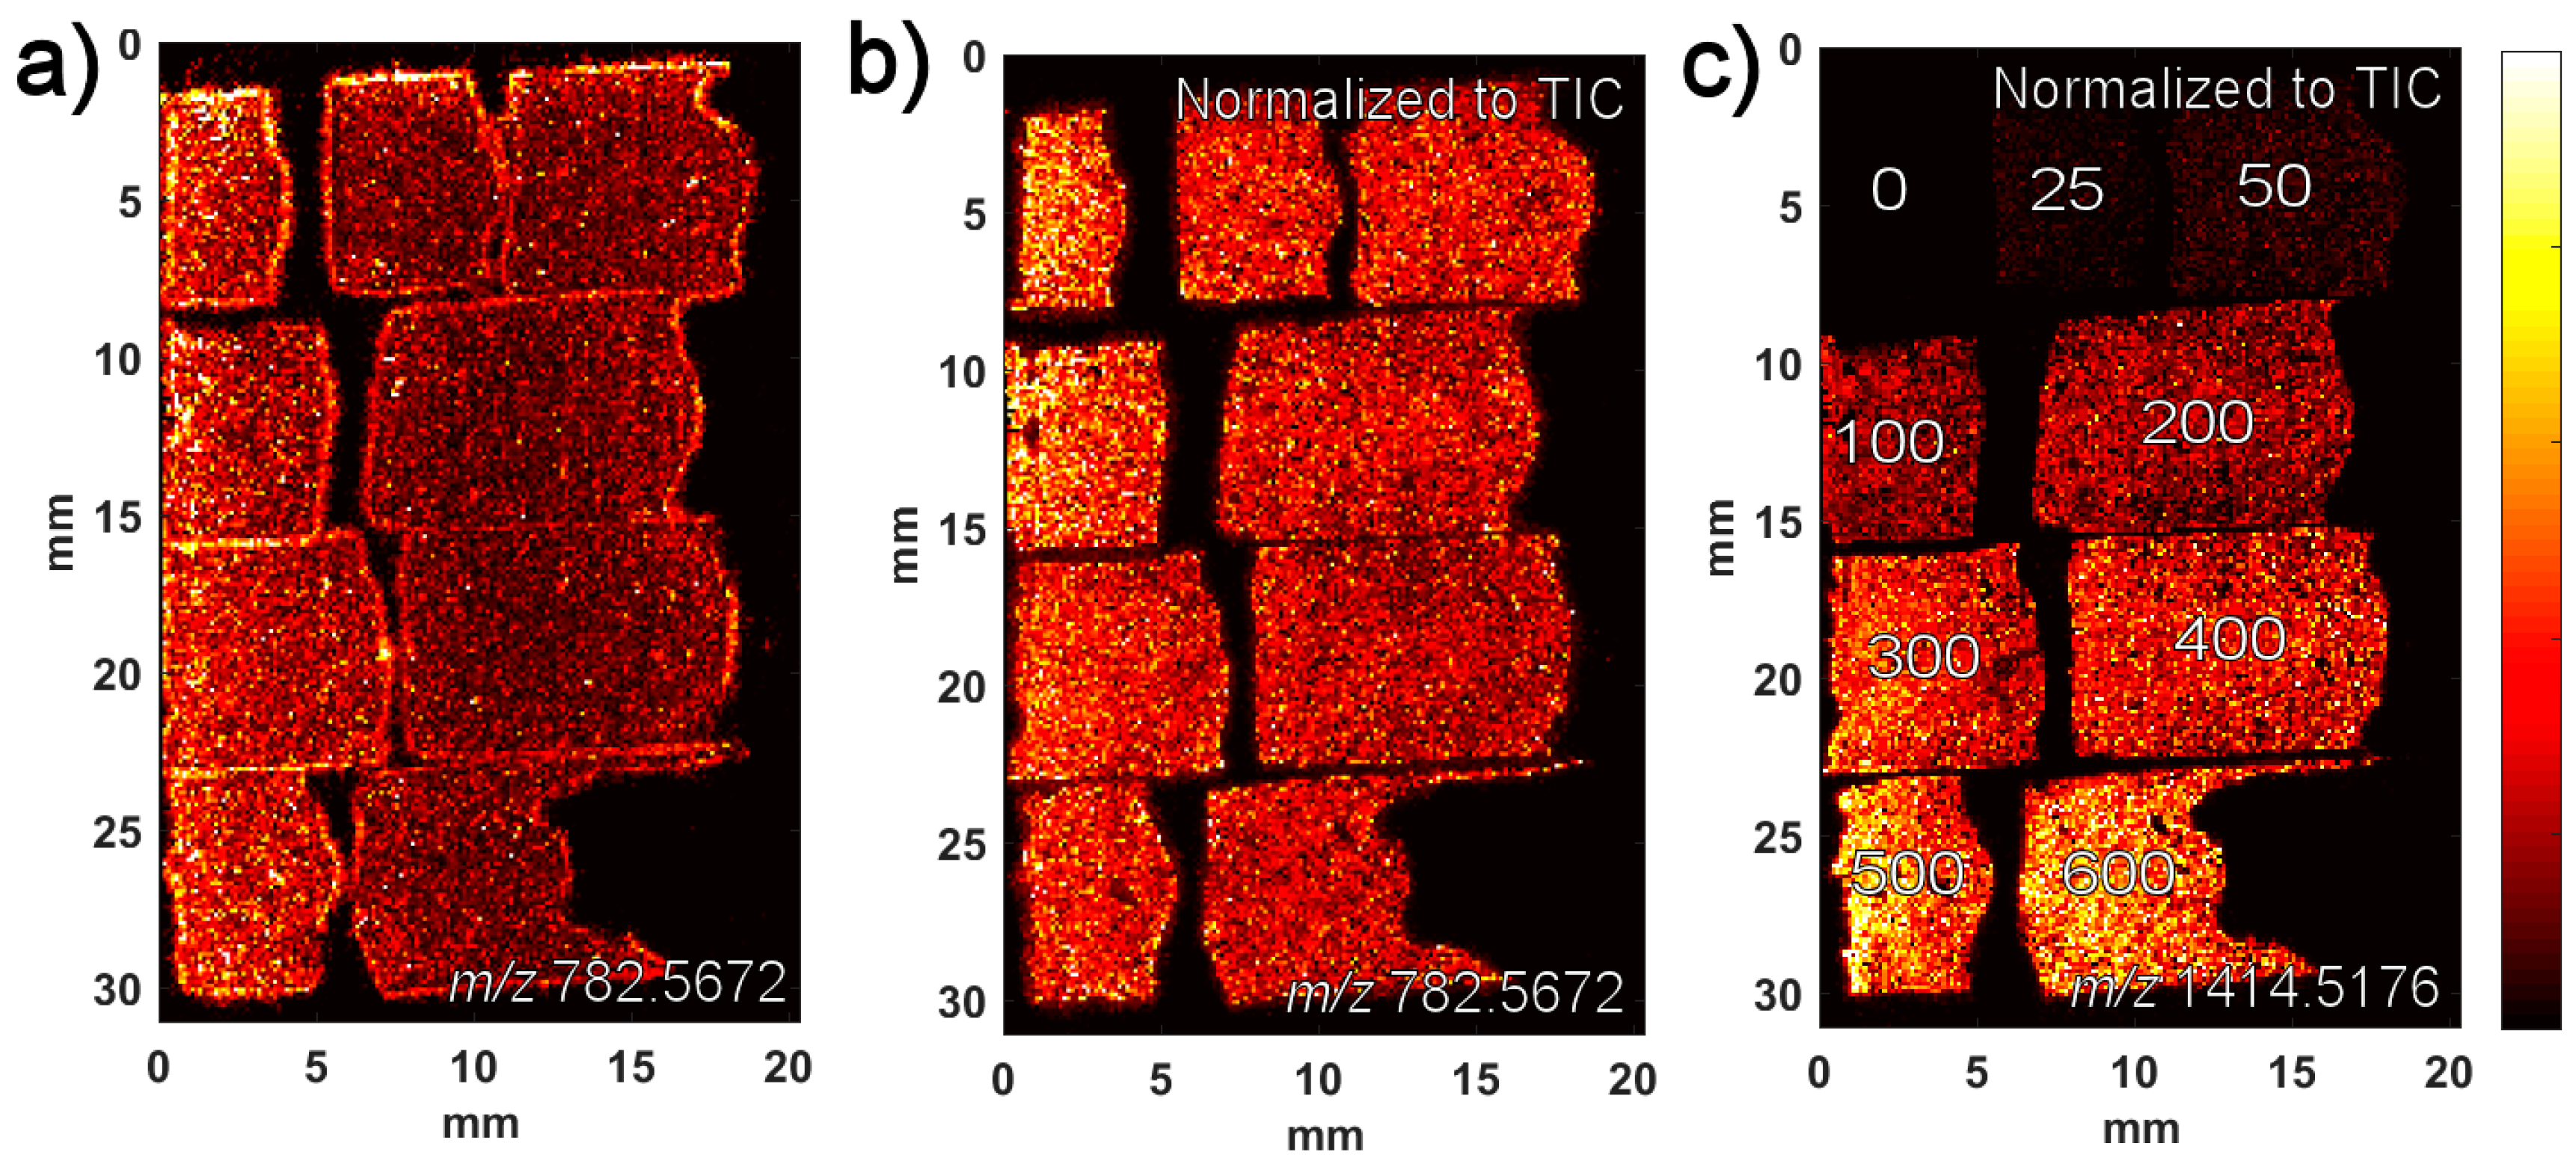
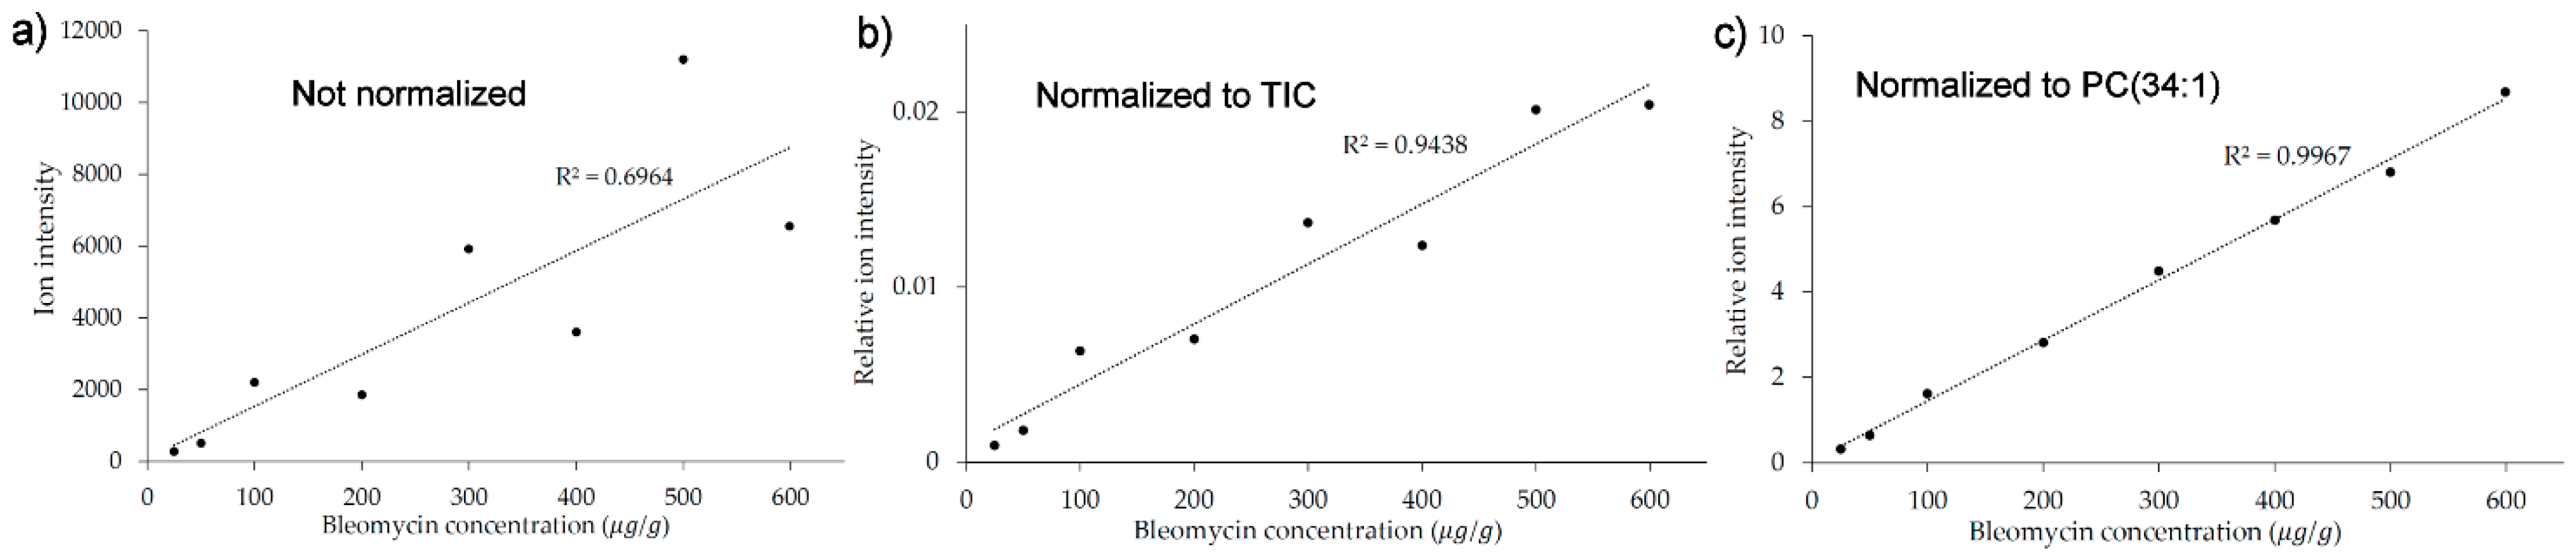
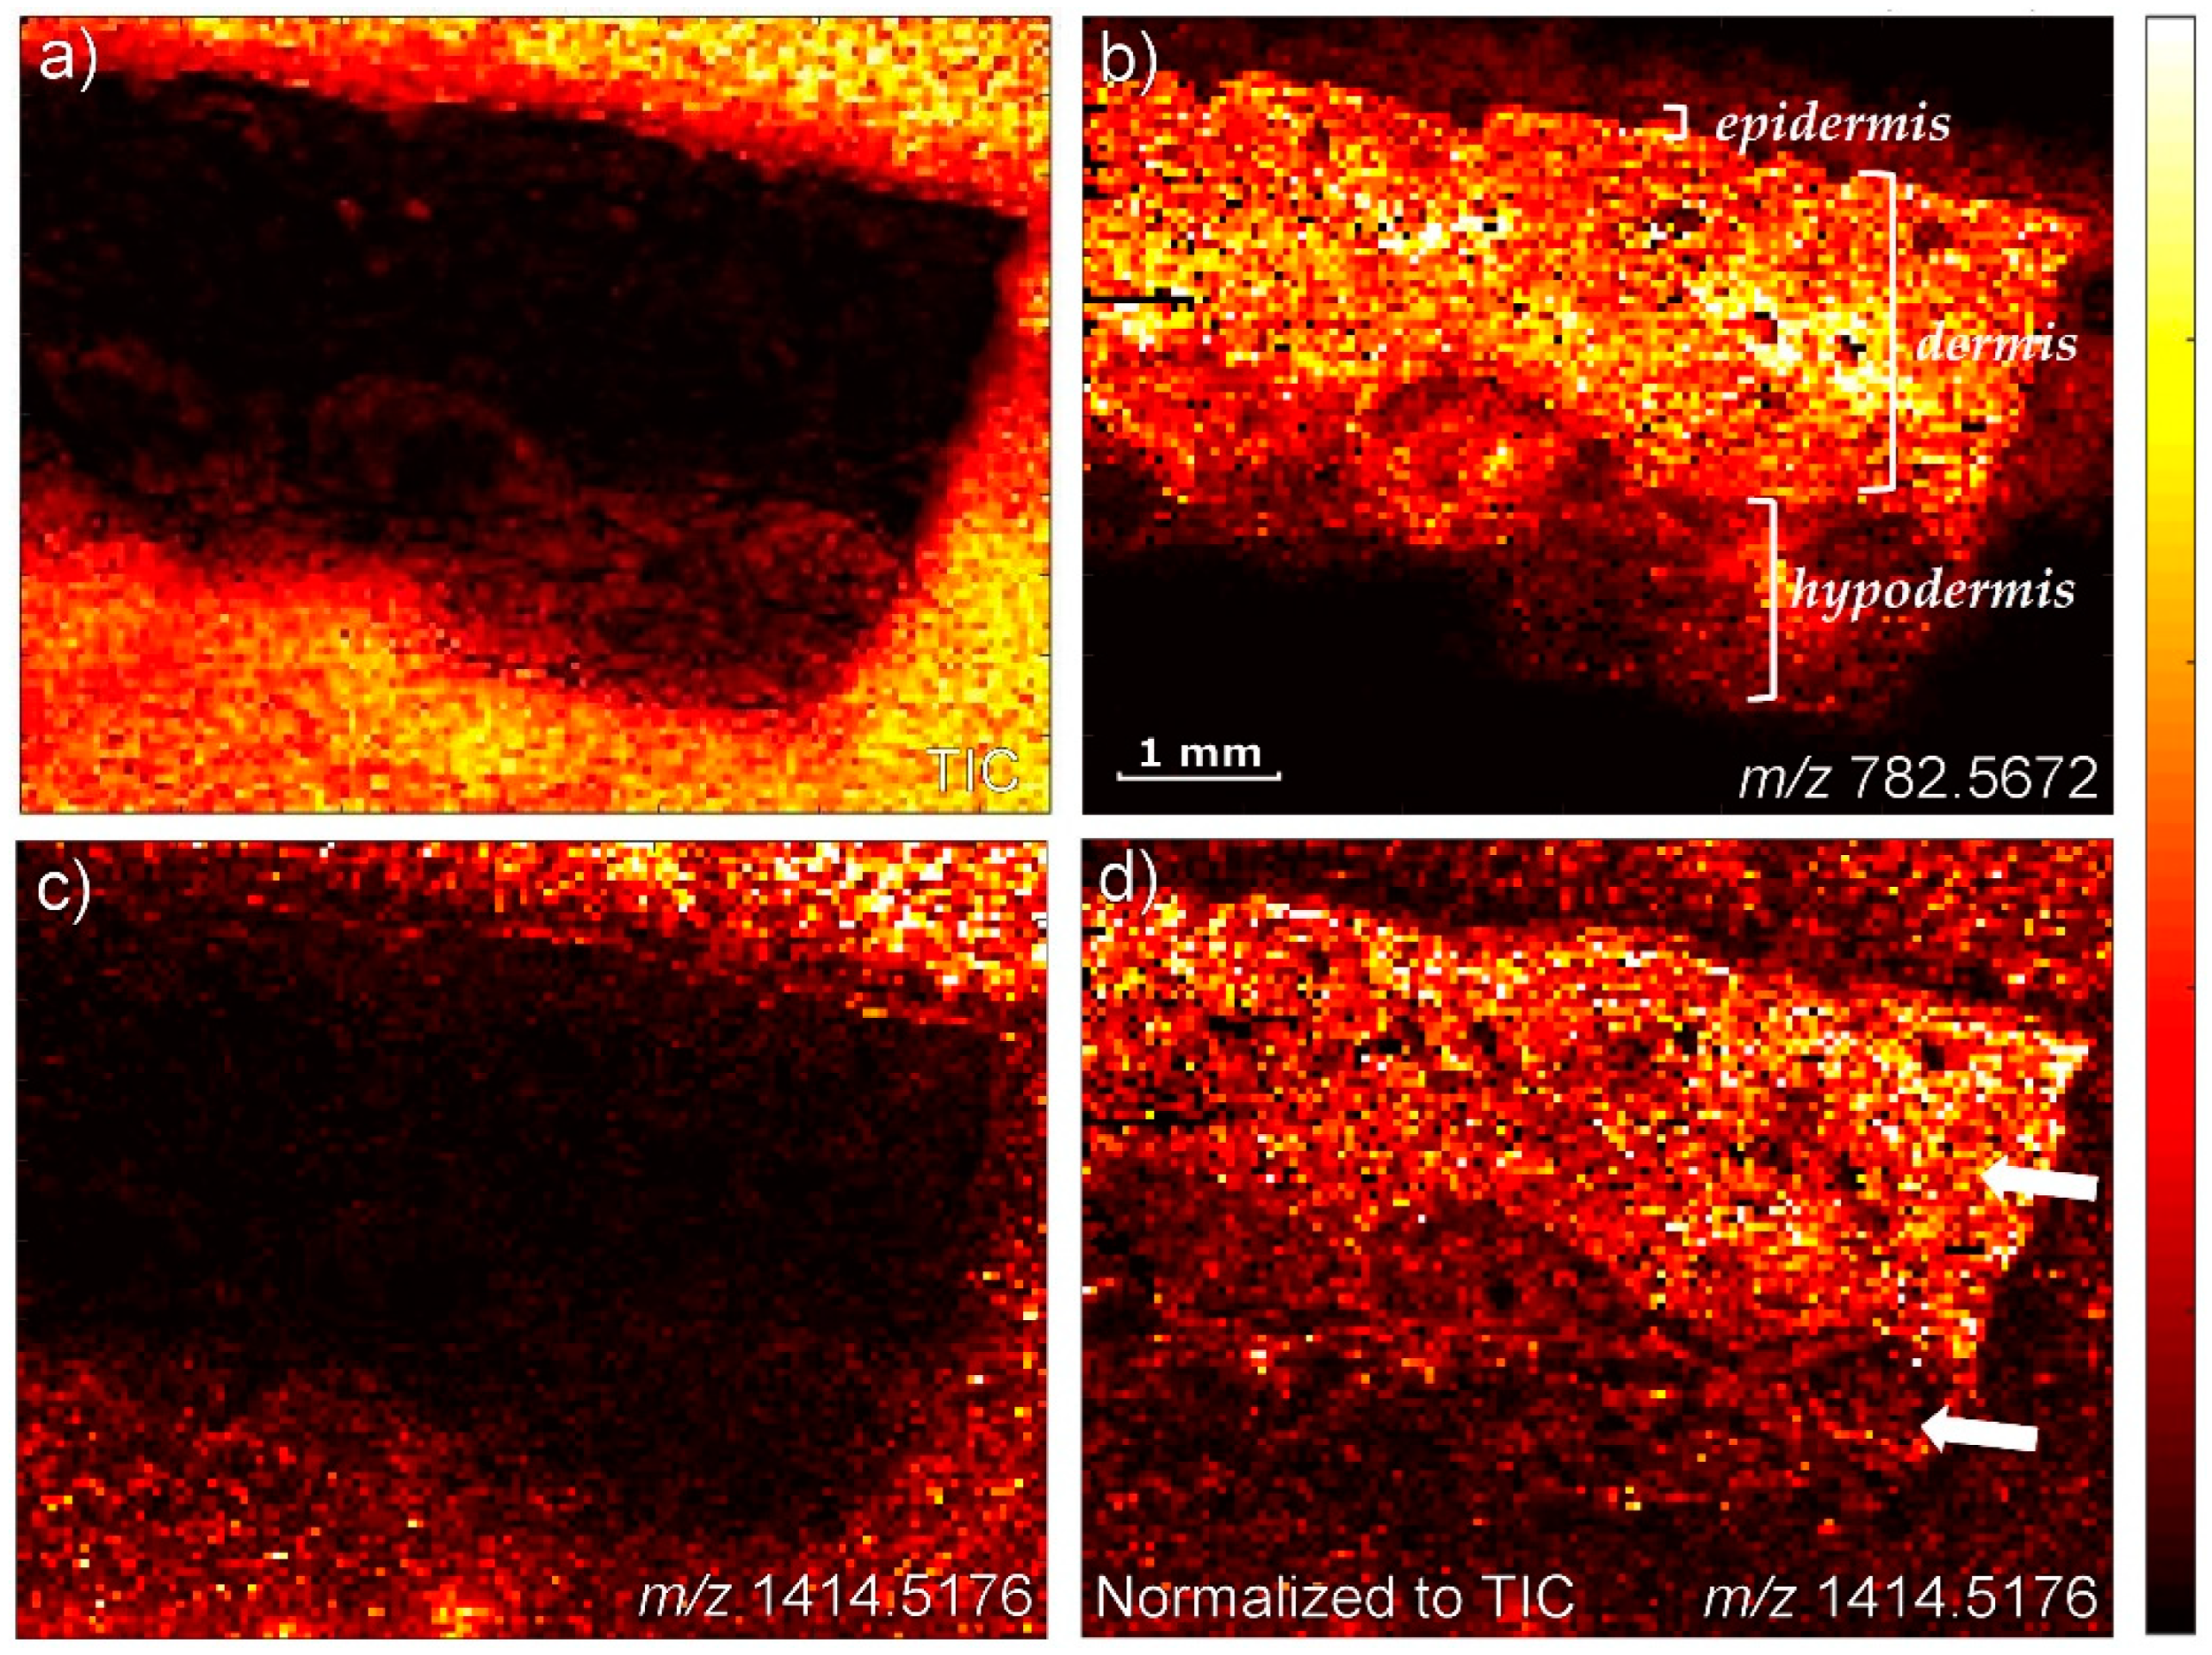
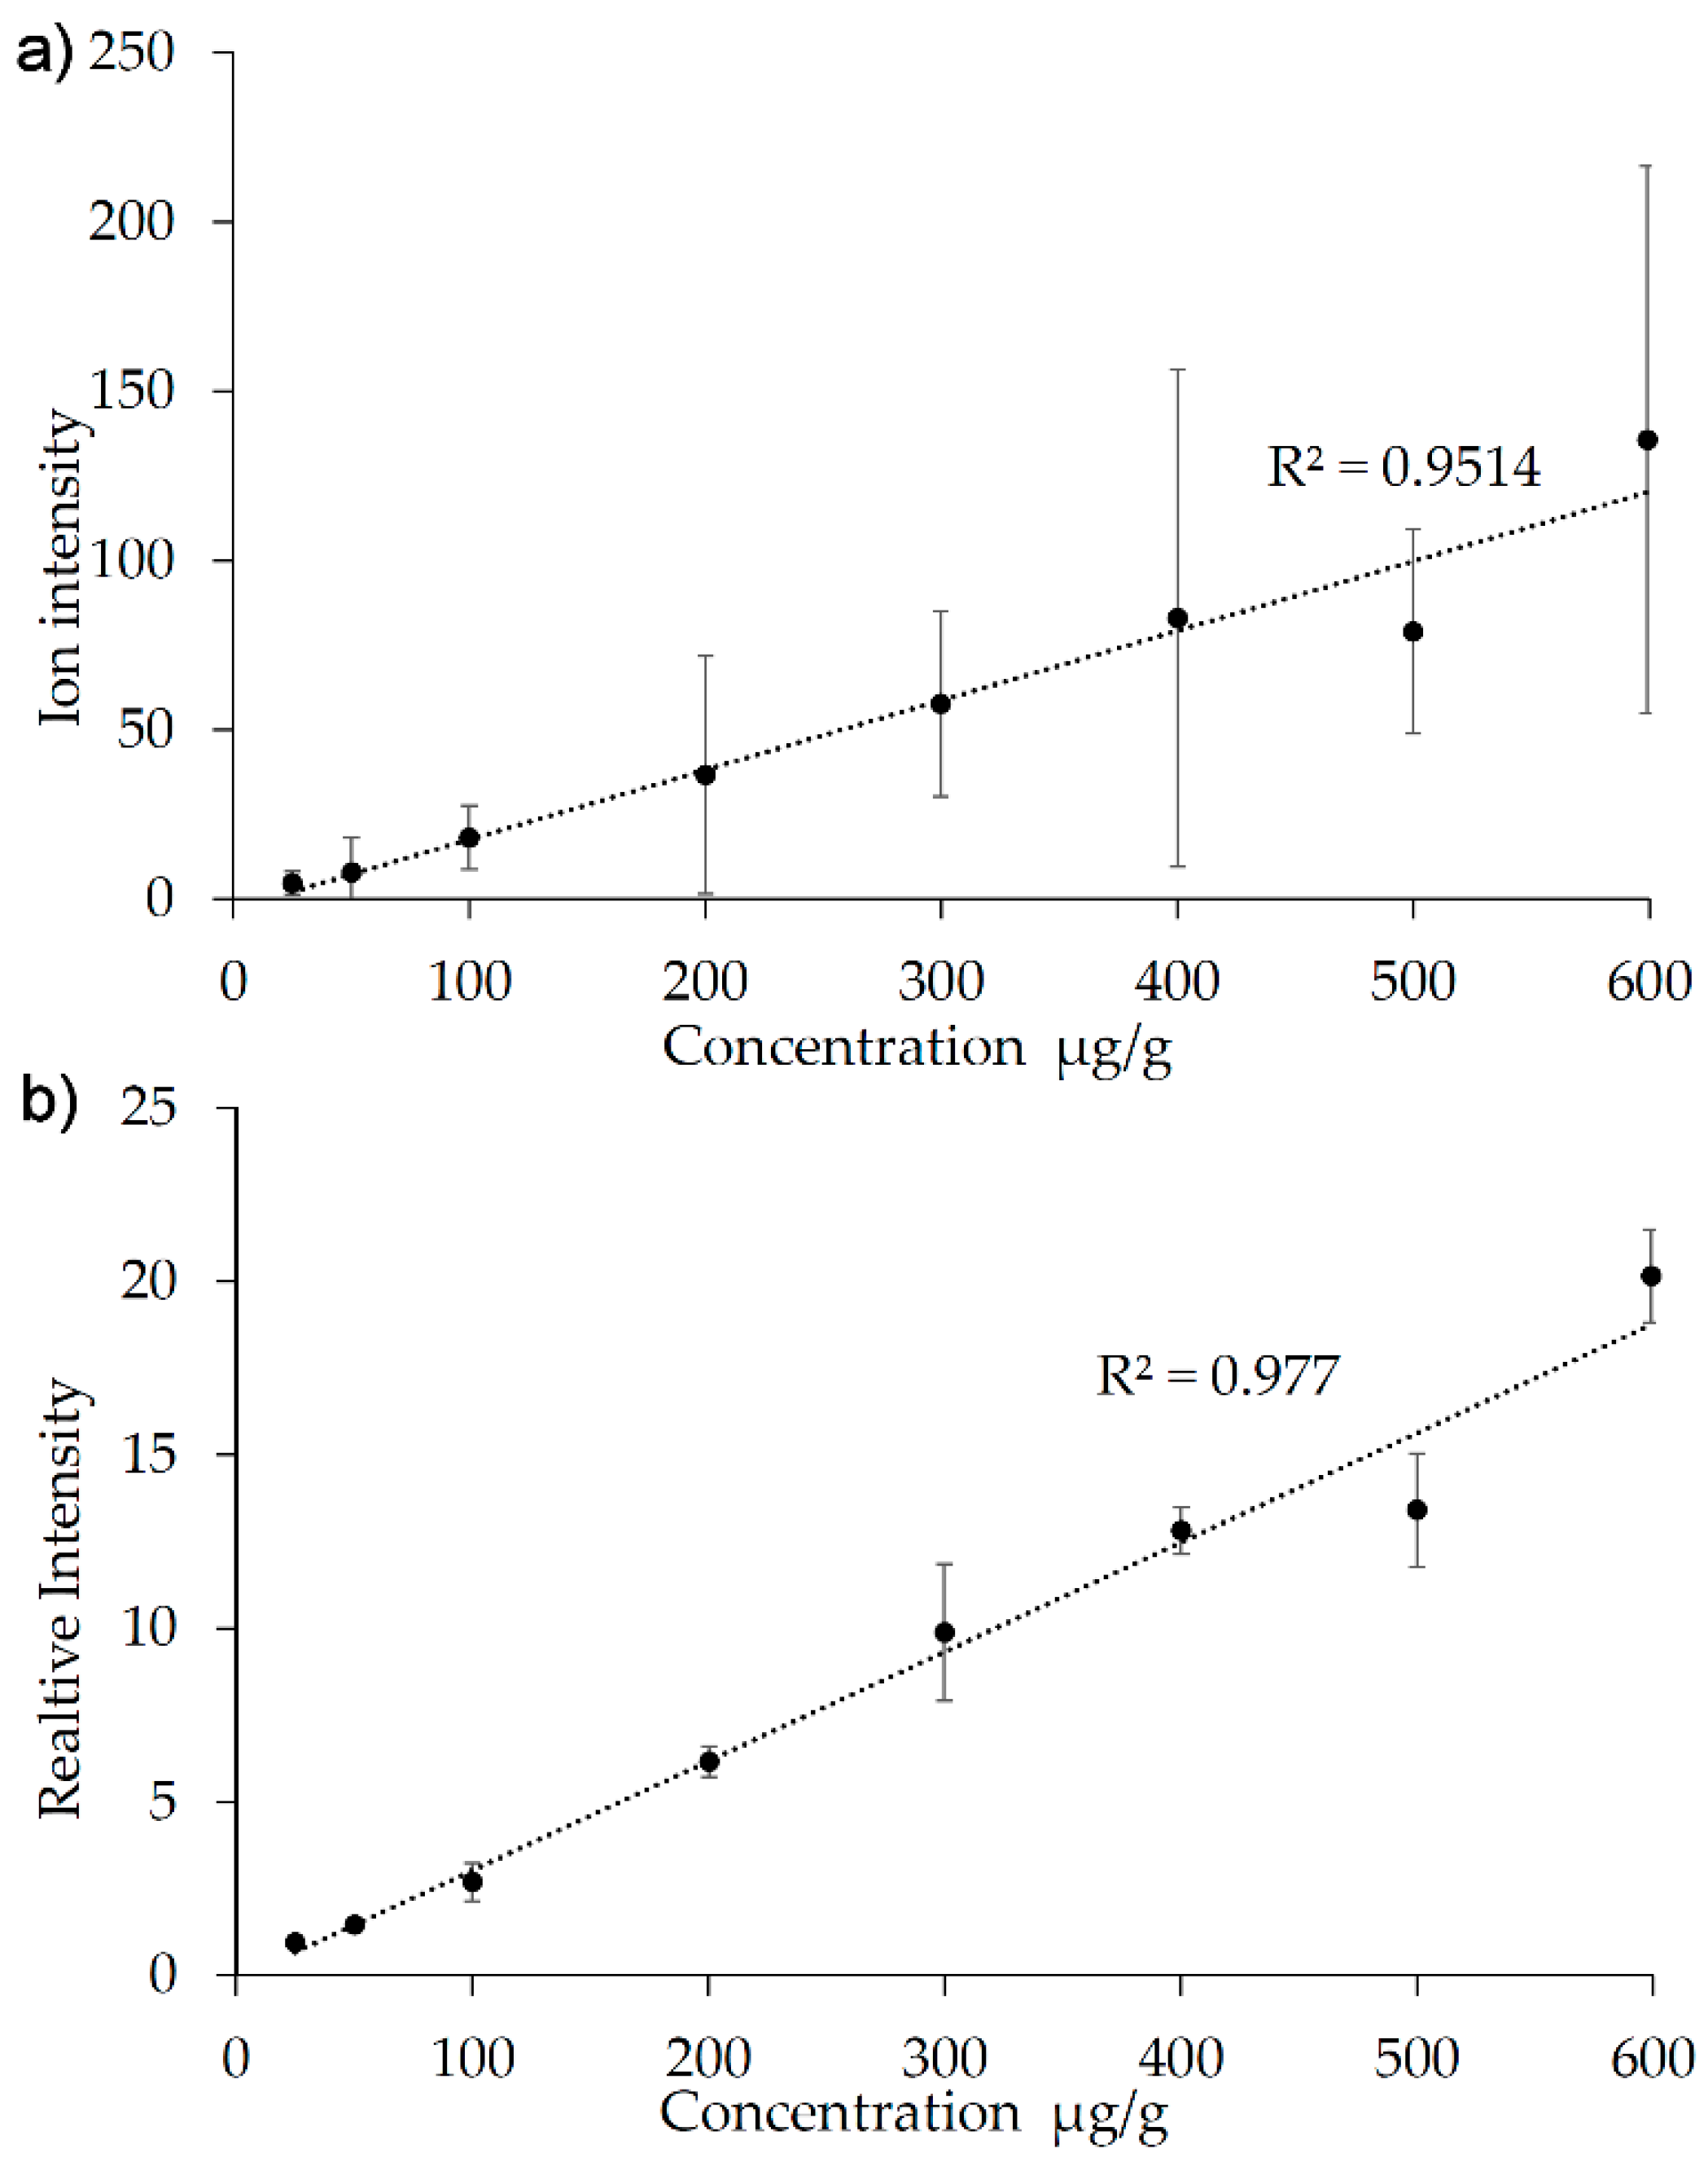
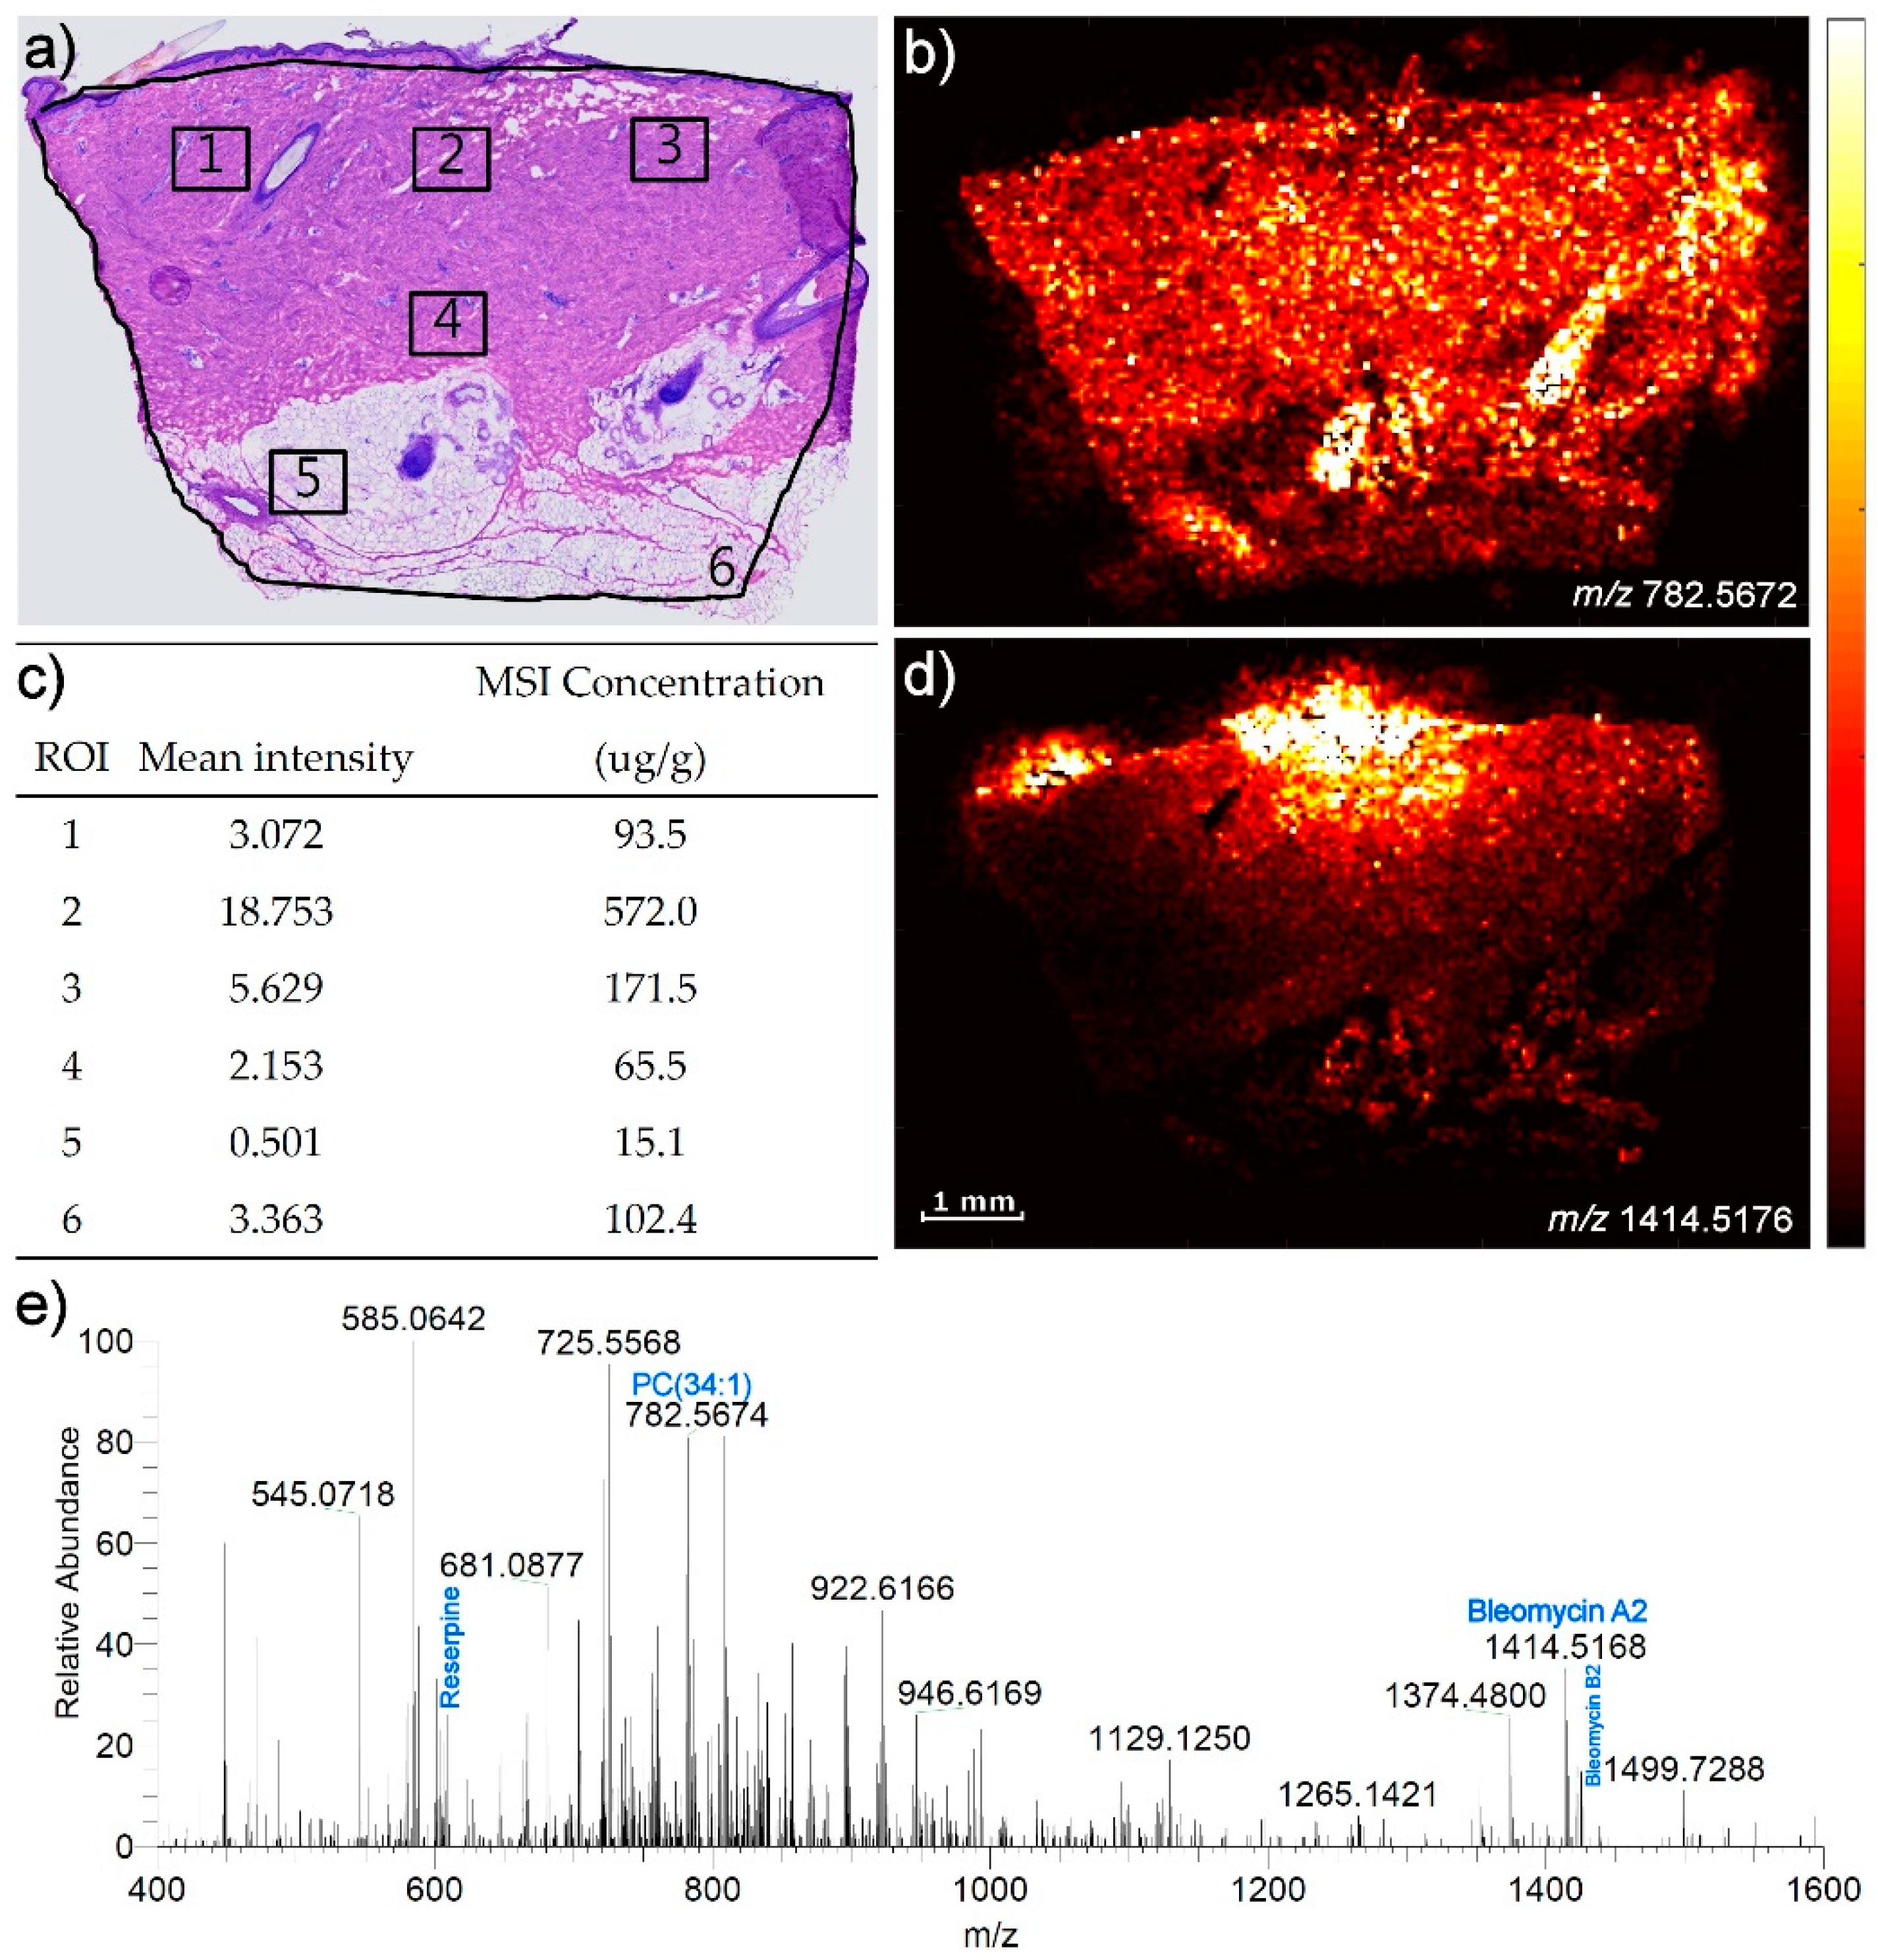
2.3. Application of the Developed Mimetic Tissue Model in a Quantitative Study
3. Discussion
3.1. Development of the Mimetic Tissue Model
3.2. Introduction of the Internal Standard
3.3. The Performance of the Calibration Model
4. Materials and Methods
4.1. Animals
4.2. Chemicals
4.3. Mimetic Tissue Model Preparation
4.4. Cryo-Sectioning of Skin Biopsy
4.5. MALDI-MSI
4.6. Data Conversion and Analysis
5. Conclusions
Author Contributions
Funding
Institutional Review Board Statement
Informed Consent Statement
Data Availability Statement
Acknowledgments
Conflicts of Interest
References
- Caprioli, R.M.; Farmer, T.B.; Gile, J. Molecular Imaging of Biological Samples: Localization of Peptides and Proteins Using Maldi-Tof Ms. Anal. Chem. 1997, 69, 4751–4760. [Google Scholar] [CrossRef] [PubMed]
- Takats, Z.; Wiseman, J.M.; Gologan, B.; Cooks, R.G. Mass Spectrometry Sampling under Ambient Conditions with Desorption Electrospray Ionization. Science 2004, 306, 471–473. [Google Scholar] [CrossRef] [PubMed] [Green Version]
- Wiseman, J.M.; Ifa, D.R.; Song, Q.Y.; Cooks, R.G. Tissue Imaging at Atmospheric Pressure Using Desorption Electrospray Ionization (Desi) Mass Spectrometry. Angew. Chem.-Int. Ed. 2006, 45, 7188–7192. [Google Scholar] [CrossRef] [PubMed]
- Granborg, J.R.; Handler, A.M.; Janfelt, C. Mass Spectrometry Imaging in Drug Distribution and Drug Metabolism Studies–Principles, Applications and Perspectives. TrAC Trends Anal. Chem. 2022, 146, 116482. [Google Scholar] [CrossRef]
- Arentz, G.; Mittal, P.; Zhang, C.; Ho, Y.Y.; Briggs, M.; Winderbaum, L.; Hoffmann, M.K.; Hoffmann, P. Chapter Two-Applications of Mass Spectrometry Imaging to Cancer. In Advances in Cancer Research; Drake, R.R., McDonnell, L.A., Eds.; Academic Press: Cambridge, MA, USA, 2017; pp. 27–66. [Google Scholar]
- Dunham, S.J.; Ellis, J.F.; Li, B.; Sweedler, J.V. Mass Spectrometry Imaging of Complex Microbial Communities. Acc. Chem. Res. 2016, 50, 96–104. [Google Scholar] [CrossRef]
- Bjarnholt, N.; Li, B.; D’Alvise, J.; Janfelt, C. Mass Spectrometry Imaging of Plant Metabolites–Principles and Possibilities. Nat. Prod. Rep. 2014, 31, 818–837. [Google Scholar] [CrossRef] [Green Version]
- BBarry, J.A.; Groseclose, M.R.; Castellino, S. Quantification and Assessment of Detection Capability in Imaging Mass Spectrometry Using a Revised Mimetic Tissue Model. Bioanalysis 2019, 11, 1099–1116. [Google Scholar] [CrossRef]
- Groseclose, M.R.; Castellino, S. A Mimetic Tissue Model for the Quantification of Drug Distributions by Maldi Imaging Mass Spectrometry. Anal. Chem. 2013, 85, 10099–10106. [Google Scholar] [CrossRef]
- Hansen, H.T.; Janfelt, C. Aspects of Quantitation in Mass Spectrometry Imaging Investigated on Cryo-Sections of Spiked Tissue Homogenates. Anal. Chem. 2016, 88, 11513–11520. [Google Scholar] [CrossRef]
- Groseclose, M.R.; Laffan, S.B.; Frazier, K.S.; Hughes-Earle, A.; Castellino, S. Imaging Ms in Toxicology: An Investigation of Juvenile Rat Nephrotoxicity Associated with Dabrafenib Administration. J. Am. Soc. Mass Spectrom. 2015, 26, 887–898. [Google Scholar] [CrossRef]
- Grégoire, S.; Luengo, G.S.; Hallegot, P.; Pena, A.M.; Chen, X.; Bornschlögl, T.; Chan, K.F.; Pence, I.; Obeidy, P.; Feizpour, A.; et al. Imaging and Quantifying Drug Delivery in Skin–Part 1: Autoradiography and Mass Spectrometry Imaging. Adv. Drug Deliv. Rev. 2020, 153, 137–146. [Google Scholar] [CrossRef] [PubMed]
- Handler, A.M.; Pedersen, G.P.; Nielsen, K.T.; Janfelt, C.; Pedersen, A.J.; Clench, M.R. Quantitative Maldi Mass Spectrometry Imaging for Exploring Cutaneous Drug Delivery of Tofacitinib in Human Skin. Eur. J. Pharm. Biopharm. 2021, 159, 1–10. [Google Scholar] [CrossRef] [PubMed]
- Handler, A.M.; Eirefelt, S.; Lambert, M.; Johansson, F.; Hollesen Schefe, L.; Østergaard Knudsen, N.; Bodenlenz, M.; Birngruber, T.; Sinner, F.; Huss Eriksson, A.; et al. Characterizing Cutaneous Drug Delivery Using Open-Flow Microperfusion and Mass Spectrometry Imaging. Mol. Pharm. 2021, 18, 3063–3072. [Google Scholar] [CrossRef]
- Russo, C.; Brickelbank, N.; Duckett, C.; Mellor, S.; Rumbelow, S.; Clench, M.R. Quantitative Investigation of Terbinafine Hydrochloride Absorption into a Living Skin Equivalent Model by Maldi-Msi. Anal. Chem. 2018, 90, 10031–10038. [Google Scholar] [CrossRef] [PubMed] [Green Version]
- Bonnel, D.; Legouffe, R.; Eriksson, A.H.; Mortensen, R.W.; Pamelard, F.; Stauber, J.; Nielsen, K.T. Maldi Imaging Facilitates New Topical Drug Development Process by Determining Quantitative Skin Distribution Profiles. Anal. Bioanal. Chem. 2018, 410, 2815–2828. [Google Scholar] [CrossRef]
- Barry, J.A.; Groseclose, M.R.; Fraser, D.D.; Castellino, S. Revised Preparation of a Mimetic Tissue Model for Quantitative Imaging Mass Spectrometry. Protoc. Exch. 2018. [Google Scholar] [CrossRef]
- Ahmed, E.M. Hydrogel: Preparation, Characterization, and Applications: A Review. J. Adv. Res. 2015, 6, 105–121. [Google Scholar] [CrossRef] [Green Version]
- Logger, J.G.M.; Münchhoff, C.U.; Olydam, J.I.; Peppelman, M.; van Erp, P. Anatomical Site Variation of Water Content in Human Skin Measured by the Epsilon: A Pilot Study. Ski. Res. Technol. 2019, 25, 333–338. [Google Scholar] [CrossRef] [PubMed] [Green Version]
- Lee, K.; Jeoung, K.; Kim, S.H.; Ji, Y.-B.; Son, H.; Choi, Y.; Huh, Y.-M.; Suh, J.-S.; Oh, S.J. Measuring Water Contents in Animal Organ Tissues Using Terahertz Spectroscopic Imaging. Biomed. Opt. Express 2018, 9, 1582–1589. [Google Scholar] [CrossRef] [Green Version]
- Bik, L.; van Doorn, M.; Hansen, A.C.N.; Janfelt, C.; Olesen, U.H.; Haedersdal, M.; Lerche, C.M.; Hendel, K. In Vivo Dermal Delivery of Bleomycin with Electronic Pneumatic Injection: Drug Visualization and Quantification with Mass Spectrometry. Expert Opin. Drug Deliv. 2022, 19, 213–219. [Google Scholar] [CrossRef]
- Sugiura, Y.; Shimma, S.; Setou, M. Thin Sectioning Improves the Peak Intensity and Signal-to-Noise Ratio in Direct Tissue Mass Spectrometry. J. Mass Spectrom. Soc. Jpn. 2006, 54, 45–48. [Google Scholar] [CrossRef] [Green Version]
- Holm, N.B.; Deryabina, M.; Knudsen, C.B.; Janfelt, C. Tissue Distribution and Metabolic Profiling of Cyclosporine (Csa) in Mouse and Rat Investigated by Desi and Maldi Mass Spectrometry Imaging (Msi) of Whole-Body and Single Organ Cryo-Sections. Anal. Bioanal. Chem. 2022, 414, 7167–7177. [Google Scholar] [CrossRef]
- Hendel, K.K.; Bagger, C.; Olesen, U.H.; Janfelt, C.; Hansen, S.H.; Haedersdal, M.; Lerche, C.M. Fractional Laser-Assisted Topical Delivery of Bleomycin Quantified by Lc-Ms and Visualized by Maldi Mass Spectrometry Imaging. Drug Deliv. 2019, 26, 244–251. [Google Scholar] [CrossRef] [PubMed] [Green Version]
- Bunch, J.; Clench, M.R.; Richards, D.S. Determination of Pharmaceutical Compounds in Skin by Imaging Matrix-Assisted Laser Desorption/Ionisation Mass Spectrometry. Rapid Commun. Mass Spectrom. 2004, 18, 3051–3060. [Google Scholar] [CrossRef] [PubMed]
- Sjövall, P.; Skedung, L.; Gregoire, S.; Biganska, O.; Clément, F.; Luengo, G.S. Imaging the Distribution of Skin Lipids and Topically Applied Compounds in Human Skin Using Mass Spectrometry. Sci. Rep. 2018, 8, 16683. [Google Scholar] [CrossRef] [PubMed] [Green Version]
- Sørensen, I.S.; Janfelt, C.; Nielsen, M.M.B.; Mortensen, R.W.; Knudsen, N.; Eriksson, A.H.; Pedersen, A.J.; Nielsen, K.T. Combination of Maldi-Msi and Cassette Dosing for Evaluation of Drug Distribution in Human Skin Explant. Anal. Bioanal. Chem. 2017, 409, 4993–5005. [Google Scholar] [CrossRef]
- D’Alvise, J.; Mortensen, R.; Hansen, S.H.; Janfelt, C. Detection of Follicular Transport of Lidocaine and Metabolism in Adipose Tissue in Pig Ear Skin by Desi Mass Spectrometry Imaging. Anal. Bioanal. Chem. 2014, 406, 3735–3742. [Google Scholar] [CrossRef]
- Taudorf, E.H.; Lerche, C.M.; Vissing, A.-C.; Philipsen, P.A.; Hannibal, J.; D’Alvise, J.; Hansen, S.H.; Janfelt, C.; Paasch, U.; Anderson, R.R.; et al. Topically Applied Methotrexate Is Rapidly Delivered into Skin by Fractional Laser Ablation. Expert Opin. Drug Deliv. 2015, 12, 1059–1069. [Google Scholar] [CrossRef]
- Legouffe, R.; Jeanneton, O.; Gaudin, M.; Tomezyk, A.; Gerstenberg, A.; Dumas, M.; Heusèle, C.; Bonnel, D.; Stauber, J.; Schnebert, S. Hyaluronic Acid Detection and Relative Quantification by Mass Spectrometry Imaging in Human Skin Tissues. Anal. Bioanal. Chem. 2022, 414, 5781–5791. [Google Scholar] [CrossRef]
- Lamont, L.; Hadavi, D.; Viehmann, B.; Flinders, B.; Heeren, R.M.A.; Vreeken, R.J.; Siegel, T.P. Quantitative Mass Spectrometry Imaging of Drugs and Metabolites: A Multiplatform Comparison. Anal. Bioanal. Chem. 2021, 413, 2779–2791. [Google Scholar] [CrossRef]
- Akakpo, J.Y.; Jaeschke, M.W.; Etemadi, Y.; Artigues, A.; Toerber, S.; Olivos, H.; Shrestha, B.; Midey, A.; Jaeschke, H.; Ramachandran, A. Desorption Electrospray Ionization Mass Spectrometry Imaging Allows Spatial Localization of Changes in Acetaminophen Metabolism in the Liver after Intervention with 4-Methylpyrazole. J. Am. Soc. Mass Spectrom. 2022, 33, 2094–2107. [Google Scholar] [CrossRef] [PubMed]
- Hendel, K.; Hansen, A.C.N.; Bik, L.; Bagger, C.; van Doorn, M.B.A.; Janfelt, C.; Olesen, U.H.; Haedersdal, M.; Lerche, C.M. Bleomycin Administered by Laser-Assisted Drug Delivery or Intradermal Needle-Injection Results in Distinct Biodistribution Patterns in Skin: In Vivo Investigations with Mass Spectrometry Imaging. Drug Deliv. 2021, 28, 1141–1149. [Google Scholar] [CrossRef] [PubMed]
- Stoeckli, M.; Staab, D. Reproducible Matrix Deposition for Maldi Msi Based on Open-Source Software and Hardware. J. Am. Soc. Mass Spectrom. 2015, 26, 911–914. [Google Scholar] [CrossRef] [PubMed] [Green Version]
- Bokhart, M.T.; Nazari, M.; Garrard, K.P.; Muddiman, D.C. Msireader V1.0: Evolving Open-Source Mass Spectrometry Imaging Software for Targeted and Untargeted Analyses. J. Am. Soc. Mass Spectrom. 2018, 29, 8–16. [Google Scholar] [CrossRef]


Publisher’s Note: MDPI stays neutral with regard to jurisdictional claims in published maps and institutional affiliations. |
© 2022 by the authors. Licensee MDPI, Basel, Switzerland. This article is an open access article distributed under the terms and conditions of the Creative Commons Attribution (CC BY) license (https://creativecommons.org/licenses/by/4.0/).
Share and Cite
Traberg, A.; Pinto, F.E.; Hansen, A.C.N.; Haedersdal, M.; Lerche, C.M.; Janfelt, C. Quantitative Mass Spectrometry Imaging of Bleomycin in Skin Using a Mimetic Tissue Model for Calibration. Pharmaceuticals 2022, 15, 1583. https://doi.org/10.3390/ph15121583
Traberg A, Pinto FE, Hansen ACN, Haedersdal M, Lerche CM, Janfelt C. Quantitative Mass Spectrometry Imaging of Bleomycin in Skin Using a Mimetic Tissue Model for Calibration. Pharmaceuticals. 2022; 15(12):1583. https://doi.org/10.3390/ph15121583
Chicago/Turabian StyleTraberg, Andreas, Fernanda E. Pinto, Anders C. N. Hansen, Merete Haedersdal, Catharina M. Lerche, and Christian Janfelt. 2022. "Quantitative Mass Spectrometry Imaging of Bleomycin in Skin Using a Mimetic Tissue Model for Calibration" Pharmaceuticals 15, no. 12: 1583. https://doi.org/10.3390/ph15121583