
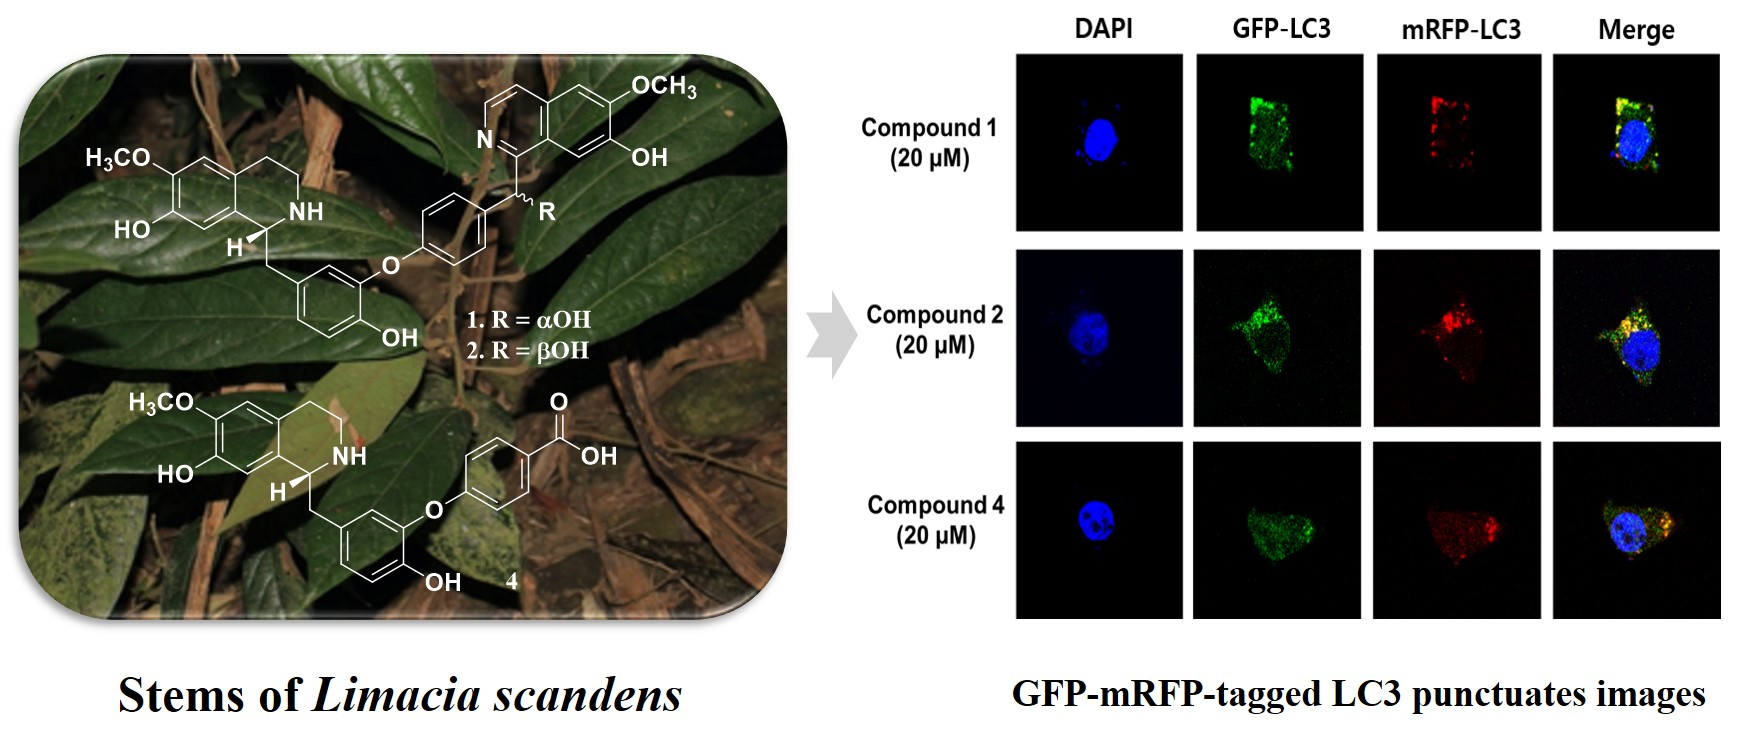
Benzylisoquinoline Alkaloids from the Stems of Limacia scandens and Their Potential as Autophagy Inhibitors
 , , , and
Abstract
:
1. Introduction
2. Results
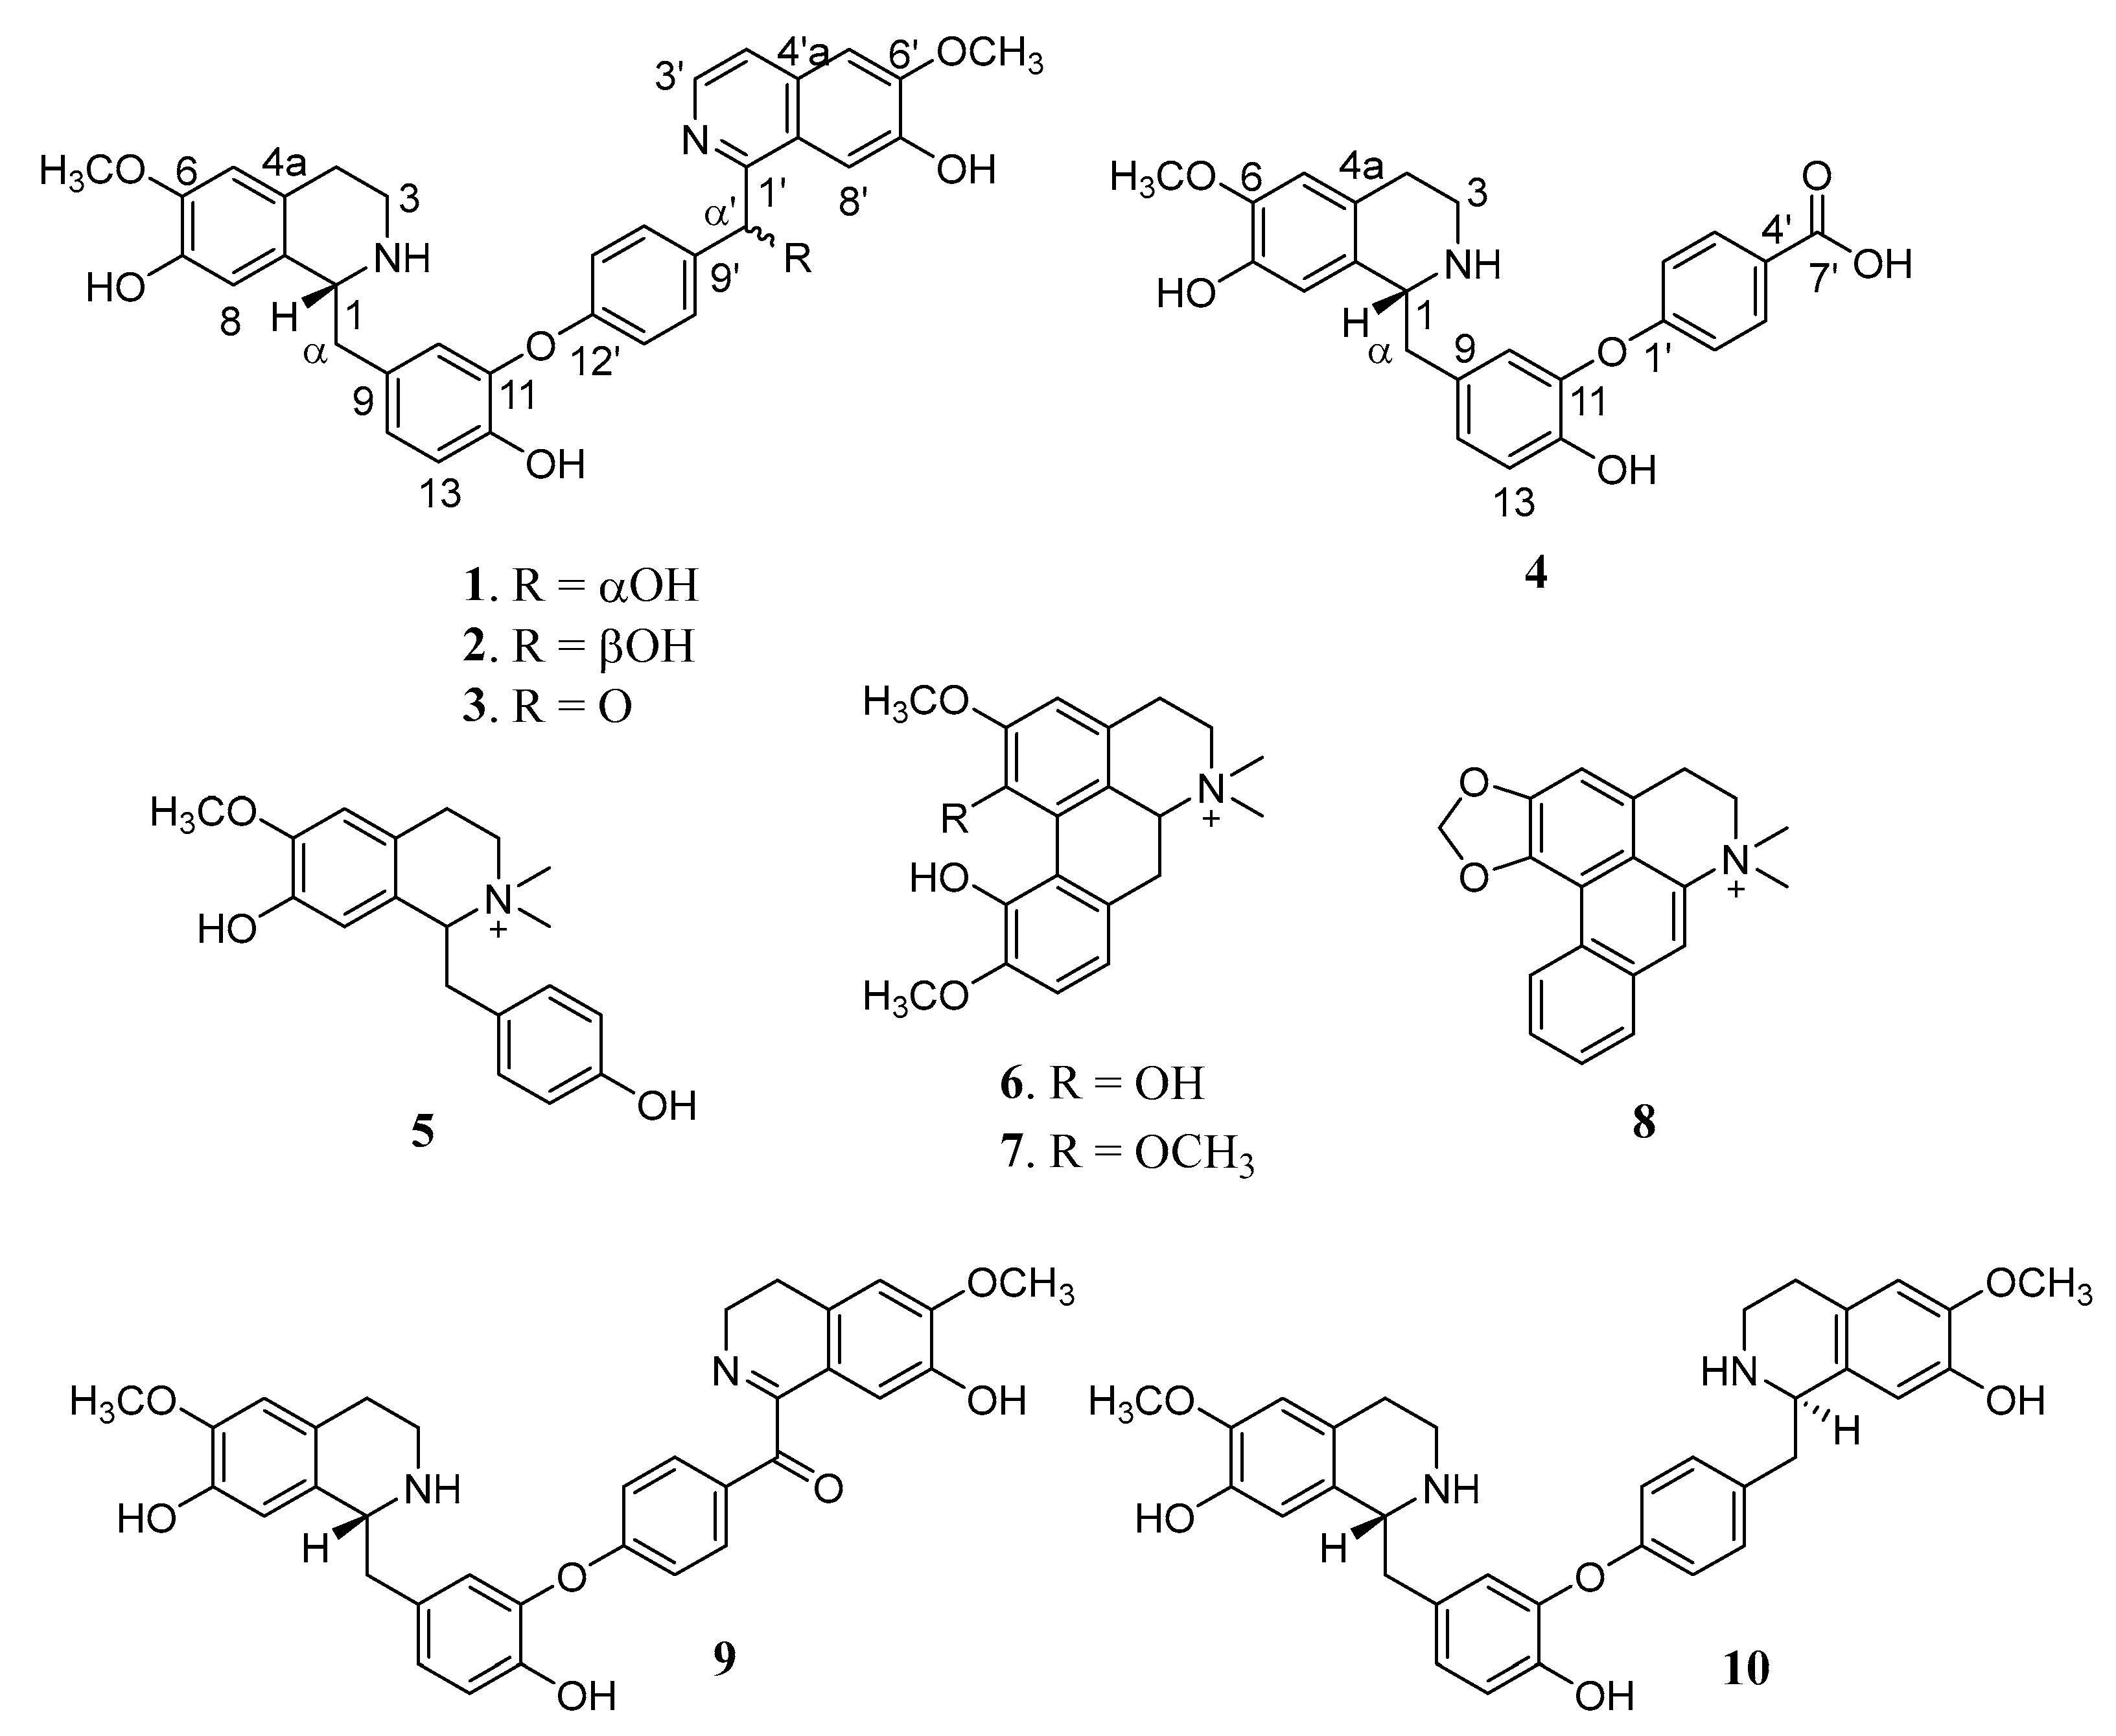
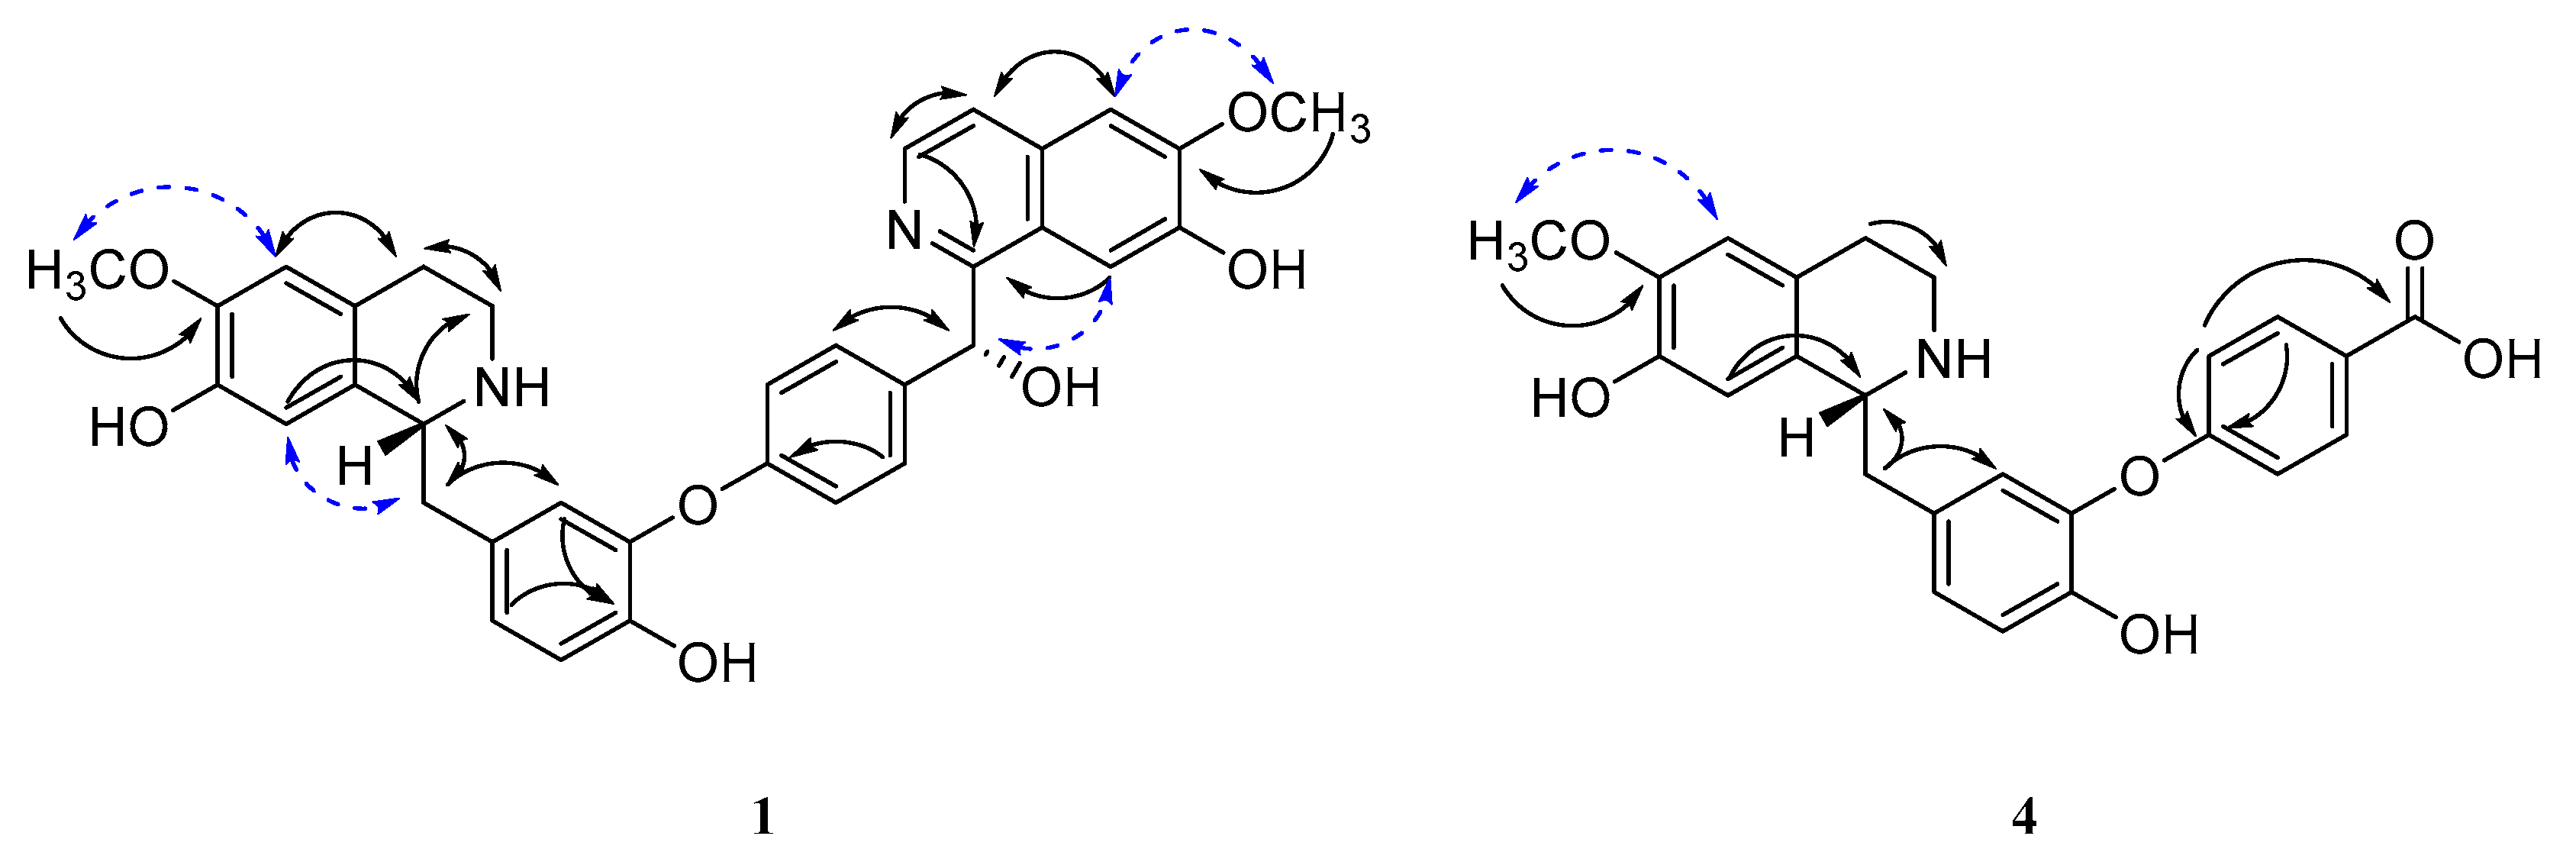
2.1. Structure Determination of 1−4 from L. scandens
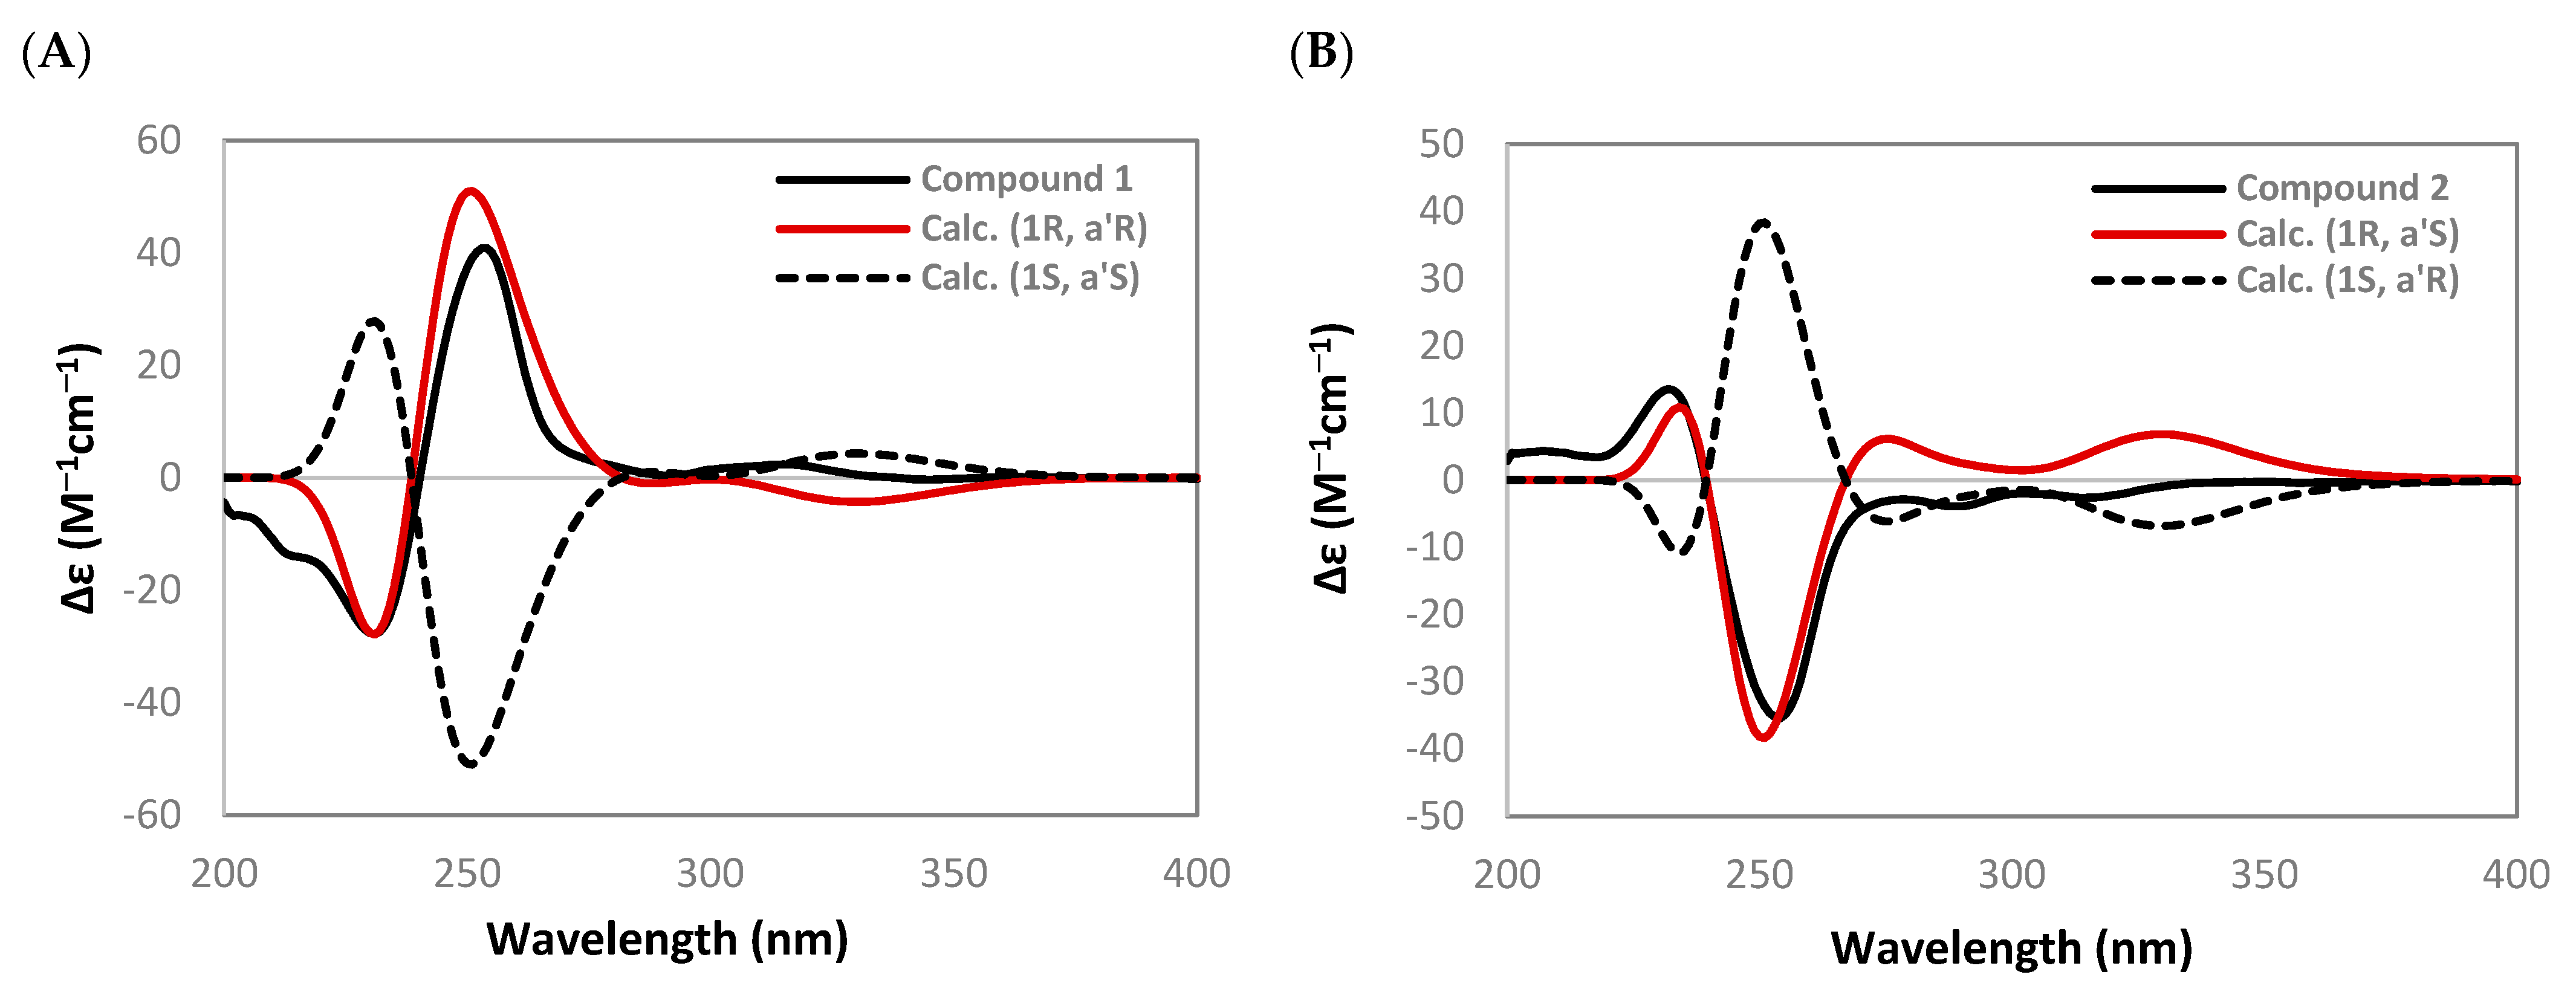
2.1.1. Limaciascadine A (1)
2.1.2. Limaciascadine B (2)
2.1.3. Limaciascadine C (3)
2.1.4. Limaciascadine D (4)
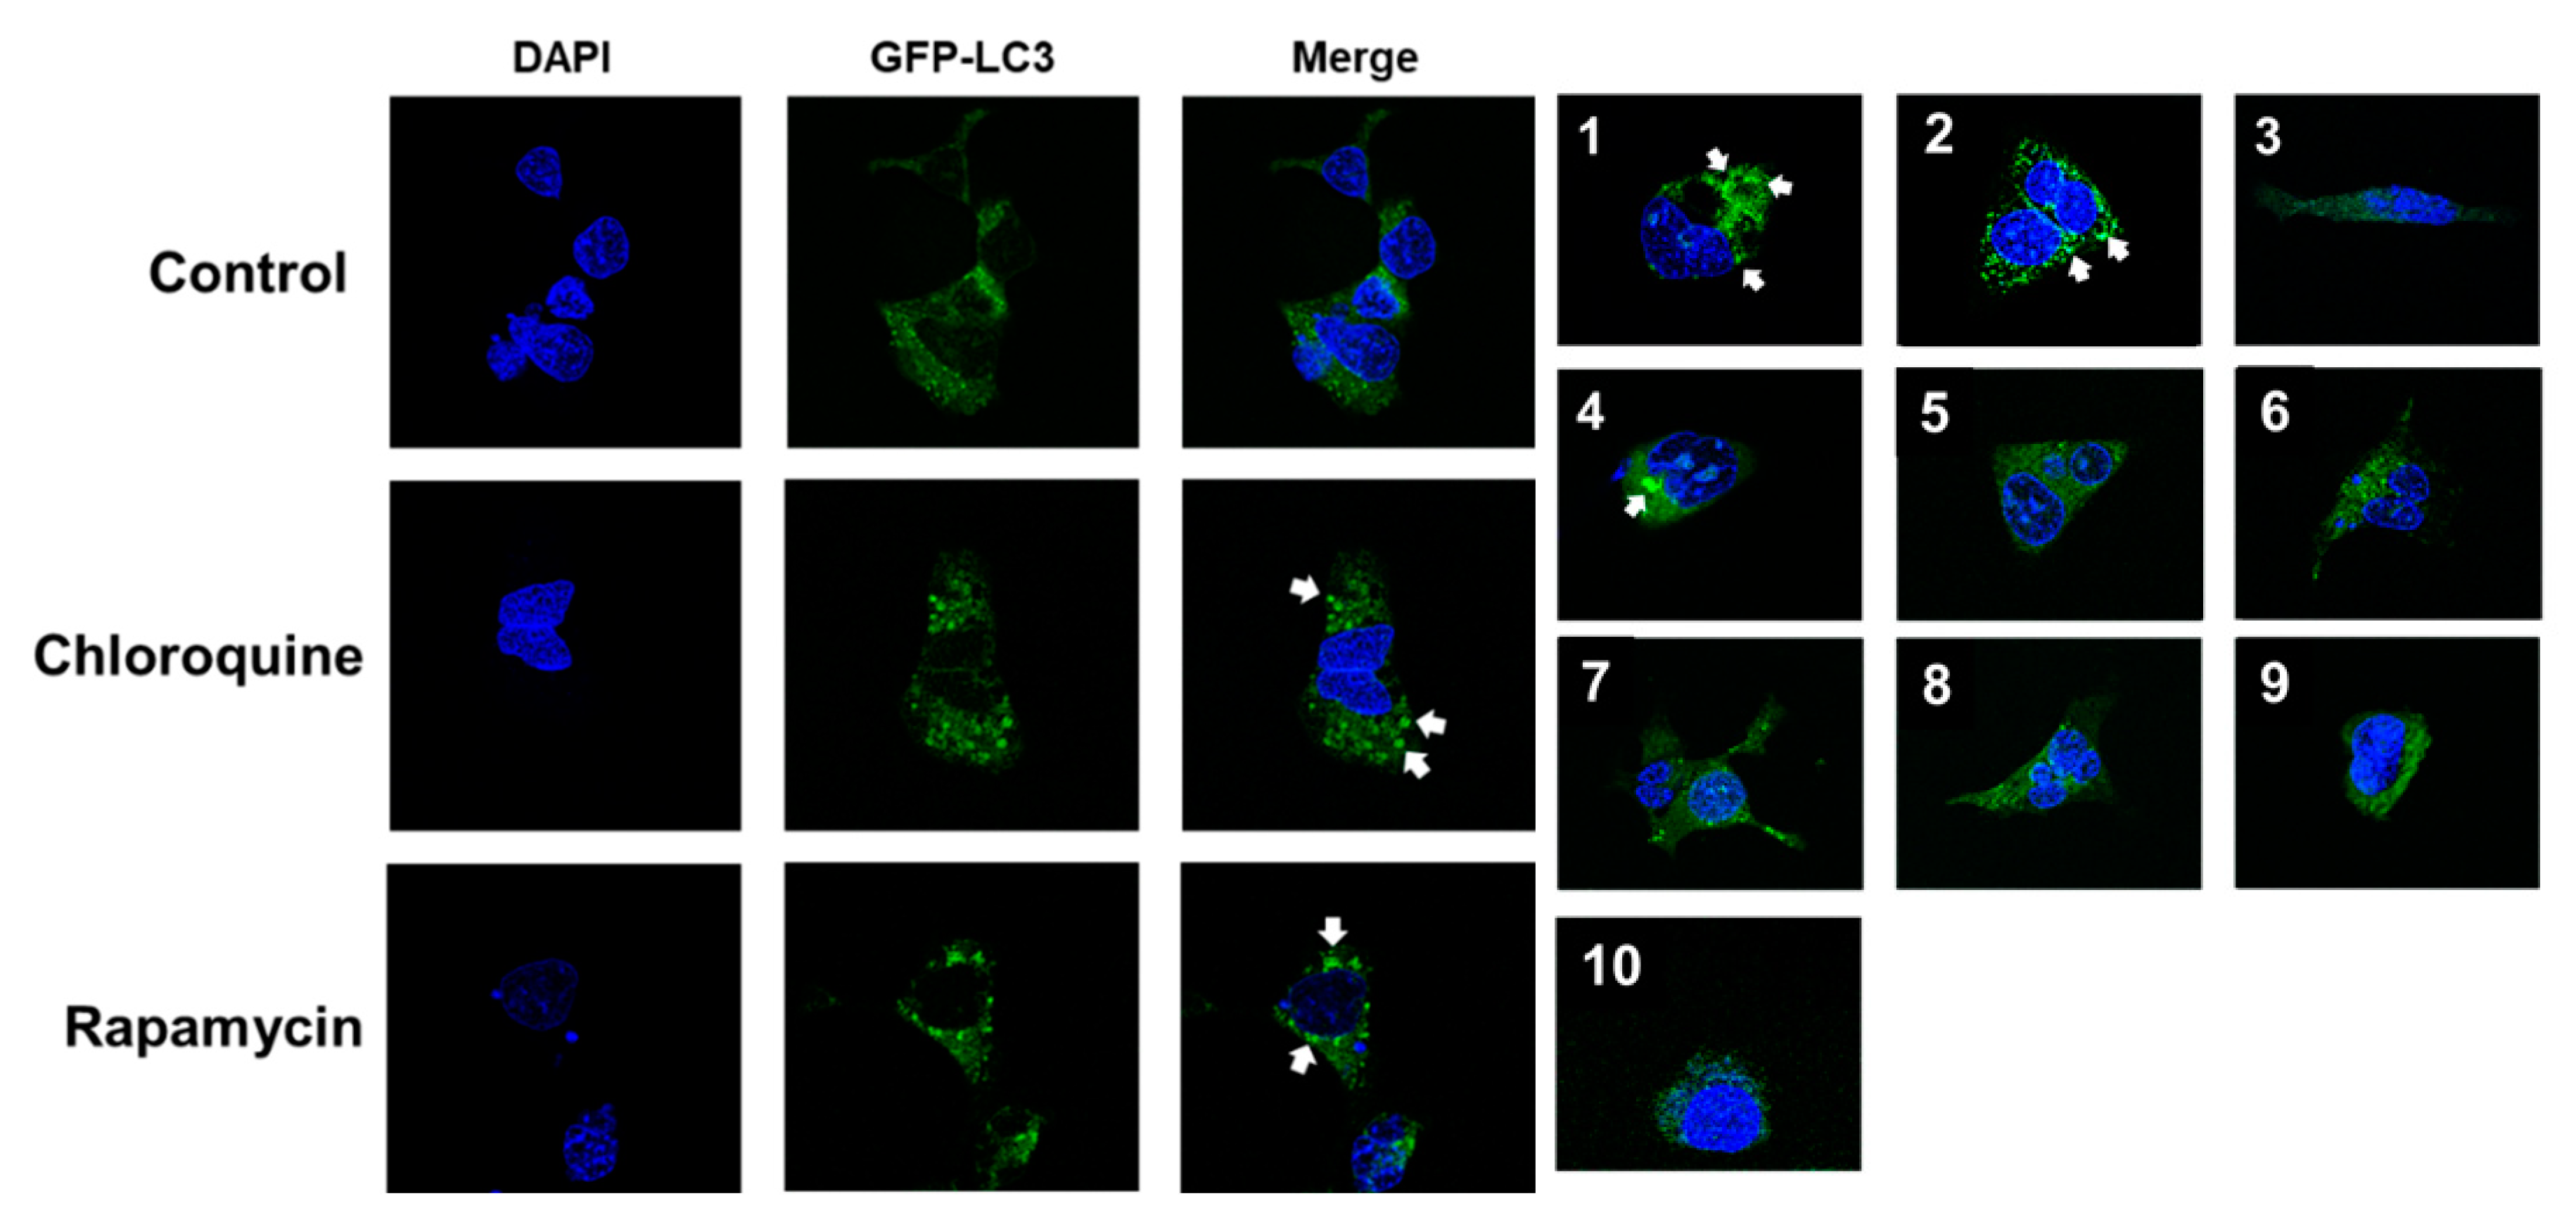
2.2. Screening of Autophagy Regulation in HEK293 Cells Stably Expressing GFP-LC3
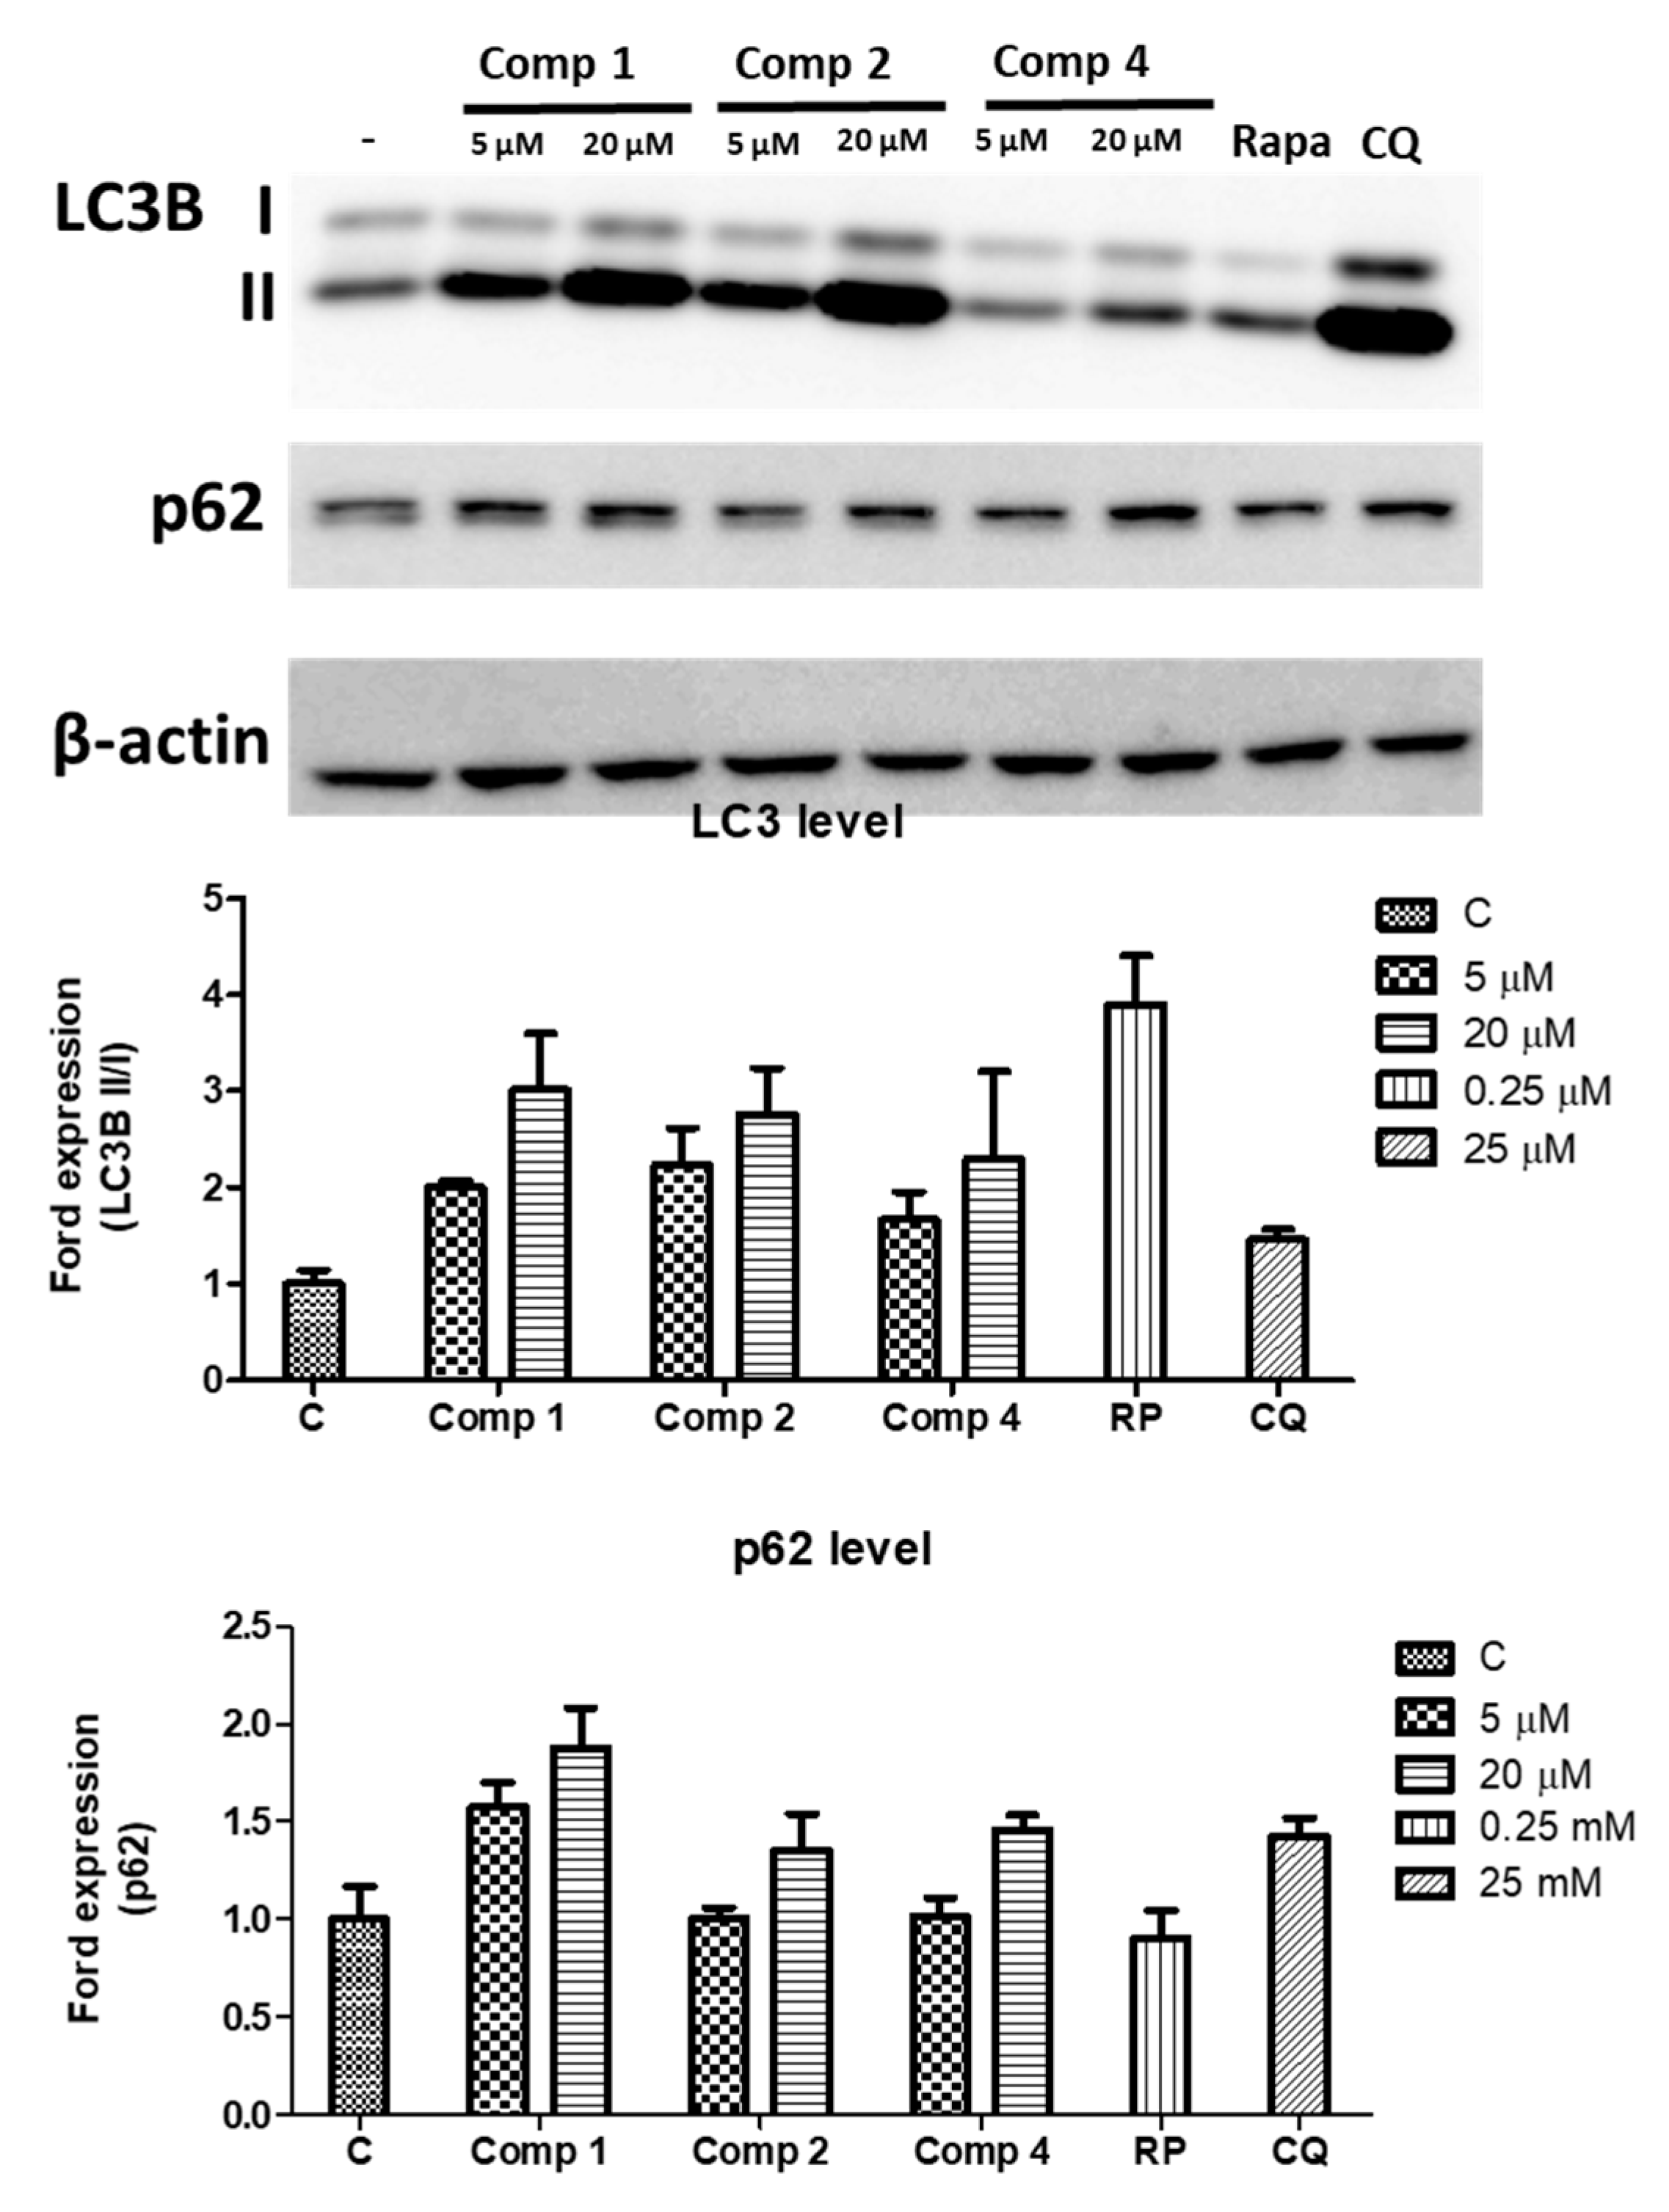
2.3. Upregulating the Protein Expression Levels of LC3B and p62 in HEK293 Cells
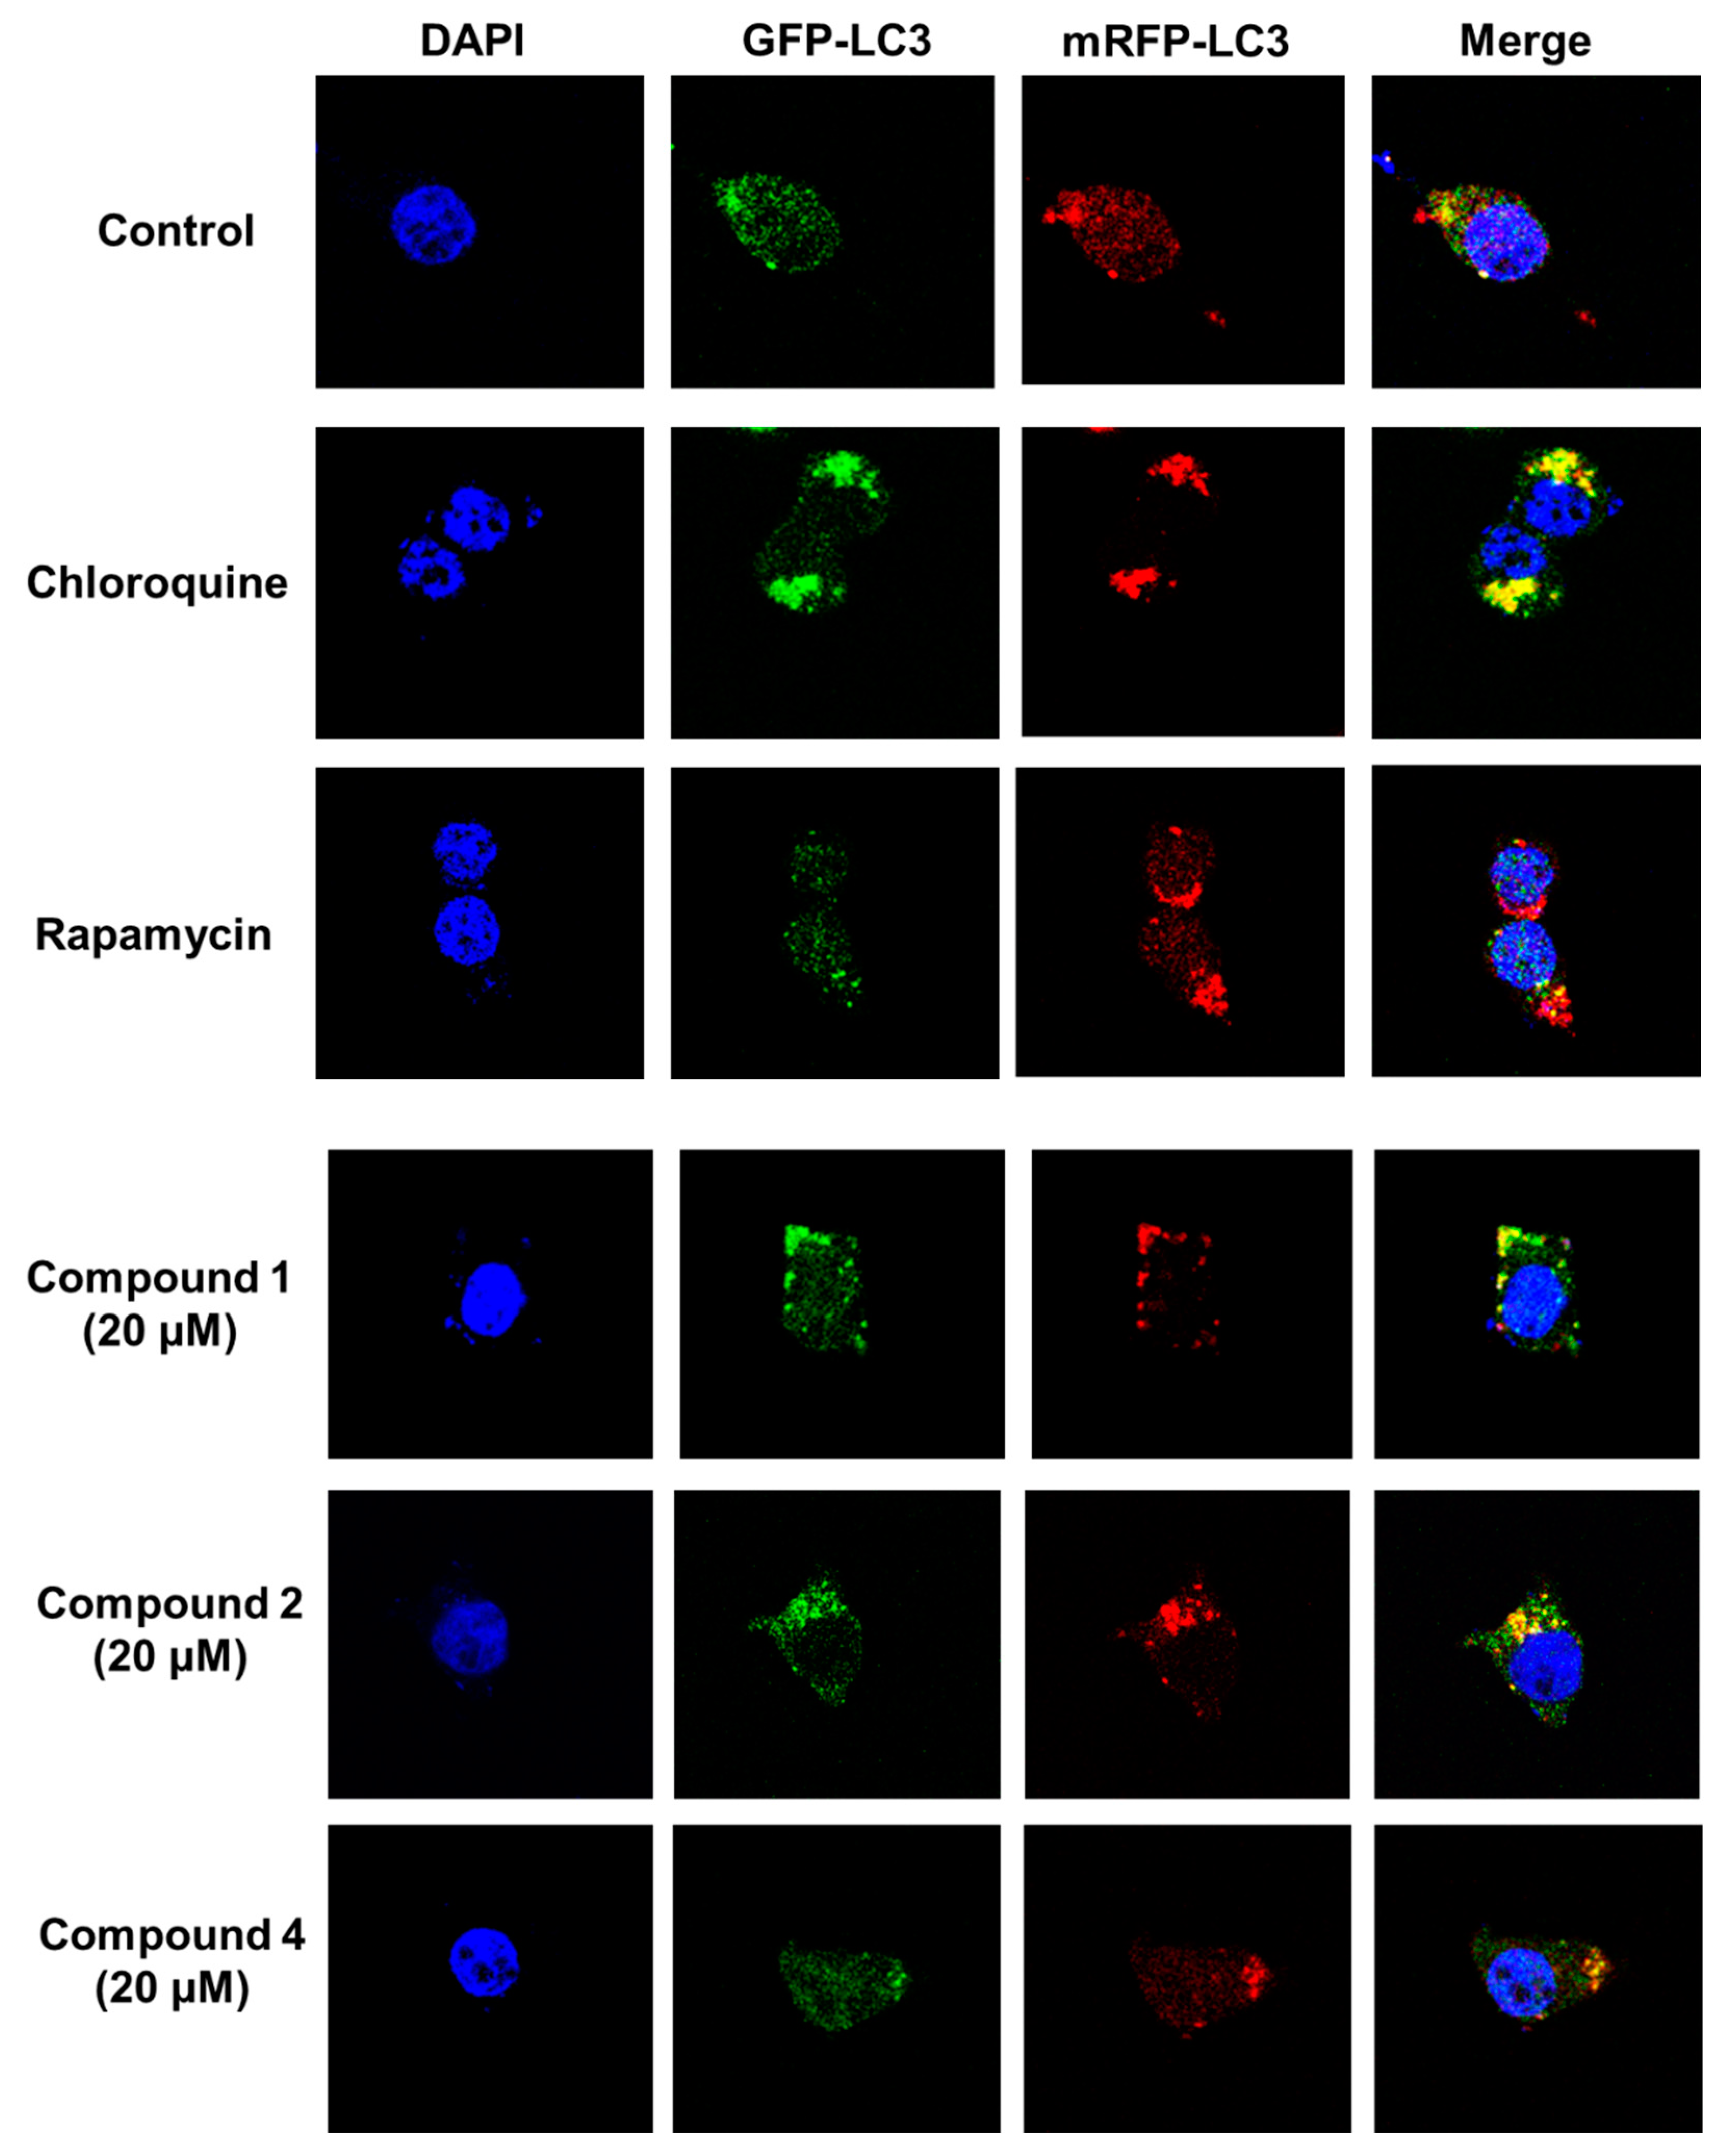
2.4. Blocking Autophagic Flux in HEK293 Cells Transfected with GFP-mRFP-LC3
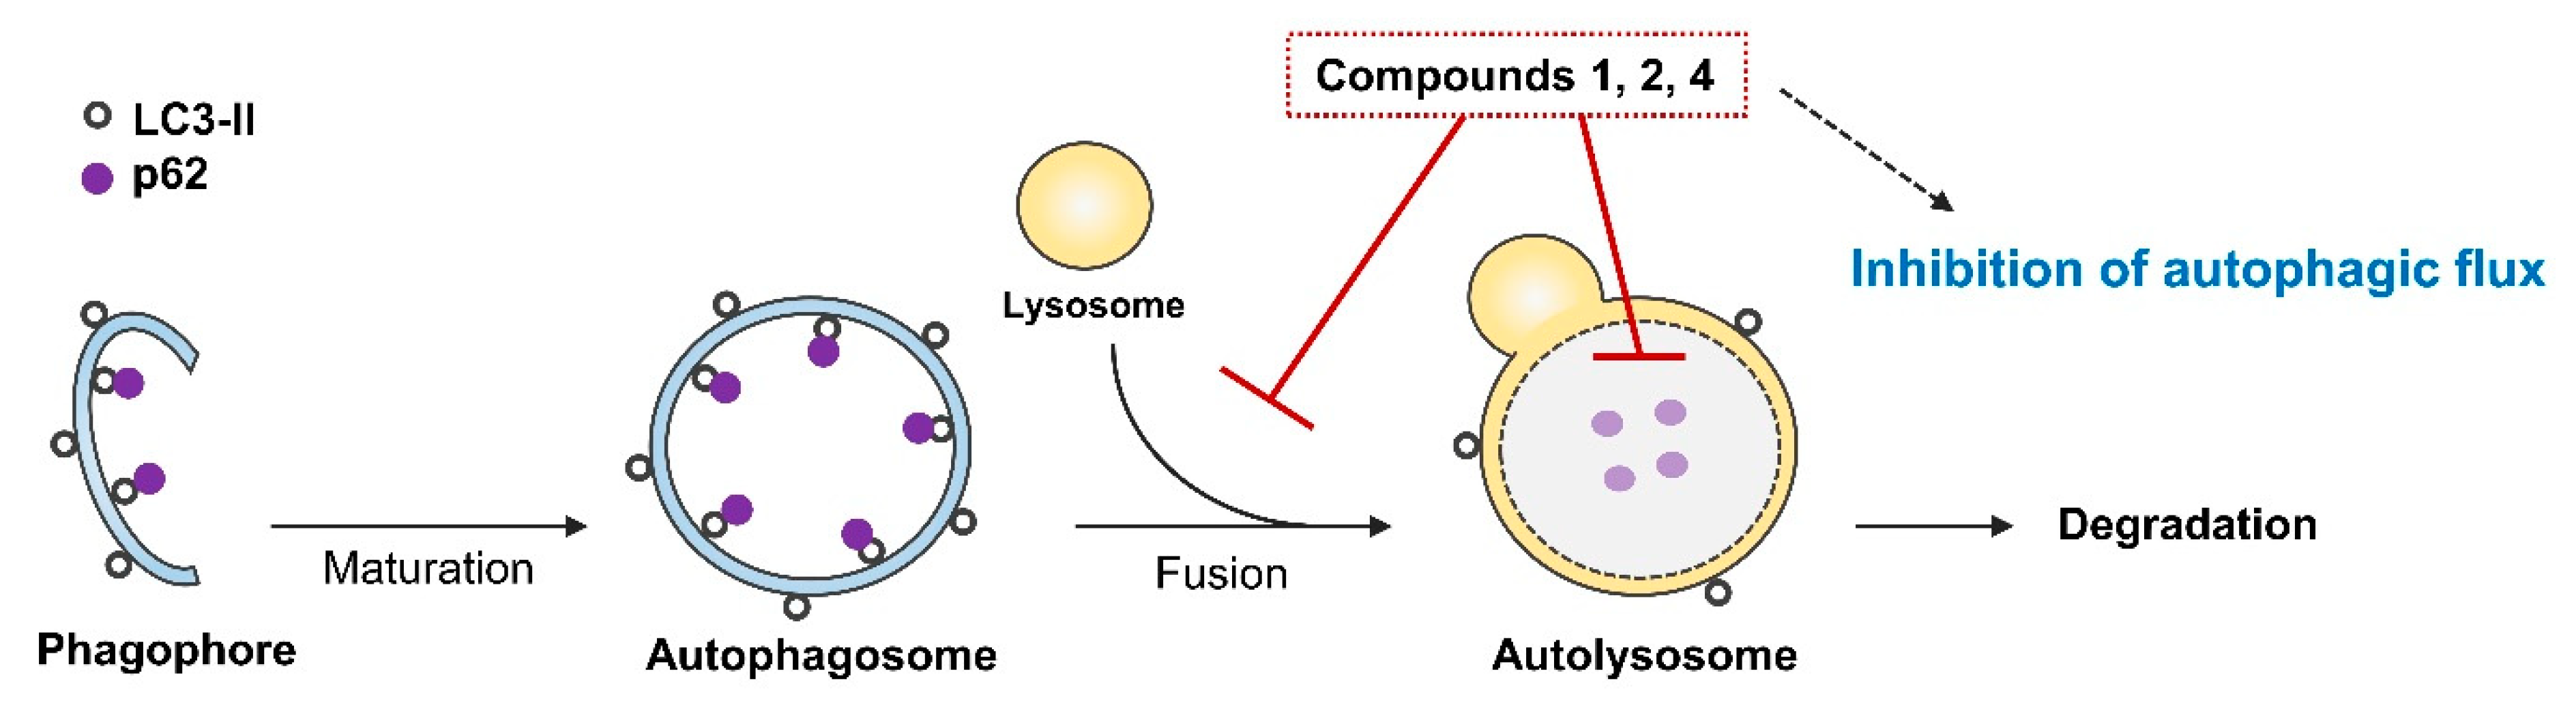
3. Discussion
4. Materials and Methods
4.1. General Experimental Procedures
4.2. Plant Material
4.3. Extraction and Isolation
4.4. Spectroscopic and Physical Characteristic of Compounds
4.5. Computational ECD Analysis of 1–4
4.6. Cell Culture Method
4.7. Cell Viability Assay
4.8. Confocal Microscopy Imaging
4.9. Protein Expression Analysis by Western Blot
5. Conclusions
Supplementary Materials
Author Contributions
Funding
Institutional Review Board Statement
Informed Consent Statement
Data Availability Statement
Acknowledgments
Conflicts of Interest
References
- Choi, A.M.K.; Ryter, S.W.; Levine, B. Autophagy in human health and disease. N. Engl. J. Med. 2013, 368, 651–662. [Google Scholar] [CrossRef]
- Mizushima, N.; Levine, B. Autophagy in mammalian development and differentiation. Nat. Cell Biol. 2010, 12, 823–830. [Google Scholar] [CrossRef]
- Vakifahmetoglu-Norberg, H.; Xia, H.; Yuan, J. Phamacologic agents targeting autophagy. J. Clin. Investig. 2015, 125, 5–13. [Google Scholar] [CrossRef] [Green Version]
- Sartori, R.; Romanello, V.; Sandri, M. Mechanisms of muscle astrophy and hypertrophy: Implications in health and disease. Nat. Commun. 2021, 12, 330. [Google Scholar] [CrossRef]
- Ferretta, A.; Gaballo, A.; Tanzarella, P.; Piccoli, C.; Capitanio, N.; Nico, B.; Annese, T.; Di Paola, M.; Dell’Aquila, C.; De Mari, M.; et al. Effect of resveratrol on mitochondrial function: Implications in parkin-associated familiar Parkinson’s disease. Biochim. Biophys. Acta (BBA)–Mol. Basis Dis. 2014, 1842, 902–915. [Google Scholar] [CrossRef] [Green Version]
- Jiang, T.F.; Zhang, Y.J.; Zhou, H.Y.; Wang, H.M.; Tian, L.P.; Liu, J.; Ding, J.Q.; Chen, S.D. Curcumin ameliorates the neurodegenerative pathology in A53T α-symuclein cell model of Parkinson’s disease through the downregulation of mTOR/p70S6K signaling and the recovery of macroautophagy. J. Neuroimmune Pharmacol. 2013, 8, 356–369. [Google Scholar] [CrossRef]
- Nazim, U.M.; Jeong, J.K.; Seol, J.W.; Hur, J.; Eo, S.K.; Lee, J.H.; Park, S.Y. Inhibition of the autophagy flux by gingerol enhances TRAIL-incuced tumor cell death. Oncol. Rep. 2015, 33, 2331–2336. [Google Scholar] [CrossRef] [PubMed] [Green Version]
- Forman, L. The menipsermaceae of Malaysia: II. Kew Bull. 1957, 12, 447–459. [Google Scholar] [CrossRef]
- Forman, L. A synosis of Thai Menispermaceae. Kew Bull. 1988, 43, 369–407. [Google Scholar] [CrossRef]
- Kim, K.H.; Wong, B.L. Pharmacological, electrophysiological and toxicity studies of Limacia scanden Lour. (Menispermaceae). J. Ethnopharmacol. 1998, 62, 137–148. [Google Scholar] [CrossRef]
- Tomita, M.; Furukawa, H. Alkaloids of limacia cuspidata the structures of three new bisbenzylisoquinoline alkaloids. Tetrahedron Lett. 1966, 7, 4293–4296. [Google Scholar] [CrossRef]
- Tomita, M.; Juichi, M.; Furukawa, H. Studies on the alkaloids of menispermaceous plants. 248. Alkaloids of limacia oblonga (Miers) Hook f. et. Thoms. Yakugaku Zasshi. 1947, 87, 1560–1561. [Google Scholar] [CrossRef] [Green Version]
- Yang, J.J.; Chen, Y.; Guo, M.L.; Chou, G.X. Chemical constituents from the roots of Lindera aggregata and their biological activities. J. Nat. Med. 2020, 74, 441–447. [Google Scholar] [CrossRef] [PubMed]
- Zou, H.; Yi, M.L.; Xu, K.P.; Sheng, X.F.; Tan, G.S. Two new flavonoids from Selaginella uncinata. J. Asian Nat. Prod. Res. 2016, 18, 248–252. [Google Scholar] [CrossRef] [PubMed]
- Lee, S.S.; Lin, Y.J.; Chen, C.K.; Liu, K.C.; Chen, C.H. Quaternary alklaoids from Litsea cubeba and Cryptocarya konishii. J. Nat. Prod. 1993, 56, 1971–1976. [Google Scholar] [CrossRef]
- Chen, J.H.; Du, Z.Z.; Shen, Y.M.; Yang, Y.P. Aporphine alkaloids from Clematis parviloba and their antifungal activity. Arch. Pharm. Res. 2009, 32, 3–5. [Google Scholar] [CrossRef]
- Marsaioli, A.J.; De AM Reis, F.; Magalhães, A.F.; Rúveda, E.A.; Kuck, A.M. 13C NMR analysis of aporphine alkaloids. Phytochemistry 1979, 18, 165–169. [Google Scholar] [CrossRef]
- Thuy, T.; Van Sung, T.; Franke, K.; Wessjohann, L. Aporphine and proaporphine alklaoids from Stephania rotunda. Vietnam J. Chem. 2005, 43, 619. [Google Scholar]
- Böhlke, M.; Guinaudeau, H.; Angerhofer, C.K.; Wongpanich, V.; Soejarto, D.D.; Farnsworth, N.P.; Mora, G.A.; Poveda, L.J. Costaricine, a new antiplasmodial bisbenzylisoquinoline alkaloid from Nectandra salicifolia trunk bark. J. Nat. Prod. 1996, 59, 576–580. [Google Scholar] [CrossRef]
- Yoon, Y.H.; Cho, K.S.; Hwang, J.J.; Lee, S.J.; Choi, J.A.; Koh, J.Y. Induction of lysosomal dilatation, arrested autophagy, and cell death by chloroquine in cultured ARPE-19 cells. Investig. Ophthalmol. Vis. Sci. 2010, 51, 6030–6037. [Google Scholar] [CrossRef] [Green Version]
- Lee, K.I.; Kim, M.J.; Koh, H.; Lee, J.I.; Namkoong, S.; Oh, W.K.; Park, J. The anti-hypertensive drug reserpine induces neuronal cell death through inhibition of autophagic flux. Biochem. Biophys. Res. Commun. 2015, 462, 402–408. [Google Scholar] [CrossRef] [PubMed]
- Kielian, M.C.; Cohn, Z.A. Intralysosomal accumulation of polyanions. Ⅱ. Polyanion internalization and its influence on lysosomal pH and membrane fluidity. J. Cell Biol. 1982, 93, 875–882. [Google Scholar] [CrossRef]
- Loos, B.; Toit, A.D.; Hofmeyr, J.H.S. Defining and measuring autophagosome flux-concept and reality. Autophagy 2014, 10, 2087–2096. [Google Scholar] [CrossRef]
- Wang, H.; Liu, T.; Li, L.; Wang, Q.; Yu, C.; Liu, X.; Li, W. Tetrandrine is a potent cell autophagy agonist via activated intracellular reactive oxygen species. Cell Biosci. 2015, 5, 4. [Google Scholar] [CrossRef] [PubMed] [Green Version]
- Kimura, S.; Noda, T.; Yoshimori, T. Dessection of the autophagosome maturation process by a novel reporter protein, tandom fluorescent-tagged LC3. Autophagy 2007, 3, 452–460. [Google Scholar] [CrossRef] [PubMed] [Green Version]
- Panzarini, E.; Inguscio, V.; Tenuzzo, B.A.; Carata, E.; Dini, L. Nanomaterials and autophagy: New insights in cancer treatment. Cancers 2013, 5, 296–319. [Google Scholar] [CrossRef] [PubMed]
- Huang, D.D.; Yan, X.L.; Fan, S.D.; Chen, X.Y.; Yan, J.Y.; Dong, Q.T.; Chen, W.Z.; Liu, N.X.; Chen, X.L.; Yu, Z. Nrf2 deficiency promotes the increasing trend of autophagy during aging in skeletal muscle: A potential mechanism for the development of sarcopenia. Aging 2020, 12, 5977–5991. [Google Scholar] [CrossRef]
- Zhang, Z.; Liu, T.; Yu, M.; Li, K.; Li, W. The plant alklaoid tetrandrine inhibits metastasis via autophagy-dependent Wnt/β-catenin and metastatic tumor antigen 1 signaling in human liver cancer cells. J. Exp. Clin. Cancer Res. 2018, 37, 7. [Google Scholar] [CrossRef] [Green Version]
- Zhu, F.; Li, X.; Tang, X.; Jiang, J.; Han, Y.; Li, Y.; Ma, C.; Liu, Z.; He, Y. Neferine promotes the apoptosis of HNSCC through the accumulation of p62/SQSTM1 caused by autophagic flux inhibition. Int. J. Mol. Med. 2020, 48, 124. [Google Scholar] [CrossRef]


| Position | 1 a | 2 a | 3 b | 4 c | ||||
|---|---|---|---|---|---|---|---|---|
| δh (Multi, J in Hz) | δc | δh (Multi, J in Hz) | δc | δh (Multi, J in Hz) | δc | δh (Multi, J in Hz) | δc | |
| 1 | 4.57, t (7.0) | 57.4 | 4.57, t (7.2) | 57.5 | 4.18, m | 55.5 | 4.08, s | 55.7 |
| 3 | 3.45, m | 40.4 | 3.46, m | 40.5 | 3.14, m 2.91, m | 39.3 | 3.11, s 2.85, s | 39.4 |
| 4 | 2.98, m | 25.8 | 2.99, m | 25.8 | 2.67, m | 27.1 | 2.62, m | 27.8 |
| 4a | 123.6 | 123.6 | 124.2 | 124.7 | ||||
| 5 | 6.69, s | 112.6 | 6.75, s | 112.6 | 6.61, s | 112.1 | 6.59, s | 112.1 |
| 6 | 149.3 | 149.3 | 146.4 | 146.2 | ||||
| 7 | 146.6 | 146.6 | 144.4 | 144.3 | ||||
| 8 | 6.47, s | 114.4 | 6.46, s | 114.4 | 6.53, s | 113.5 | 6.55, s | 113.5 |
| 8a | 124.7 | 124.7 | 128.2 | 129.3 | ||||
| α | 3.26, m 2.98, m | 40.2 | 3.26, m 2.98, m | 40.2 | 3.02, dd (13.8, 4.9) 2.83, dd (13.8, 8.4) | 39.9 | 2.97, dd (13.3, 3.1) 2.78, dd (12.7, 8.9) | 40.4 |
| 9 | 128.3 | 128.3 | 129.6 | 130.2 | ||||
| 10 | 6.78, s | 124.1 | 6.80, d (1.6) | 124.1 | 6.97, d (1.9) | 123.5 | 6.93, overlapped | 123.5 |
| 11 | 144.3 | 144.3 | 140.7 | 141.1 | ||||
| 12 | 150.1 | 150.1 | 147.8 | 147.7 | ||||
| 13 | 6.96, d (8.2) | 118.9 | 6.96, d (8.2) | 118.9 | 6.95, overlapped | 117.4 | 6.94, overlapped | 117.2 |
| 14 | 7.03, d (7.4) | 127.8 | 7.02, dd (8.2, 1.8) | 127.8 | 7.03, dd (8.2, 1.6) | 127.3 | 7.00, d (7.9) | 126.9 |
| 1′ | 156.4 | 156.4 | 153.1 | 161.4 | ||||
| 2′ | 7.87, br s | 131.1 | ||||||
| 3′ | 8.27, d (6.3) | 128.9 | 8.26, d (6.5) | 128.8 | 8.32, d (5.5) | 138.9 | 6.88, br s | 115.3 |
| 4′ | 8.15, d (6.0) | 124.1 | 8.15, d (6.4) | 124.1 | 7.80, d (5.5) | 121.1 | 125.3 | |
| 4′a | 137.9 | 137.9 | 132.6 | |||||
| 5′ | 7.63, s | 107.5 | 7.63, s | 107.5 | 7.28, s | 105.6 | 6.88, br s | 115.3 |
| 6′ | 158.3 | 158.3 | 152.9 | 7.87, br s | 131.1 | |||
| 7′ | 152.4 | 152.4 | 149.1 | 167.4 | ||||
| 8′ | 7.52, s | 109.1 | 7.50, s | 109.1 | 7.45, s | 106.5 | ||
| 8′a | 122.1 | 122.1 | 121.9 | |||||
| α′ | 6.60, s | 71.5 | 6.61, s | 71.4 | 193.5 | |||
| 9′ | 135.3 | 135.5 | 130.2 | |||||
| 10′ | 7.33, d (8.4) | 130.2 | 7.33, d (8.6) | 130.2 | 7.77, d (8.8) | 132.5 | ||
| 11′ | 6.91, d (8.4) | 118.3 | 6.91, d (8.6) | 118.3 | 6.95, overlapped | 115.5 | ||
| 12′ | 160.1 | 160.1 | 162.5 | |||||
| 13′ | 6.91, d (8.4) | 118.3 | 6.91, d (8.6) | 118.3 | 6.95, overlapped | 115.5 | ||
| 14′ | 7.33, d (8.4) | 130.2 | 7.33, d (8.6) | 130.2 | 7.77, d (8.9) | 132.5 | ||
| 6-OCH3 | 3.79, s | 56.4 | 3.84, s | 56.4 | 3.68, s | 55.5 | 3.71, s | 55.5 |
| 6′-OCH3 | 4.11, s | 57.4 | 4.12, s | 57.4 | 3.96, s | 55.8 | ||
Publisher’s Note: MDPI stays neutral with regard to jurisdictional claims in published maps and institutional affiliations. |
© 2022 by the authors. Licensee MDPI, Basel, Switzerland. This article is an open access article distributed under the terms and conditions of the Creative Commons Attribution (CC BY) license (https://creativecommons.org/licenses/by/4.0/).
Share and Cite
Lee, H.-J.; Park, E.-J.; Ryu, B.; Cho, H.-M.; Nghiem, D.-T.; Pham, H.-T.-T.; Pan, C.-H.; Oh, W.-K. Benzylisoquinoline Alkaloids from the Stems of Limacia scandens and Their Potential as Autophagy Inhibitors. Pharmaceuticals 2022, 15, 1332. https://doi.org/10.3390/ph15111332
Lee H-J, Park E-J, Ryu B, Cho H-M, Nghiem D-T, Pham H-T-T, Pan C-H, Oh W-K. Benzylisoquinoline Alkaloids from the Stems of Limacia scandens and Their Potential as Autophagy Inhibitors. Pharmaceuticals. 2022; 15(11):1332. https://doi.org/10.3390/ph15111332
Chicago/Turabian StyleLee, Hee-Ju, Eun-Jin Park, Byeol Ryu, Hyo-Moon Cho, Duc-Trong Nghiem, Ha-Thanh-Tung Pham, Cheol-Ho Pan, and Won-Keun Oh. 2022. "Benzylisoquinoline Alkaloids from the Stems of Limacia scandens and Their Potential as Autophagy Inhibitors" Pharmaceuticals 15, no. 11: 1332. https://doi.org/10.3390/ph15111332