
Flow Patterns and Particle Residence Times in the Oral Cavity during Inhaled Drug Delivery
 , , ,
, , ,
Abstract
:
1. Introduction
2. Results
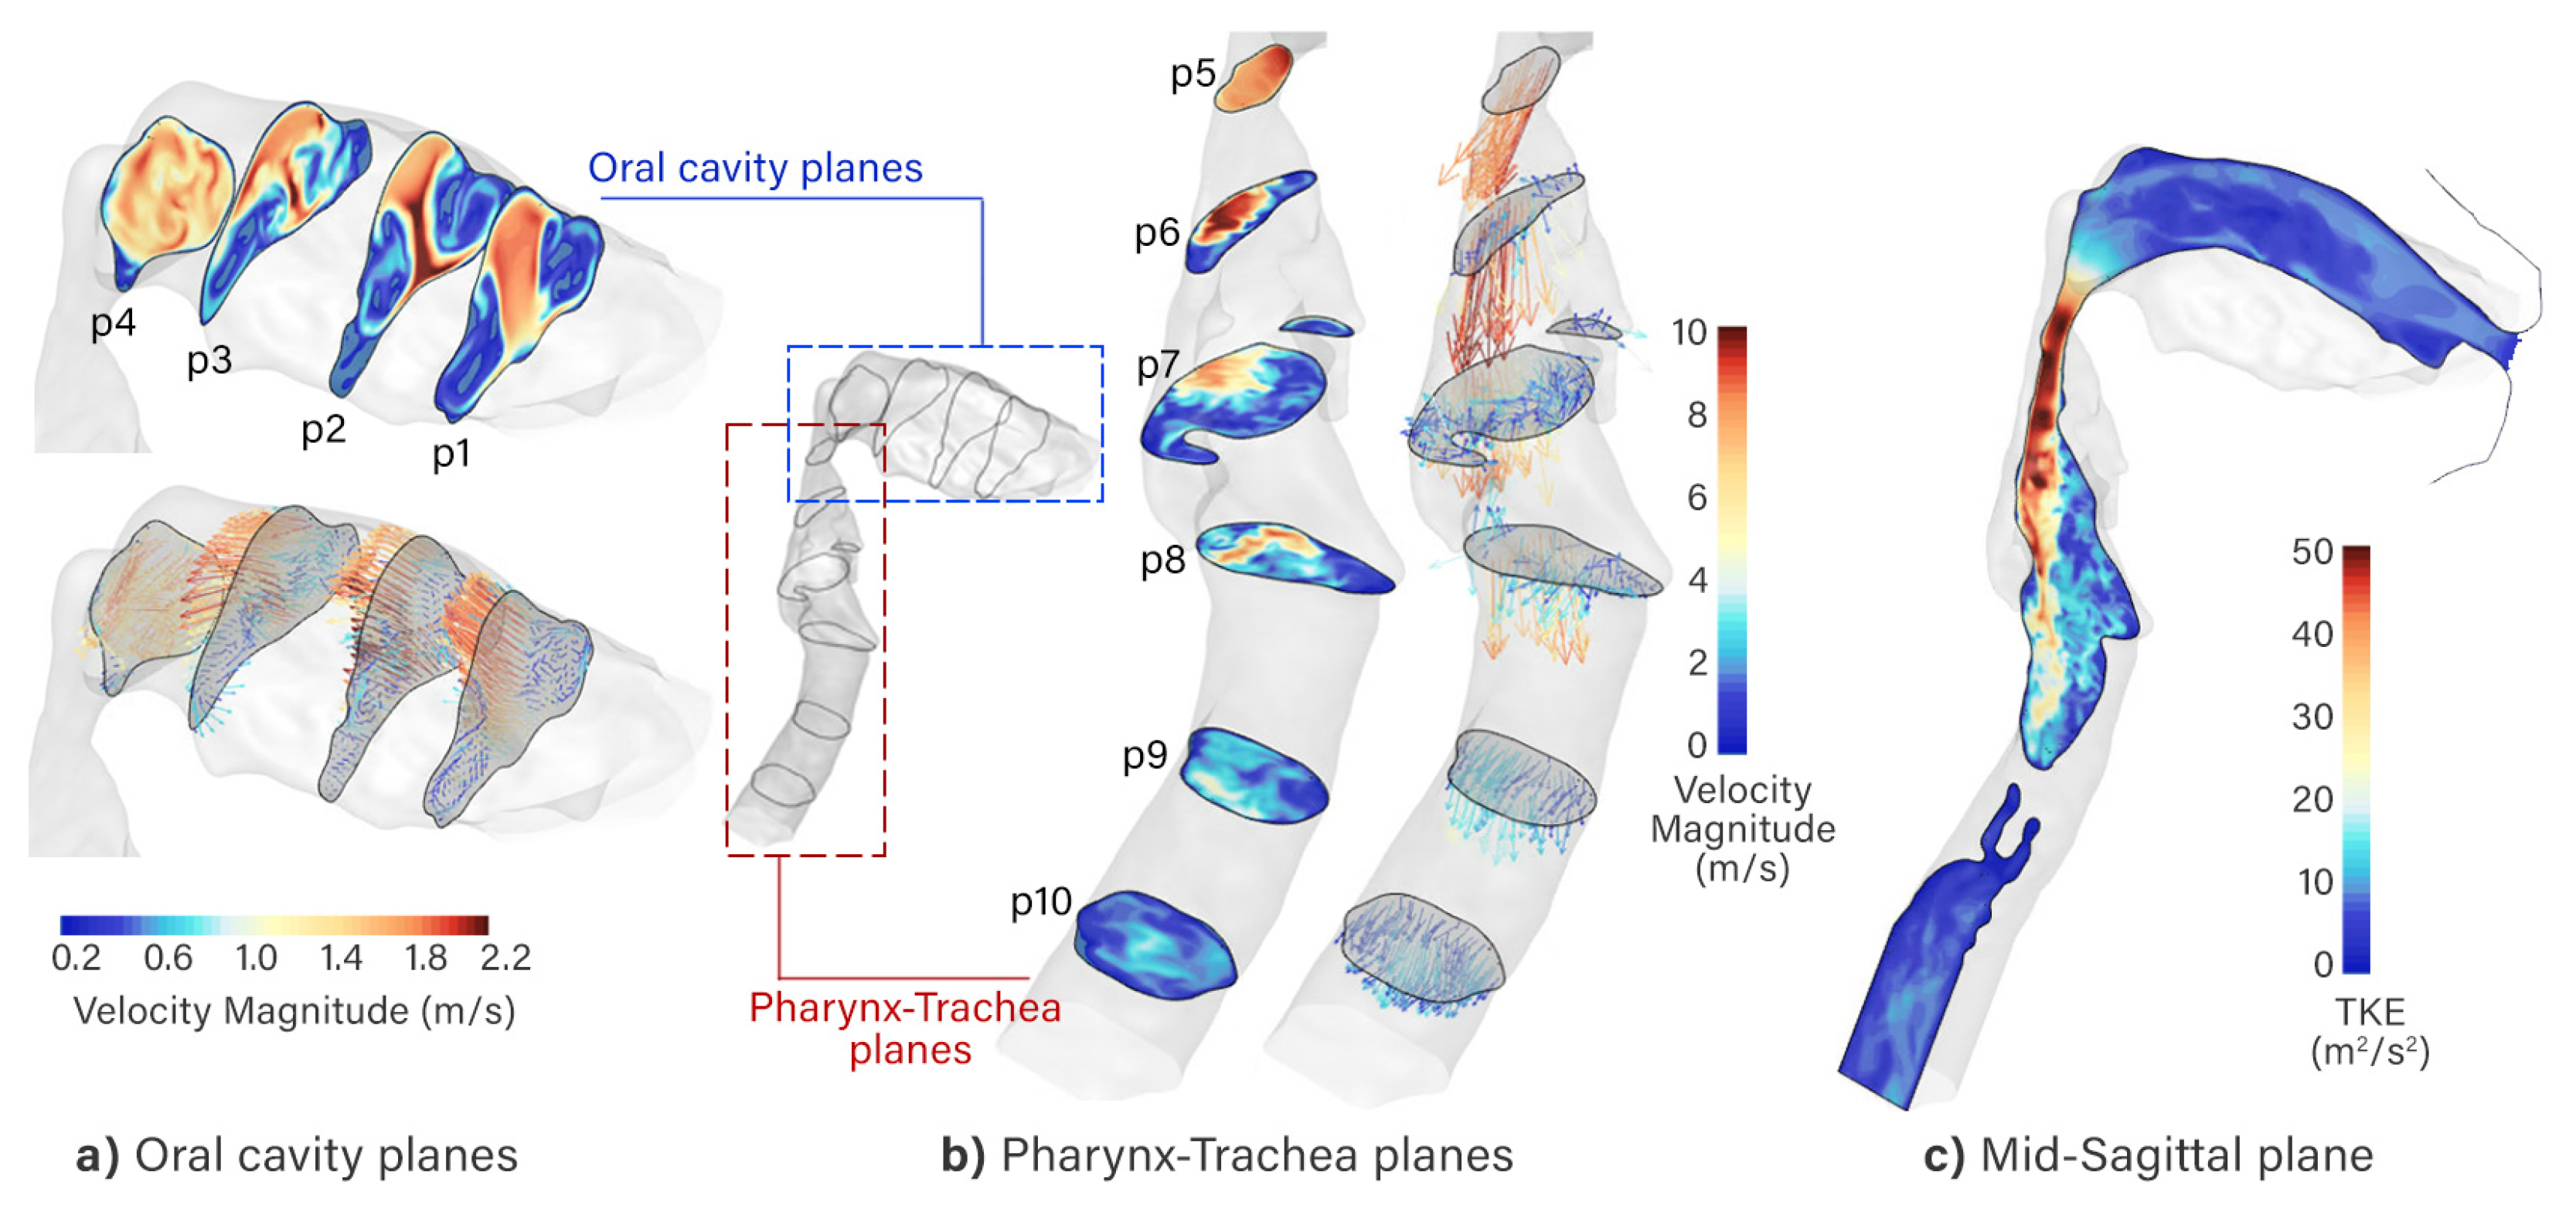
2.1. Flow Pattern
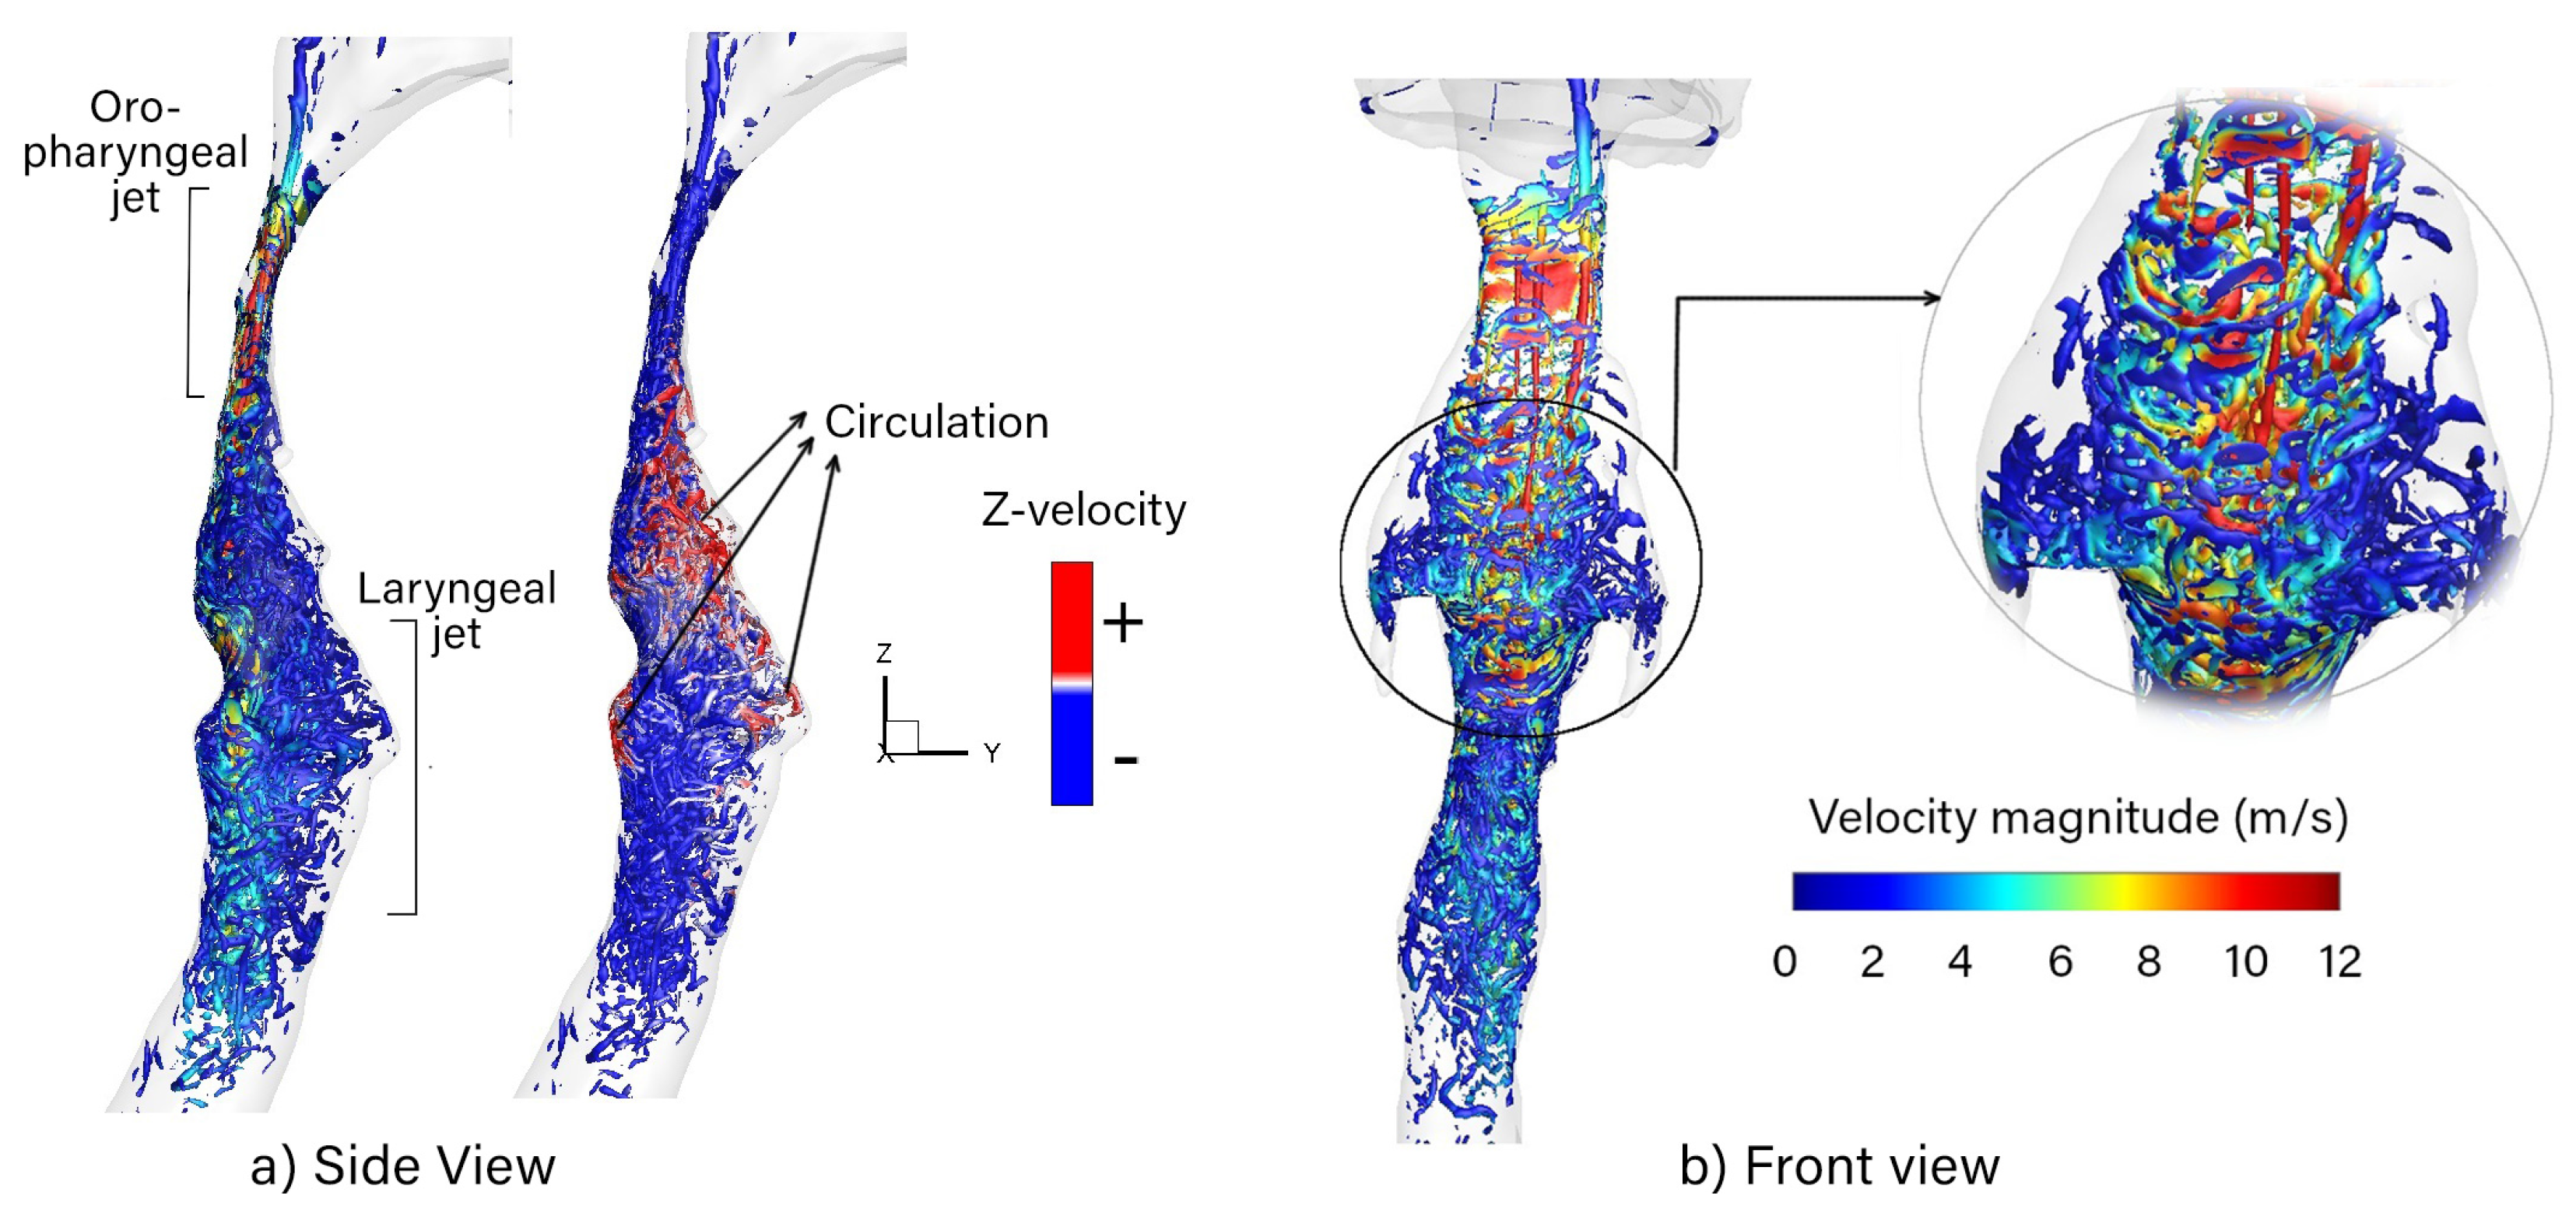
2.2. Vortex Structures
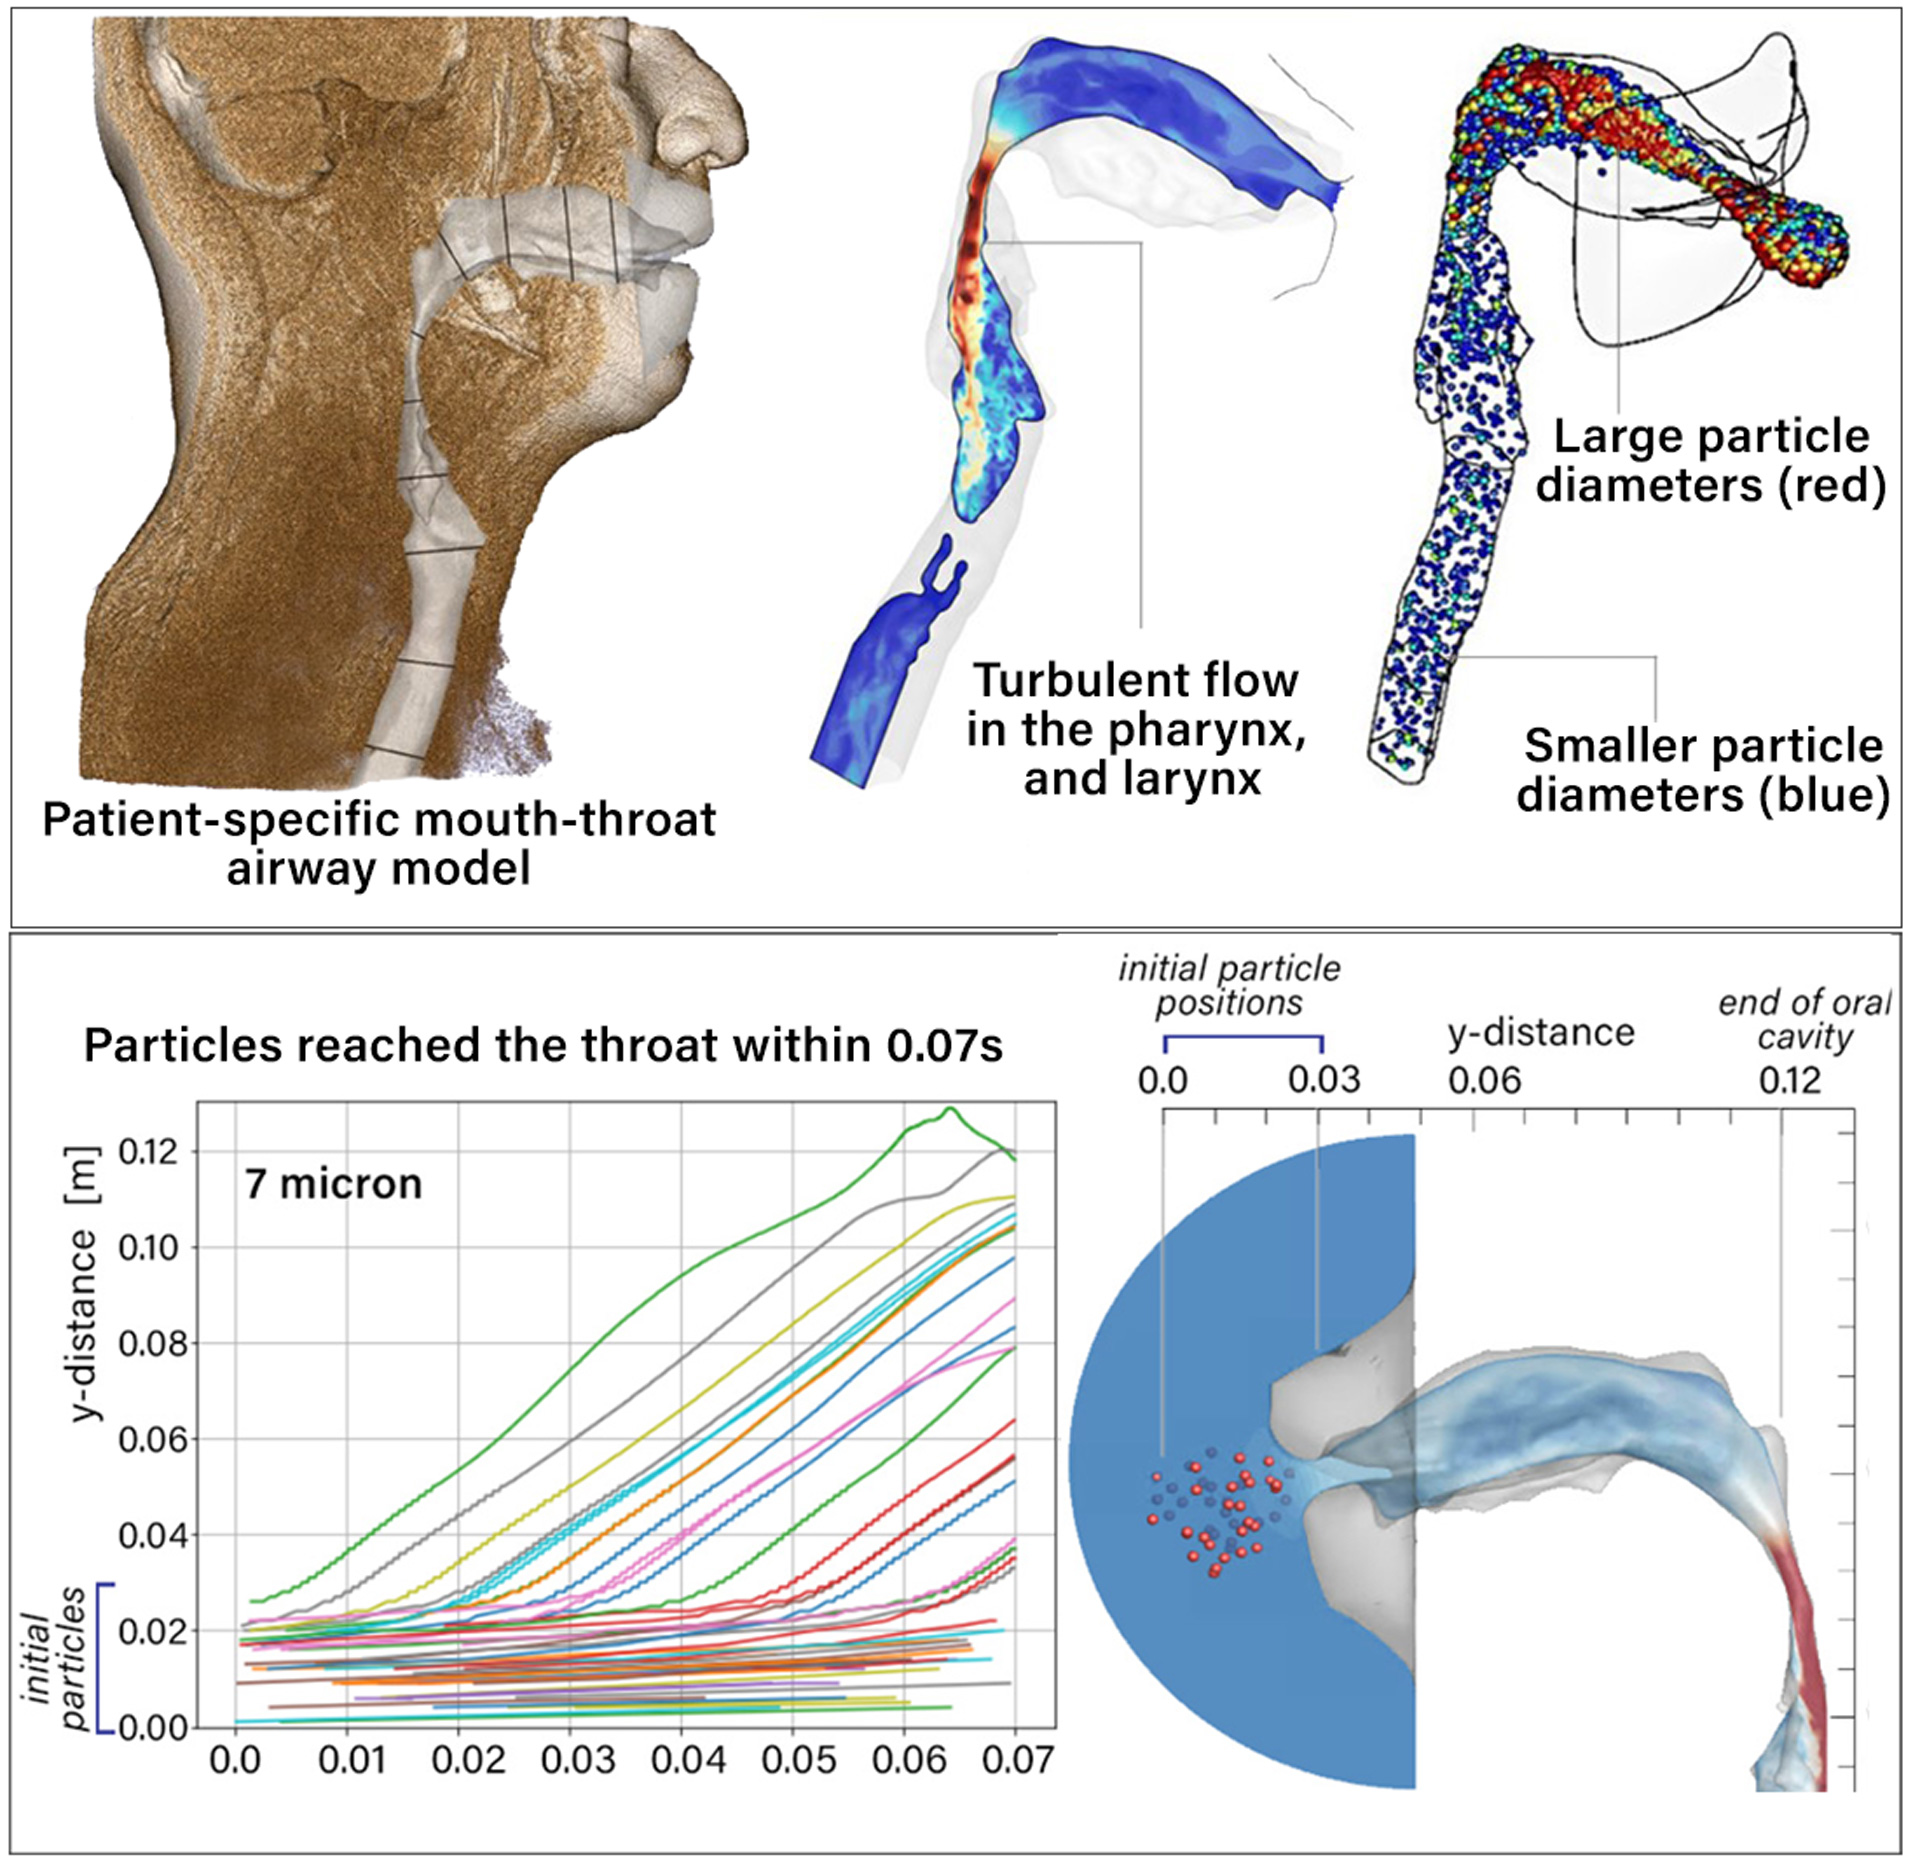
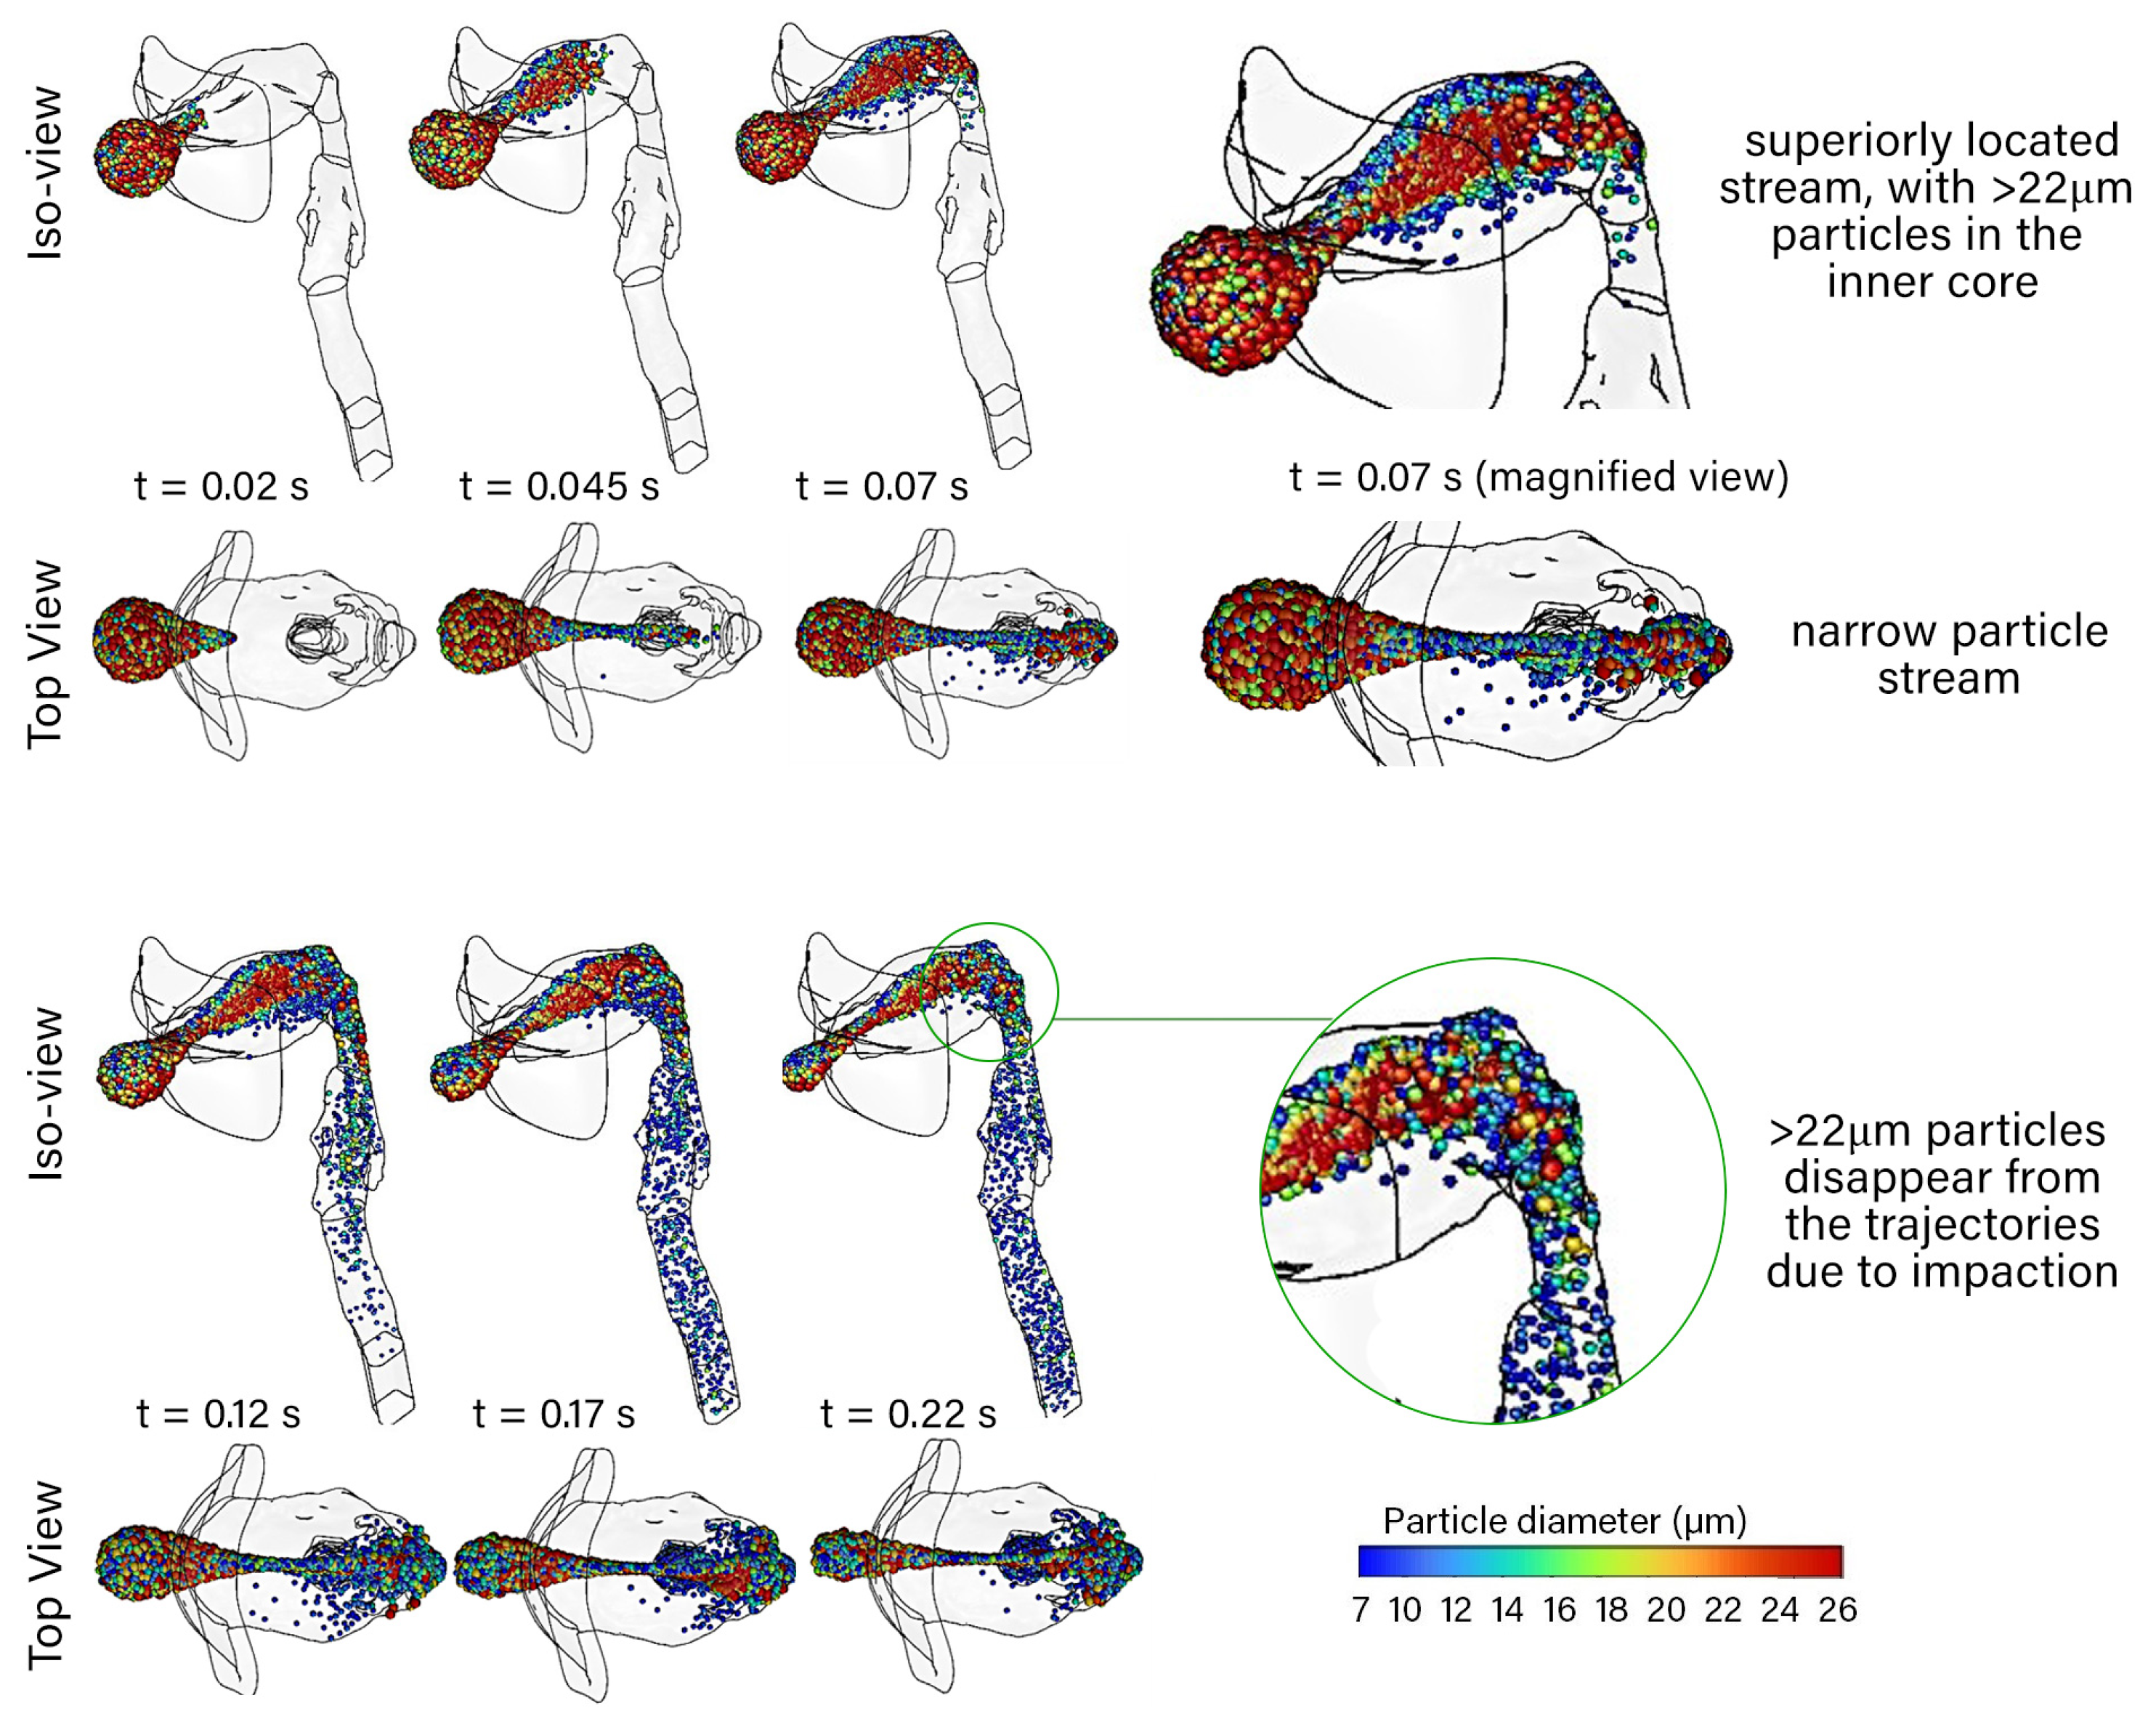
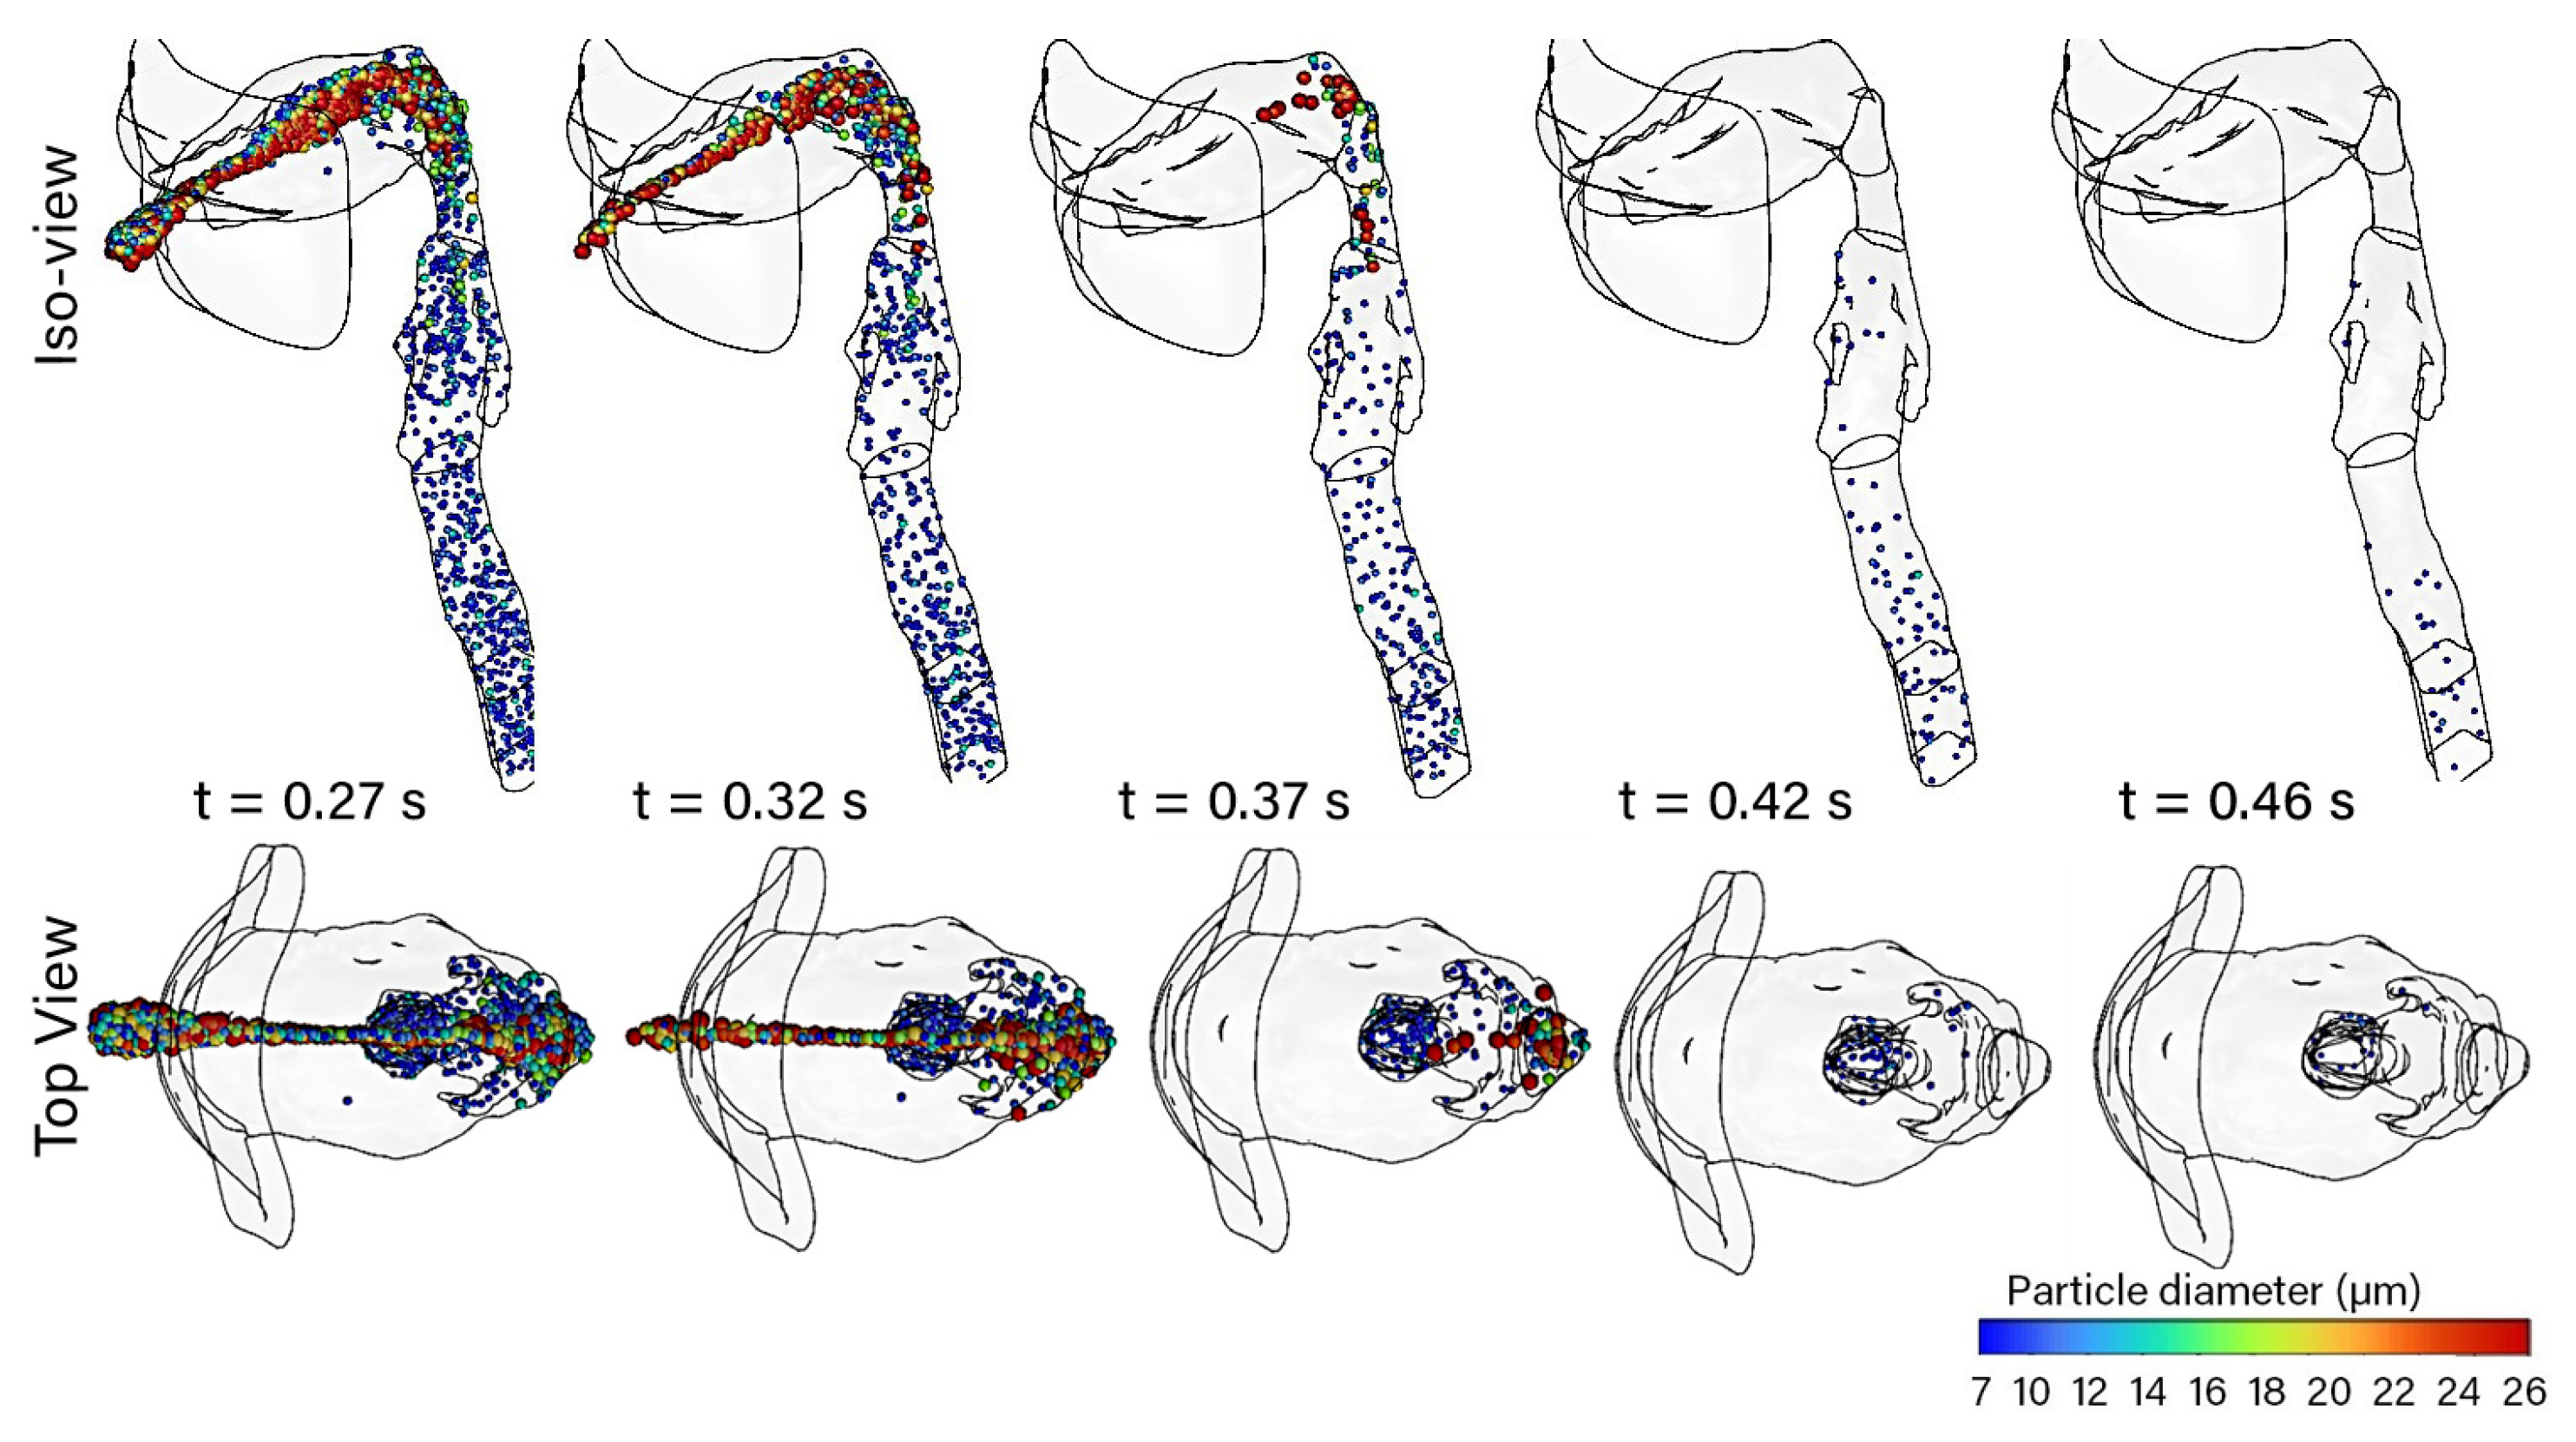
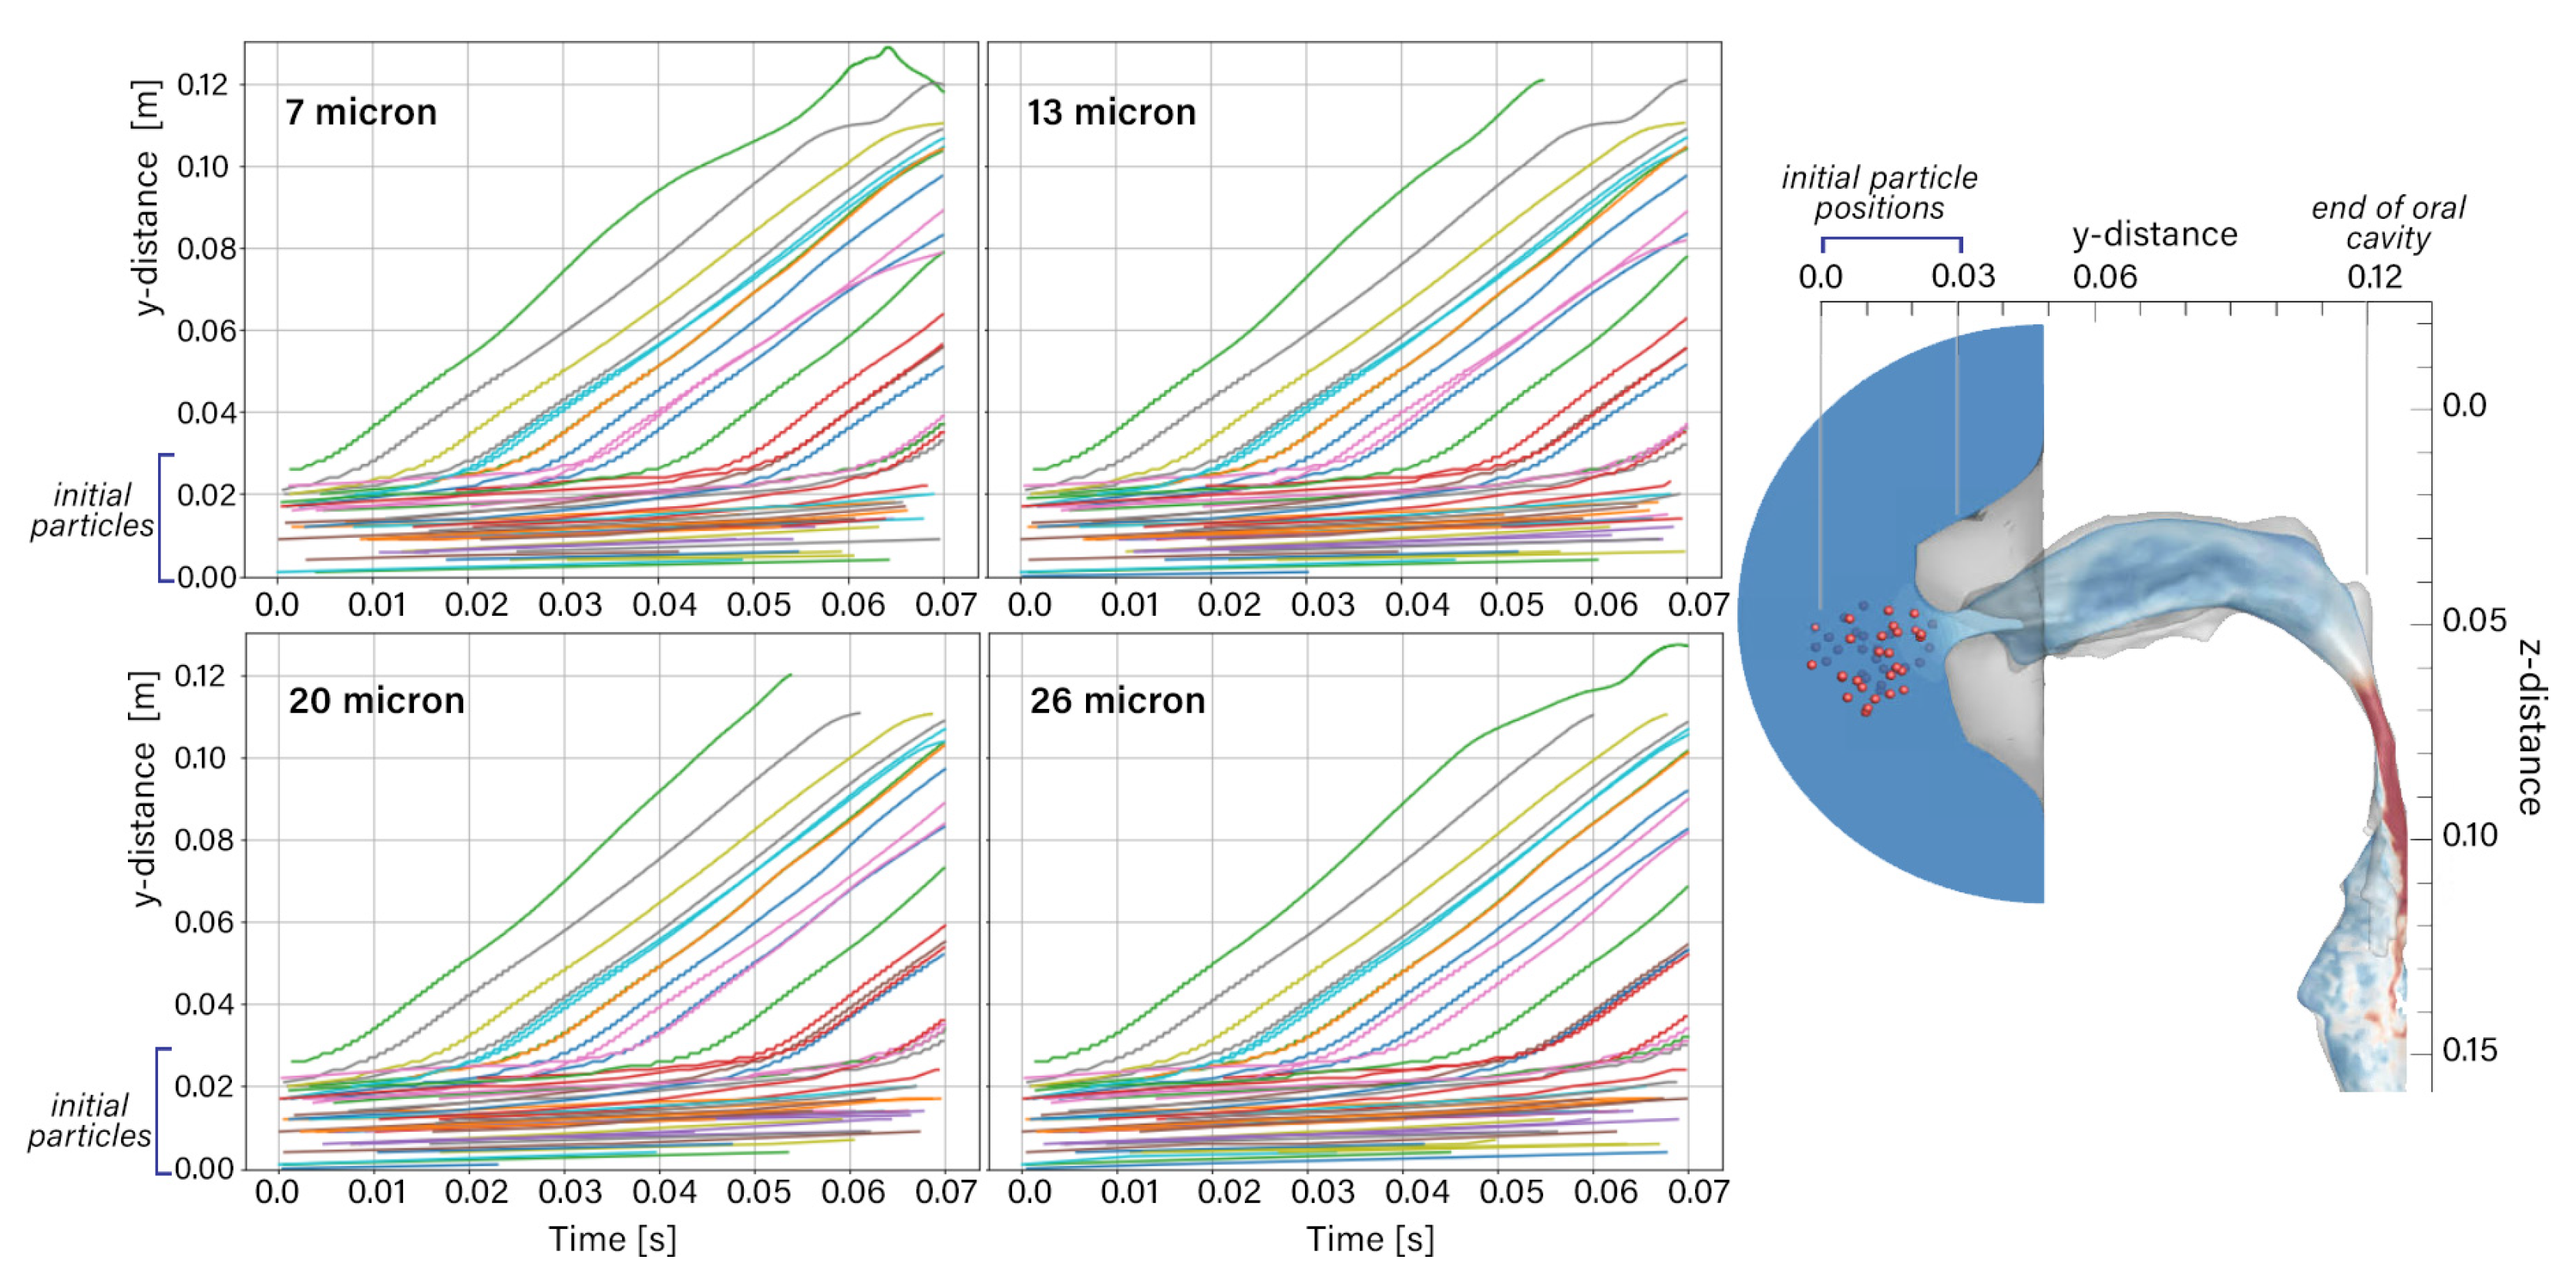
2.3. Particle Trajectories
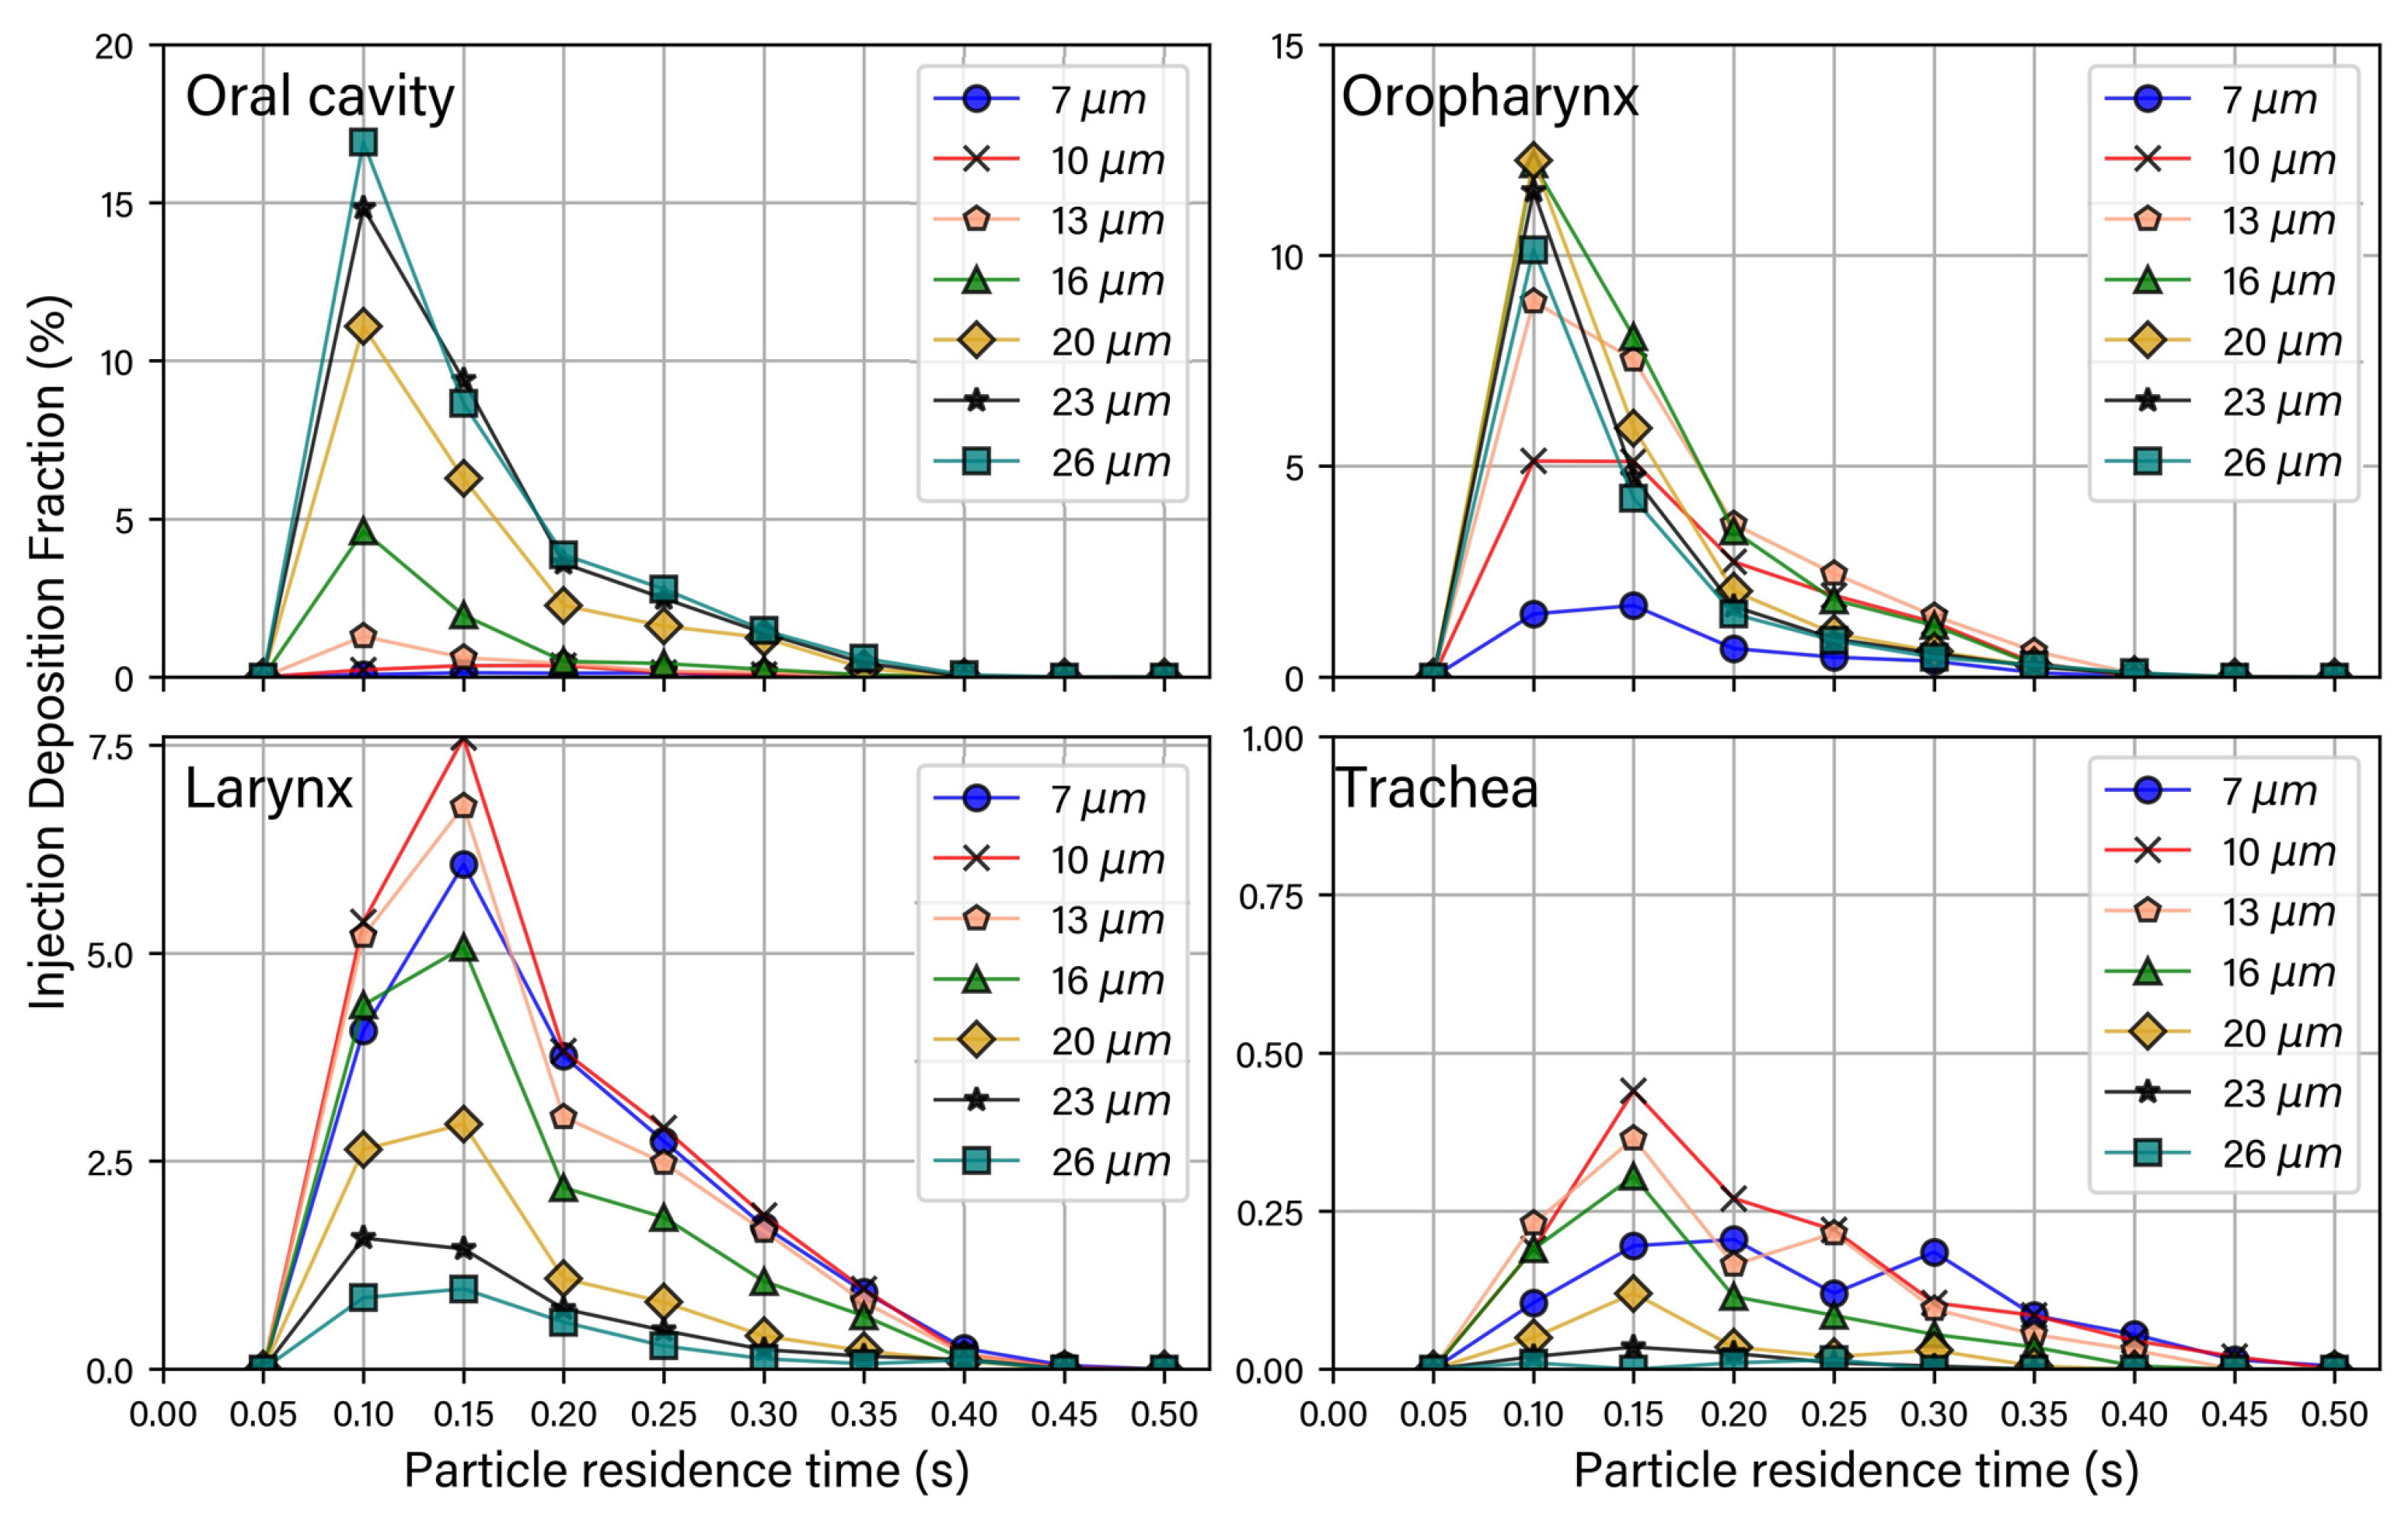
2.4. Particle Deposition Fractions
3. Discussion
4. Materials and Methods
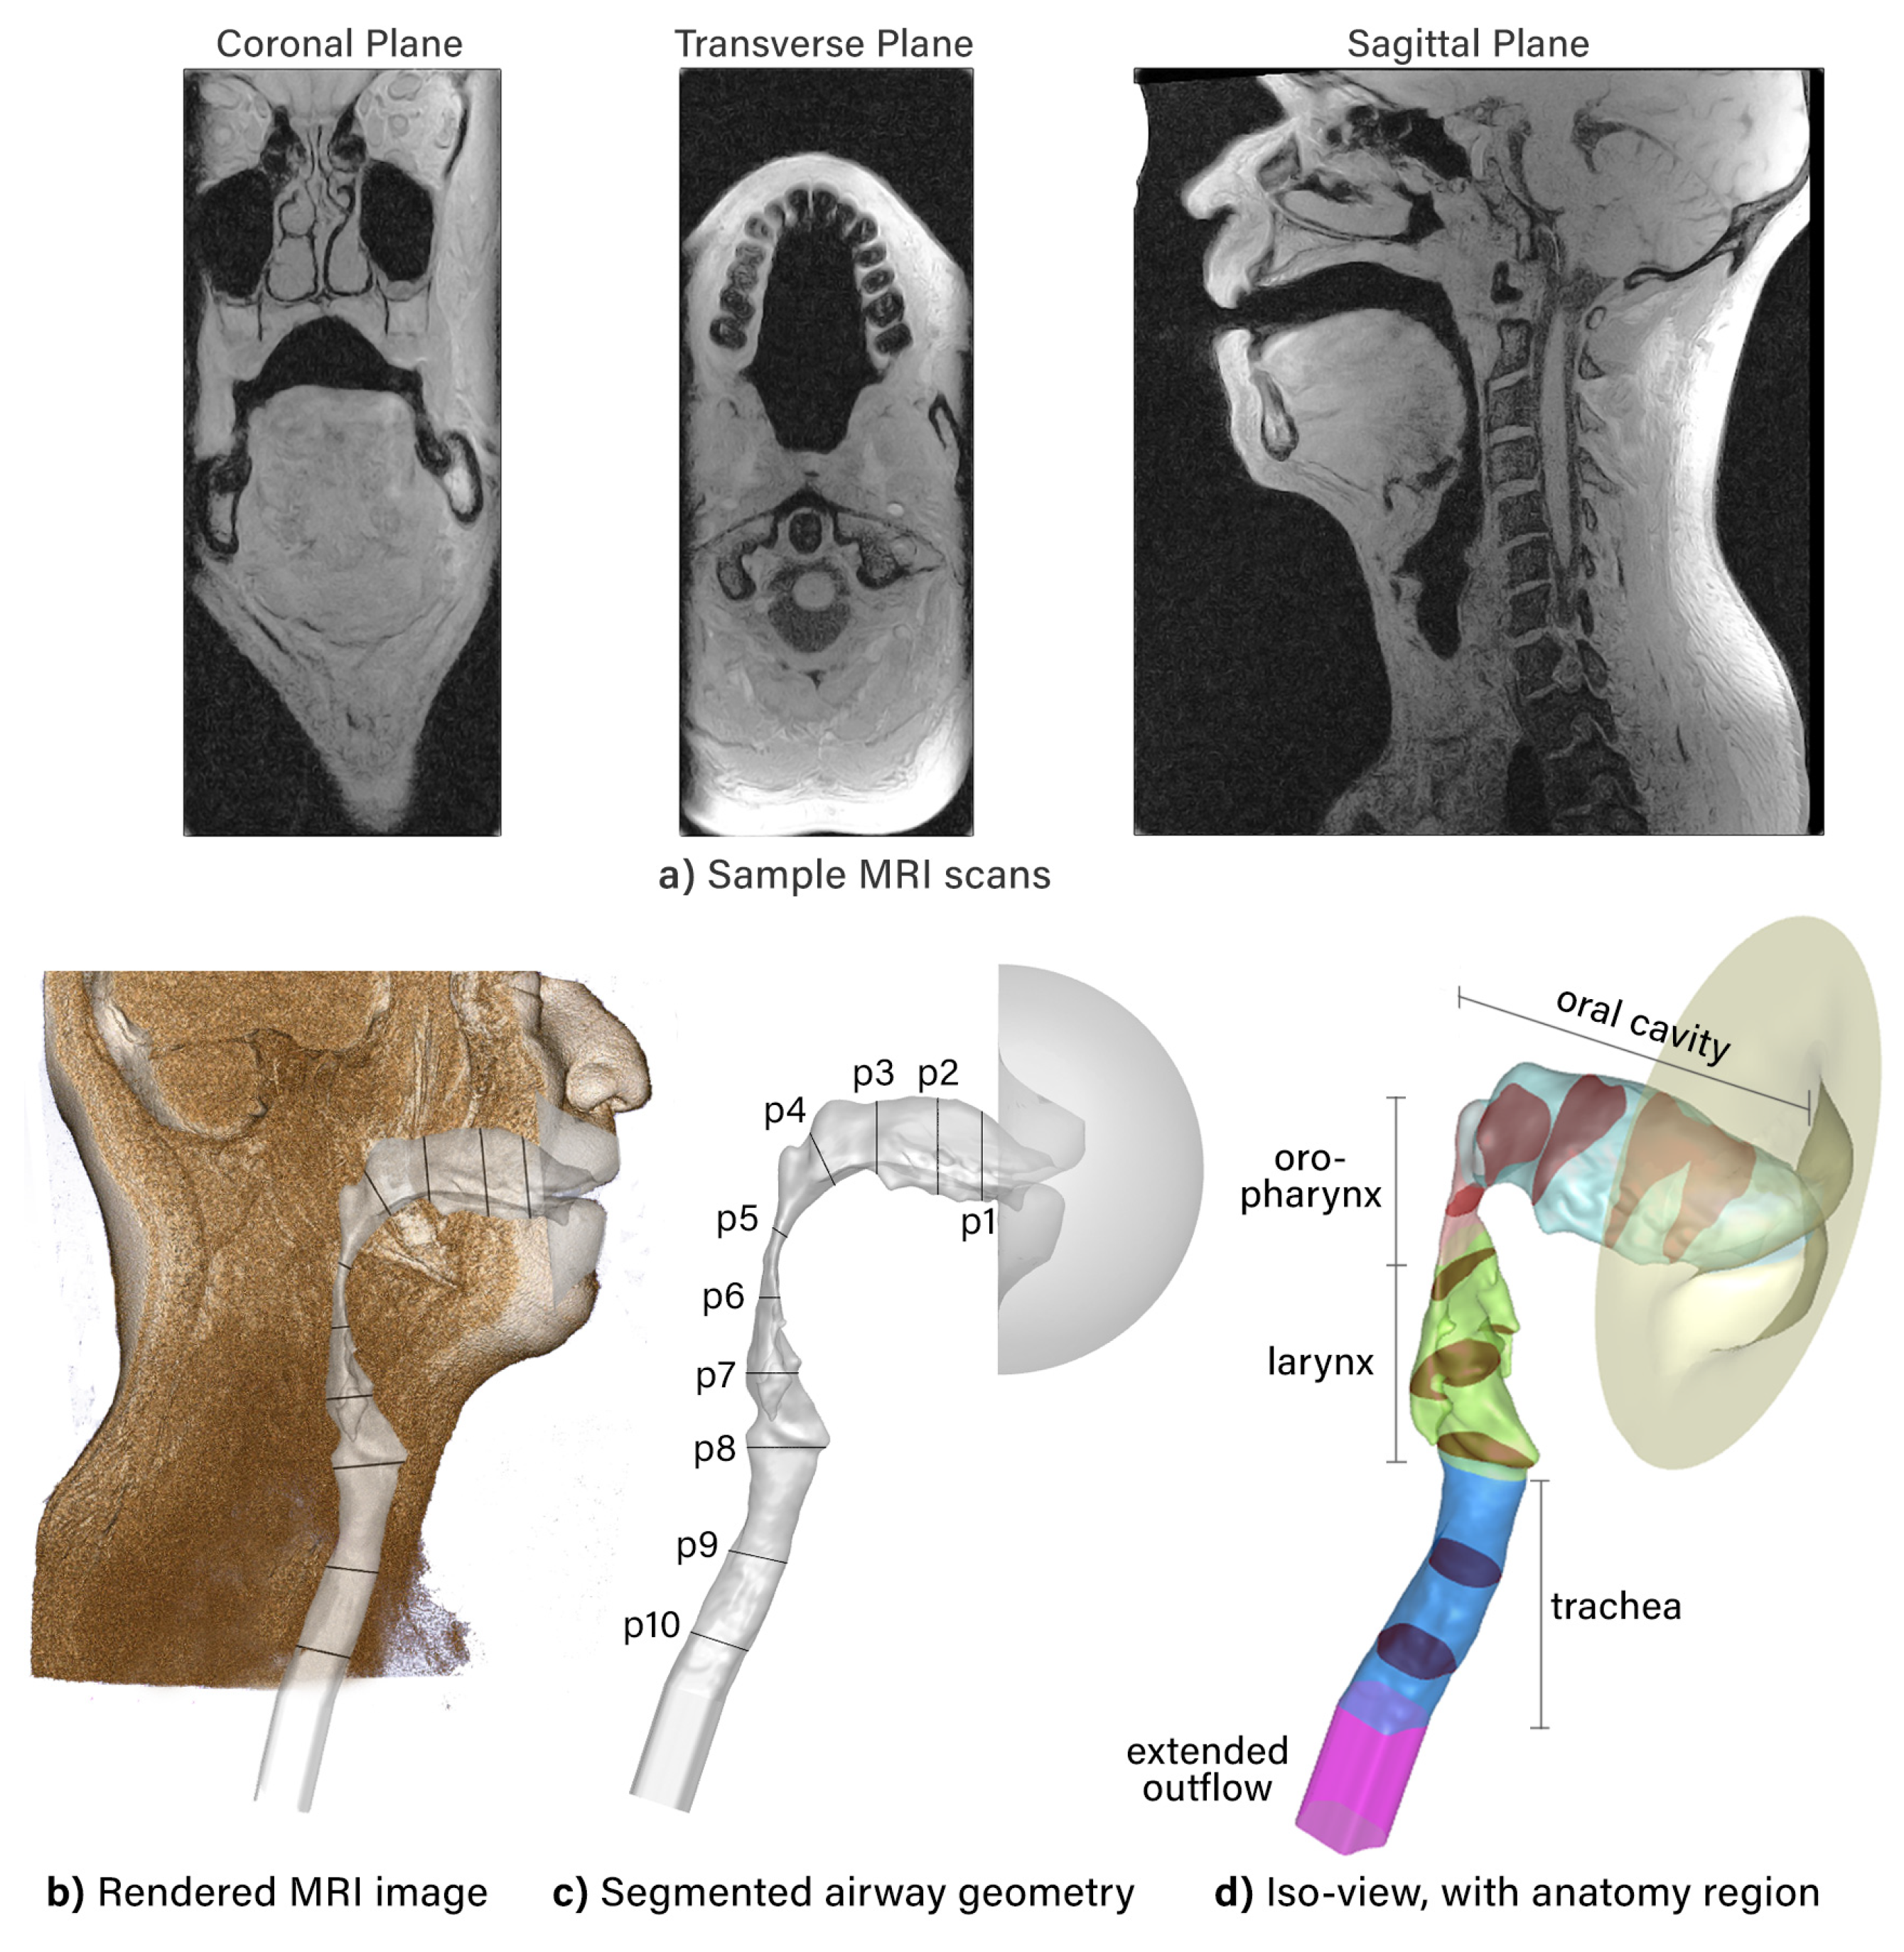
4.1. Model Construction
4.2. Fluid Phase Modeling
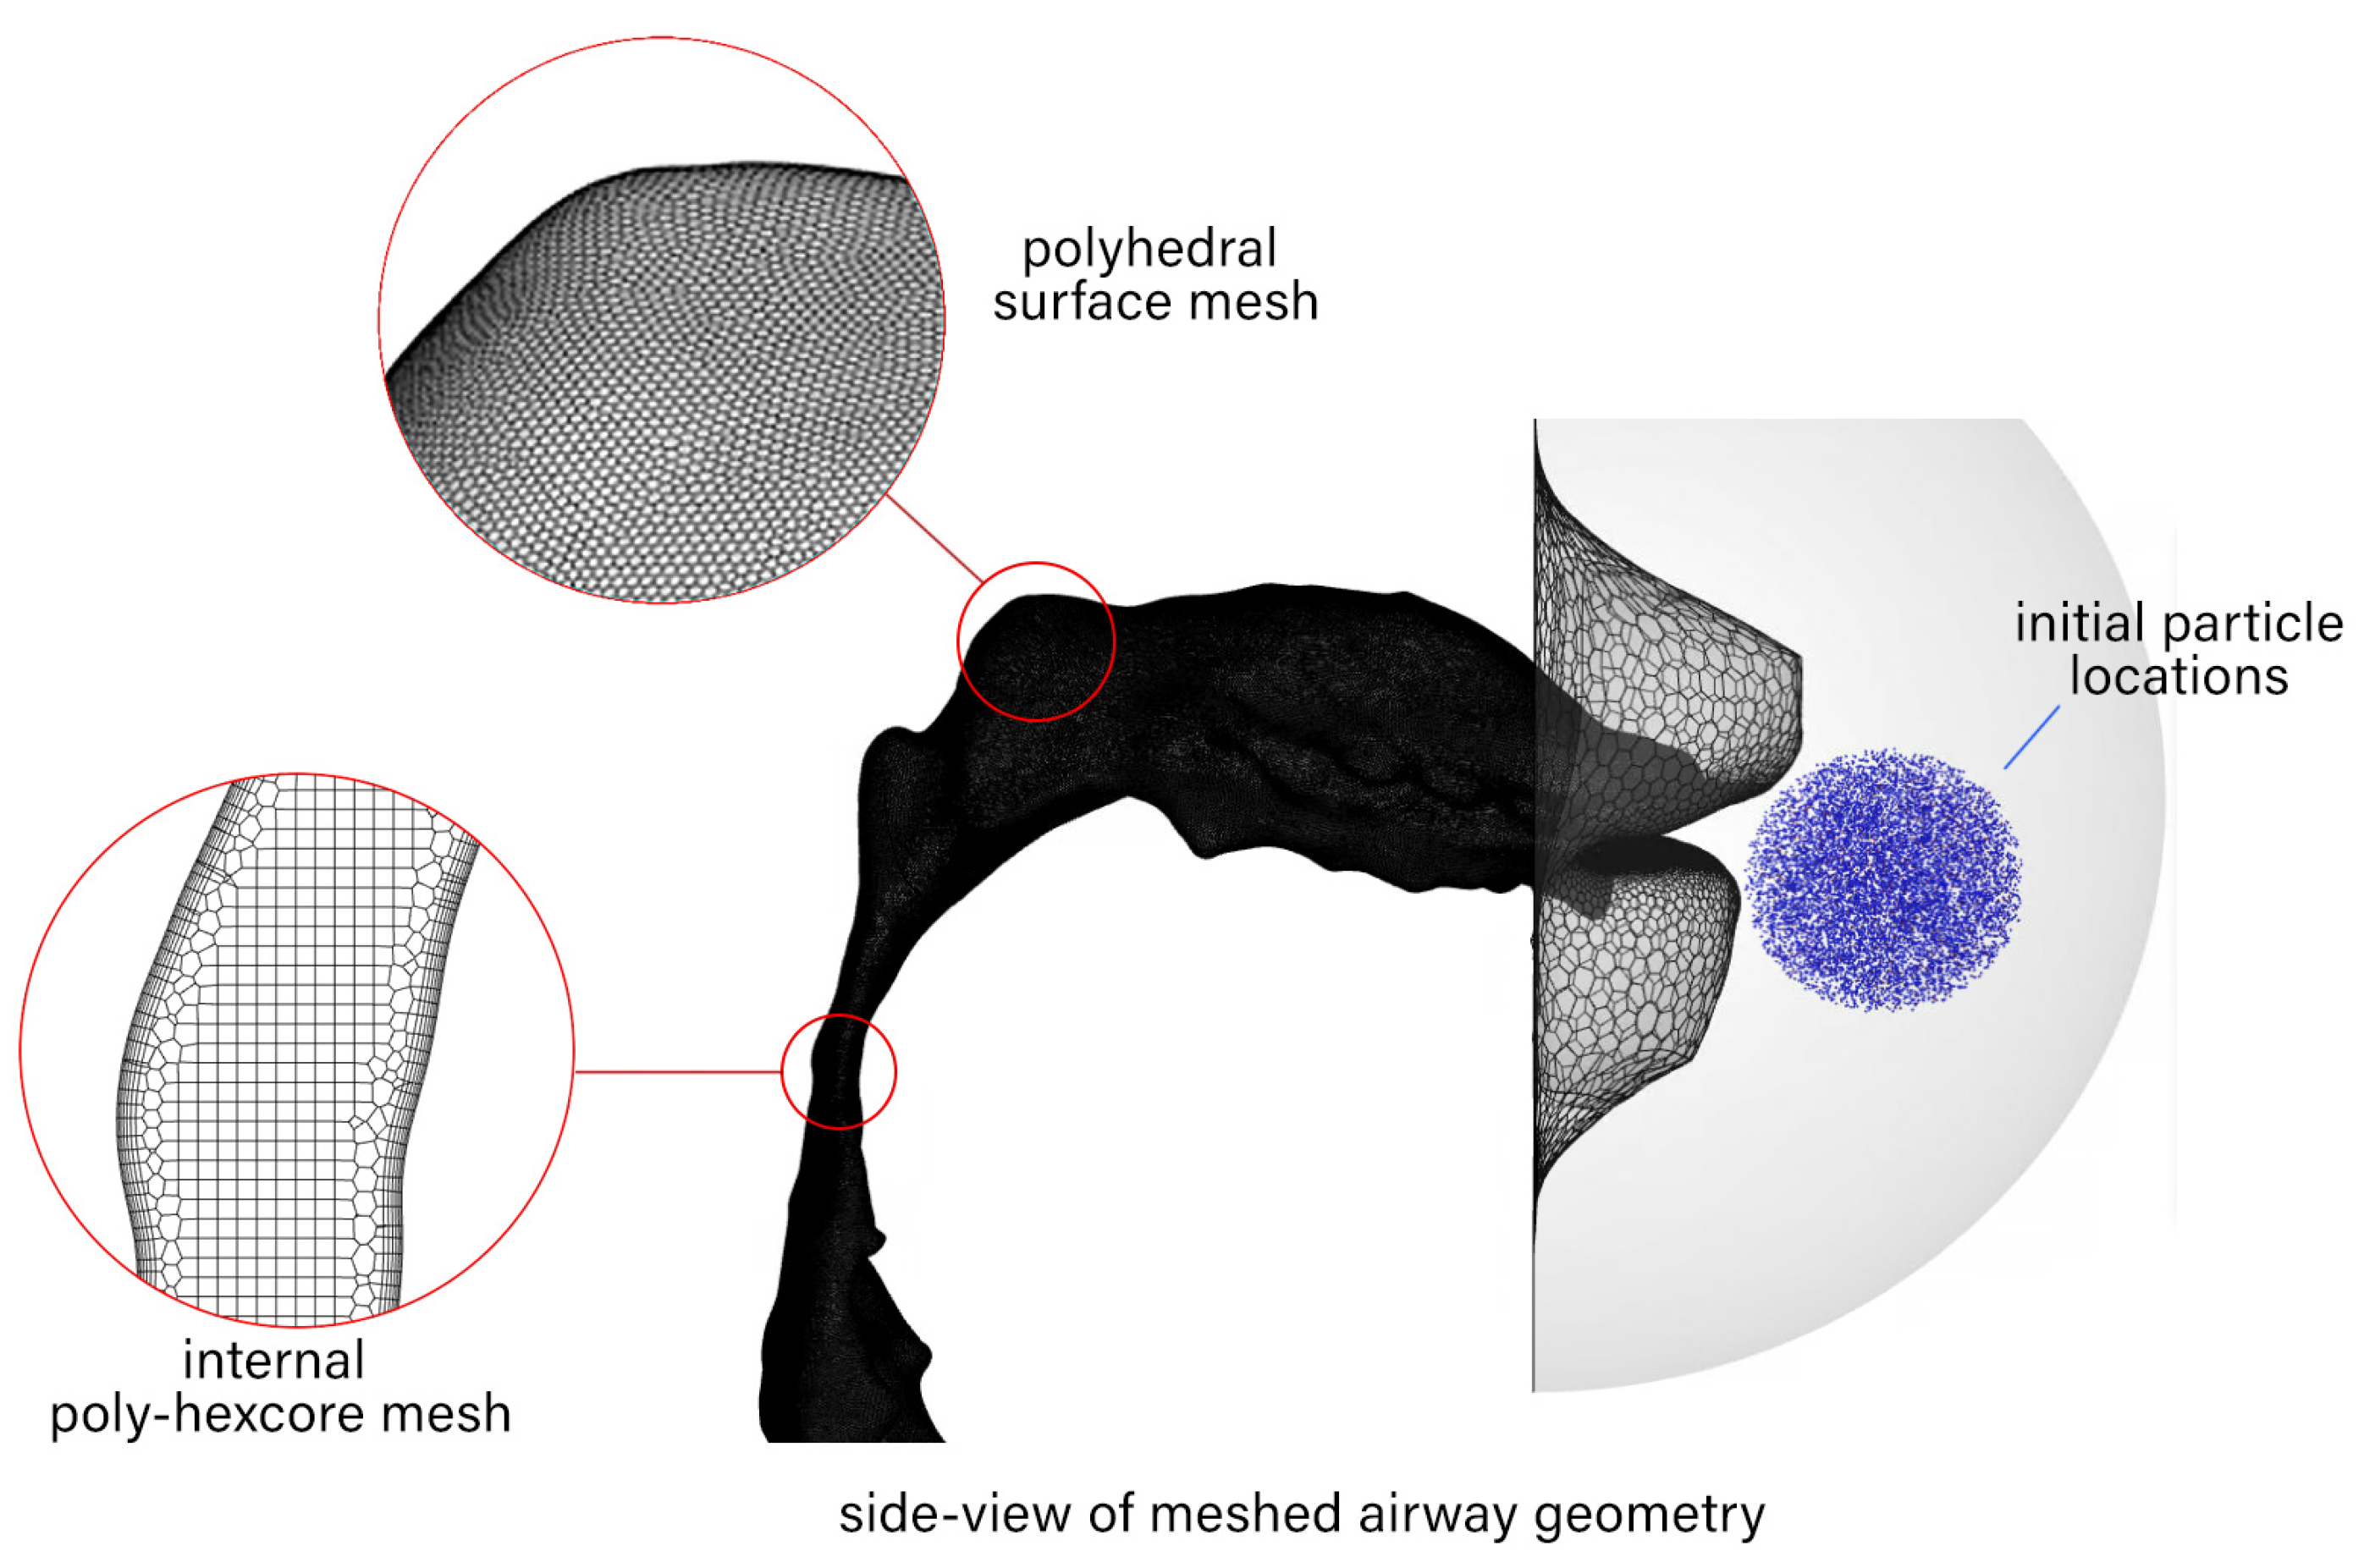
4.3. Meshing and Time-Step Requirements
4.4. Particle Modeling
5. Conclusions
Supplementary Materials
Author Contributions
Funding
Institutional Review Board Statement
Informed Consent Statement
Data Availability Statement
Acknowledgments
Conflicts of Interest
Abbreviations
| DOAJ | Directory of Open Access Journals |
| TLA | Three-Letter Acronym |
| CFC | Chloroflurocarbon |
| CFD | Computational Fluid Dynamics |
| DF | Deposition Fraction |
| DPI | Dry Powder Inhaler |
| DPM | Direct Phase Modeling |
| HFA | Hydrofluoralkane |
| LES | Large Eddy Simulation |
| LTS | Laryngo-Tracheal Stenosis |
| MRI | Magnetic Resonance Imaging |
| TKE | Turbulence Kinetic Energy |
| RANS | Reynolds Average Navier Stokes |
| SBES | Stress-Blended Eddy Simulation |
| SST | Shear Stress Transport |
| WALE | Wall-Adapted Local Eddy Viscosity |
References
- Emmett, P.; Aitken, R.; Hannan, W. Measurements of the total and regional deposition of inhaled particles in the human respiratory tract. J. Aerosol Sci. 1982, 13, 549–560. [Google Scholar] [CrossRef]
- Bowes III, S.M.; Swift, D.L. Deposition of inhaled particles in the oral airway during oronasal breathing. Aerosol Sci. Technol. 1989, 11, 157–167. [Google Scholar] [CrossRef]
- Cheng, Y.; Fu, C.; Yazzie, D.; Zhou, Y. Respiratory deposition patterns of salbutamol pMDI with CFC and HFA-134a formulations in a human airway replica. J. Aerosol Med. 2001, 14, 255–266. [Google Scholar] [CrossRef]
- Zhang, Y.; Gilbertson, K.; Finlay, W.H. In vivo–in vitro comparison of deposition in three mouth–throat models with Qvar® and Turbuhaler® inhalers. J. Aerosol Med. 2007, 20, 227–235. [Google Scholar] [CrossRef] [Green Version]
- Grgic, B.; Finlay, W.H.; Burnell, P.; Heenan, A. In vitro intersubject and intrasubject deposition measurements in realistic mouth–throat geometries. J. Aerosol Sci. 2004, 35, 1025–1040. [Google Scholar] [CrossRef]
- Cheng, S.; Kourmatzis, A.; Mekonnen, T.; Gholizadeh, H.; Raco, J.; Chen, L.; Tang, P.; Chan, H.K. Does upper airway deformation affect drug deposition? Int. J. Pharm. 2019, 572, 118773. [Google Scholar] [CrossRef] [PubMed]
- DeHaan, W.H.; Finlay, W.H. In vitro monodisperse aerosol deposition in a mouth and throat with six different inhalation devices. J. Aerosol Sci. 2001, 14, 361–367. [Google Scholar] [CrossRef]
- Golshahi, L.; Noga, M.L.; Finlay, W.H. Deposition of inhaled micrometer-sized particles in oropharyngeal airway replicas of children at constant flow rates. J. Aerosol Sci. 2012, 49, 21–31. [Google Scholar] [CrossRef]
- Ruzycki, C.A.; Golshahi, L.; Vehring, R.; Finlay, W.H. Comparison of in vitro deposition of pharmaceutical aerosols in an idealized child throat with in vivo deposition in the upper respiratory tract of children. Pharm. Res. 2014, 31, 1525–1535. [Google Scholar] [CrossRef]
- Azhdarzadeh, M.; Olfert, J.S.; Vehring, R.; Finlay, W.H. Effect of induced charge on deposition of uniformly charged particles in a pediatric oral-extrathoracic airway. Aerosol Sci. Technol. 2014, 48, 508–514. [Google Scholar] [CrossRef]
- Borojeni, A.A.; Noga, M.L.; Vehring, R.; Finlay, W.H. Measurements of total aerosol deposition in intrathoracic conducting airway replicas of children. J. Aerosol Sci. 2014, 73, 39–47. [Google Scholar] [CrossRef]
- Golshahi, L.; Noga, M.L.; Vehring, R.; Finlay, W.H. An in vitro study on the deposition of micrometer-sized particles in the extrathoracic airways of adults during tidal oral breathing. Ann. Biomed. Eng. 2013, 41, 979–989. [Google Scholar] [CrossRef]
- Cheng, Y.S.; Zhou, Y.; Chen, B.T. Particle deposition in a cast of human oral airways. Aerosol Sci. Technol. 1999, 31, 286–300. [Google Scholar] [CrossRef]
- Zhang, L.; Cheng, H.; Zhang, C.; Xu, Z.; Ye, J. Deposition fraction of aerosol particles in a human oral airway model on stable condition. Aerosol Air Qual. Res. 2006, 6, 259–267. [Google Scholar] [CrossRef] [Green Version]
- Lin, T.C.; Breysse, P.N.; Laube, B.L.; Swift, D.L. Mouthpiece diameter affects deposition efficiency in cast models of the human oral airways. J. Aerosol Med. 2001, 14, 335–341. [Google Scholar] [CrossRef] [PubMed]
- Longest, P.; Tian, G.; Walenga, R.L.; Hindle, M. Comparing MDI and DPI aerosol deposition using in vitro experiments and a new stochastic individual path (SIP) model of the conducting airways. Pharm. Res. 2012, 29, 1670–1688. [Google Scholar] [CrossRef] [PubMed]
- Xi, J.; Yuan, J.E.; Yang, M.; Si, X.; Zhou, Y.; Cheng, Y.S. Parametric study on mouth–throat geometrical factors on deposition of orally inhaled aerosols. J. Aerosol Sci. 2016, 99, 94–106. [Google Scholar] [CrossRef]
- Ball, C.G.; Uddin, M.; Pollard, A. Mean flow structures inside the human upper airway. Flow Turbul. Combust. 2008, 81, 155–188. [Google Scholar] [CrossRef]
- Xi, J.; Longest, P.W. Transport and deposition of micro-aerosols in realistic and simplified models of the oral airway. Ann. Biomed. Eng. 2007, 35, 560–581. [Google Scholar] [CrossRef]
- Matida, E.A.; Finlay, W.H.; Lange, C.F.; Grgic, B. Improved numerical simulation of aerosol deposition in an idealized mouth-throat. J. Aerosol Sci. 2004, 35, 1–19. [Google Scholar] [CrossRef]
- Yousefi, M.; Inthavong, K.; Tu, J. Microparticle transport and deposition in the human oral airway: Toward the smart spacer. Aerosol Sci. Technol. 2015, 49, 1109–1120. [Google Scholar] [CrossRef] [Green Version]
- Farkas, Á.; Balásházy, I.; Szocs, K. Characterization of regional and local deposition of inhaled aerosol drugs in the respiratory system by computational fluid and particle dynamics methods. J. Aerosol Med. 2006, 19, 329–343. [Google Scholar] [CrossRef] [PubMed]
- Zhou, Y.; Sun, J.; Cheng, Y.S. Comparison of deposition in the USP and physical mouth–throat models with solid and liquid particles. J. Aerosol Med. Pulm. Drug Deliv. 2011, 24, 277–284. [Google Scholar] [CrossRef] [PubMed]
- Yousefi, M.; Pourmehran, O.; Gorji-Bandpy, M.; Inthavong, K.; Yeo, L.; Tu, J. CFD simulation of aerosol delivery to a human lung via surface acoustic wave nebulization. Biomech. Model. Mechanobiol. 2017, 16, 2035–2050. [Google Scholar] [CrossRef] [PubMed]
- Huang, F.; Zhu, Q.; Zhou, X.; Gou, D.; Yu, J.; Li, R.; Tong, Z.; Yang, R. Role of CFD based in silico modelling in establishing an in vitro-in vivo correlation of aerosol deposition in the respiratory tract. Adv. Drug Deliv. Rev. 2020, 170, 369–385. [Google Scholar] [CrossRef] [PubMed]
- Stapleton, K.W.; Guentsch, E.; Hoskinson, M.K.; Finlay, W.H. On the suitability of k-ϵ turbulence modeling for aerosol deposition in the mouth and throat: A comparison with experiment. J. Aerosol Sci. 2000, 31, 739–749. [Google Scholar] [CrossRef]
- Williams, J.; Kolehmainen, J.; Cunningham, S.; Ozel, A.; Wolfram, U. Effect of patient inhalation profile and airway structure on drug deposition in image-based models with particle-particle interactions. Int. J. Pharm. 2022, 612, 121321. [Google Scholar] [CrossRef]
- Yousefi, M.; Inthavong, K.; Tu, J. Effect of pressurized metered dose inhaler spray characteristics and particle size distribution on drug delivery efficiency. J. Aerosol Med. Pulm. Drug Deliv. 2017, 30, 359–372. [Google Scholar] [CrossRef]
- Krause, F.; Wenk, A.; Lacor, C.; Kreyling, W.G.; Möller, W.; Verbanck, S. Numerical and experimental study on the deposition of nanoparticles in an extrathoracic oral airway model. J. Aerosol Sci. 2013, 57, 131–143. [Google Scholar] [CrossRef]
- Gurumurthy, A.; Kleinstreuer, C. Helical fluid-particle flow dynamics for controlling micron-particle deposition in a representative human upper lung-airway model. J. Aerosol Sci. 2021, 151, 105656. [Google Scholar] [CrossRef]
- Nikookar, H.; Abouali, O.; Eghtesad, M.; Sadrizadeh, S.; Ahmadi, G. Enhancing drug delivery to human trachea through oral airway using magnetophoretic steering of microsphere carriers composed of aggregated superparamagnetic nanoparticles and nanomedicine: A numerical study. J. Aerosol Sci. 2019, 127, 63–92. [Google Scholar] [CrossRef]
- Sandeau, J.; Katz, I.; Fodil, R.; Louis, B.; Apiou-Sbirlea, G.; Caillibotte, G.; Isabey, D. CFD simulation of particle deposition in a reconstructed human oral extrathoracic airway for air and helium–oxygen mixtures. J. Aerosol Sci. 2010, 41, 281–294. [Google Scholar] [CrossRef]
- Longest, P.W.; Hindle, M. CFD simulations of enhanced condensational growth (ECG) applied to respiratory drug delivery with comparisons to in vitro data. J. Aerosol Sci. 2010, 41, 805–820. [Google Scholar] [CrossRef] [Green Version]
- Ahookhosh, K.; Saidi, M.; Aminfar, H.; Mohammadpourfard, M.; Hamishehkar, H.; Yaqoubi, S. Dry powder inhaler aerosol deposition in a model of tracheobronchial airways: Validating CFD predictions with in vitro data. Int. J. Pharm. 2020, 587, 119599. [Google Scholar] [CrossRef] [PubMed]
- Shang, Y.; Inthavong, K.; Tu, J. Detailed micro-particle deposition patterns in the human nasal cavity influenced by the breathing zone. Comput. Fluids 2015, 114, 141–150. [Google Scholar] [CrossRef]
- Doorly, D.; Taylor, D.; Gambaruto, A.; Schroter, R.; Tolley, N. Nasal architecture: Form and flow. Philos. Trans. R. Soc. A Math. Phys. Eng. Sci. 2008, 366, 3225–3246. [Google Scholar] [CrossRef] [Green Version]
- Morsi, S.; Alexander, A. An investigation of particle trajectories in two-phase flow systems. J. Fluid Mech. 1972, 55, 193–208. [Google Scholar] [CrossRef]


Publisher’s Note: MDPI stays neutral with regard to jurisdictional claims in published maps and institutional affiliations. |
© 2022 by the authors. Licensee MDPI, Basel, Switzerland. This article is an open access article distributed under the terms and conditions of the Creative Commons Attribution (CC BY) license (https://creativecommons.org/licenses/by/4.0/).
Share and Cite
Vara Almirall, B.; Inthavong, K.; Bradshaw, K.; Singh, N.; Johnson, A.; Storey, P.; Salati, H. Flow Patterns and Particle Residence Times in the Oral Cavity during Inhaled Drug Delivery. Pharmaceuticals 2022, 15, 1259. https://doi.org/10.3390/ph15101259
Vara Almirall B, Inthavong K, Bradshaw K, Singh N, Johnson A, Storey P, Salati H. Flow Patterns and Particle Residence Times in the Oral Cavity during Inhaled Drug Delivery. Pharmaceuticals. 2022; 15(10):1259. https://doi.org/10.3390/ph15101259
Chicago/Turabian StyleVara Almirall, Brenda, Kiao Inthavong, Kimberley Bradshaw, Narinder Singh, Aaron Johnson, Pippa Storey, and Hana Salati. 2022. "Flow Patterns and Particle Residence Times in the Oral Cavity during Inhaled Drug Delivery" Pharmaceuticals 15, no. 10: 1259. https://doi.org/10.3390/ph15101259