
How Molecular Topology Can Help in Amyotrophic Lateral Sclerosis (ALS) Drug Development: A Revolutionary Paradigm for a Merciless Disease


Abstract
:
1. Introduction
2. Results and Discussion
2.1. ALS Models and Internal Validation
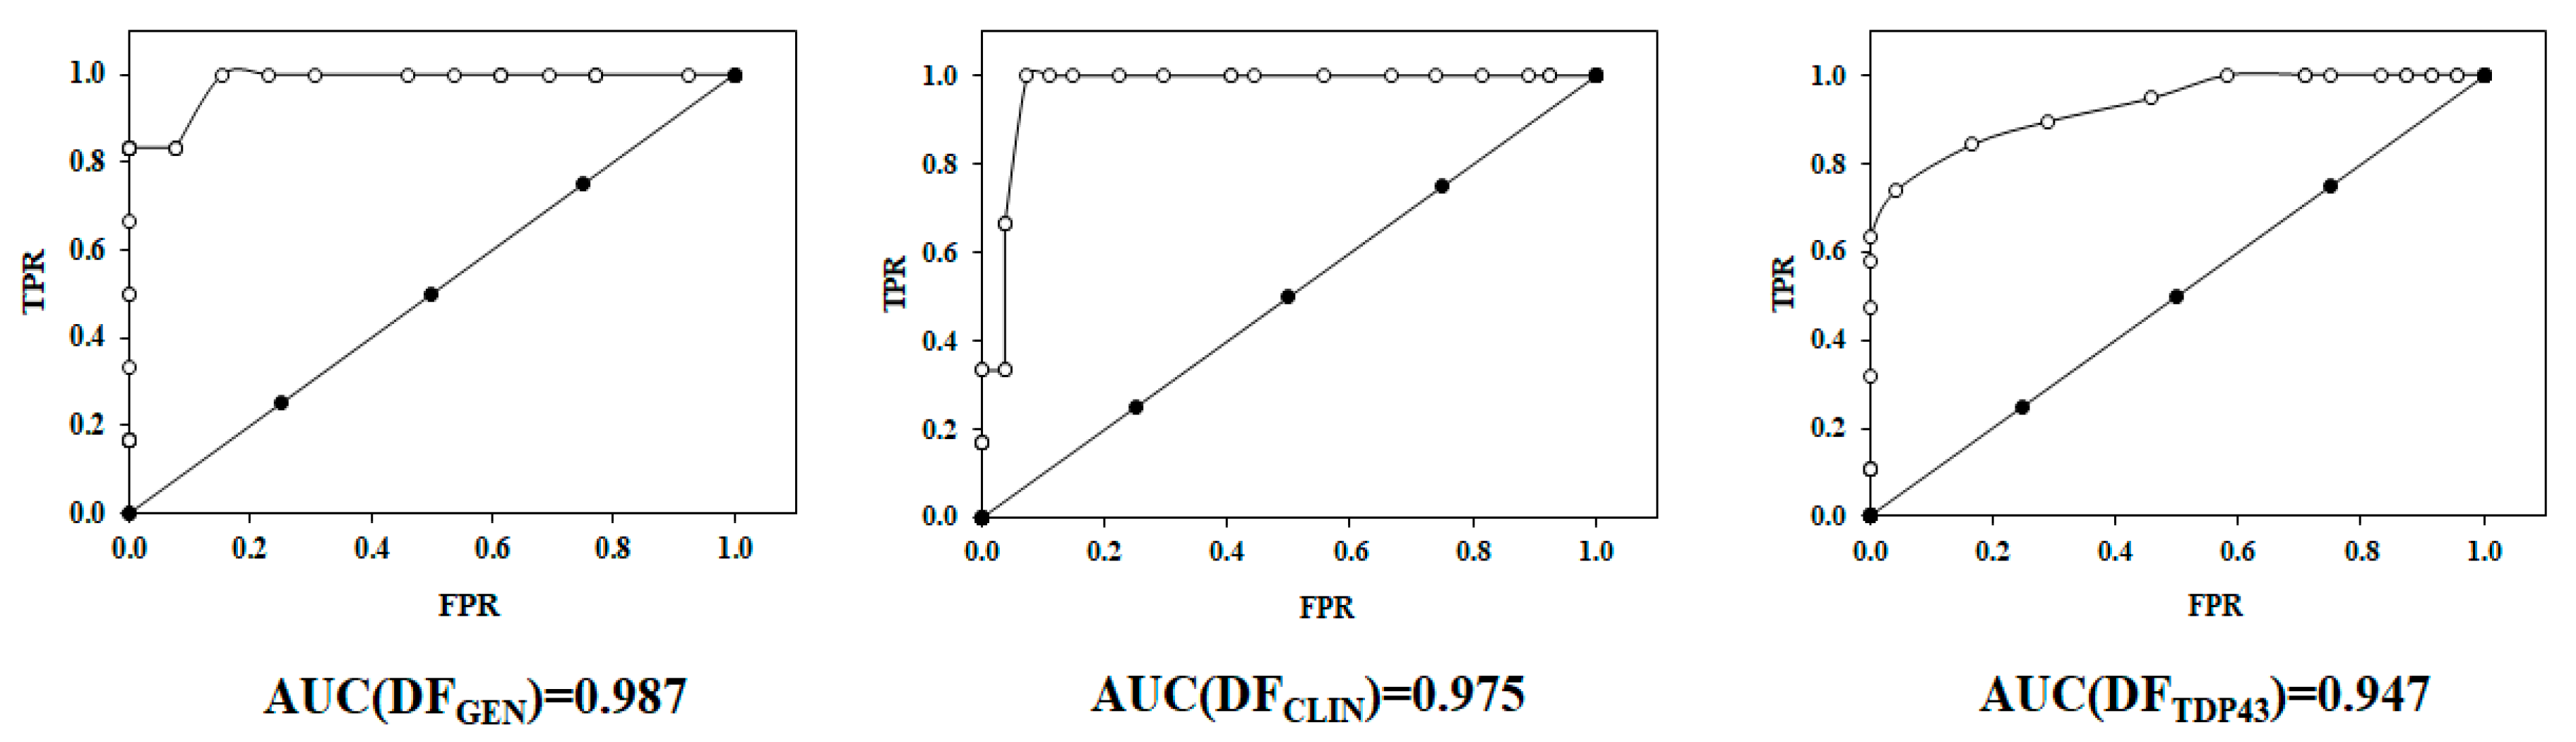
2.2. Receiver Operating Characteristic or ROC Curve
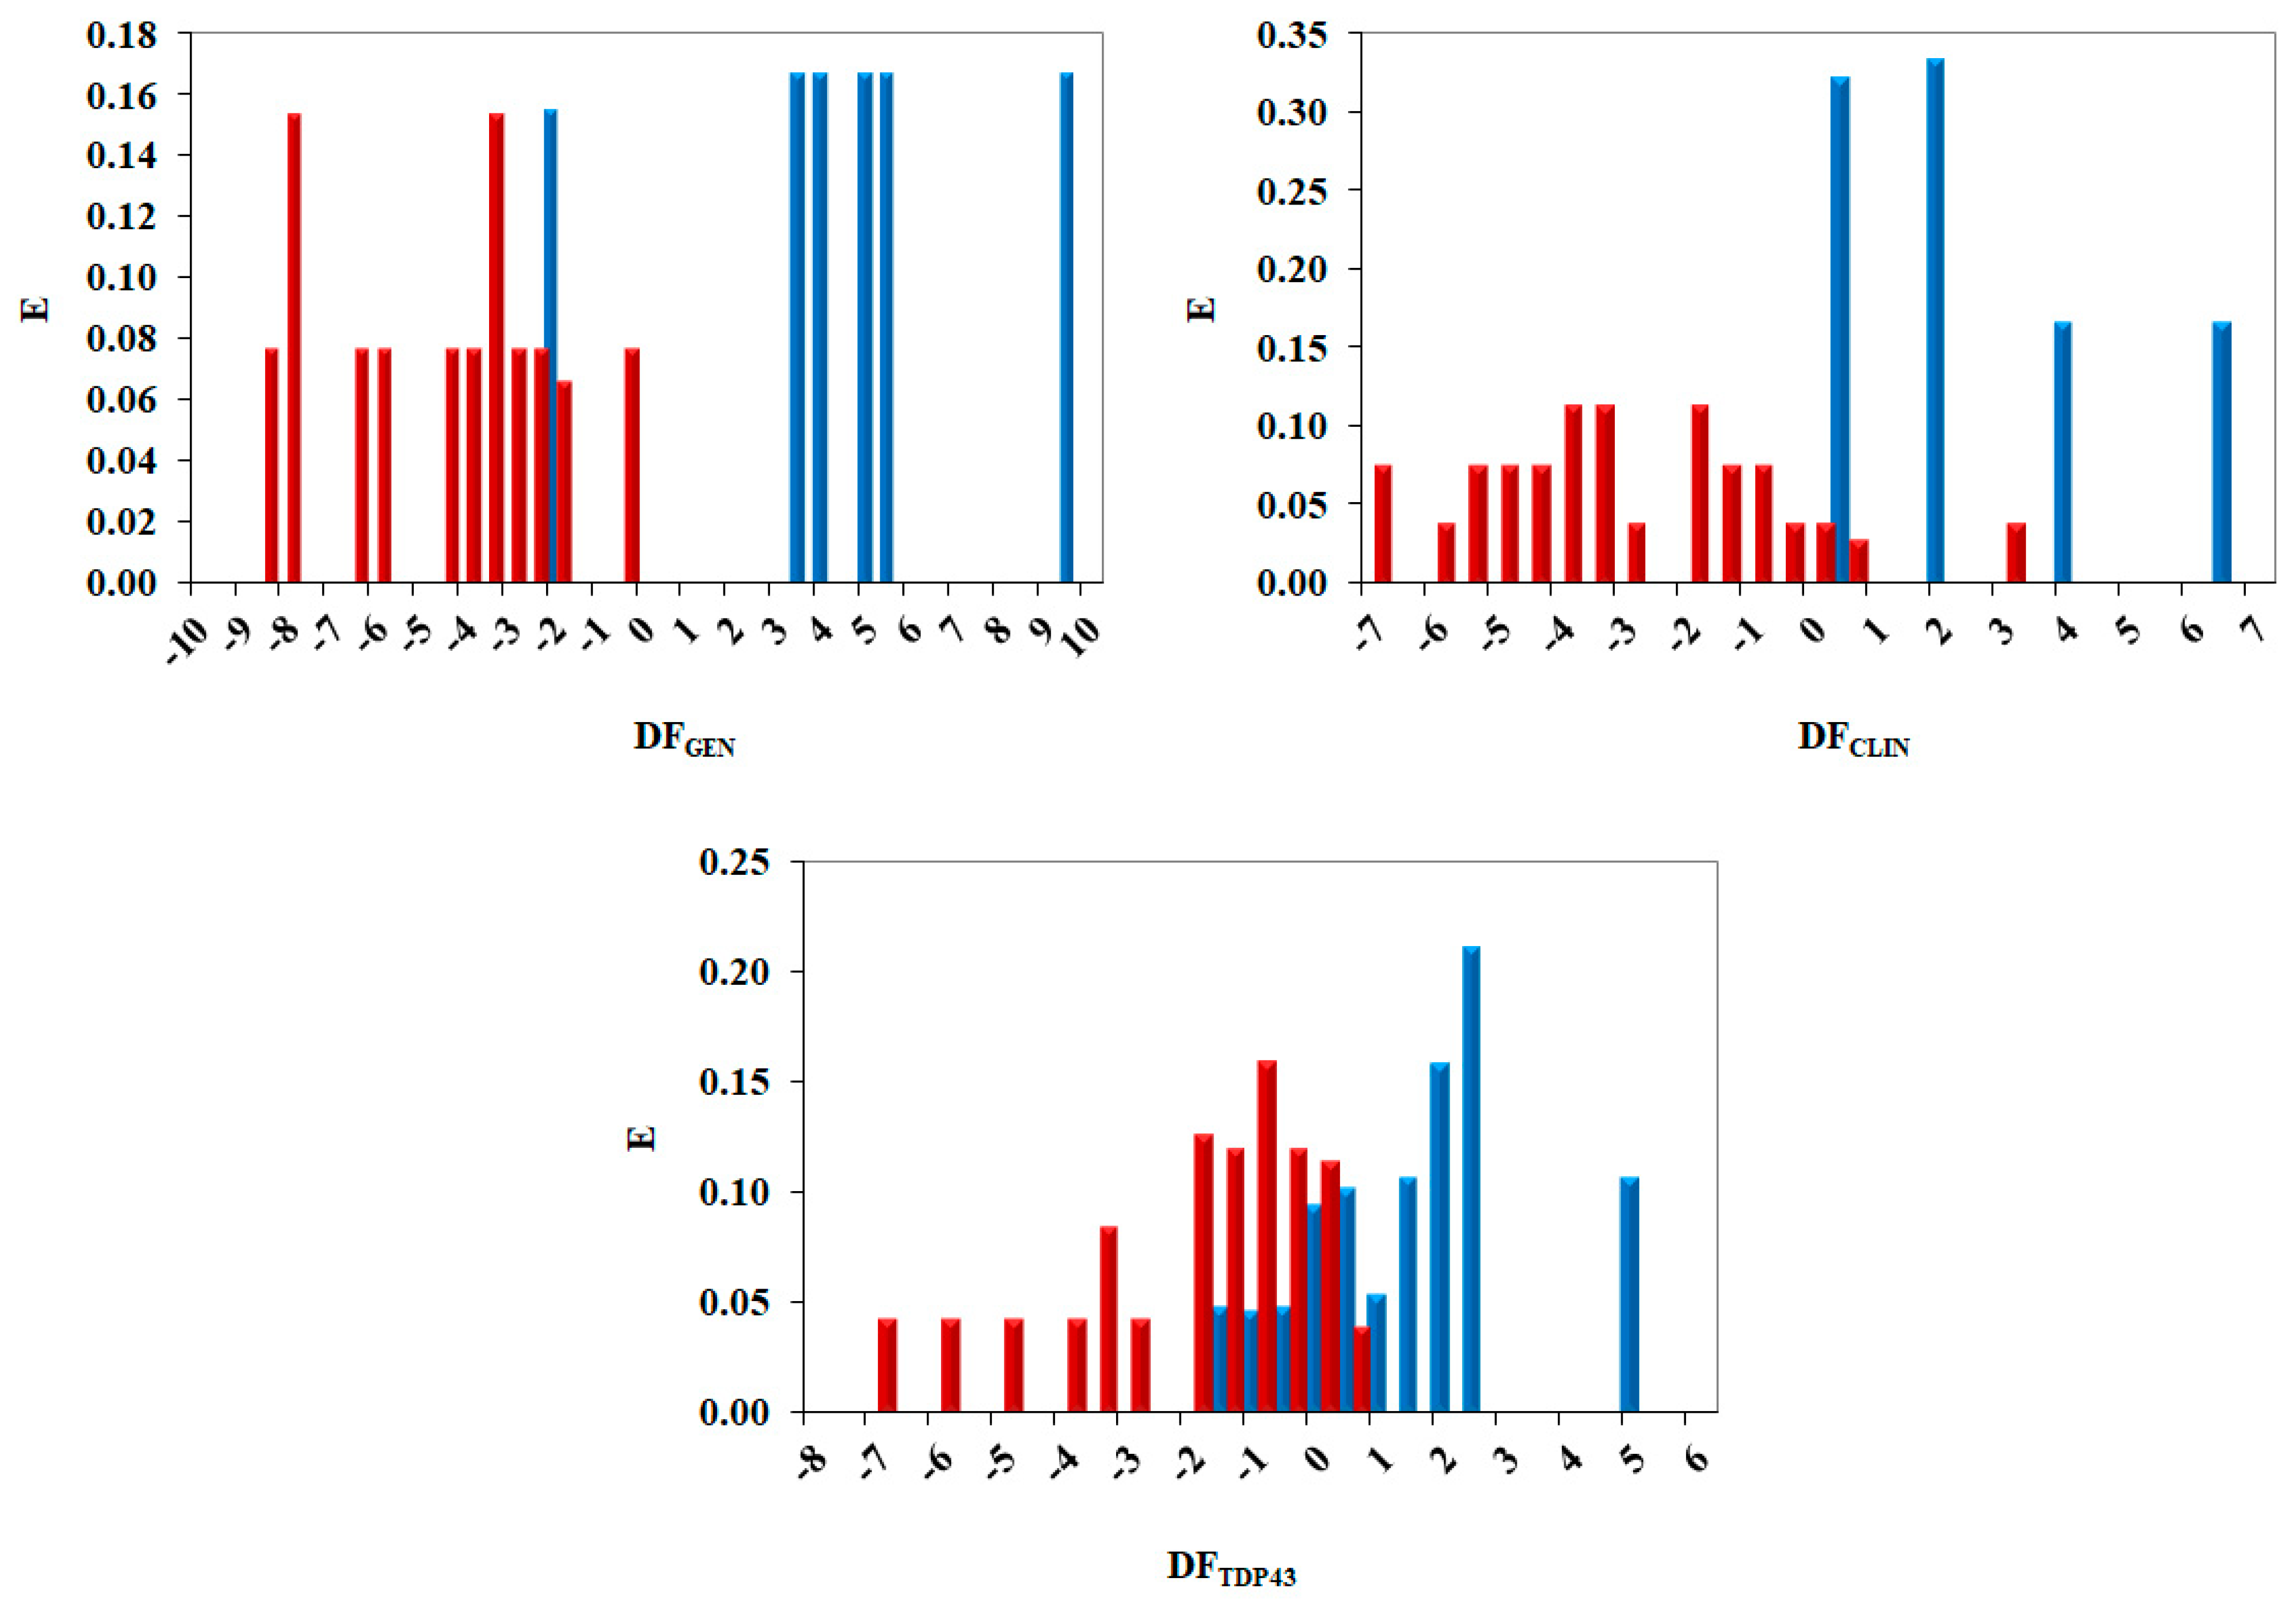
2.3. Pharmacological Distribution Diagram
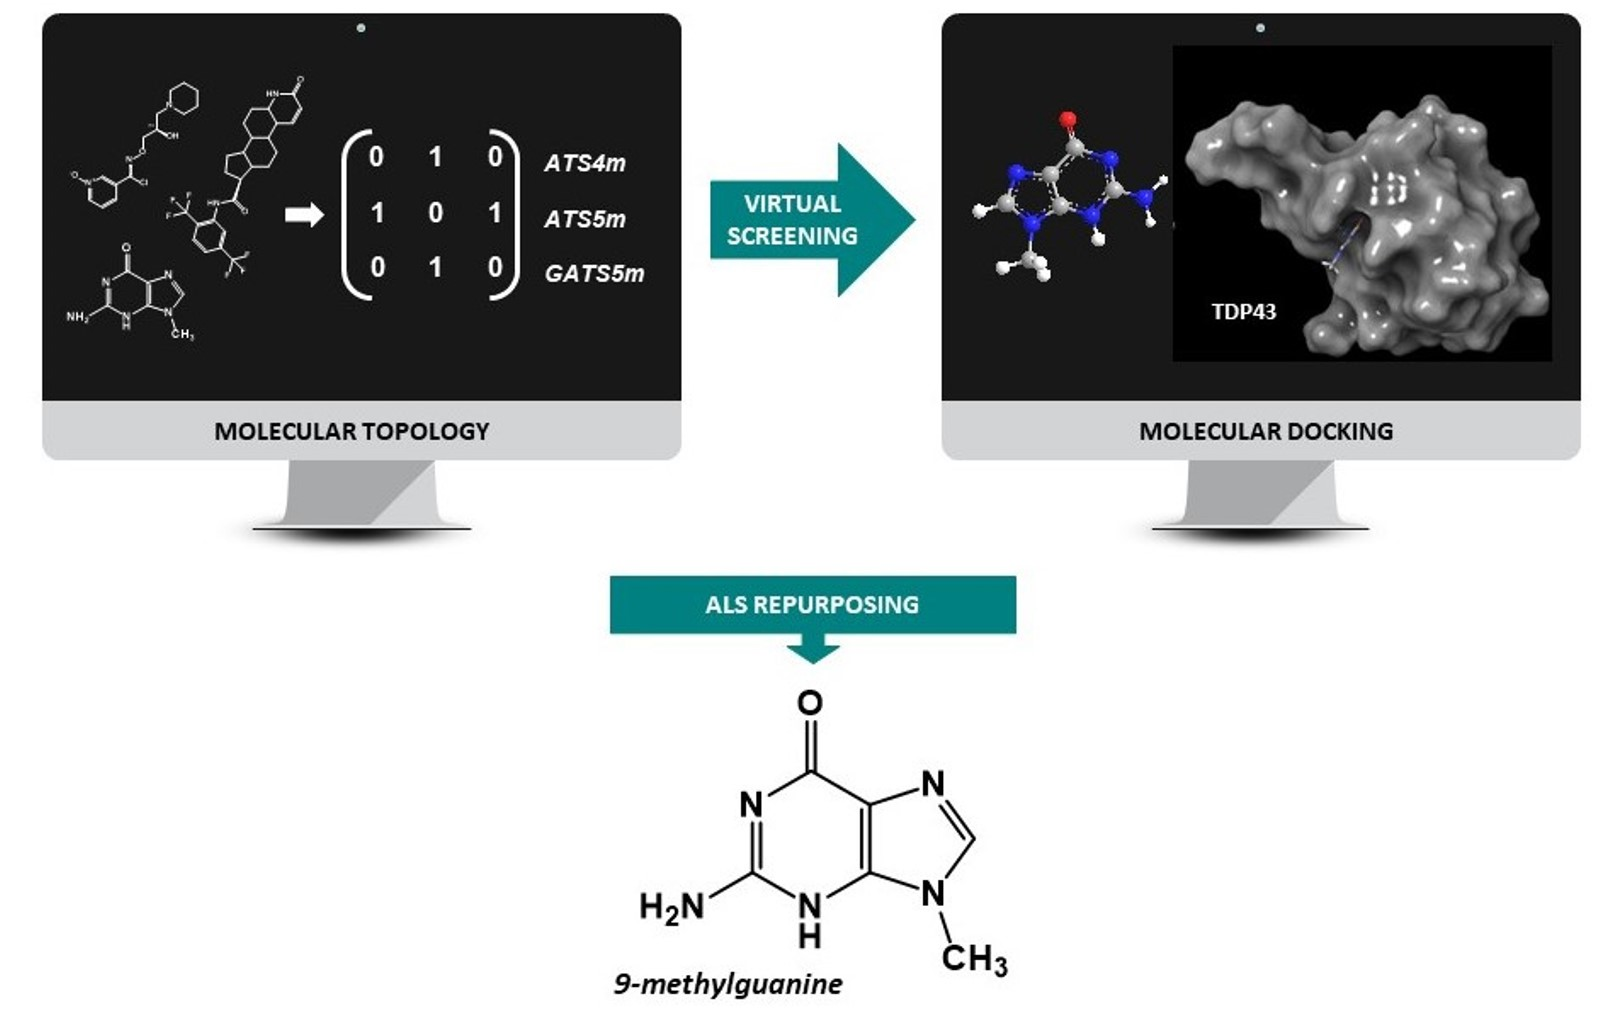
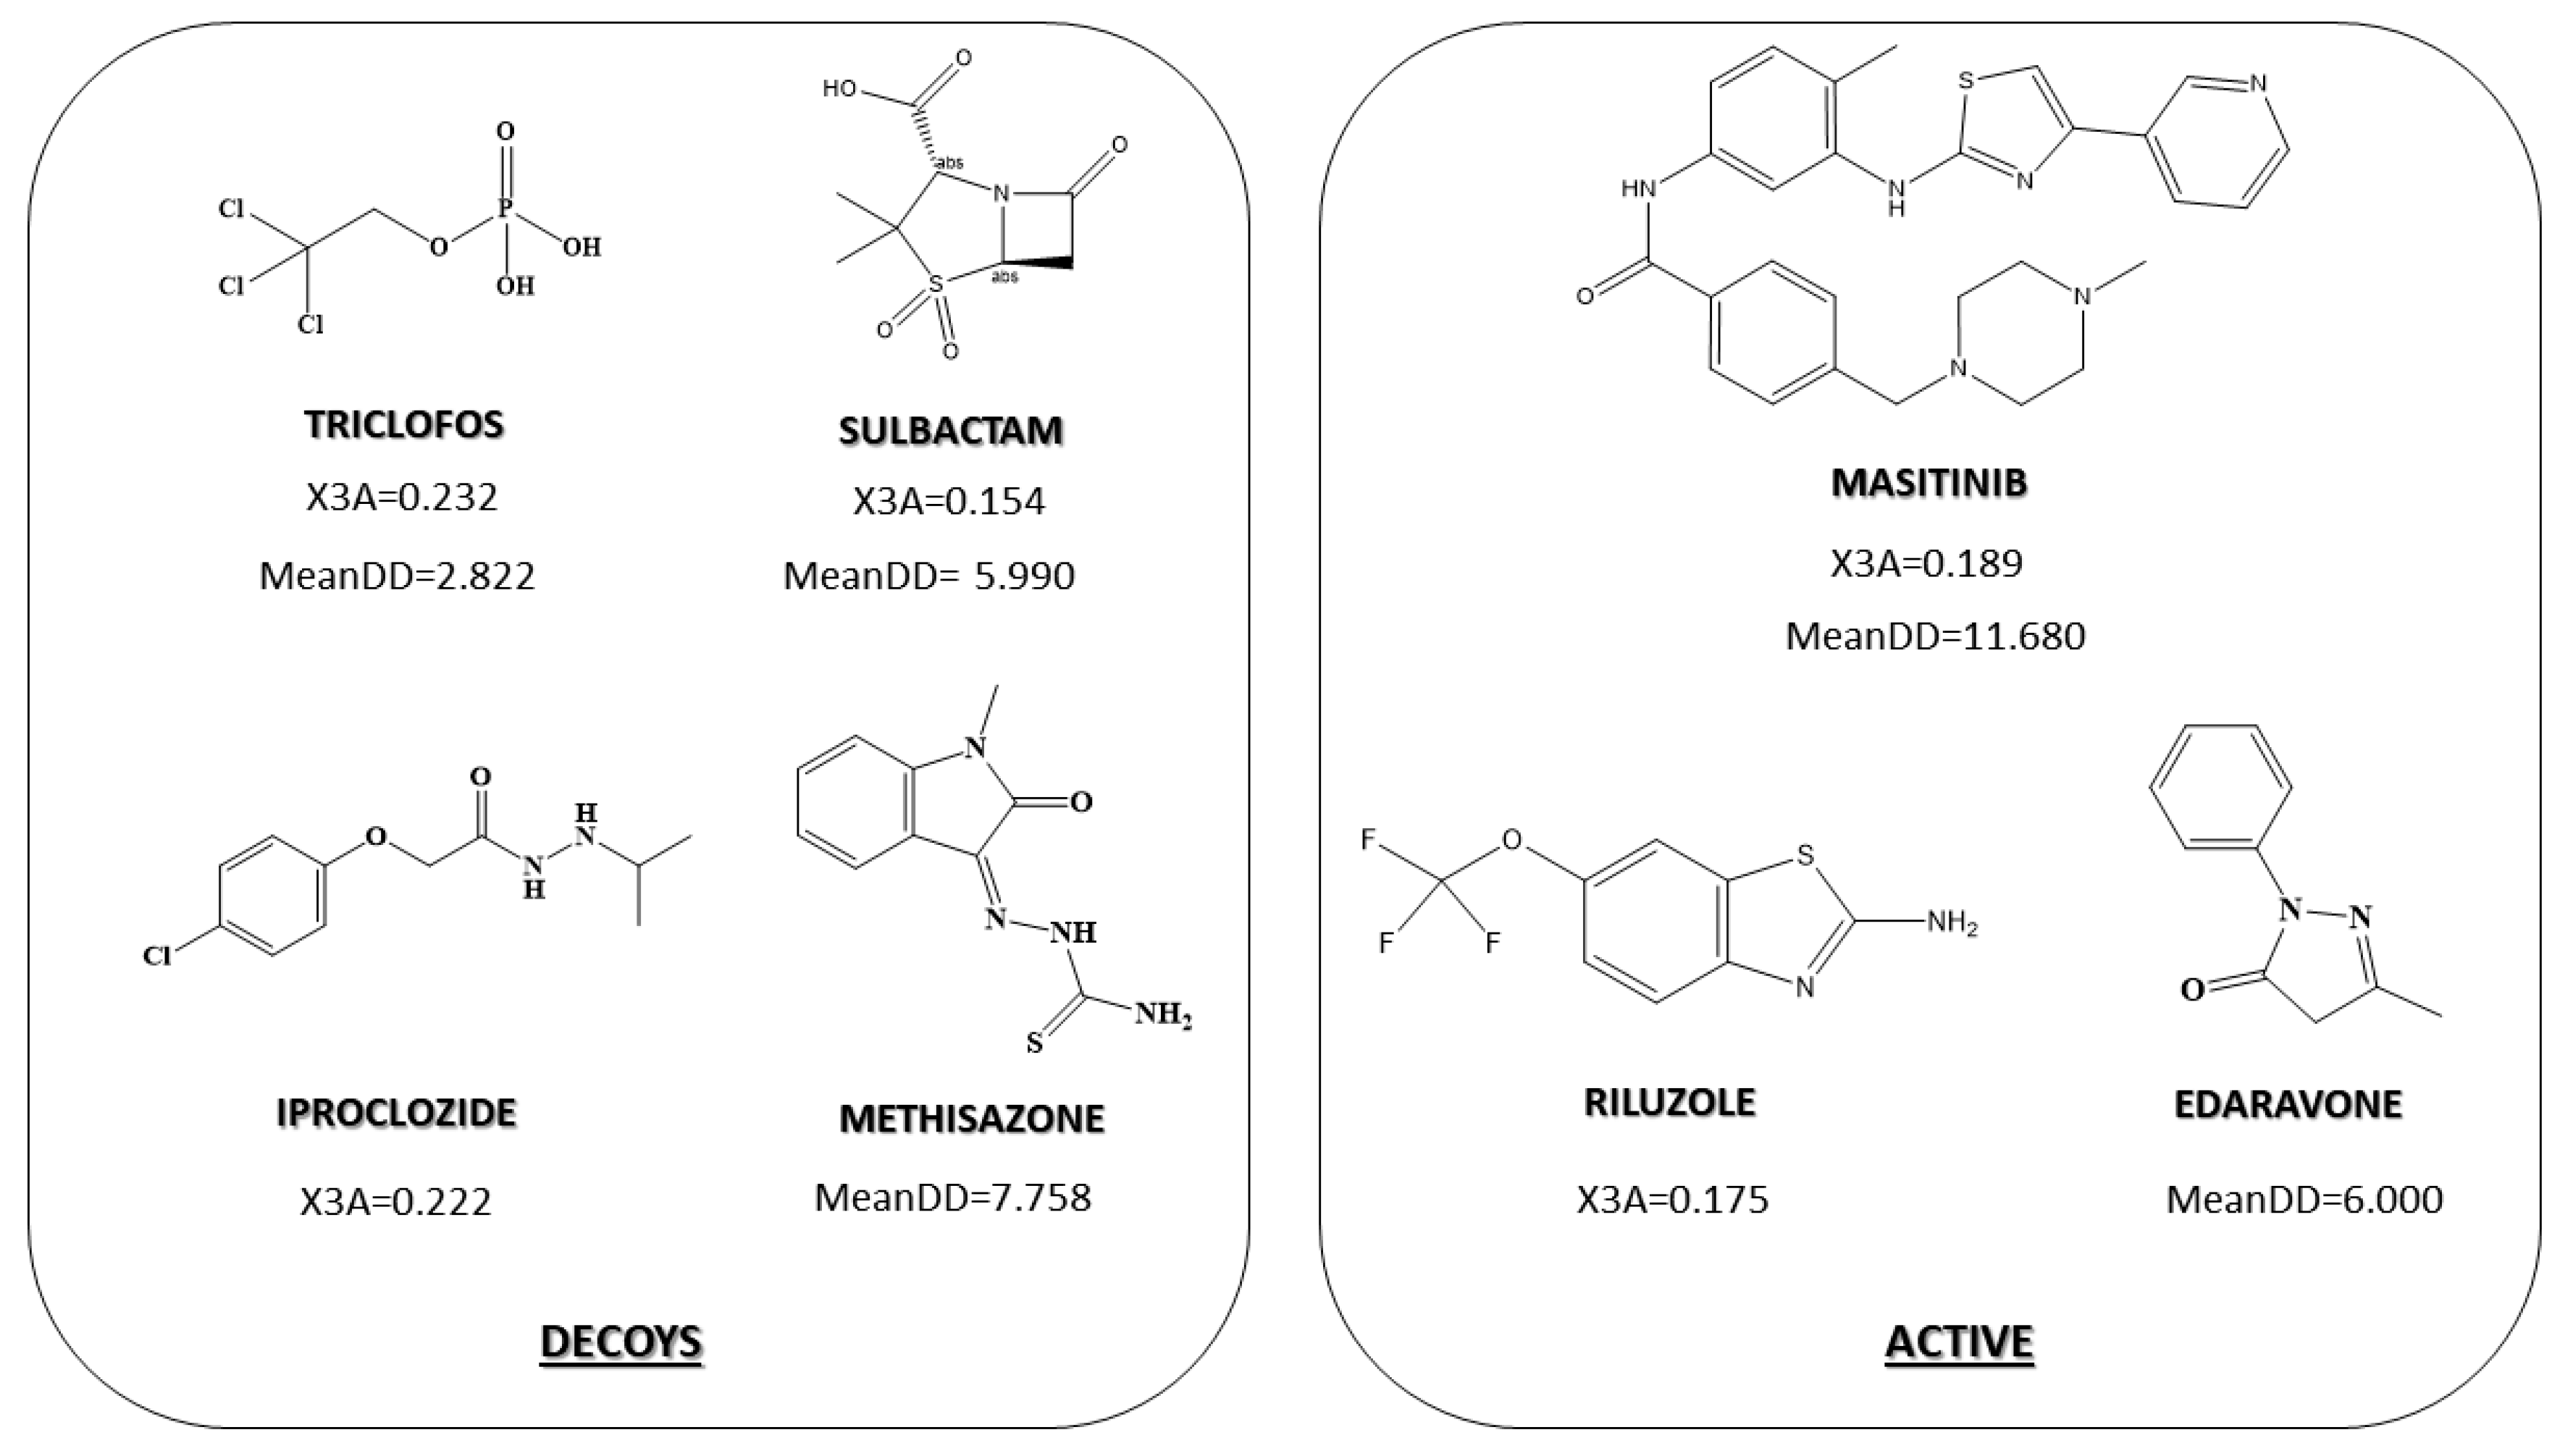
2.4. Virtual Screening
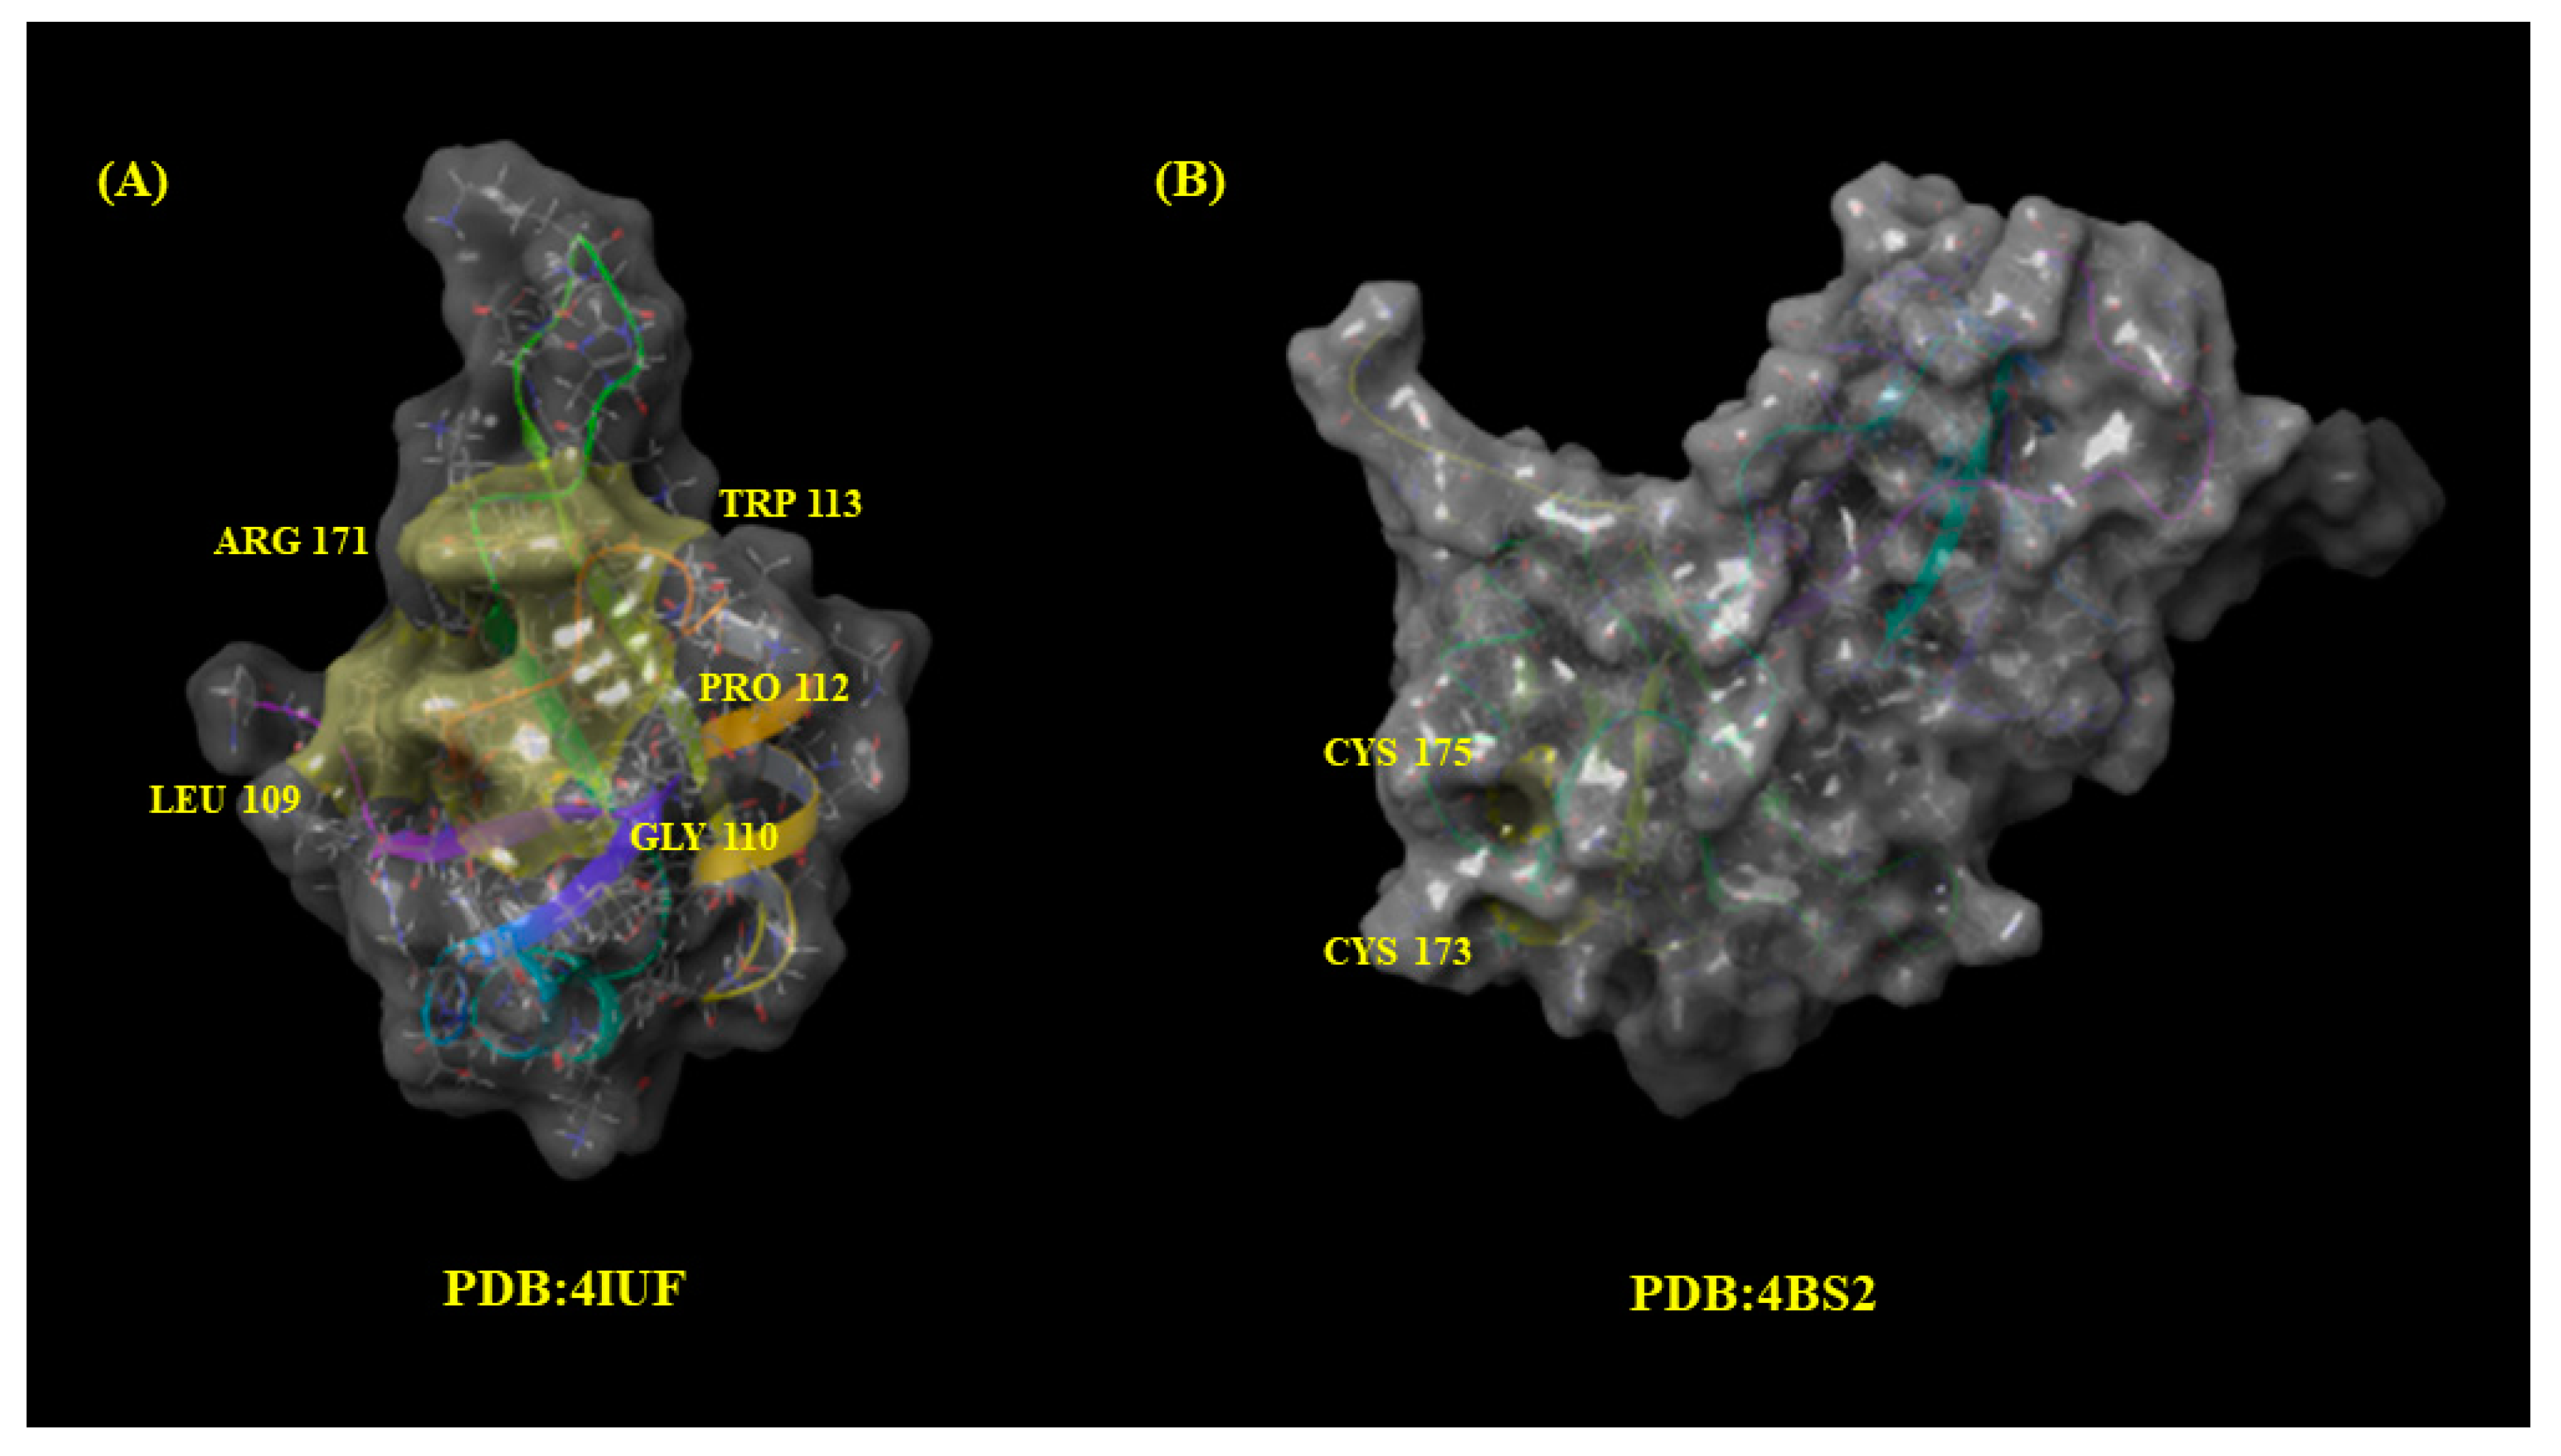
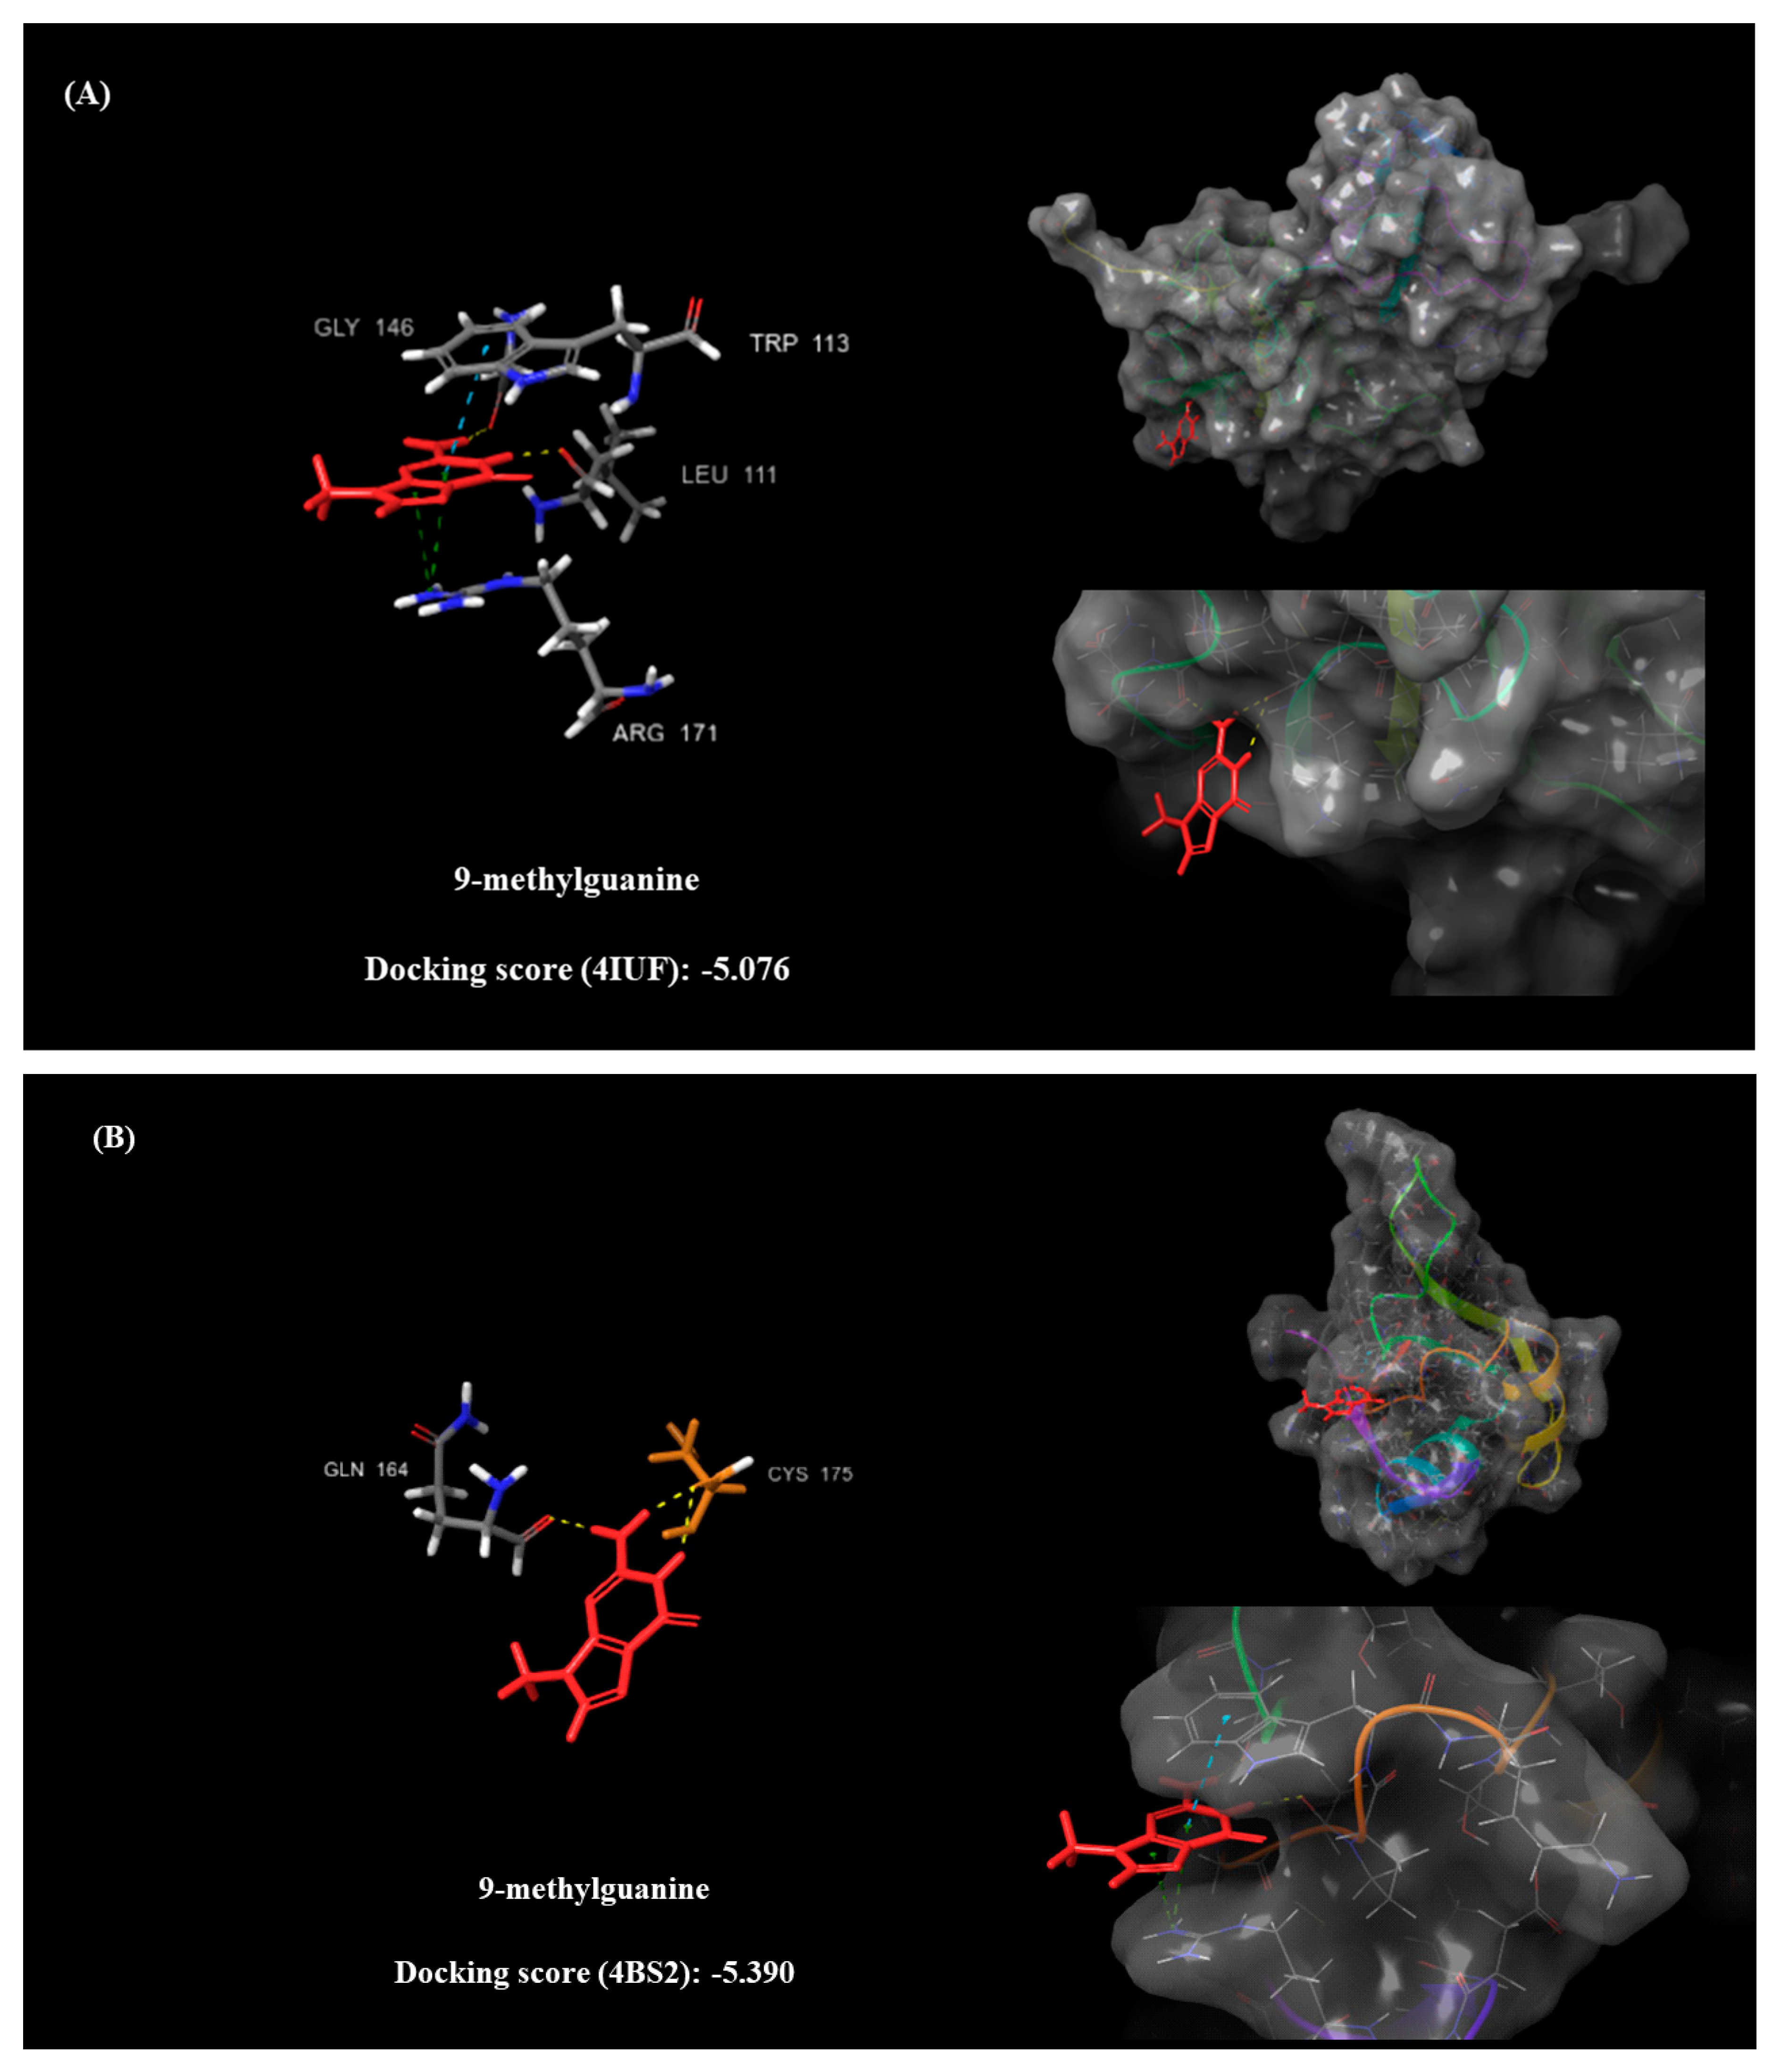
2.5. Molecular Docking
- Leu109, Gly110, Pro112, Trp113, and Arg171 (PDB: 4IUF).
- Cys173 and Cys175 (PDB: 4BS2).

| Compounds | DFGEN | DFCLIN | DFTDP43 | PDB:4IUF | PDB:4BS2 | ||
|---|---|---|---|---|---|---|---|
| Binding Pocket 1 | Binding Pocket 2 | ||||||
| Docking Score | Amino Acids Interacted | Docking Score | Amino Acids Interacted | ||||
| 9-Methylguanine (DB02489) | 11.369 | 2.217 | 1.05 | −5.076 | Arg171 (pi-C+ x2) Trp113 (pi-pi) Leu111 (H) Gly146 (H) | −5.39 | Cys175 (H x2) Gln164 (H) |
| Arimoclomol (DB05025) | 3.453 | 0.364 | 1.904 | −4.761 | Lys176 (H, salt) Lys145 (H) | −4.692 | Asp174 (2H, salt) Lys176 (H, salt) |
| Belaperidone | 6.004 | 0.58 | 0.671 | −3.691 | Gly110 (H) Asn179 (aroH) Gly146 (H) | −4.014 | Asp119 (aroH, H) Asp169 (H) Glu122 (aroH) |
| Dutasteride | 13.278 | 3.412 | 0.998 | −2.675 | Lys145 (H) | −2.843 | Asp174 (H) |
| EGCG (DB12116) | 6.849 | 1.088 | 4.051 | −1.853 | Asp174 (H x2) Arg171 (pi-C+) Gly110 (H) Leu111 (H, aroH) | −3.569 | Cys175 (H) Asp174 (H, aroH) Arg165 (H) |
| Levoleucovorin | 7.082 | 3.271 | 2.234 | −3.739 | Trp113 (aroH) Gly146 (aroH) Arg165 (halo, H x2) Trp172 (aroH, H) Asp174 (aroH) Leu111 (aro H) | −2.902 | Arg165 (H x2) Asp174 (aroH) Lys176 (H, salt) |
| Neflumozide | 8.695 | 1.587 | 1.954 | −3.598 | Ser144 (aroH) Trp113 (pi-pi) Lys145 (H) Gly146 (aroH) Arg171 (pi-C+) | −4.194 | Arg165 (H) Asp174 (salt, H) |
| Olinciguat (DB15238) | 6.699 | 5.706 | 1.141 | −5.03 | Trp113 (pi-pi) Lys145 (aroH) Leu111 (aroH x2) Gly146 (aroH) Arg171 (H) Trp172 (H) Asp174 (H) Arg165 (H x2) | −2.896 | Cys175 (aroH x2) Asp174 (aroH) Ser163 (aroH) Arg165 (H x2) Met162 (aroH) |
| Oxidized coenzyme A (DB01846) | 8.410 | 3.127 | 1.455 | −5.967 | Arg165 (H, halo) Trp172 (H) Arg171 (H x2, halo, pi-pi) Lys176 (H,halo x2) Gly146 (H) Asp169 (H) | −5.548 | Asp174 (2H) Arg165 (4H,3x salt) Trp172 (H, pi-pi) |
3. Materials and Methods
3.1. Analysis of Dataset Compounds and Search Algorithm
3.2. Statistical Modeling Methods
3.3. ALS Models and Validation
3.3.1. Classification Matrix, LOO and LSO Validation
3.3.2. ROC Curve
3.4. Pharmacological Distribution Diagram
3.5. Virtual Screening
3.6. Molecular Docking
4. Conclusions
Supplementary Materials
Author Contributions
Funding
Institutional Review Board Statement
Informed Consent Statement
Data Availability Statement
Acknowledgments
Conflicts of Interest
References
- Mejzini, R.; Flynn, L.L.; Pitout, I.L.; Fletcher, S.; Wilton, S.D.; Akkari, P.A. ALS Genetics, Mechanisms, and Therapeutics: Where are we Now? Front. Neurosci. 2019, 13, 1310. [Google Scholar] [CrossRef] [PubMed] [Green Version]
- Masrori, P.; Van Damme, P. Amyotrophic Lateral Sclerosis: A Clinical Review. Eur. J. Neurol. 2020, 27, 1918–1929. [Google Scholar] [CrossRef] [PubMed]
- Longinetti, E.; Fang, F. Epidemiology of Amyotrophic Lateral Sclerosis: An Update of Recent Literature. Curr. Opin. Neurol. 2019, 32, 771. [Google Scholar] [CrossRef] [PubMed]
- Nelson, L.M.; Topol, B.; Kaye, W.; Williamson, D.; Horton, D.K.; Mehta, P.; Wagner, T. Estimation of the Prevalence of Amyotrophic Lateral Sclerosis in the United States using National Administrative Healthcare Data from 2002 to 2004 and Capture-Recapture Methodology. Neuroepidemiology 2018, 51, 149–157. [Google Scholar] [CrossRef]
- Mehta, P.; Antao, V.; Kaye, W.; Sanchez, M.; Williamson, D.; Bryan, L.; Muravov, O.; Horton, K. Division of Toxicology and Human Health Sciences, Agency for Toxic Substances and Disease Registry, Atlanta, Georgia; Centers for Disease Control and Prevention (CDC): Prevalence of Amyotrophic Lateral sclerosis–United States, 2010–2011. MMWR Suppl. 2014, 63, 1–14. [Google Scholar] [PubMed]
- Prasad, A.; Bharathi, V.; Sivalingam, V.; Girdhar, A.; Patel, B.K. Molecular Mechanisms of TDP-43 Misfolding and Pathology in Amyotrophic Lateral Sclerosis. Front. Mol. Neurosci. 2019, 12, 25. [Google Scholar] [CrossRef]
- Abati, E.; Bresolin, N.; Comi, G.; Corti, S. Silence Superoxide Dismutase 1 (SOD1): A Promising Therapeutic Target for Amyotrophic Lateral Sclerosis (ALS). Expert Opin. Ther. Targets 2020, 24, 295–310. [Google Scholar] [CrossRef] [PubMed]
- Spiller, K.J.; Cheung, C.J.; Restrepo, C.R.; Kwong, L.K.; Stieber, A.M.; Trojanowski, J.Q.; Lee, V.M. Selective Motor Neuron Resistance and Recovery in a New Inducible Mouse Model of TDP-43 Proteinopathy. J. Neurosci. 2016, 36, 7707–7717. [Google Scholar] [CrossRef] [Green Version]
- Spiller, K.J.; Restrepo, C.R.; Khan, T.; Dominique, M.A.; Fang, T.C.; Canter, R.G.; Roberts, C.J.; Miller, K.R.; Ransohoff, R.M.; Trojanowski, J.Q. Microglia-Mediated Recovery from ALS-Relevant Motor Neuron Degeneration in a Mouse Model of TDP-43 Proteinopathy. Nat. Neurosci. 2018, 21, 329–340. [Google Scholar] [CrossRef]
- Spiller, K.J.; Khan, T.; Dominique, M.A.; Restrepo, C.R.; Cotton-Samuel, D.; Levitan, M.; Jafar-Nejad, P.; Zhang, B.; Soriano, A.; Rigo, F. Reduction of Matrix Metalloproteinase 9 (MMP-9) Protects Motor Neurons from TDP-43-Triggered Death in rNLS8 Mice. Neurobiol. Dis. 2019, 124, 133–140. [Google Scholar] [CrossRef]
- Mitsumoto, H.; Brooks, B.R.; Silani, V. Clinical Trials in Amyotrophic Lateral Sclerosis: Why so Many Negative Trials and how can Trials be Improved? Lancet Neurol. 2014, 13, 1127–1138. [Google Scholar] [CrossRef]
- Barp, A.; Gerardi, F.; Lizio, A.; Sansone, V.A.; Lunetta, C. Emerging Drugs for the Treatment of Amyotrophic Lateral Sclerosis: A Focus on Recent Phase 2 Trials. Expert Opin. Emerg. Drugs 2020, 25, 145–164. [Google Scholar] [CrossRef]
- Miller, T.; Cudkowicz, M.; Shaw, P.J.; Andersen, P.M.; Atassi, N.; Bucelli, R.C.; Genge, A.; Glass, J.; Ladha, S.; Ludolph, A.L. Phase 1–2 Trial of Antisense Oligonucleotide Tofersen for SOD1 ALS. N. Engl. J. Med. 2020, 383, 109–119. [Google Scholar] [CrossRef] [PubMed]
- Palomo, V.; Tosat-Bitrian, C.; Nozal, V.; Nagaraj, S.; Martin-Requero, A.; Martinez, A. TDP-43: A Key Therapeutic Target Beyond Amyotrophic Lateral Sclerosis. ACS Chem. Neurosci. 2019, 10, 1183–1196. [Google Scholar] [CrossRef] [Green Version]
- Park, J.; Kim, S.; Park, D.; Park, J. Effect of Edaravone Therapy in Korean Amyotrophic Lateral Sclerosis (ALS) Patients. Neurol. Sci. 2020, 41, 119–123. [Google Scholar] [CrossRef]
- Zanni, R.; Galvez-Llompart, M.; Garcia-Domenech, R.; Galvez, J. Latest Advances in Molecular Topology Applications for Drug Discovery. Expert Opin. Drug Discov. 2015, 10, 945–957. [Google Scholar] [CrossRef] [PubMed]
- Galvez, J.; Zanni, R.; Galvez-Llompart, M.; Benlloch, J.M. Macrolides may Prevent Severe Acute Respiratory Syndrome Coronavirus 2 Entry into Cells: A Quantitative Structure Activity Relationship Study and Experimental Validation. J. Chem. Inf. Modeling 2021, 61, 2016–2025. [Google Scholar] [CrossRef]
- Zanni, R.; Galvez-Llompart, M.; Garcia-Domenech, R.; Galvez, J. What Place does Molecular Topology have in Today’s Drug Discovery? Expert Opin. Drug Discov. 2020, 15, 1133–1144. [Google Scholar] [CrossRef] [PubMed]
- Kuo, P.; Chiang, C.; Wang, Y.; Doudeva, L.G.; Yuan, H.S. The Crystal Structure of TDP-43 RRM1-DNA Complex Reveals the Specific Recognition for UG-and TG-Rich Nucleic Acids. Nucleic Acids Res. 2014, 42, 4712–4722. [Google Scholar] [CrossRef] [Green Version]
- Lukavsky, P.J.; Daujotyte, D.; Tollervey, J.R.; Ule, J.; Stuani, C.; Buratti, E.; Baralle, F.E.; Damberger, F.F.; Allain, F.H. Molecular Basis of UG-Rich RNA Recognition by the Human Splicing Factor TDP-43. Nat. Struct. Mol. Biol. 2013, 20, 1443–1449. [Google Scholar] [CrossRef]
- Wishart, D.S.; Feunang, Y.D.; Guo, A.C.; Lo, E.J.; Marcu, A.; Grant, J.R.; Sajed, T.; Johnson, D.; Li, C.; Sayeeda, Z. DrugBank 5.0: A Major Update to the DrugBank Database for 2018. Nucleic Acids Res. 2018, 46, D1074–D1082. [Google Scholar] [CrossRef] [PubMed]
- Kwong, L.K.; Uryu, K.; Trojanowski, J.Q.; Lee, V.M. TDP-43 Proteinopathies: Neurodegenerative Protein Misfolding Diseases without Amyloidosis. Neurosignals 2008, 16, 41–51. [Google Scholar] [CrossRef]
- Buratti, E. Functional Significance of TDP-43 Mutations in Disease. Adv. Genet. 2015, 91, 1–53. [Google Scholar]
- François-Moutal, L.; Felemban, R.; Scott, D.D.; Sayegh, M.R.; Miranda, V.G.; Perez-Miller, S.; Khanna, R.; Gokhale, V.; Zarnescu, D.C.; Khanna, M. Small Molecule Targeting TDP-43′s RNA Recognition Motifs Reduces Locomotor Defects in a Drosophila Model of Amyotrophic Lateral Sclerosis (ALS). ACS Chem. Biol. 2019, 14, 2006–2013. [Google Scholar] [CrossRef] [PubMed]
- François-Moutal, L.; Perez-Miller, S.; Scott, D.D.; Miranda, V.G.; Mollasalehi, N.; Khanna, M. Structural Insights into TDP-43 and Effects of Post-Translational Modifications. Front. Mol. Neurosci. 2019, 12, 301. [Google Scholar] [CrossRef]
- Kim, E.H.; Brockman, J.A.; Andriole, G.L. The use of 5-Alpha Reductase Inhibitors in the Treatment of Benign Prostatic Hyperplasia. Asian J. Urol. 2018, 5, 28–32. [Google Scholar] [CrossRef]
- Luo, D.; Xu, J.; Chen, X.; Zhu, X.; Liu, S.; Li, J.; Xu, X.; Ma, X.; Zhao, J.; Ji, X. (−)-Epigallocatechin-3-Gallate (EGCG) Attenuates Salt-Induced Hypertension and Renal Injury in Dahl Salt-Sensitive Rats. Sci. Rep. 2020, 10, 4783. [Google Scholar] [CrossRef] [PubMed]
- Beretta, G.D.; Pessi, M.A.; Poletti, P.; Mosconi, S.; Labianca, R. New Drugs and Combinations in the Palliative Treatment of Colon and Rectal Cancer. Eur. J. Surg. Oncol. 2001, 27, 595–600. [Google Scholar] [CrossRef] [PubMed]
- Arimoclomol in Amyotropic Lateral Sclerosis. Available online: https://clinicaltrials.gov/ct2/show/record/NCT03491462 (accessed on 5 November 2021).
- Impact of the Combined Treatment of Liposomed Polyphenols with G04CB02 on the ALS Patients. Available online: https://www.medifind.com/conditions/amyotrophic-lateral-sclerosis/251/clinical-trial/236546817 (accessed on 5 November 2021).
- Impact of the Combined Treatment of Curcumin and Resveratrol Liposomed Polyphenols with Dutasteride on the Clinical Improvement of ALS Patients. Available online: https://clinicaltrials.gov/ct2/show/NCT04654689 (accessed on 5 November 2021).
- 9-Methylguanine (DB02489). Available online: https://go.drugbank.com/drugs/DB02489 (accessed on 5 November 2021).
- Watanabe, K.; Tanaka, M.; Yuki, S.; Hirai, M.; Yamamoto, Y. How is Edaravone Effective Against Acute Ischemic Stroke and Amyotrophic Lateral Sclerosis? J. Clin. Biochem. Nutr. 2018, 62, 17–62. [Google Scholar] [CrossRef] [Green Version]
- Petrov, D.; Mansfield, C.; Moussy, A.; Hermine, O. ALS Clinical Trials Review: 20 Years of Failure. are we any Closer to Registering a New Treatment? Front. Aging Neurosci. 2017, 9, 68. [Google Scholar] [CrossRef] [Green Version]
- DuVal, M.G.; Hinge, V.K.; Snyder, N.; Kanyo, R.; Bratvold, J.; Pokrishevsky, E.; Cashman, N.R.; Blinov, N.; Kovalenko, A.; Allison, W.T. Tryptophan 32 Mediates SOD1 Toxicity in a in Vivo Motor Neuron Model of ALS and is a Promising Target for Small Molecule Therapeutics. Neurobiol. Dis. 2019, 124, 297–310. [Google Scholar] [CrossRef] [PubMed]
- Pence, H.E.; Williams, A. ChemSpider: An Online Chemical Information Resource. J. Chem. Educ. 2010, 87, 1123–1124. [Google Scholar] [CrossRef]
- Cousins, K.R. ChemDraw Ultra 9.0.CambridgeSoft, 100 CambridgePark Drive, Cambridge, MA 02140, 2005; CA. Available online: www.cambridgesoft.com (accessed on 5 November 2021).
- Comprehensive Medicinal Chemistry (CMC-3D) Database; MDL Information Systems Inc.: San Leandro, CA, USA. Available online: http://www.akosgmbh.de/accelrys/databases/cmc-3d.htm (accessed on 8 November 2021).
- Mauri, A. alvaDesc: A tool to calculate and analyze molecular descriptors and fingerprints. In Ecotoxicological QSARs; Springer: Berlin/Heidelberg, Germany, 2020; pp. 801–820. [Google Scholar]
- Gramatica, P. On the development and validation of QSAR models. In Computational Toxicology; Springer: Berlin/Heidelberg, Germany, 2013; pp. 499–526. [Google Scholar]
- StatSoft, Inc. STATISTICA (Data Analysis Software System), Version 6; StatSoft, Inc.: Tulsa, OK, USA, 2001; Volume 150, pp. 91–94. [Google Scholar]
- Baumann, K. Cross-Validation as the Objective Function for Variable-Selection Techniques. TrAC Trends Anal. Chem. 2003, 22, 395–406. [Google Scholar] [CrossRef]
- Hawkins, D.M.; Basak, S.C.; Mills, D. Assessing Model Fit by Cross-Validation. J. Chem. Inf. Comput. Sci. 2003, 43, 579–586. [Google Scholar] [CrossRef] [PubMed]
- Demler, O.V.; Pencina, M.J.; D’Agostino, R.B., Sr. Equivalence of Improvement in Area Under ROC Curve and Linear Discriminant Analysis Coefficient Under Assumption of Normality. Stat. Med. 2011, 30, 1410–1418. [Google Scholar] [CrossRef] [PubMed]
- Gálvez, J.; García-Domenech, R.; de Gregorio Alapont, C.; de Julián-Ortiz, J.V.; Popa, L. Pharmacological Distribution Diagrams: A Tool for De Novo Drug Design. J. Mol. Graph. 1996, 14, 272–276. [Google Scholar] [CrossRef]
- Schrödinger, LLC. Schrodinger Software Suite; Schrödinger, LLC: New York, NY, USA, 2019; p. 670. [Google Scholar]


| Model Data | Internal Validation |
|---|---|
N = 19, λ = 0.321, F = 7.388, p < 0.002 | LOOval: |
| λCV = 0.318 | |
| FCV = 7.093 | |
| pcv < 0.004 | |
N = 33, λ = 0.525, F = 6.339, p < 0.0009 | LOO val: |
| λCV = 0.522 | |
| FCV = 6.217 | |
| pcv < 0.001 | |
N = 43, λ = 0.530, F = 11.510, p < 0.00001 | LSO val: |
| λCV = 0.509 | |
| FCV = 9.217 | |
| pcv < 0.0003 |
| Model | Internal Validation | ||||
|---|---|---|---|---|---|
| % of Correct Classification | Active | Inactive | % of Correct Classification | ||
| Active | 83.3 | 5 | 1 | 95.9 LOO | |
| DFGEN | Inactive | 100.0 | 0 | 13 | |
| Average | 91.7 | ||||
| Active | 100.0 | 6 | 0 | 84.3 LOO | |
| DFCLIN | Inactive | 88.9 | 3 | 24 | |
| Average | 94.5 | ||||
| Active | 84.2 | 16 | 3 | 81.7 LSO | |
| DFTDP43 | Inactive | 83.3 | 4 | 20 | |
| Average | 83.8 | ||||
| Descriptor Type | Descriptor Name | Descriptor Definition |
|---|---|---|
| 2D autocorrelations index | MATS5m | Moran autocorrelation of lag 5 weighted by mass |
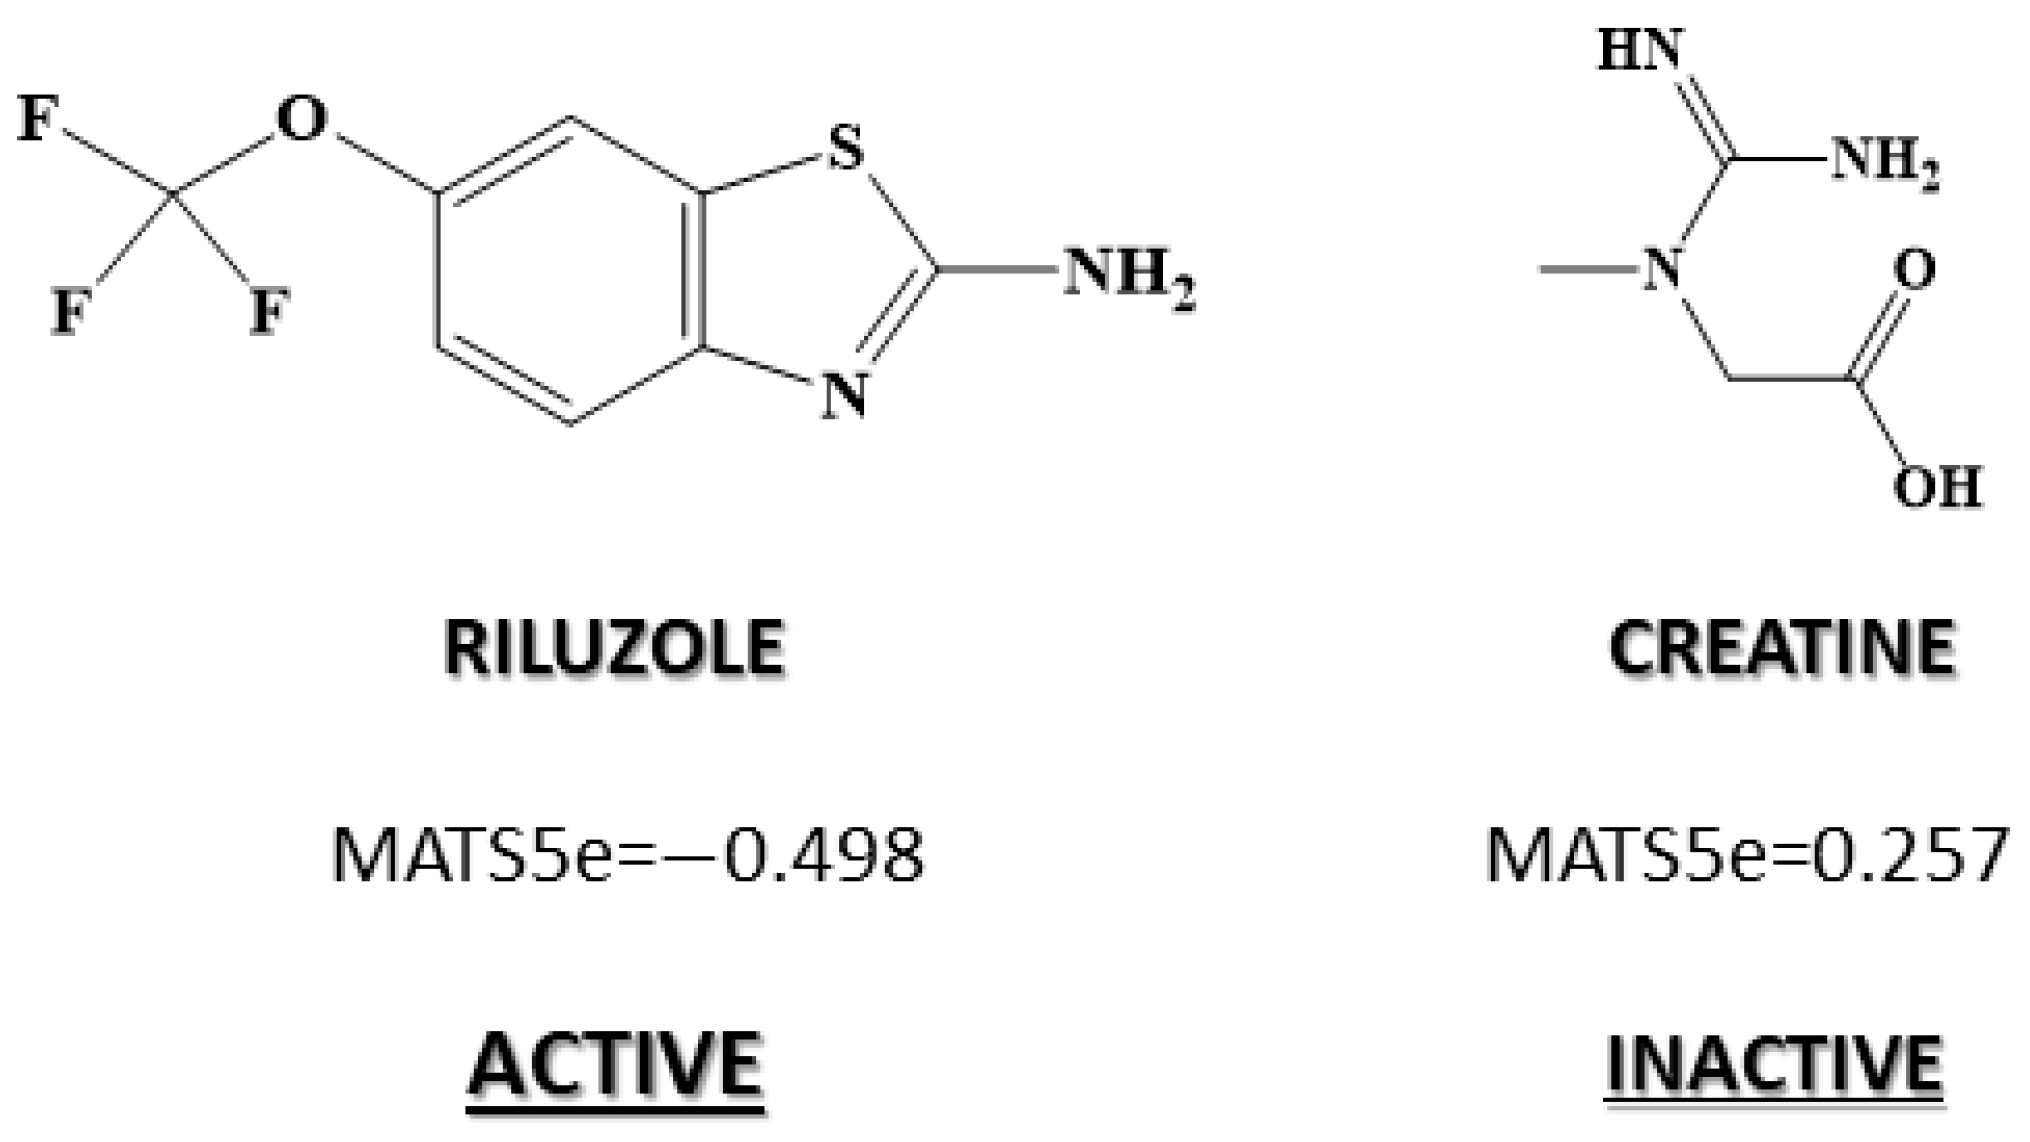
| 2D autocorrelations index | MATS5e | Moran autocorrelation of lag 5 weighted by Sanderson electronegativity |
| 2D autocorrelations index | ATSC3m | Centered Broto–Moreau autocorrelation of lag 3 weighted by mass |
| 2D autocorrelations index | ATSC8m | Centered Broto–Moreau autocorrelation of lag 8 weighted by mass |
| 2D matrix-based descriptors | VE1sign_Dz(p) | Sum of the last eigenvector from Barysz matrix weighted by polarizability |
| 2D matrix-based descriptors | VE2sign_D | Average coefficient of the last eigenvector from topological distance matrix |
| 2D matrix-based descriptors | SM1_DZ(p) | Spectral moment of order 1 from Barysz matrix weighted by polarizability |
| 3D matrix-based descriptors | J_G | Balaban-like index from geometrical matrix |
| Connectivity index | X3A | Average connectivity index of order 3 |
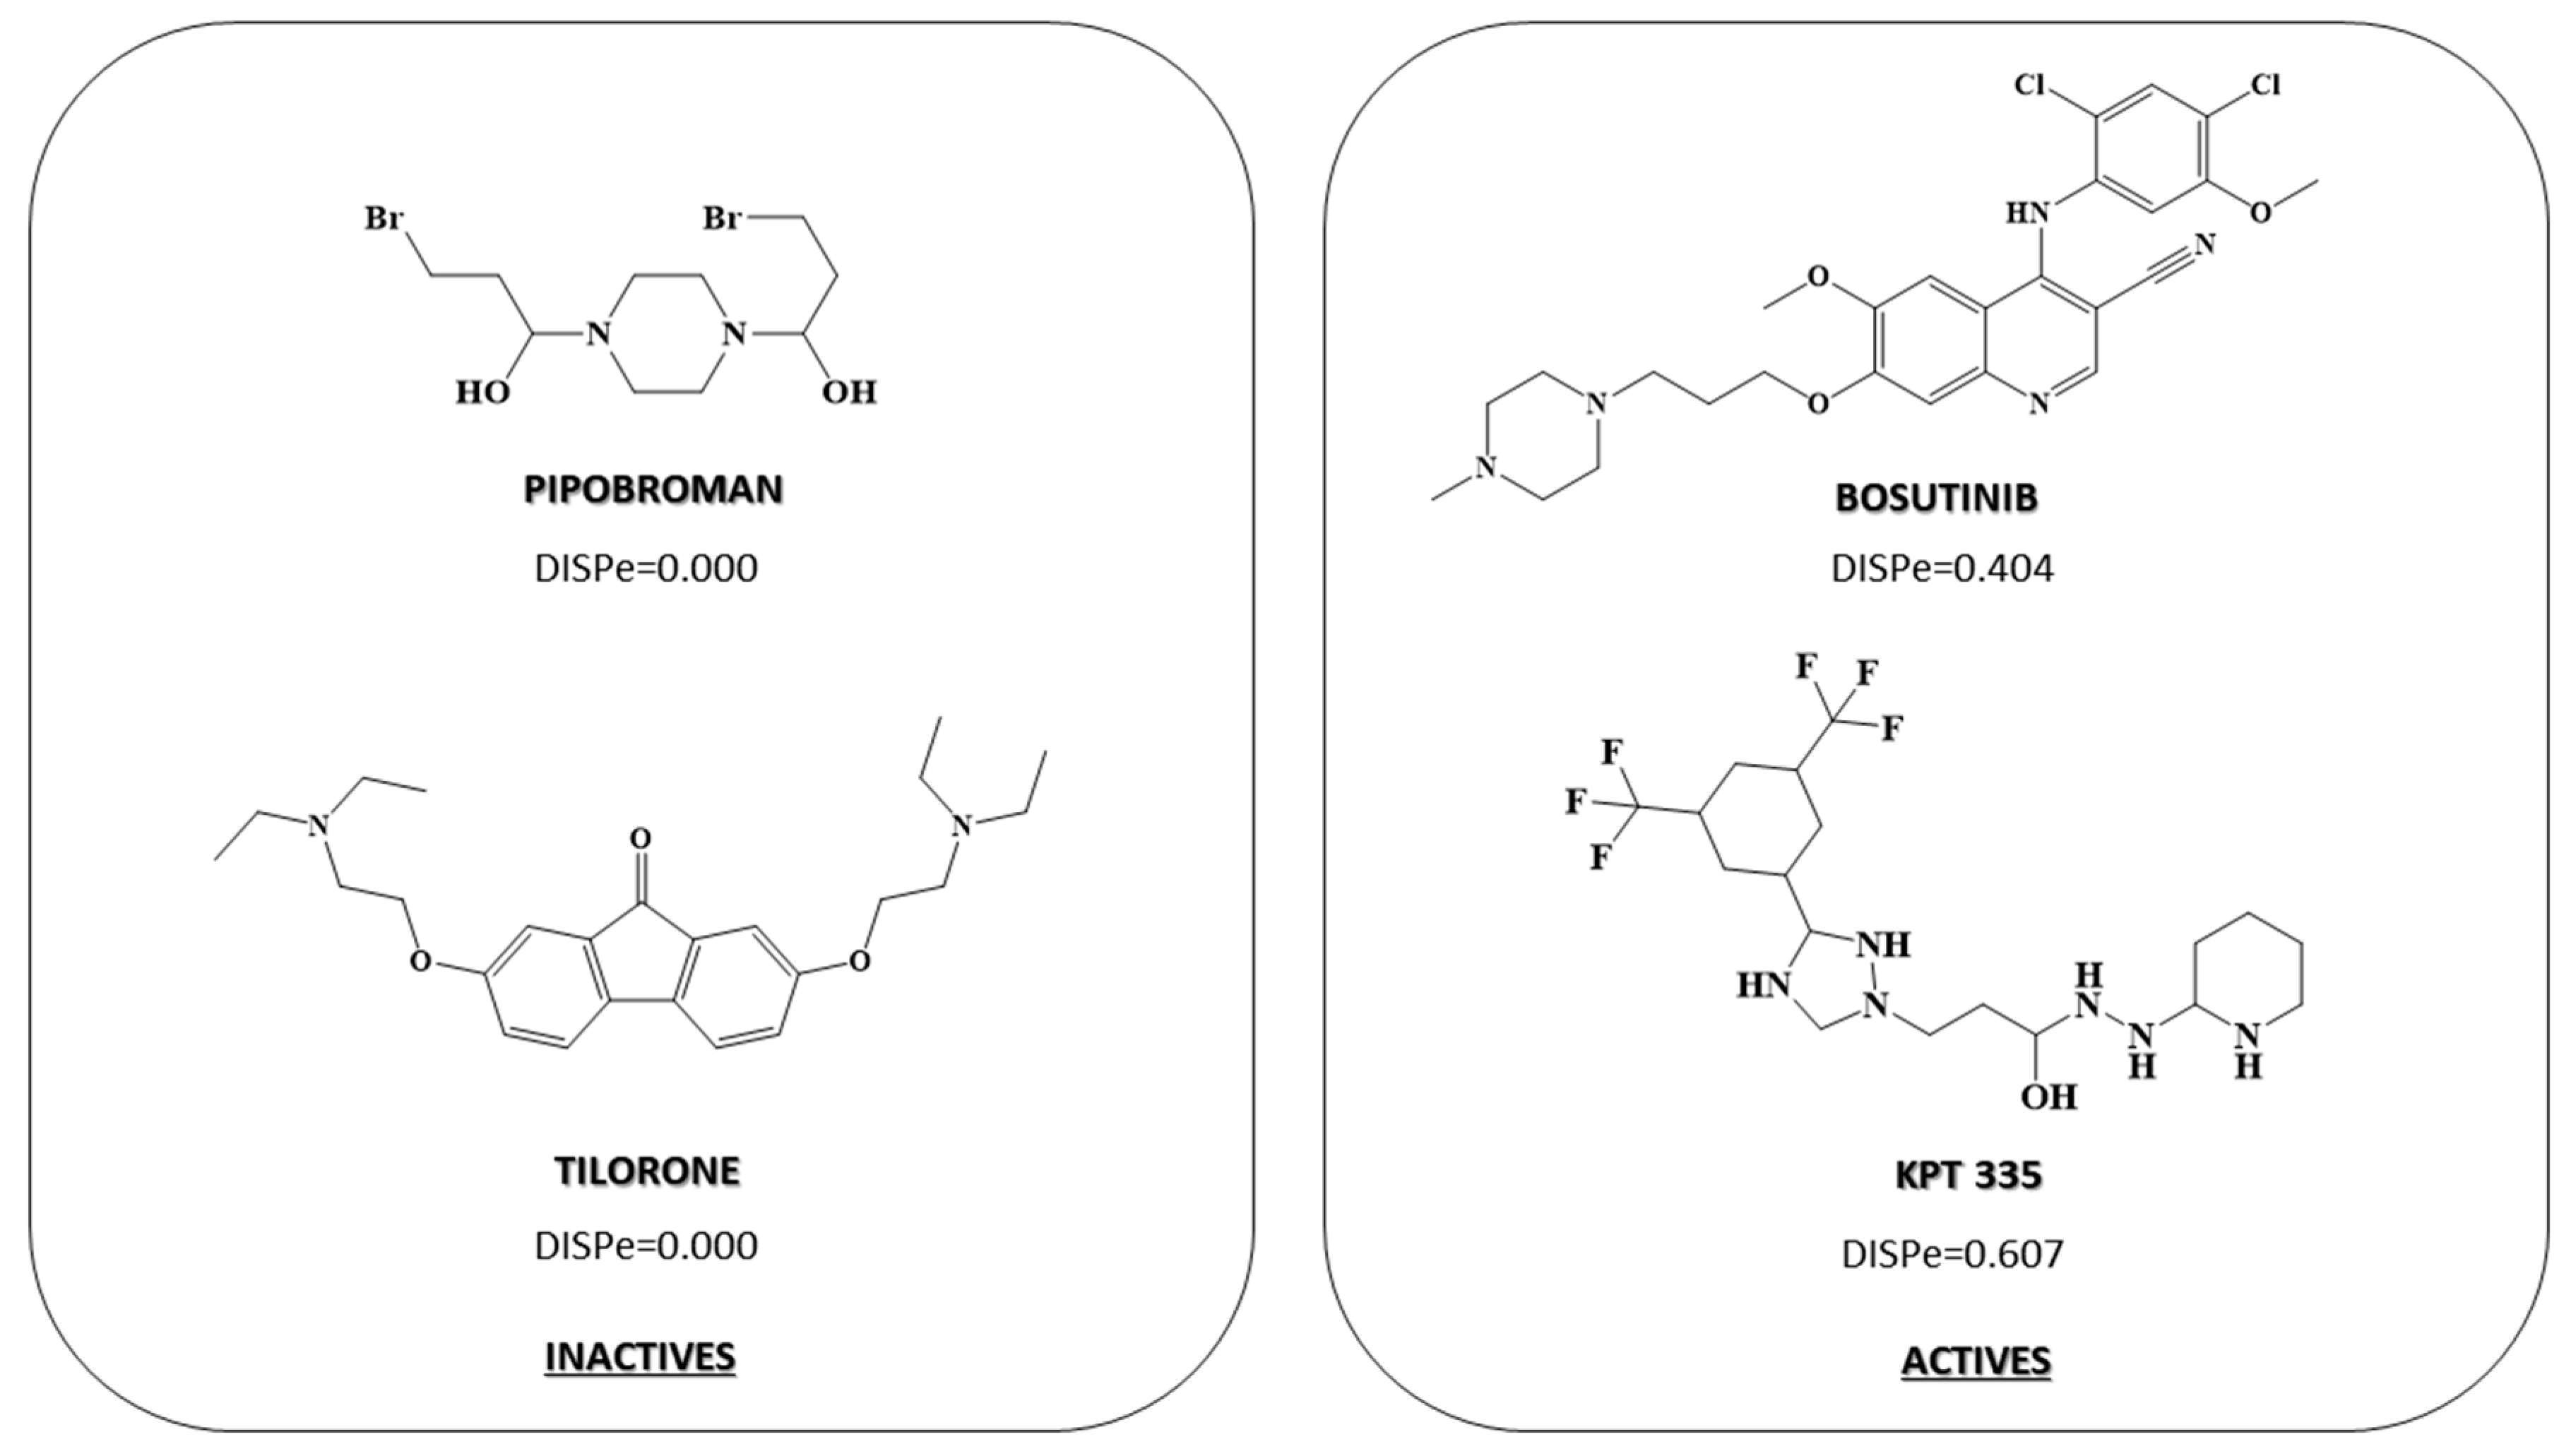
| Geometrical descriptors | DISPe | Displacement value/weighted by Sanderson electronegativity |
| Topological index | MeanDD | Mean pairwise detour distance |
Publisher’s Note: MDPI stays neutral with regard to jurisdictional claims in published maps and institutional affiliations. |
© 2022 by the authors. Licensee MDPI, Basel, Switzerland. This article is an open access article distributed under the terms and conditions of the Creative Commons Attribution (CC BY) license (https://creativecommons.org/licenses/by/4.0/).
Share and Cite
Galvez-Llompart, M.; Zanni, R.; Garcia-Domenech, R.; Galvez, J. How Molecular Topology Can Help in Amyotrophic Lateral Sclerosis (ALS) Drug Development: A Revolutionary Paradigm for a Merciless Disease. Pharmaceuticals 2022, 15, 94. https://doi.org/10.3390/ph15010094
Galvez-Llompart M, Zanni R, Garcia-Domenech R, Galvez J. How Molecular Topology Can Help in Amyotrophic Lateral Sclerosis (ALS) Drug Development: A Revolutionary Paradigm for a Merciless Disease. Pharmaceuticals. 2022; 15(1):94. https://doi.org/10.3390/ph15010094
Chicago/Turabian StyleGalvez-Llompart, Maria, Riccardo Zanni, Ramon Garcia-Domenech, and Jorge Galvez. 2022. "How Molecular Topology Can Help in Amyotrophic Lateral Sclerosis (ALS) Drug Development: A Revolutionary Paradigm for a Merciless Disease" Pharmaceuticals 15, no. 1: 94. https://doi.org/10.3390/ph15010094