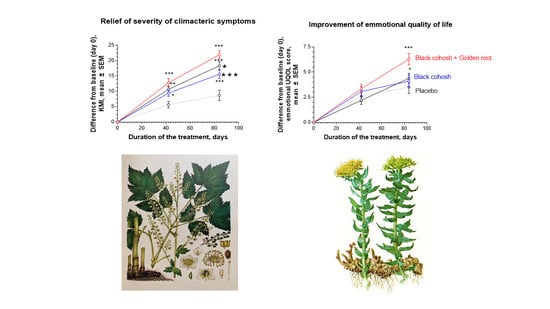
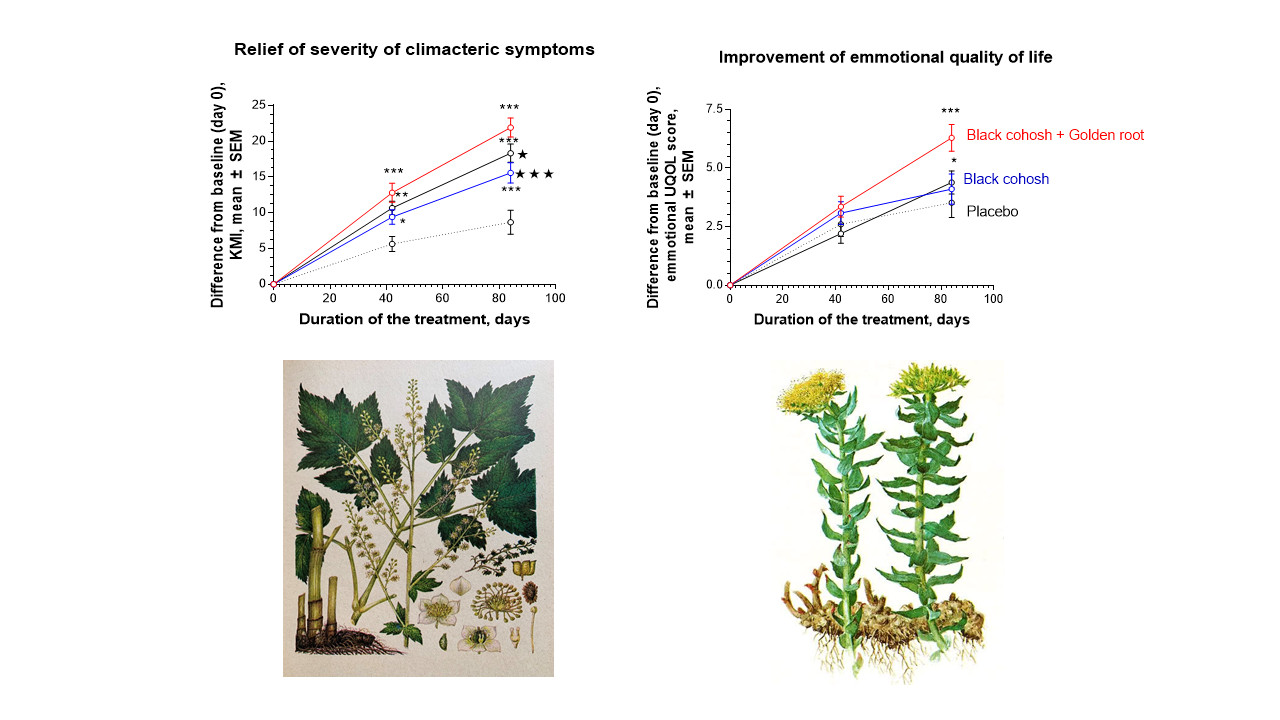
Actaea racemosa L. Is More Effective in Combination with Rhodiola rosea L. for Relief of Menopausal Symptoms: A Randomized, Double-Blind, Placebo-Controlled Study


Abstract
:
1. Introduction
2. Results
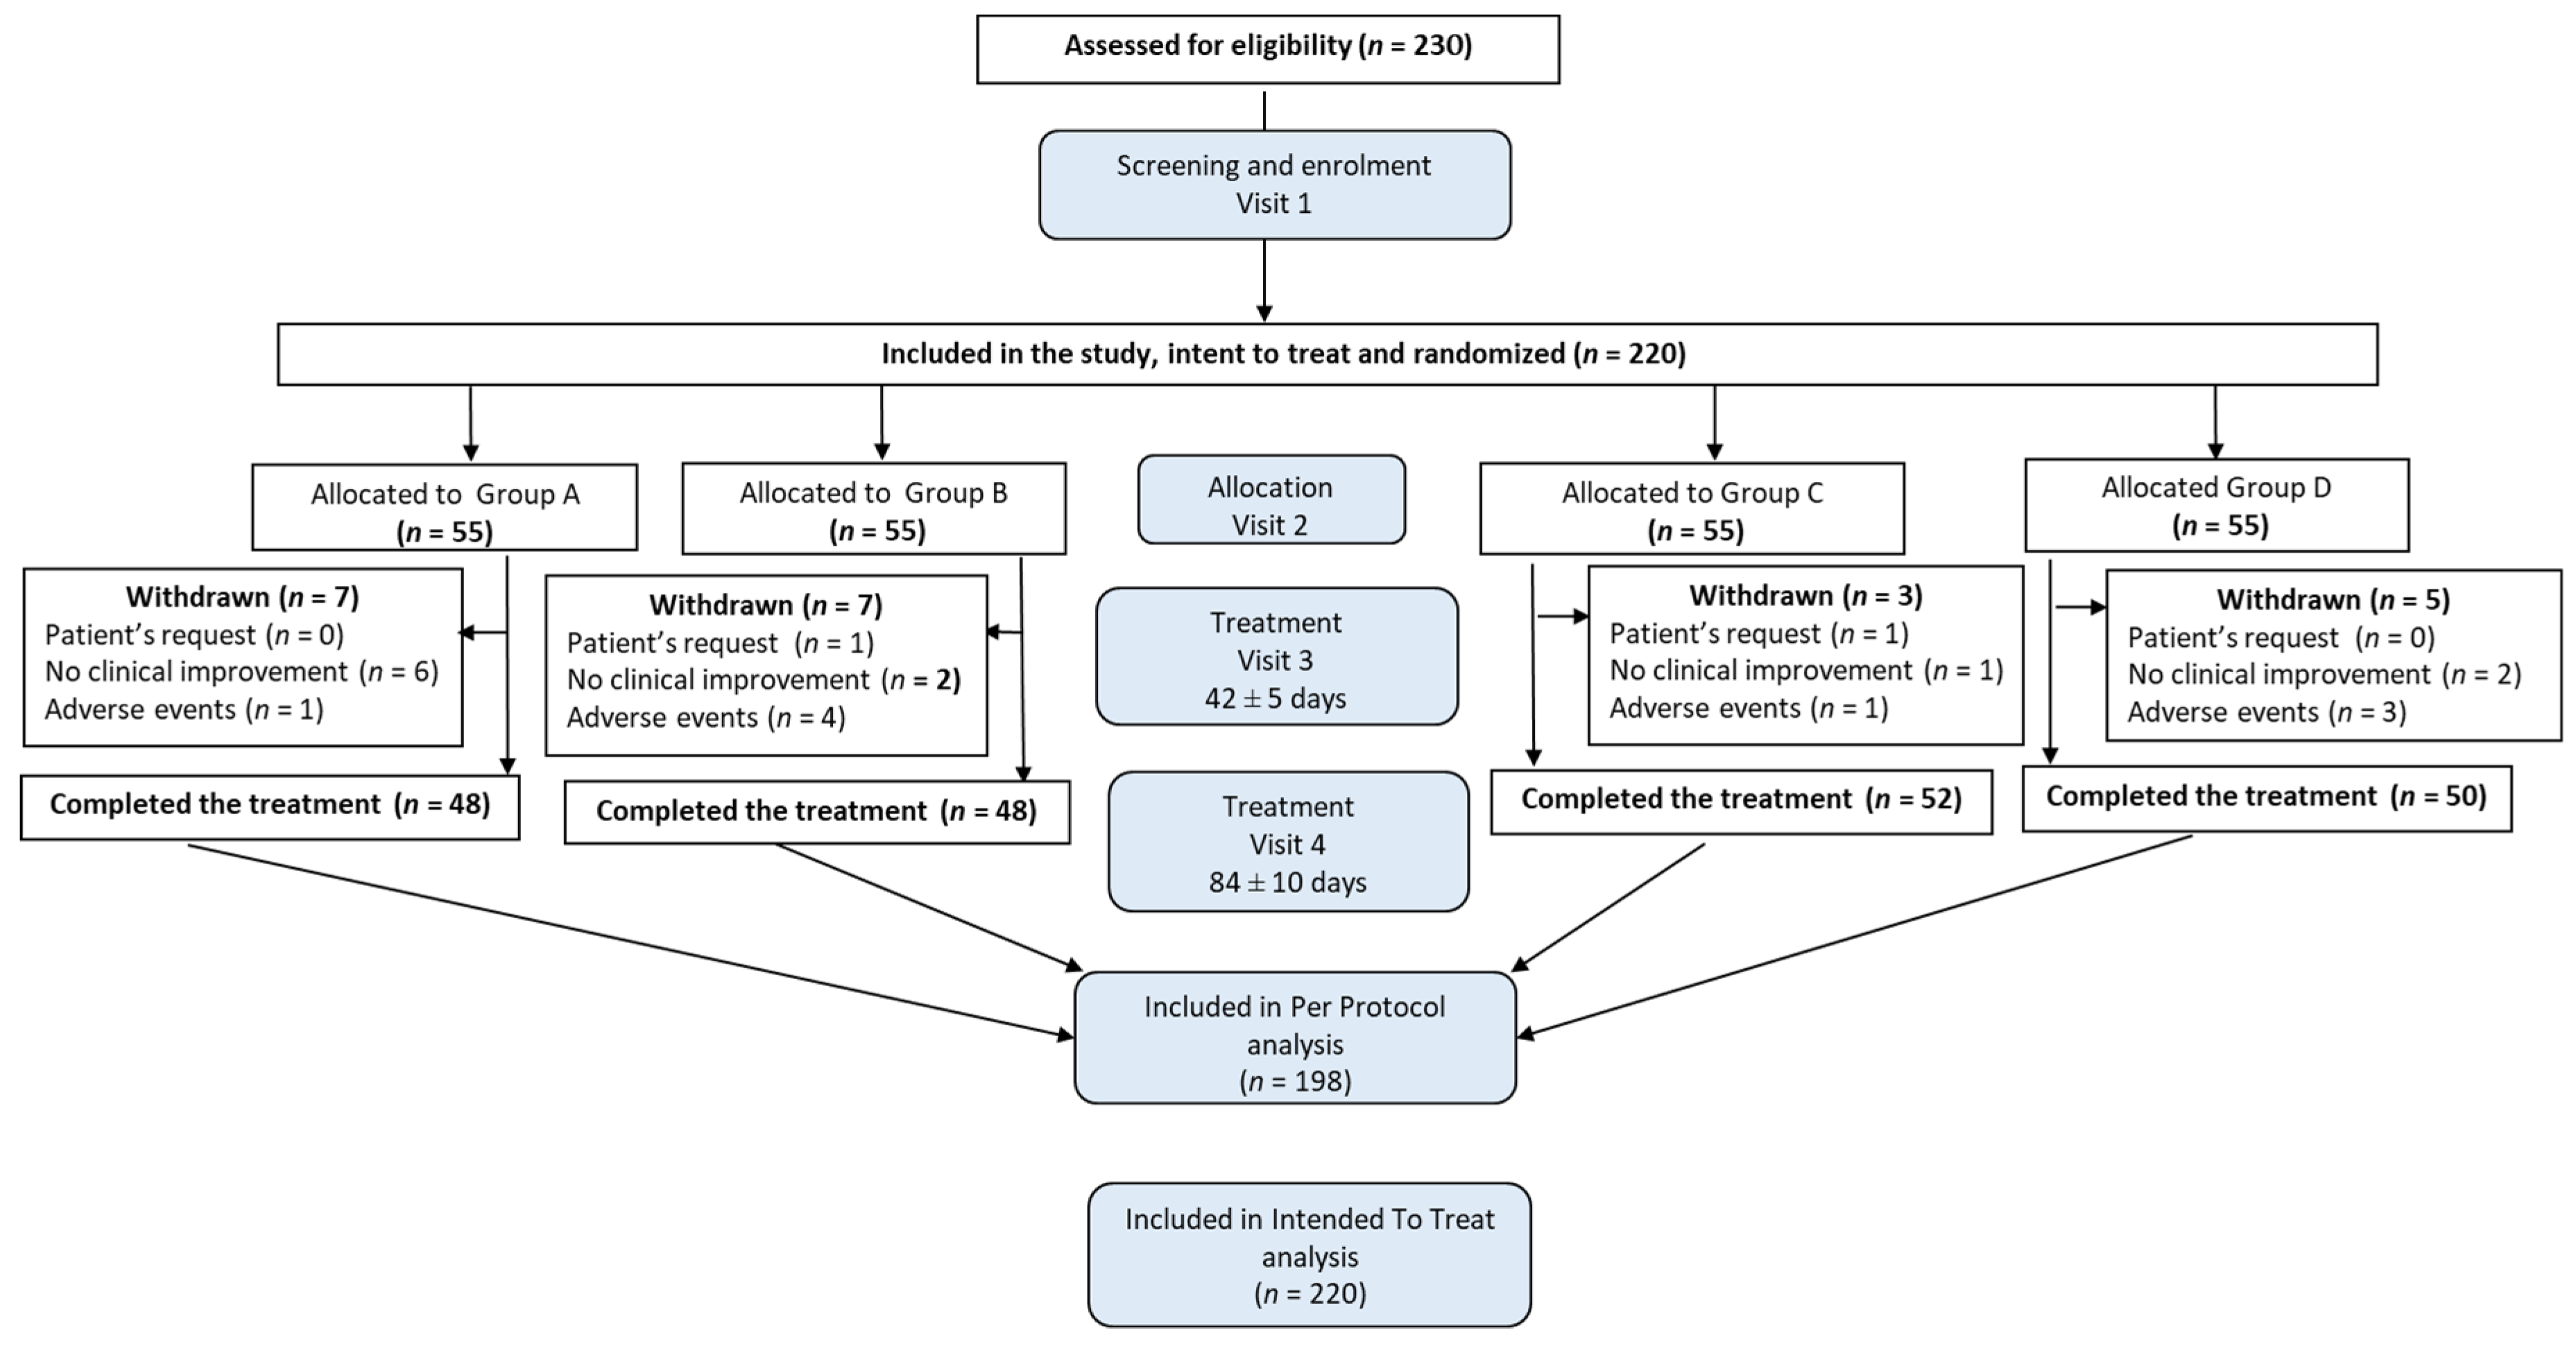
2.1. Study Participants, Their Disposition, and Baseline Variables
2.2. Efficacy of Treatment
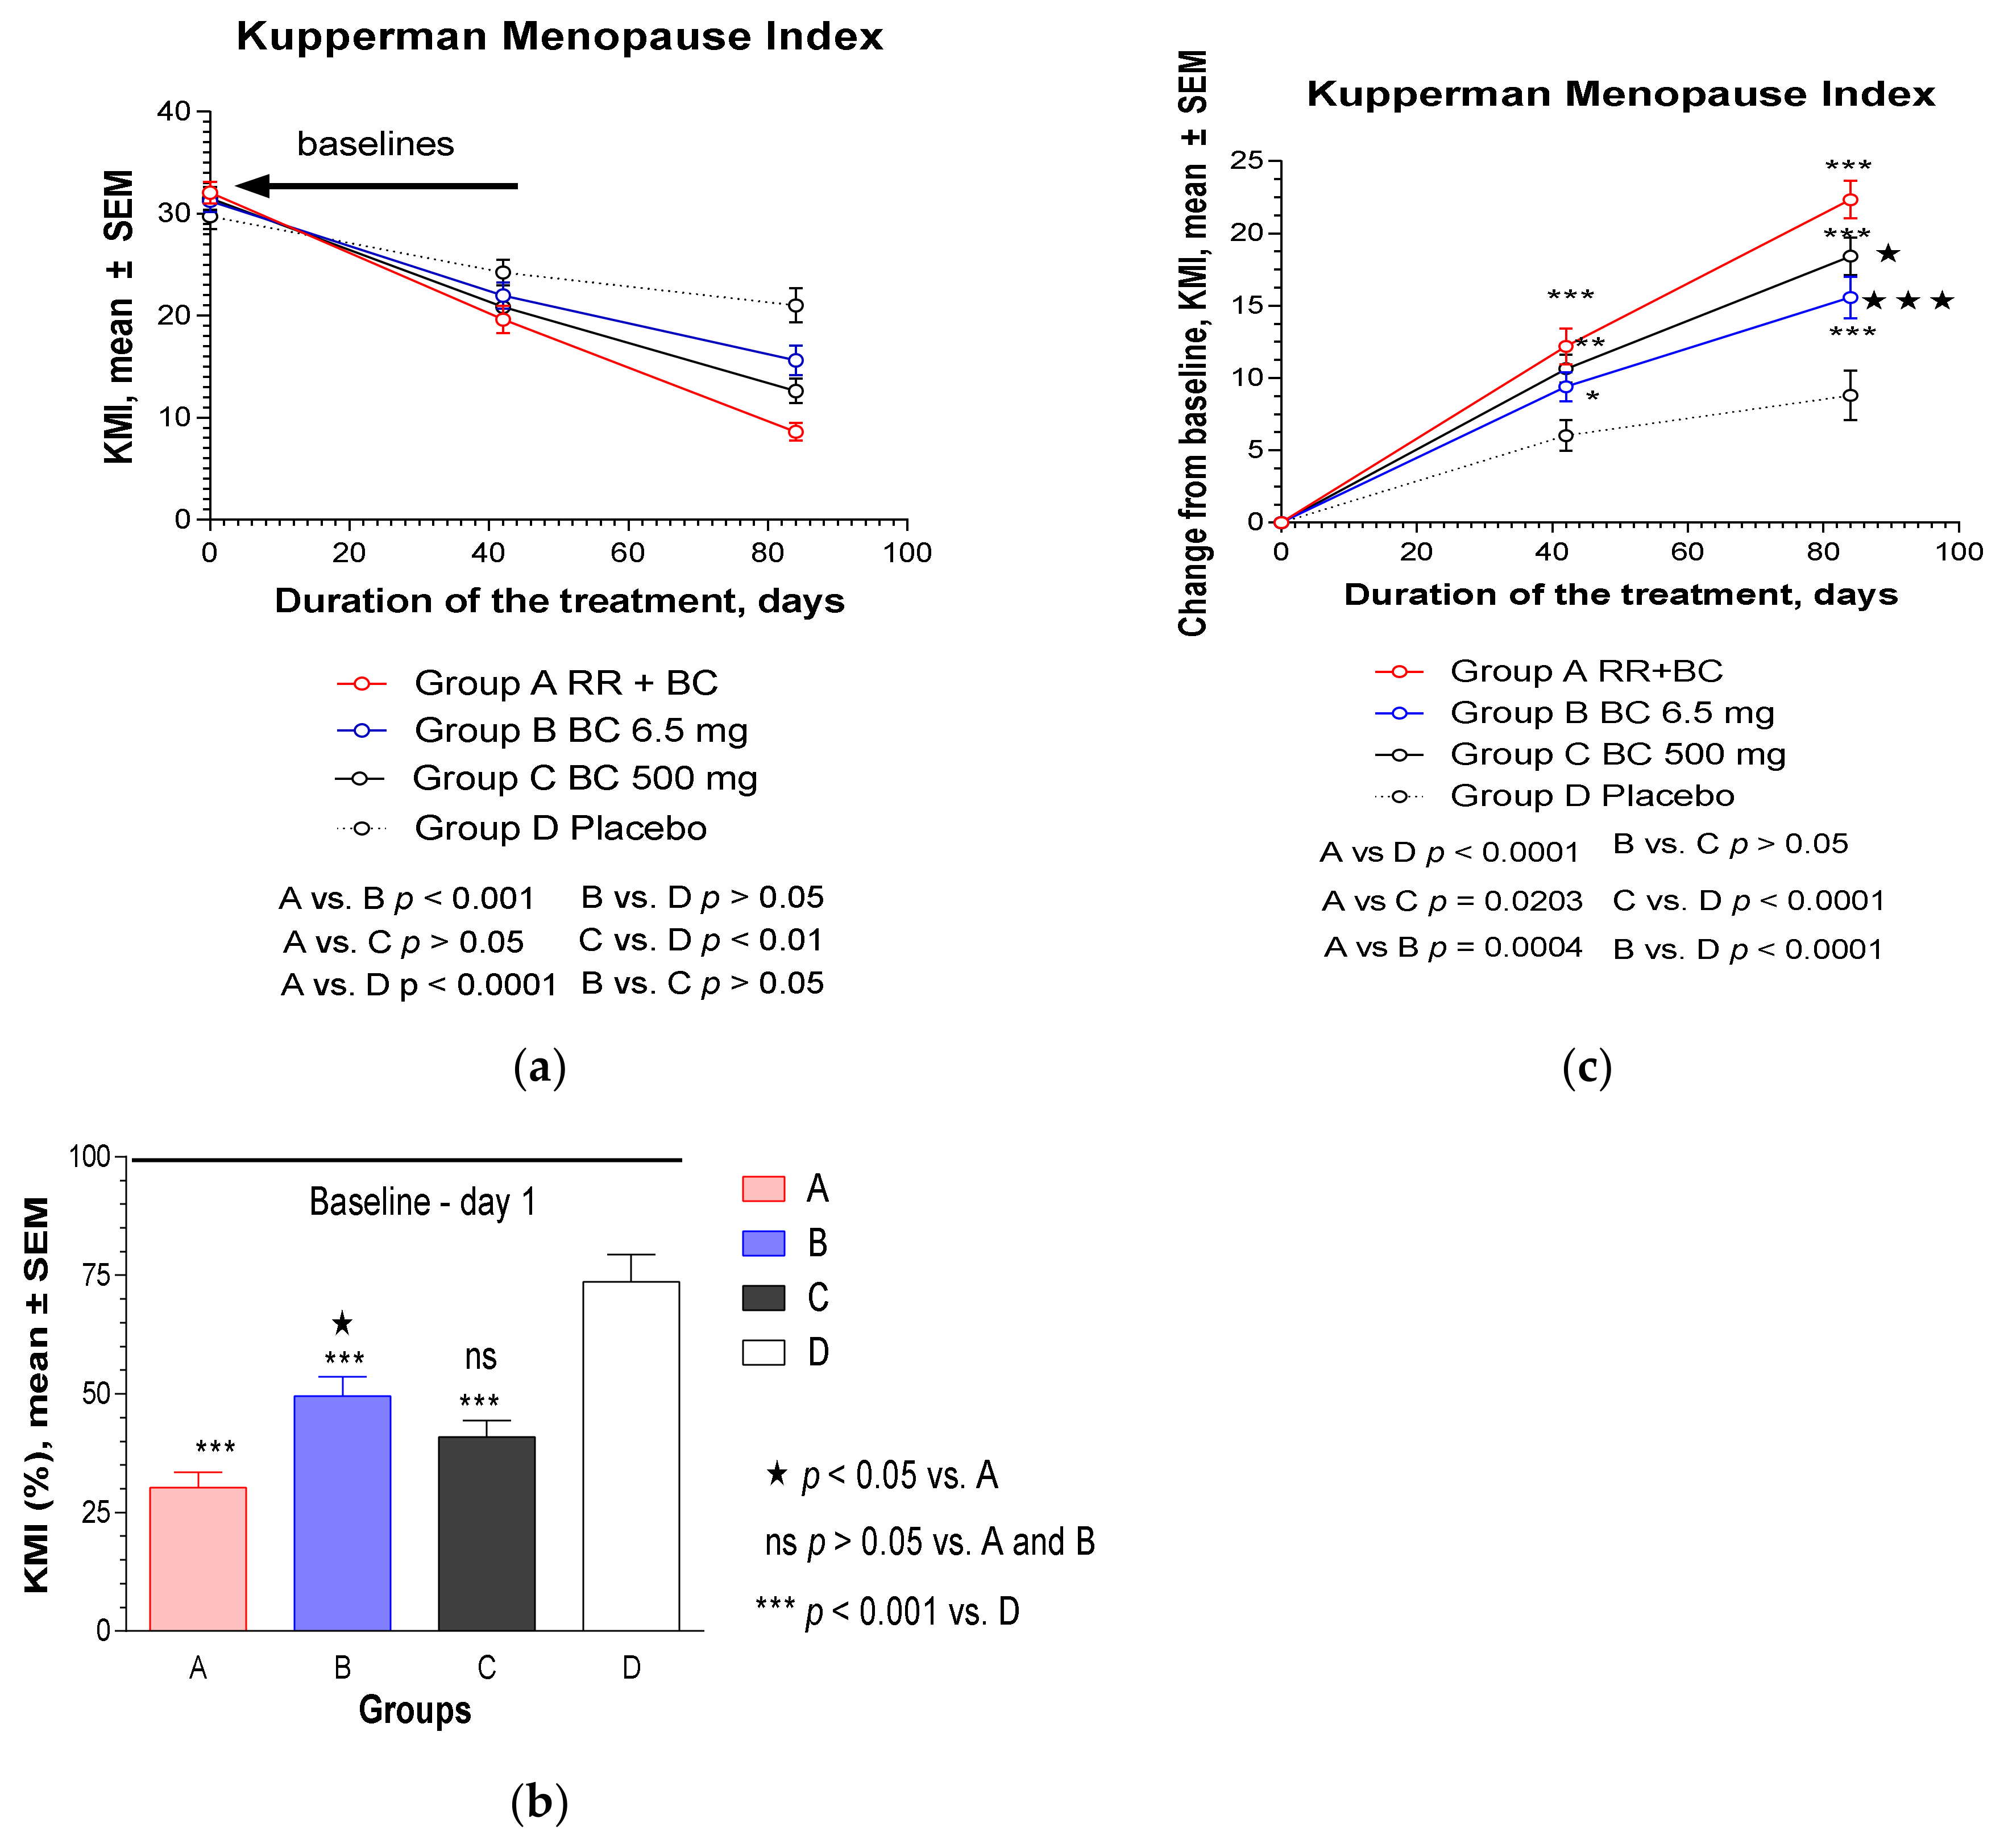
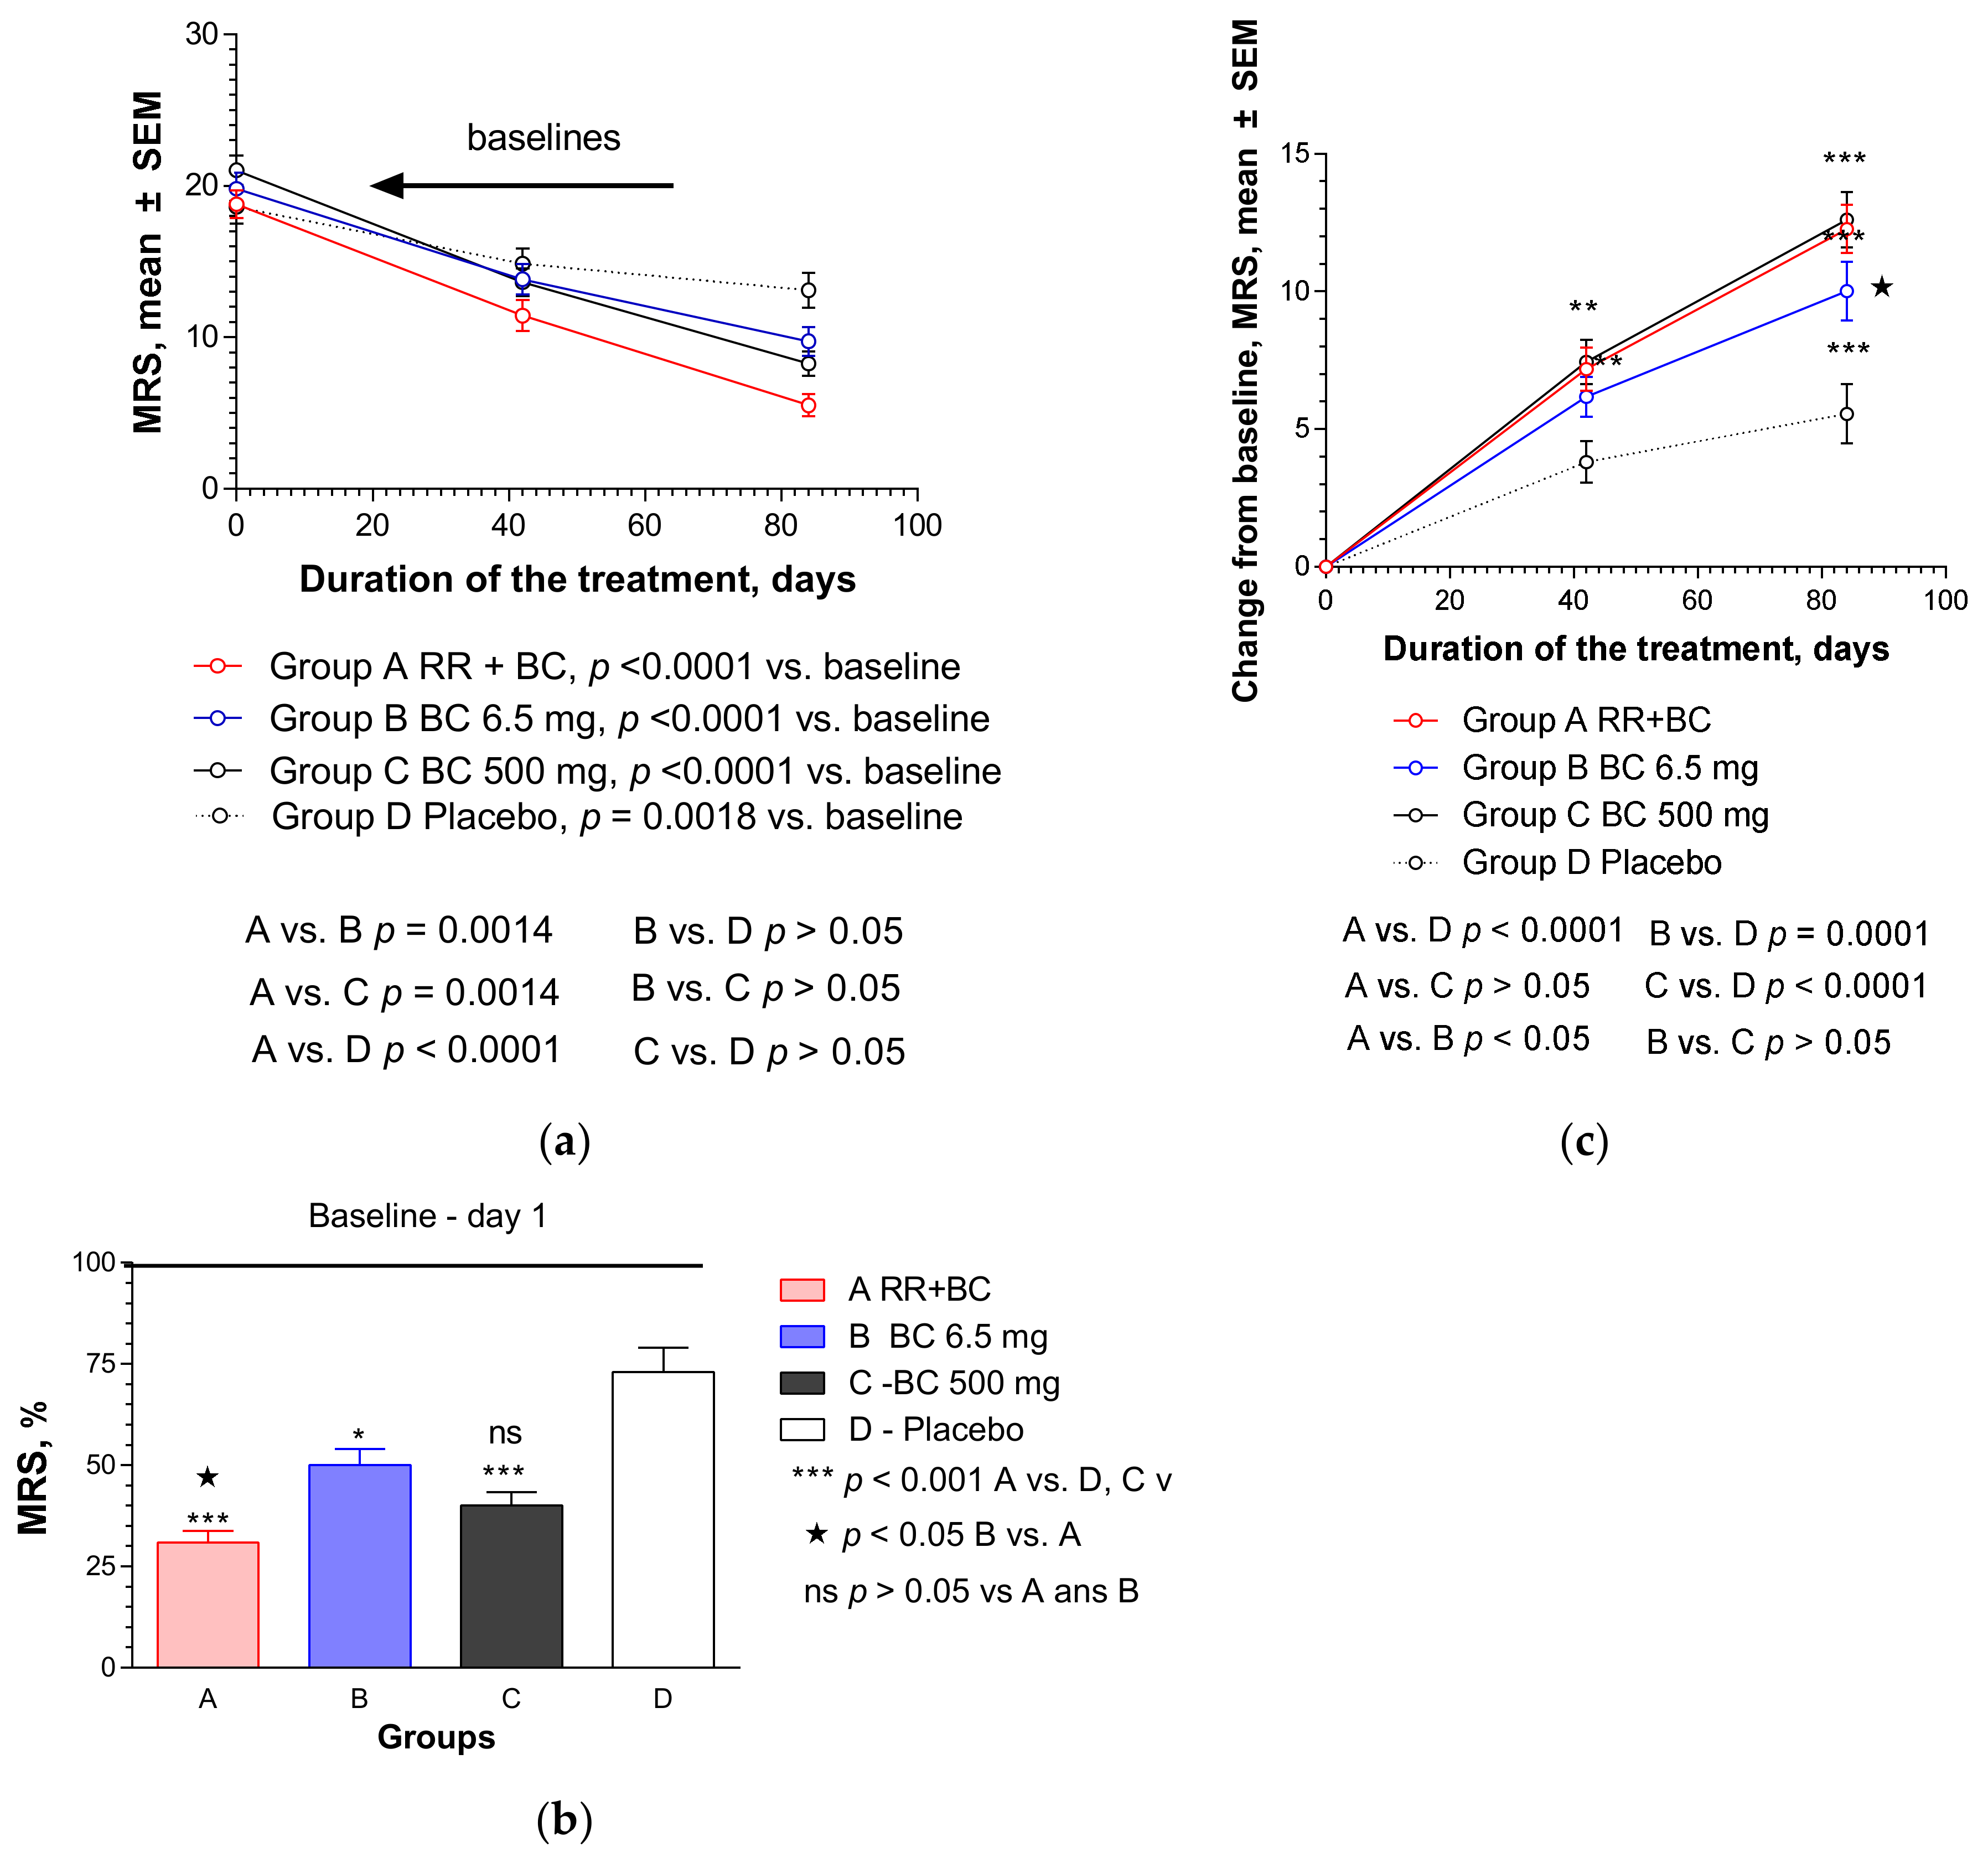
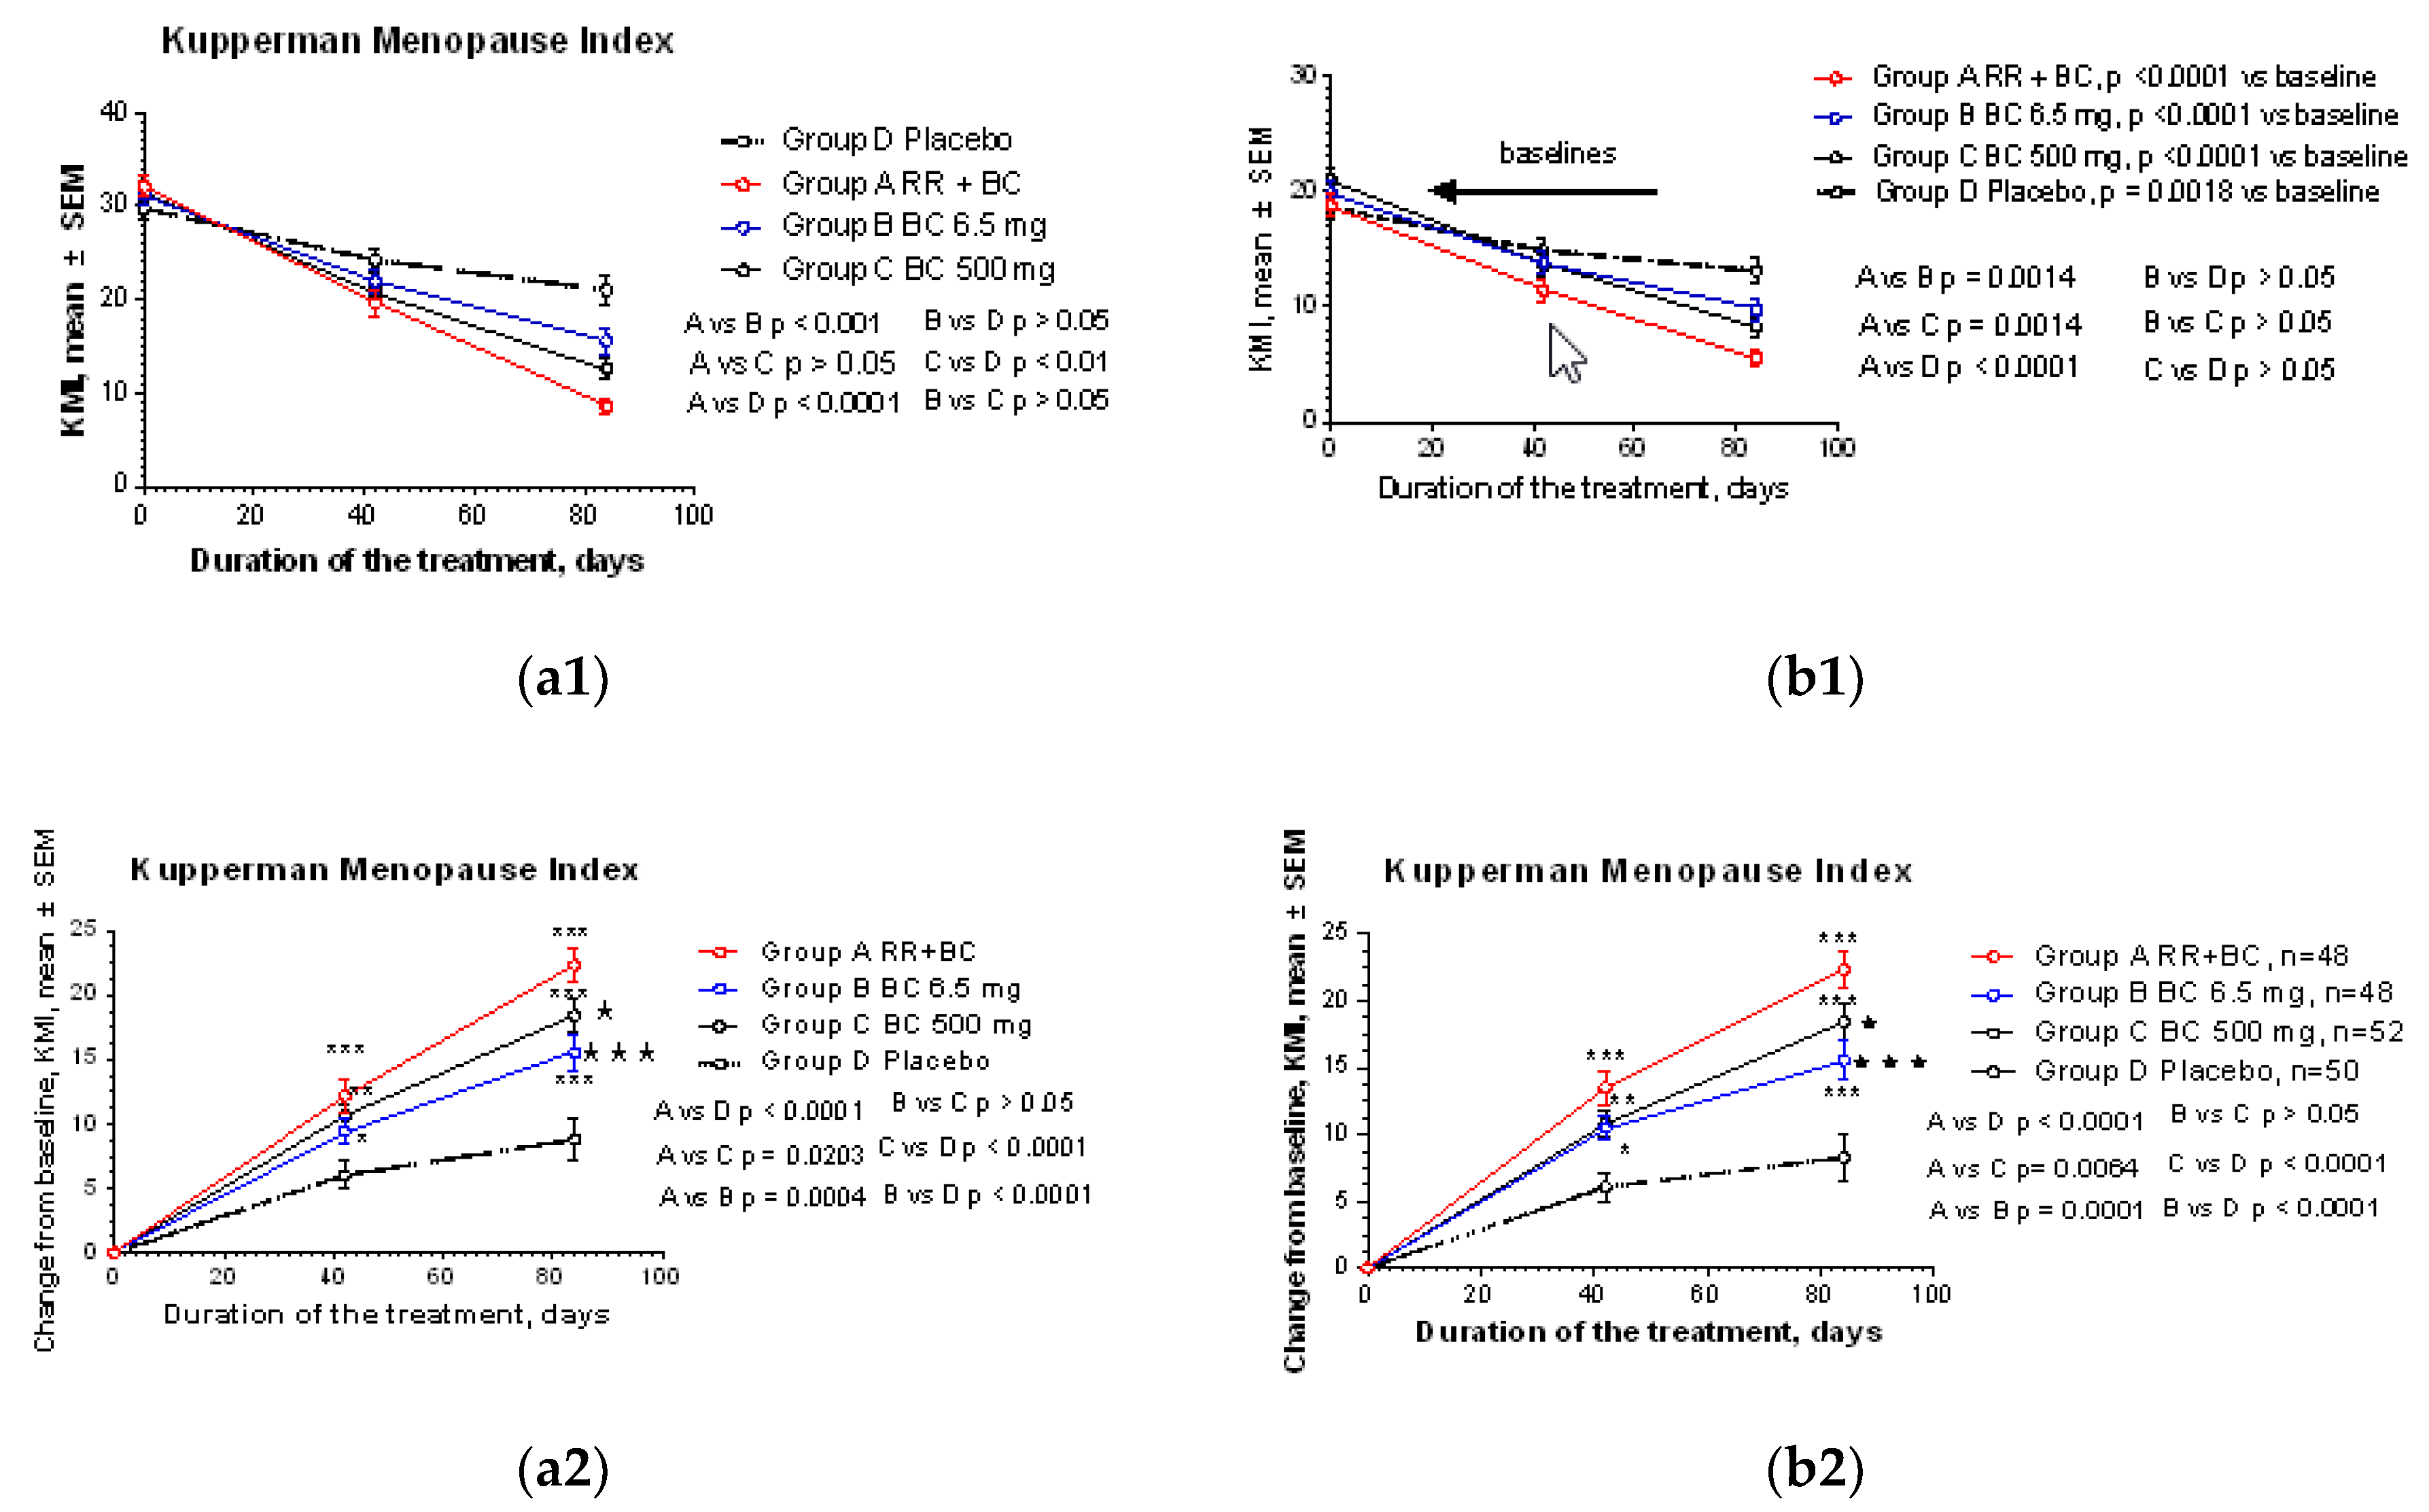
2.2.1. Primary Efficacy Endpoint
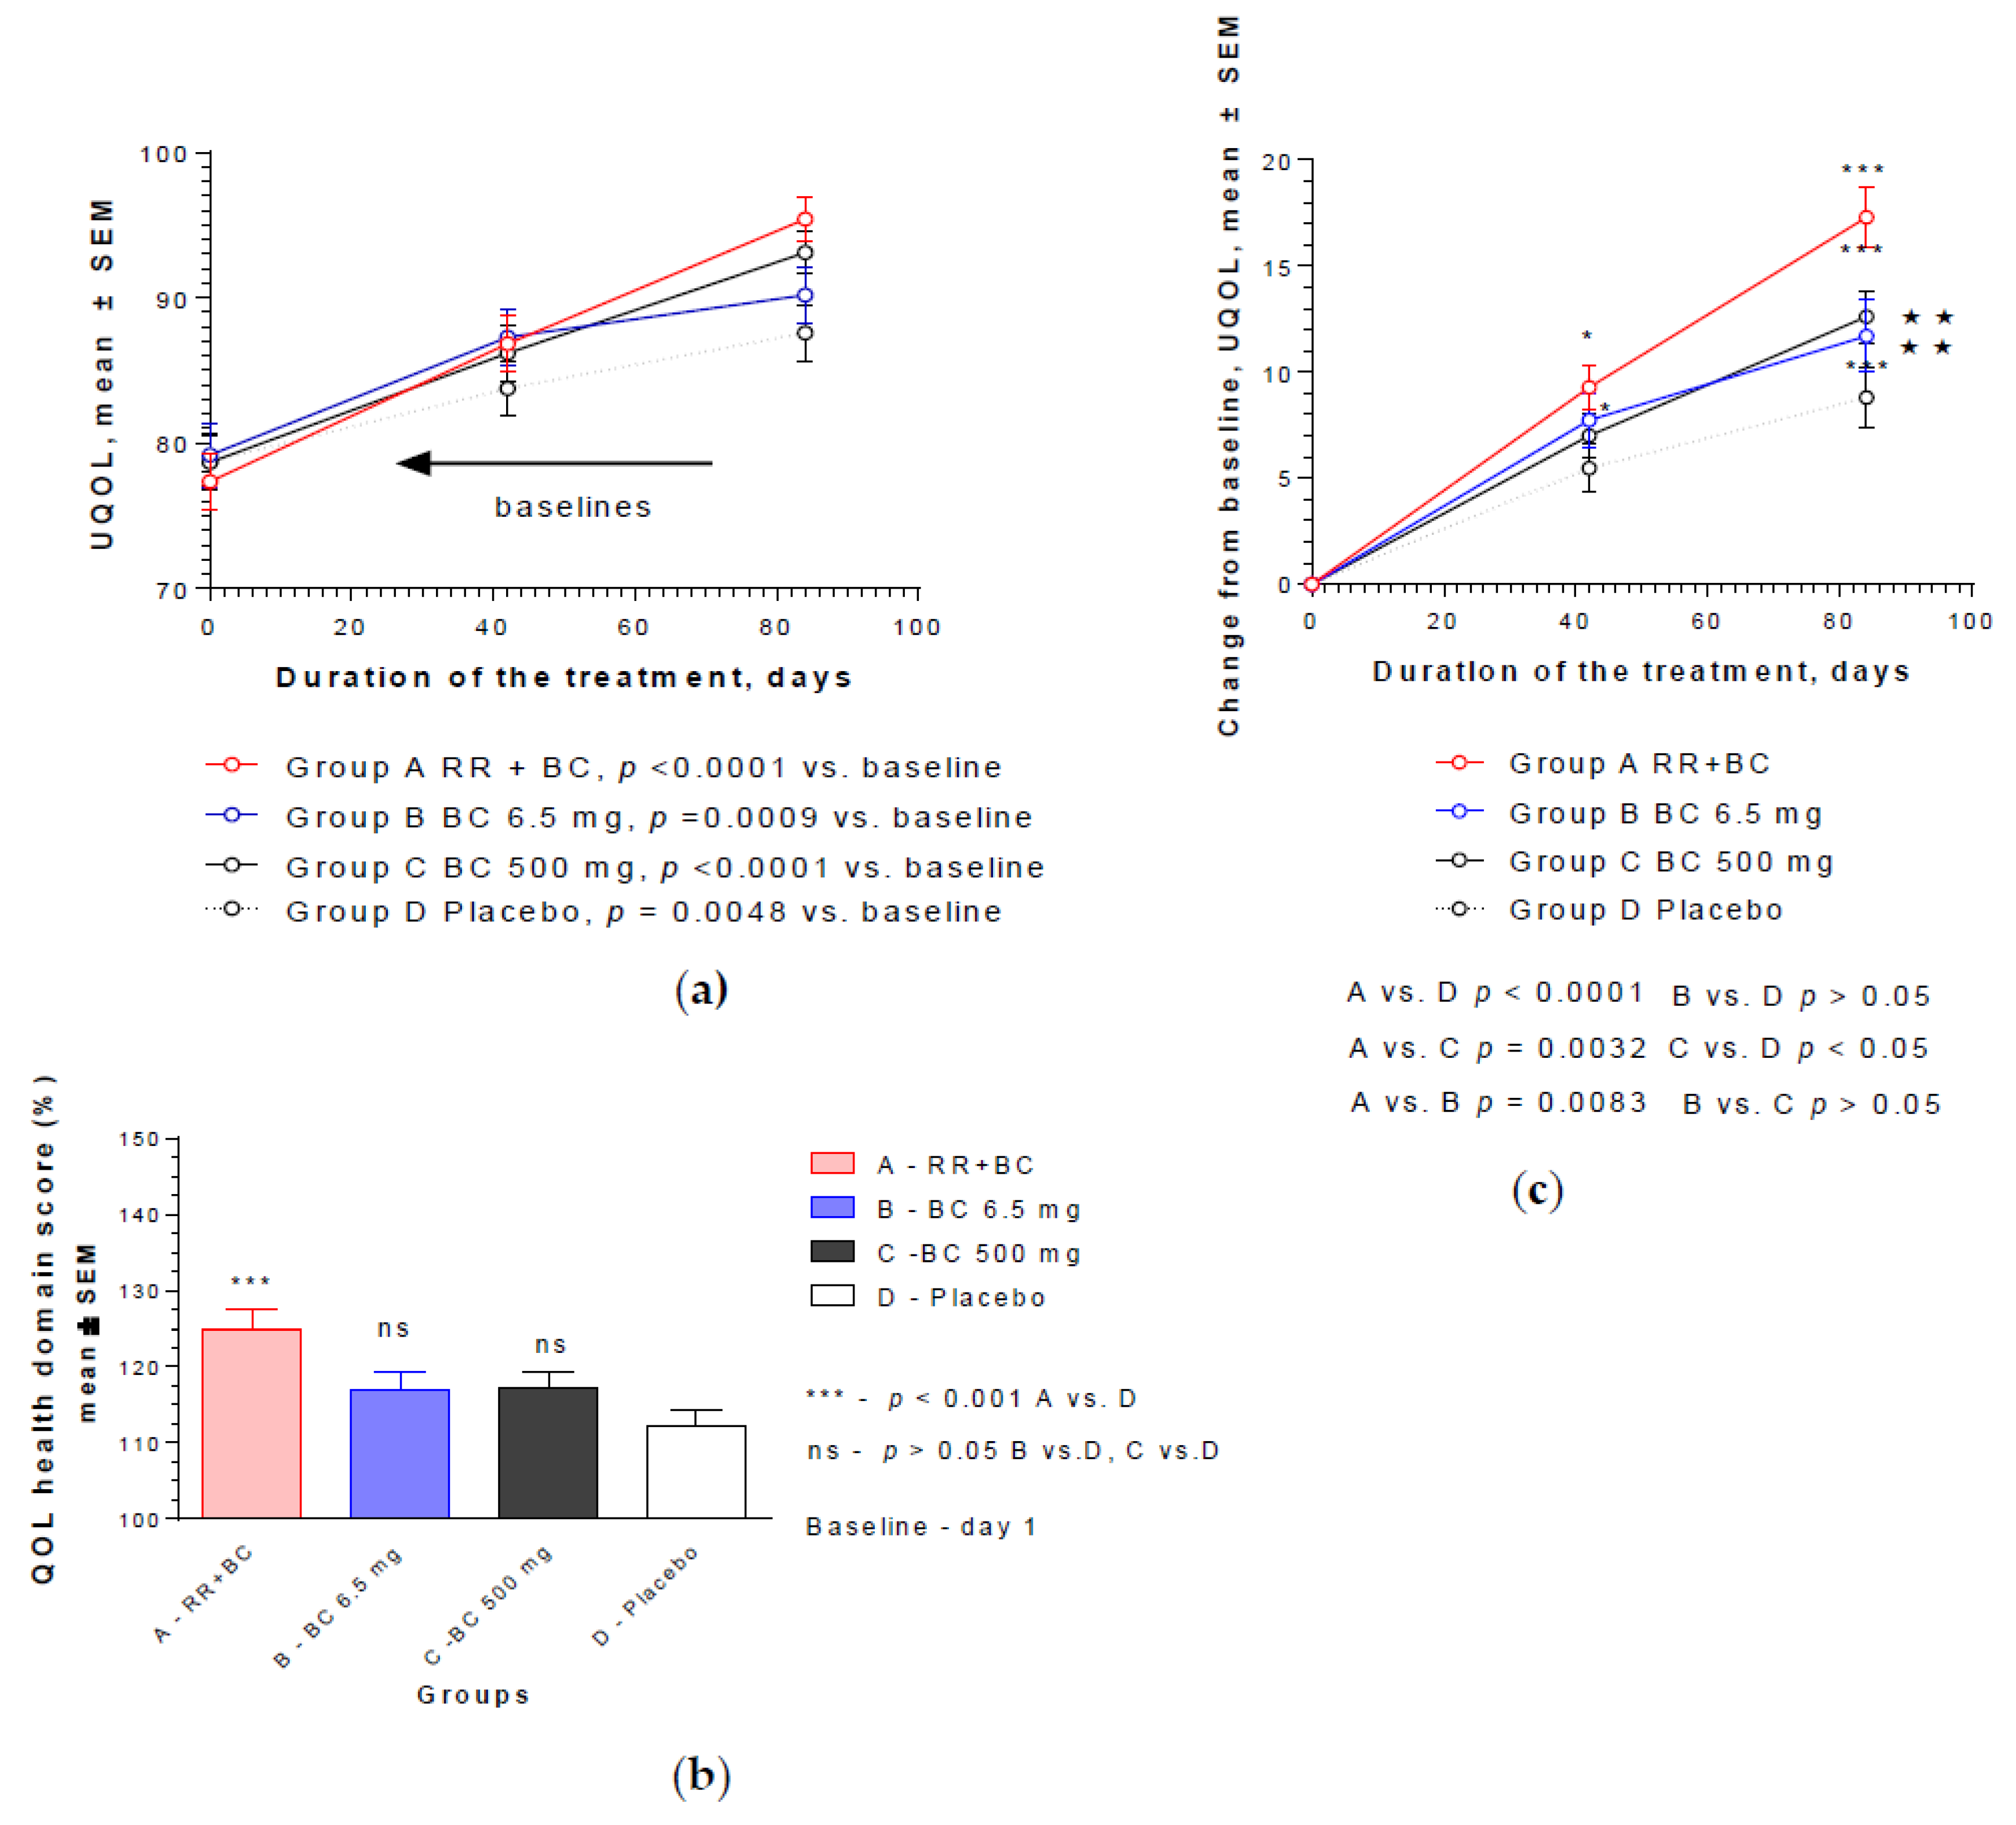
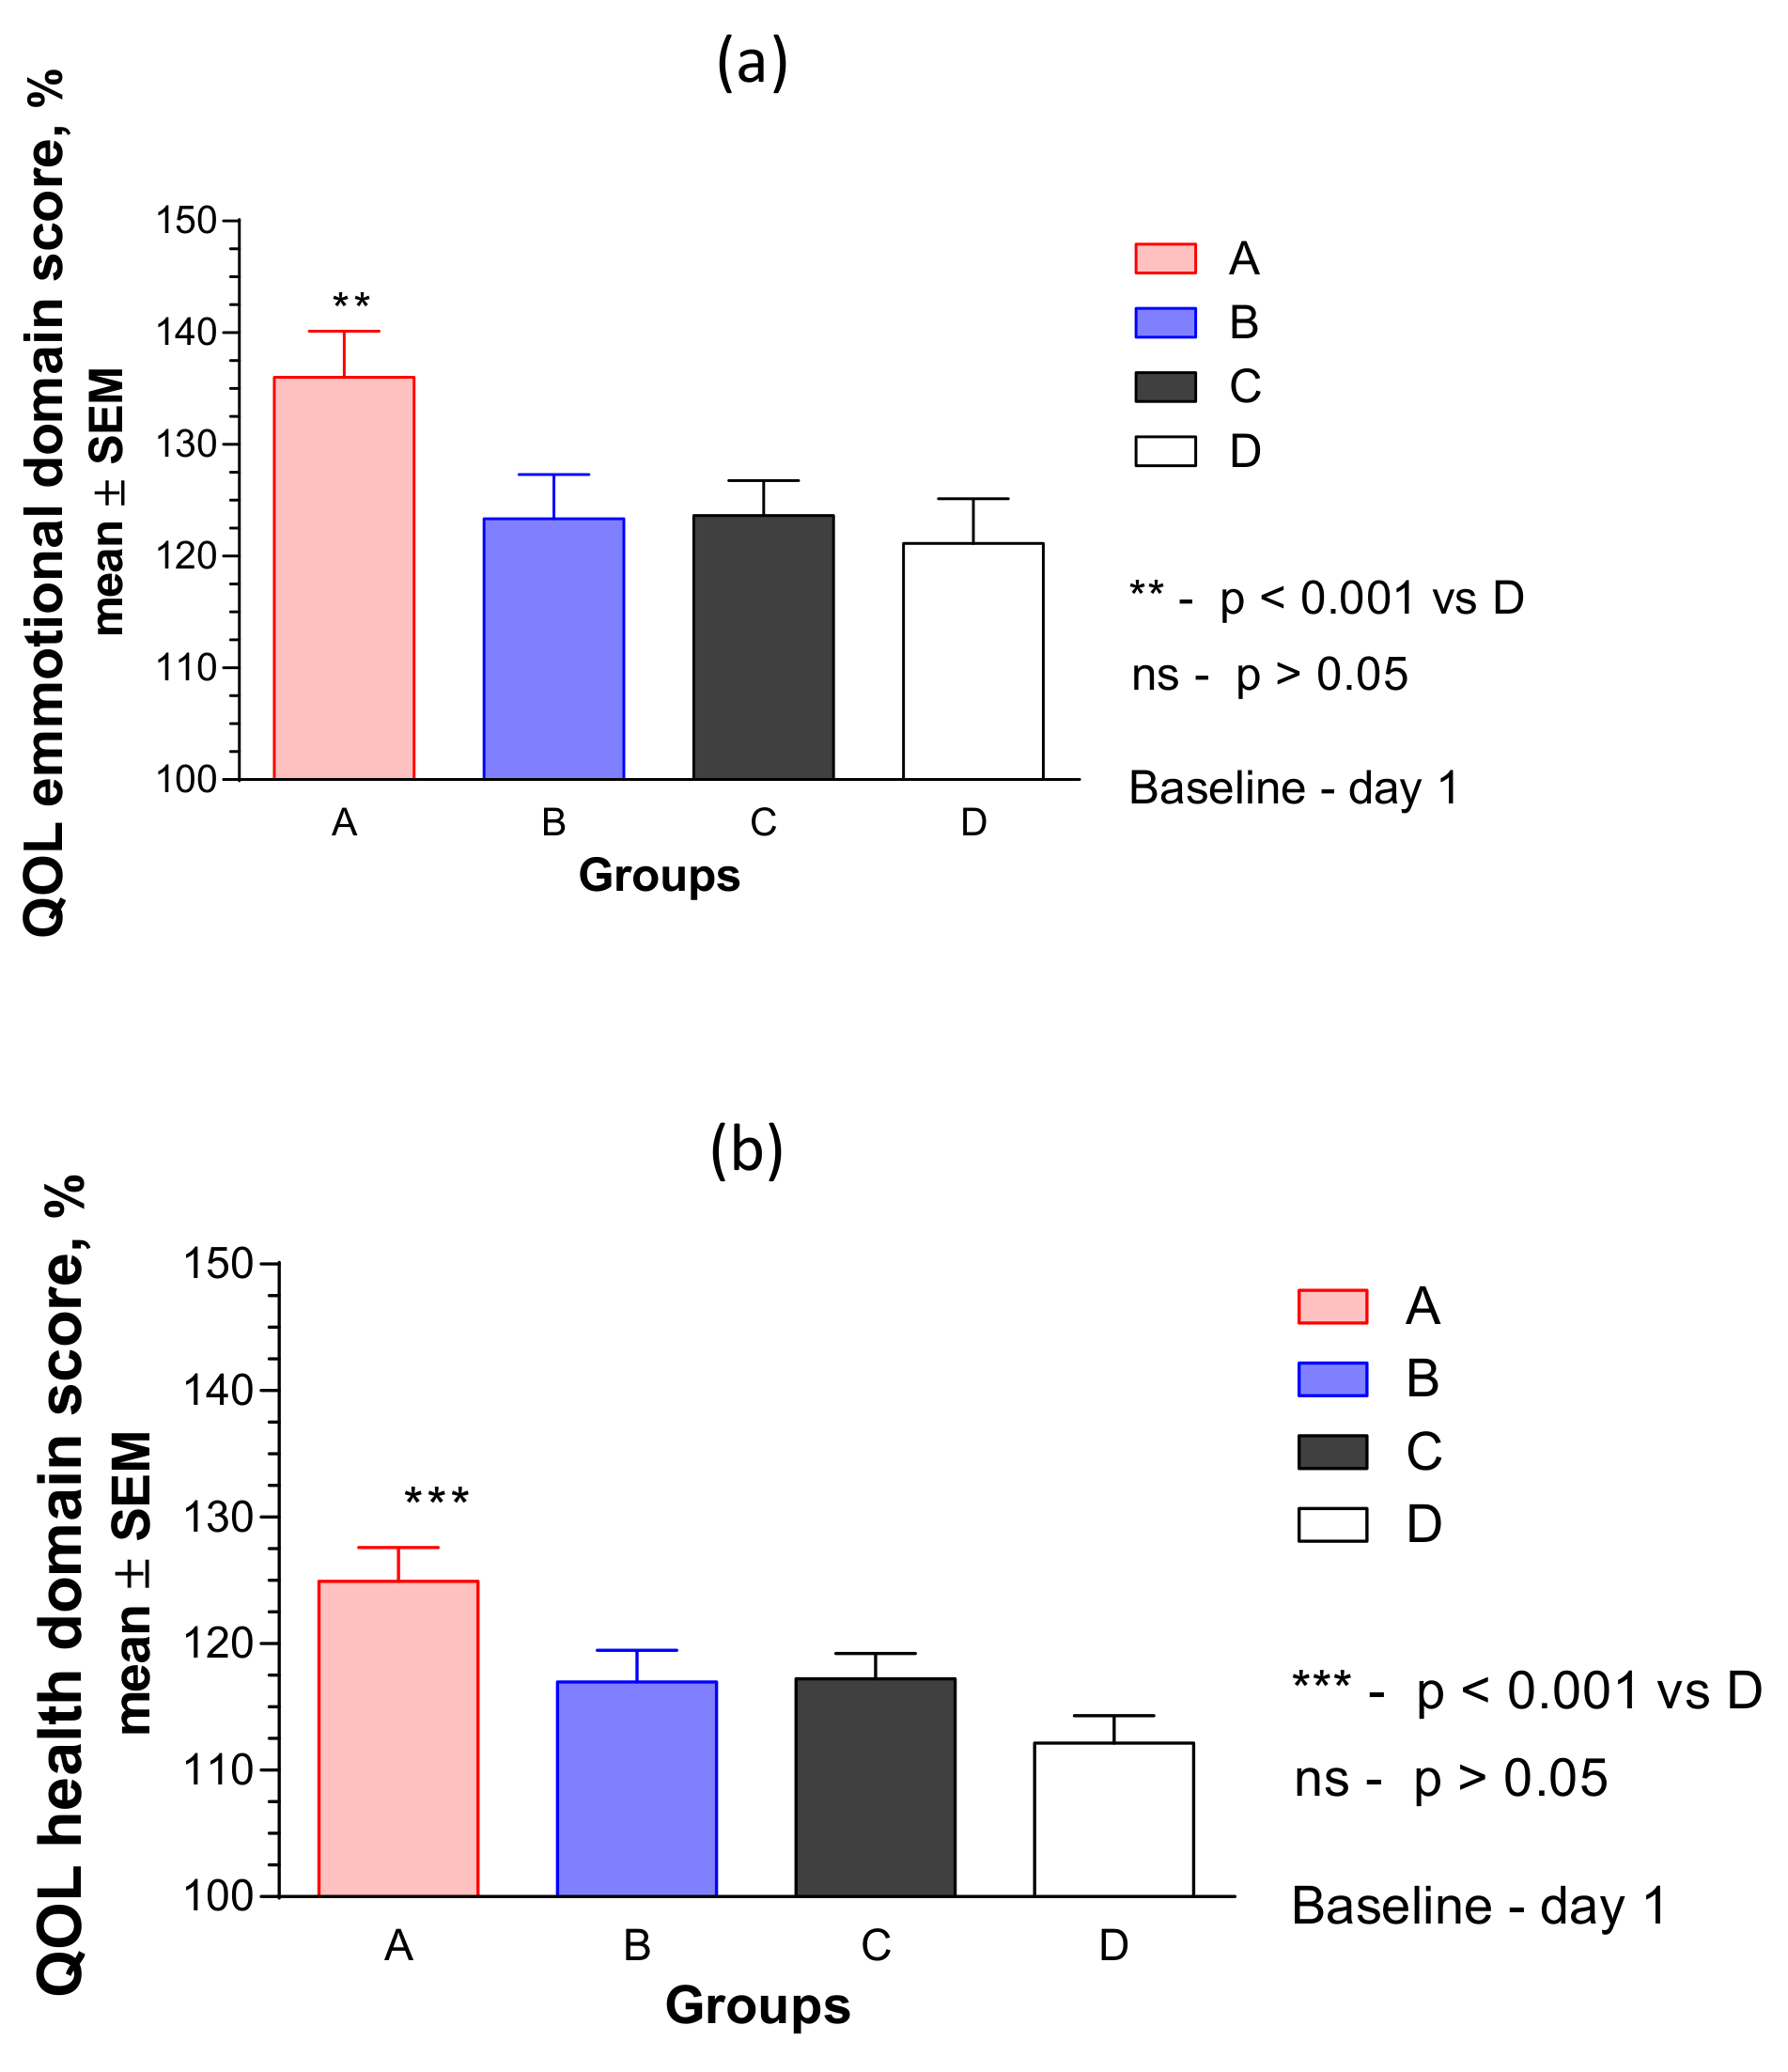
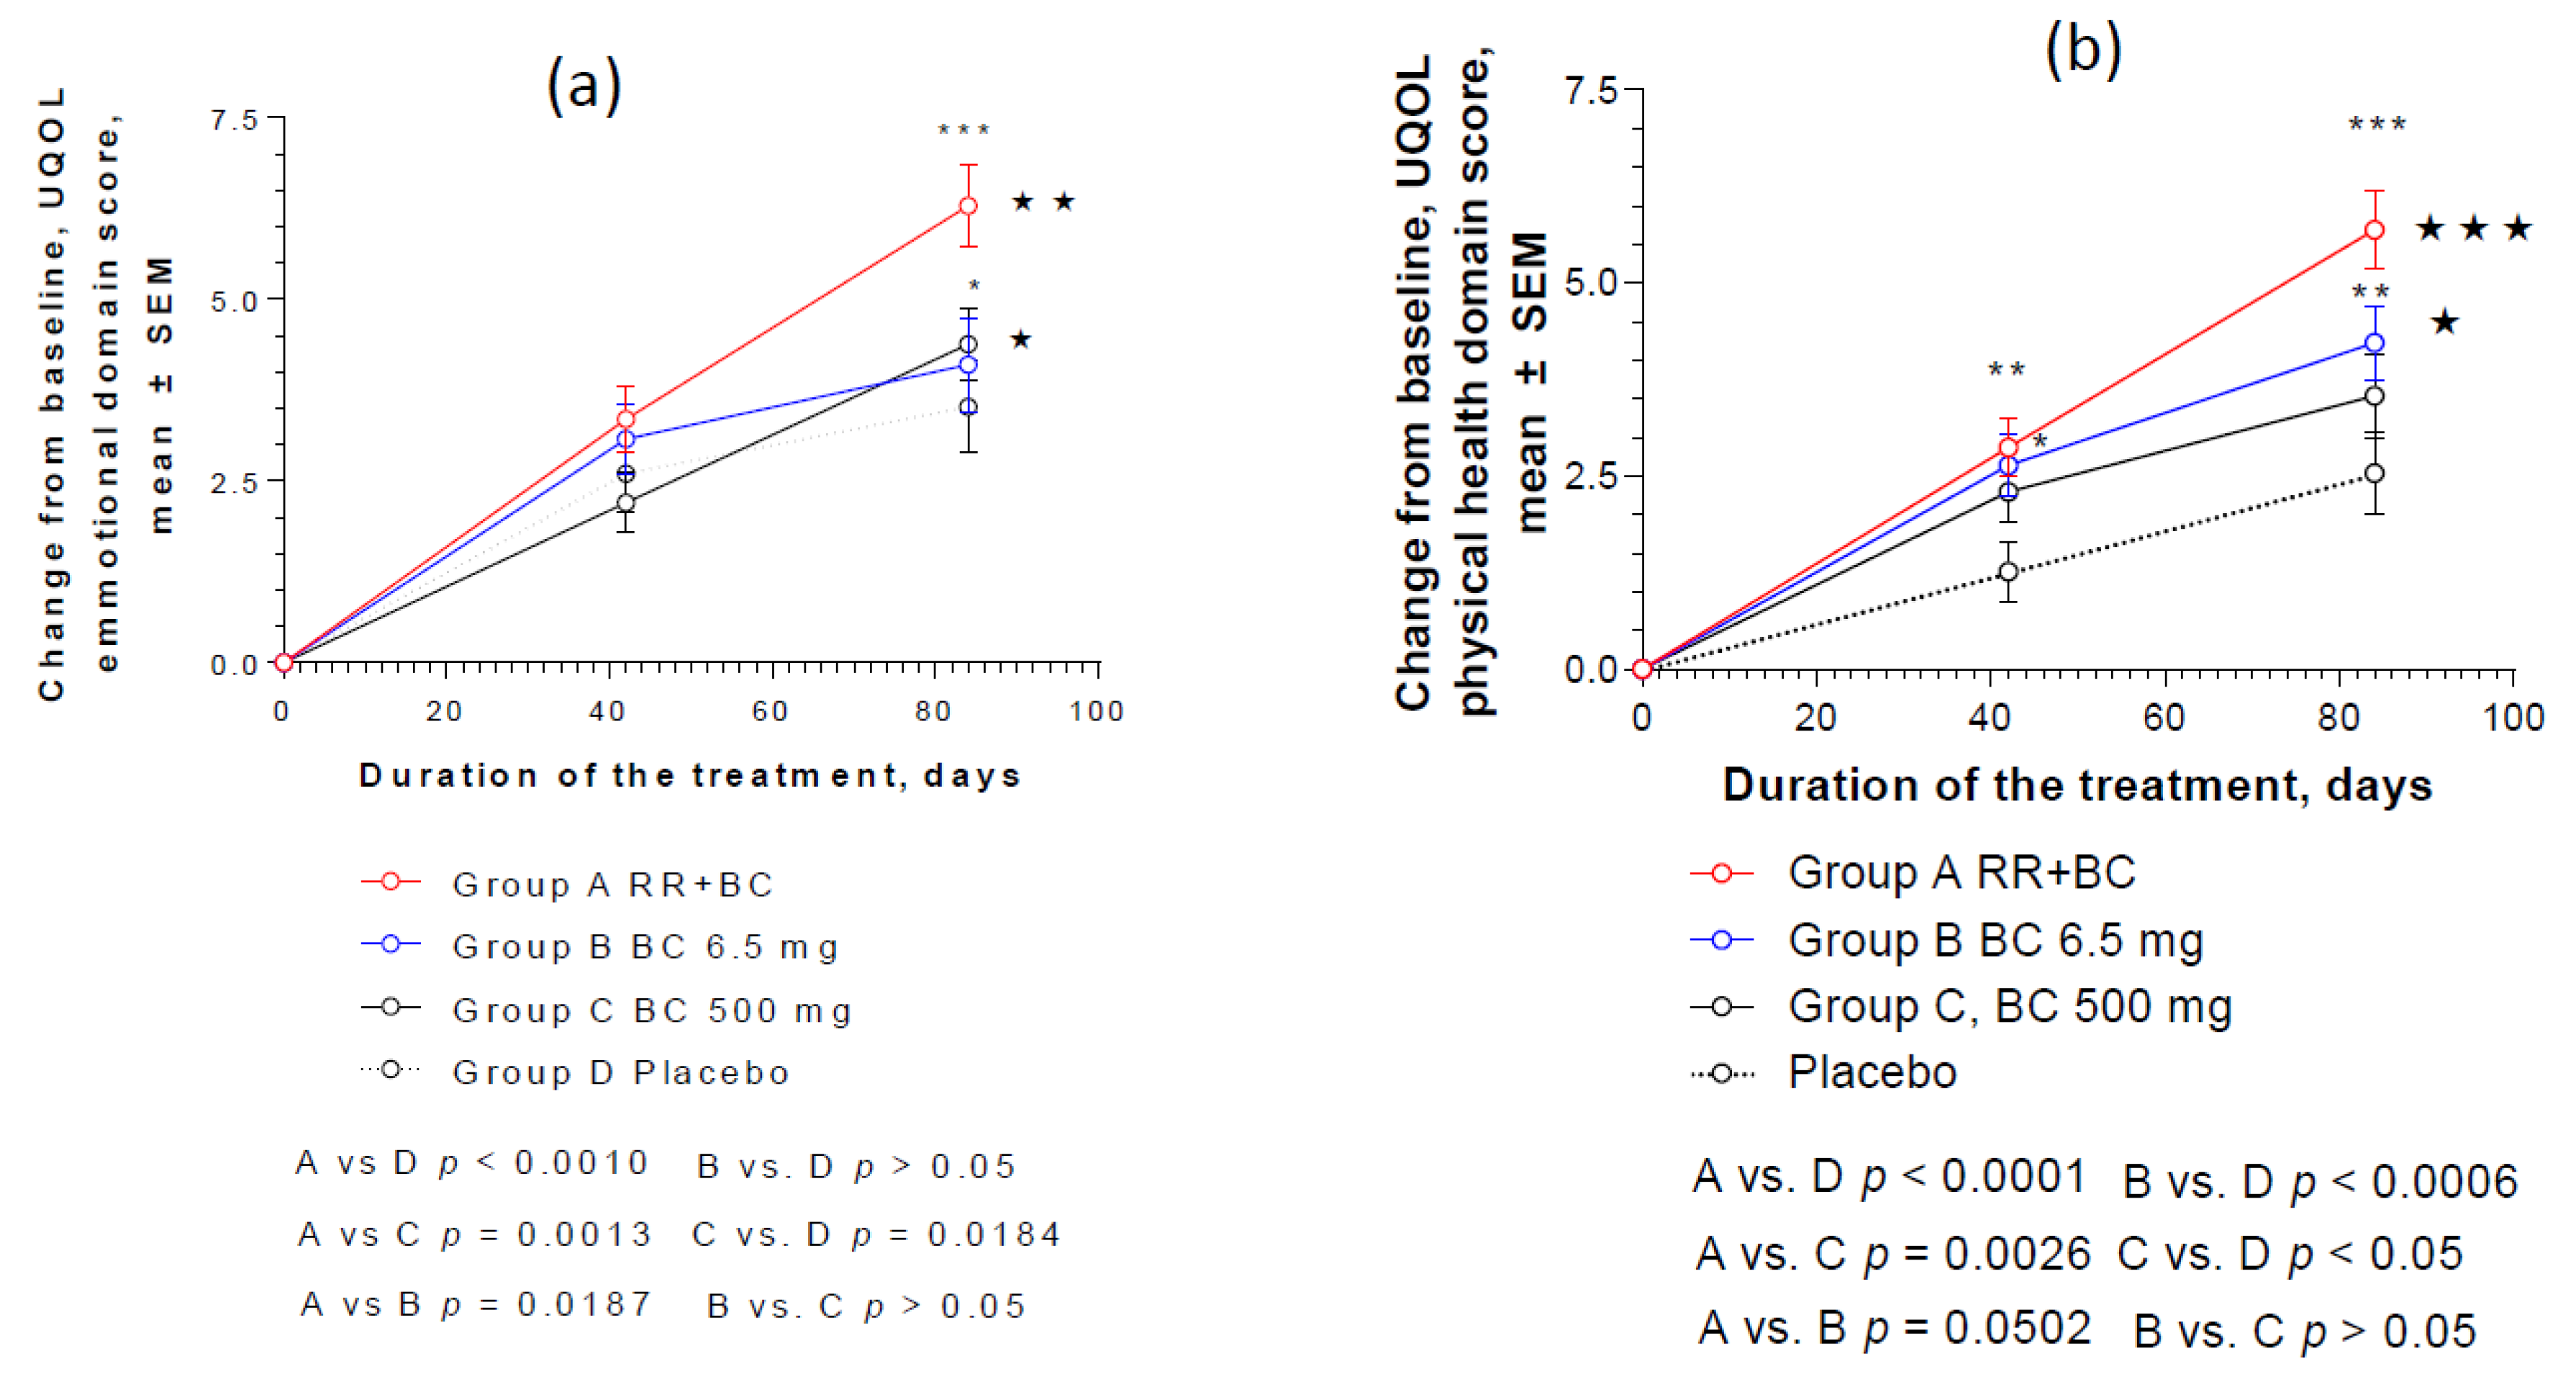
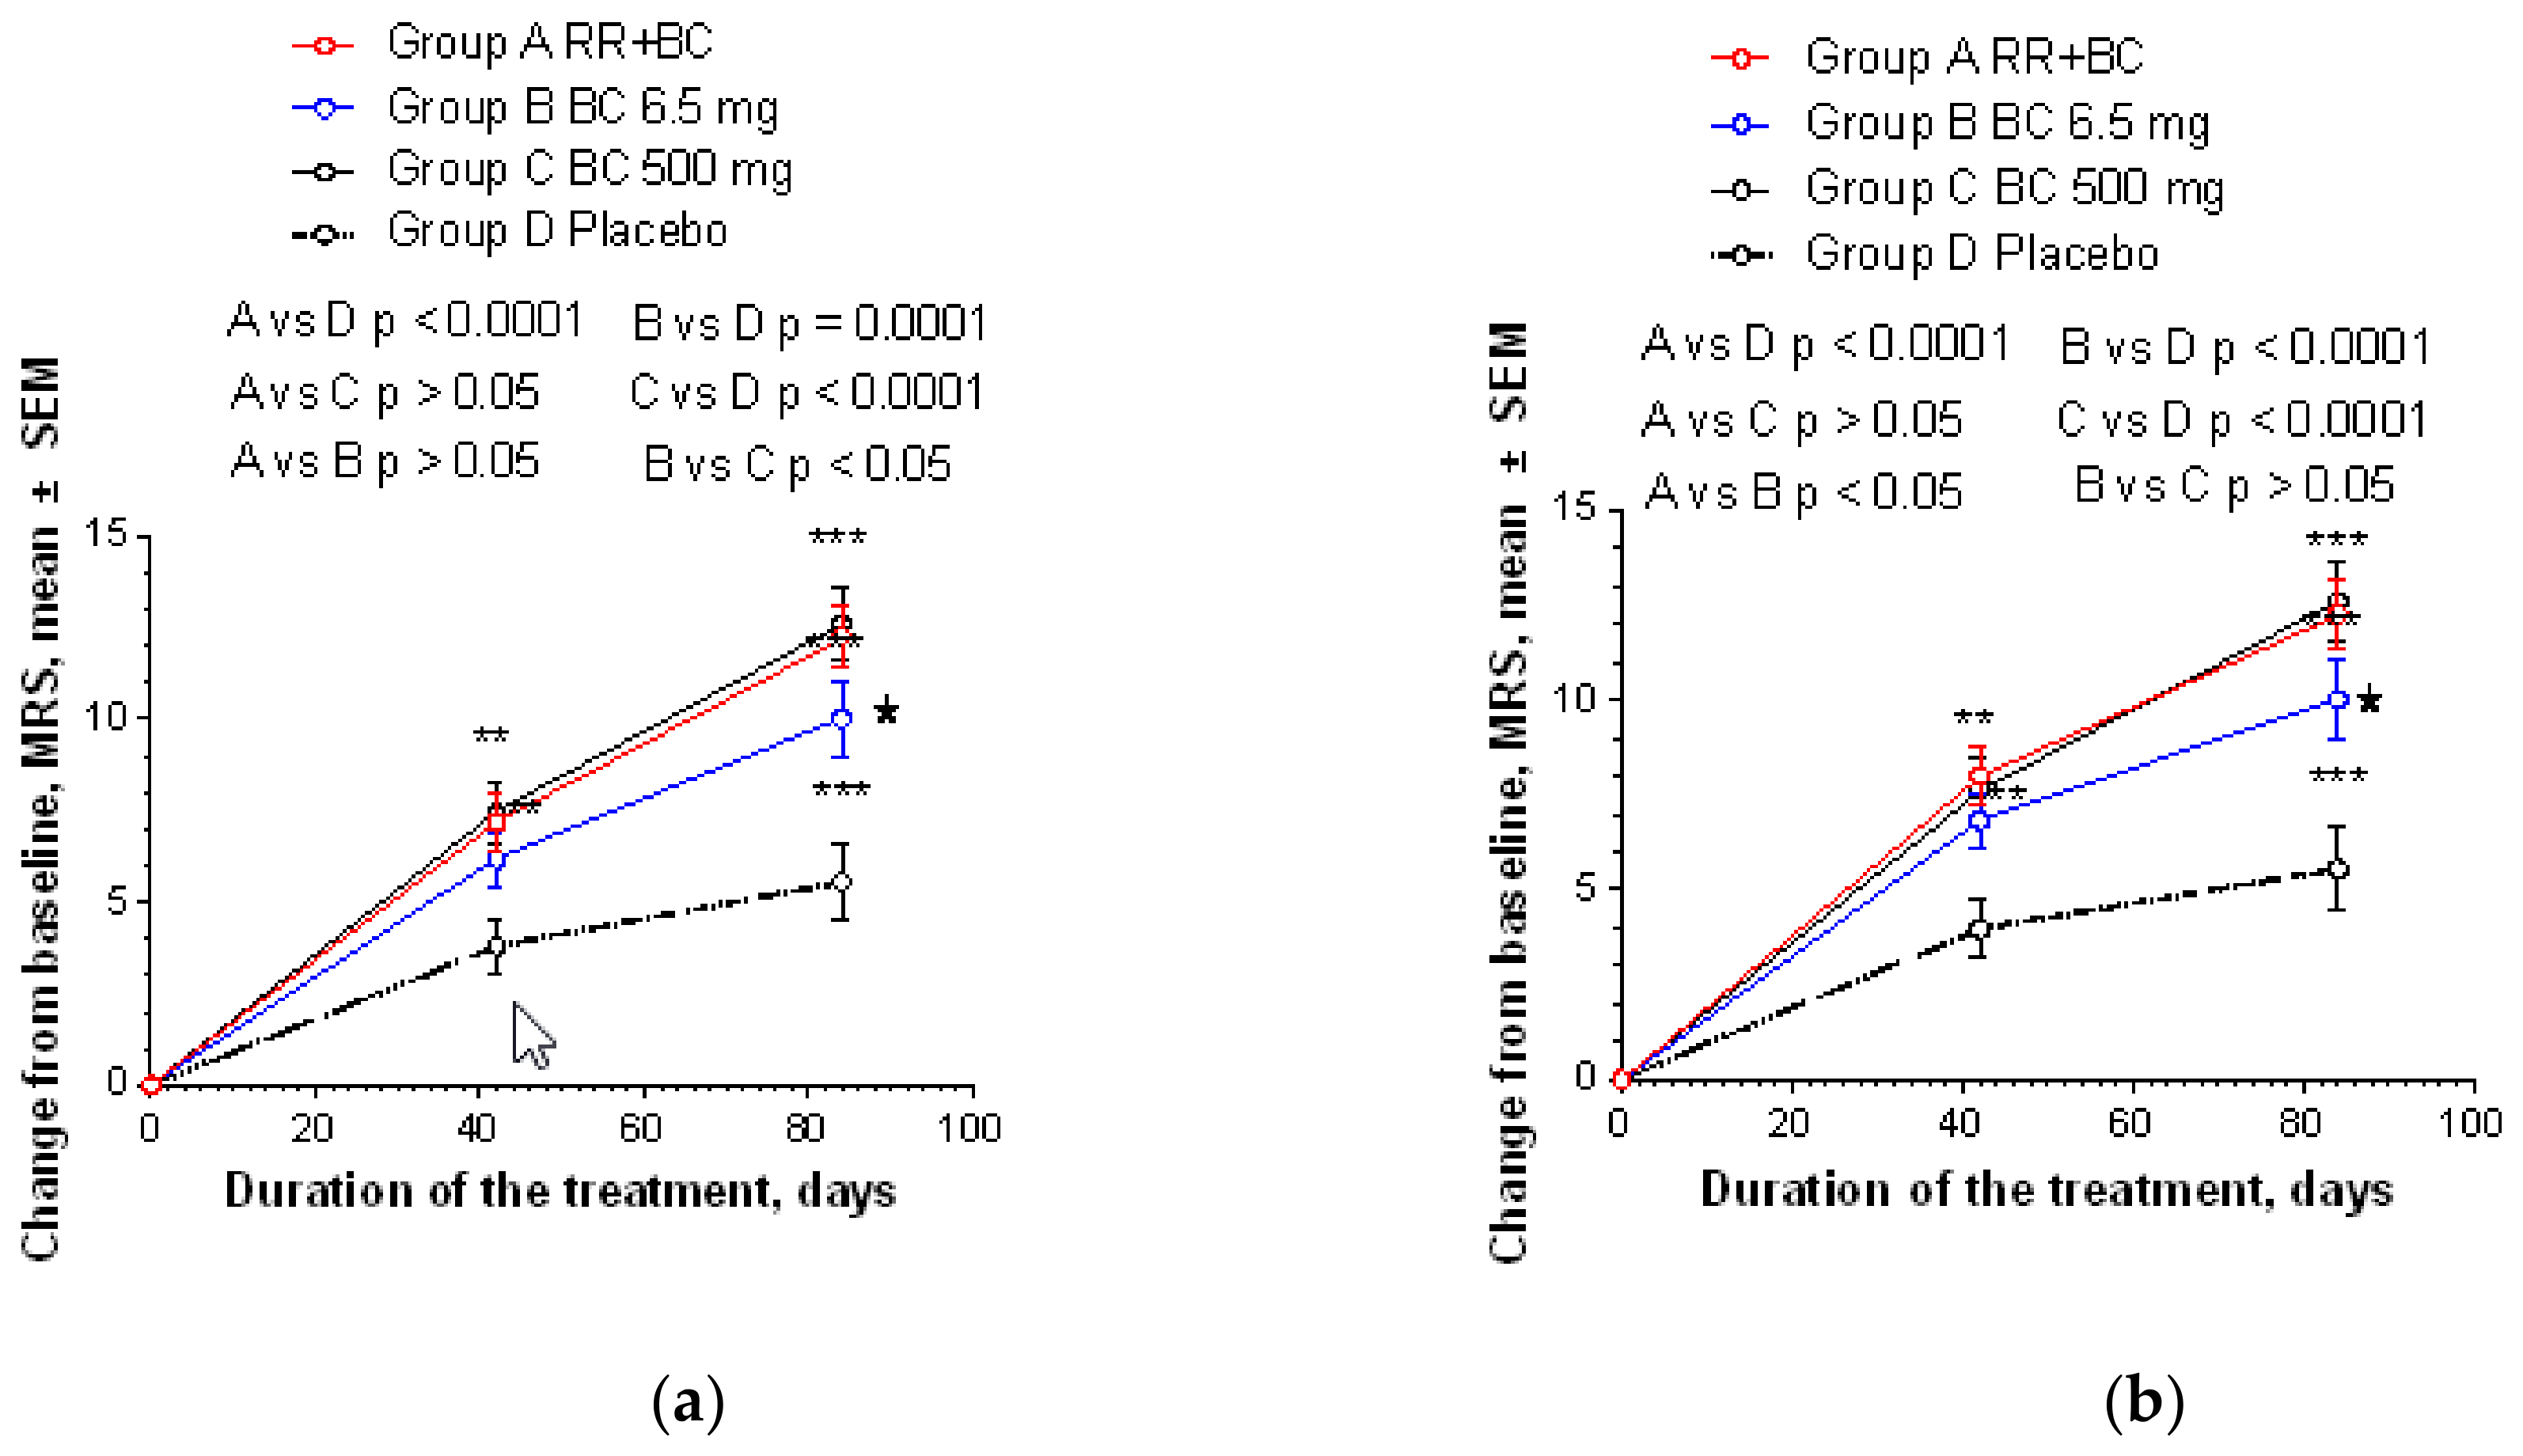
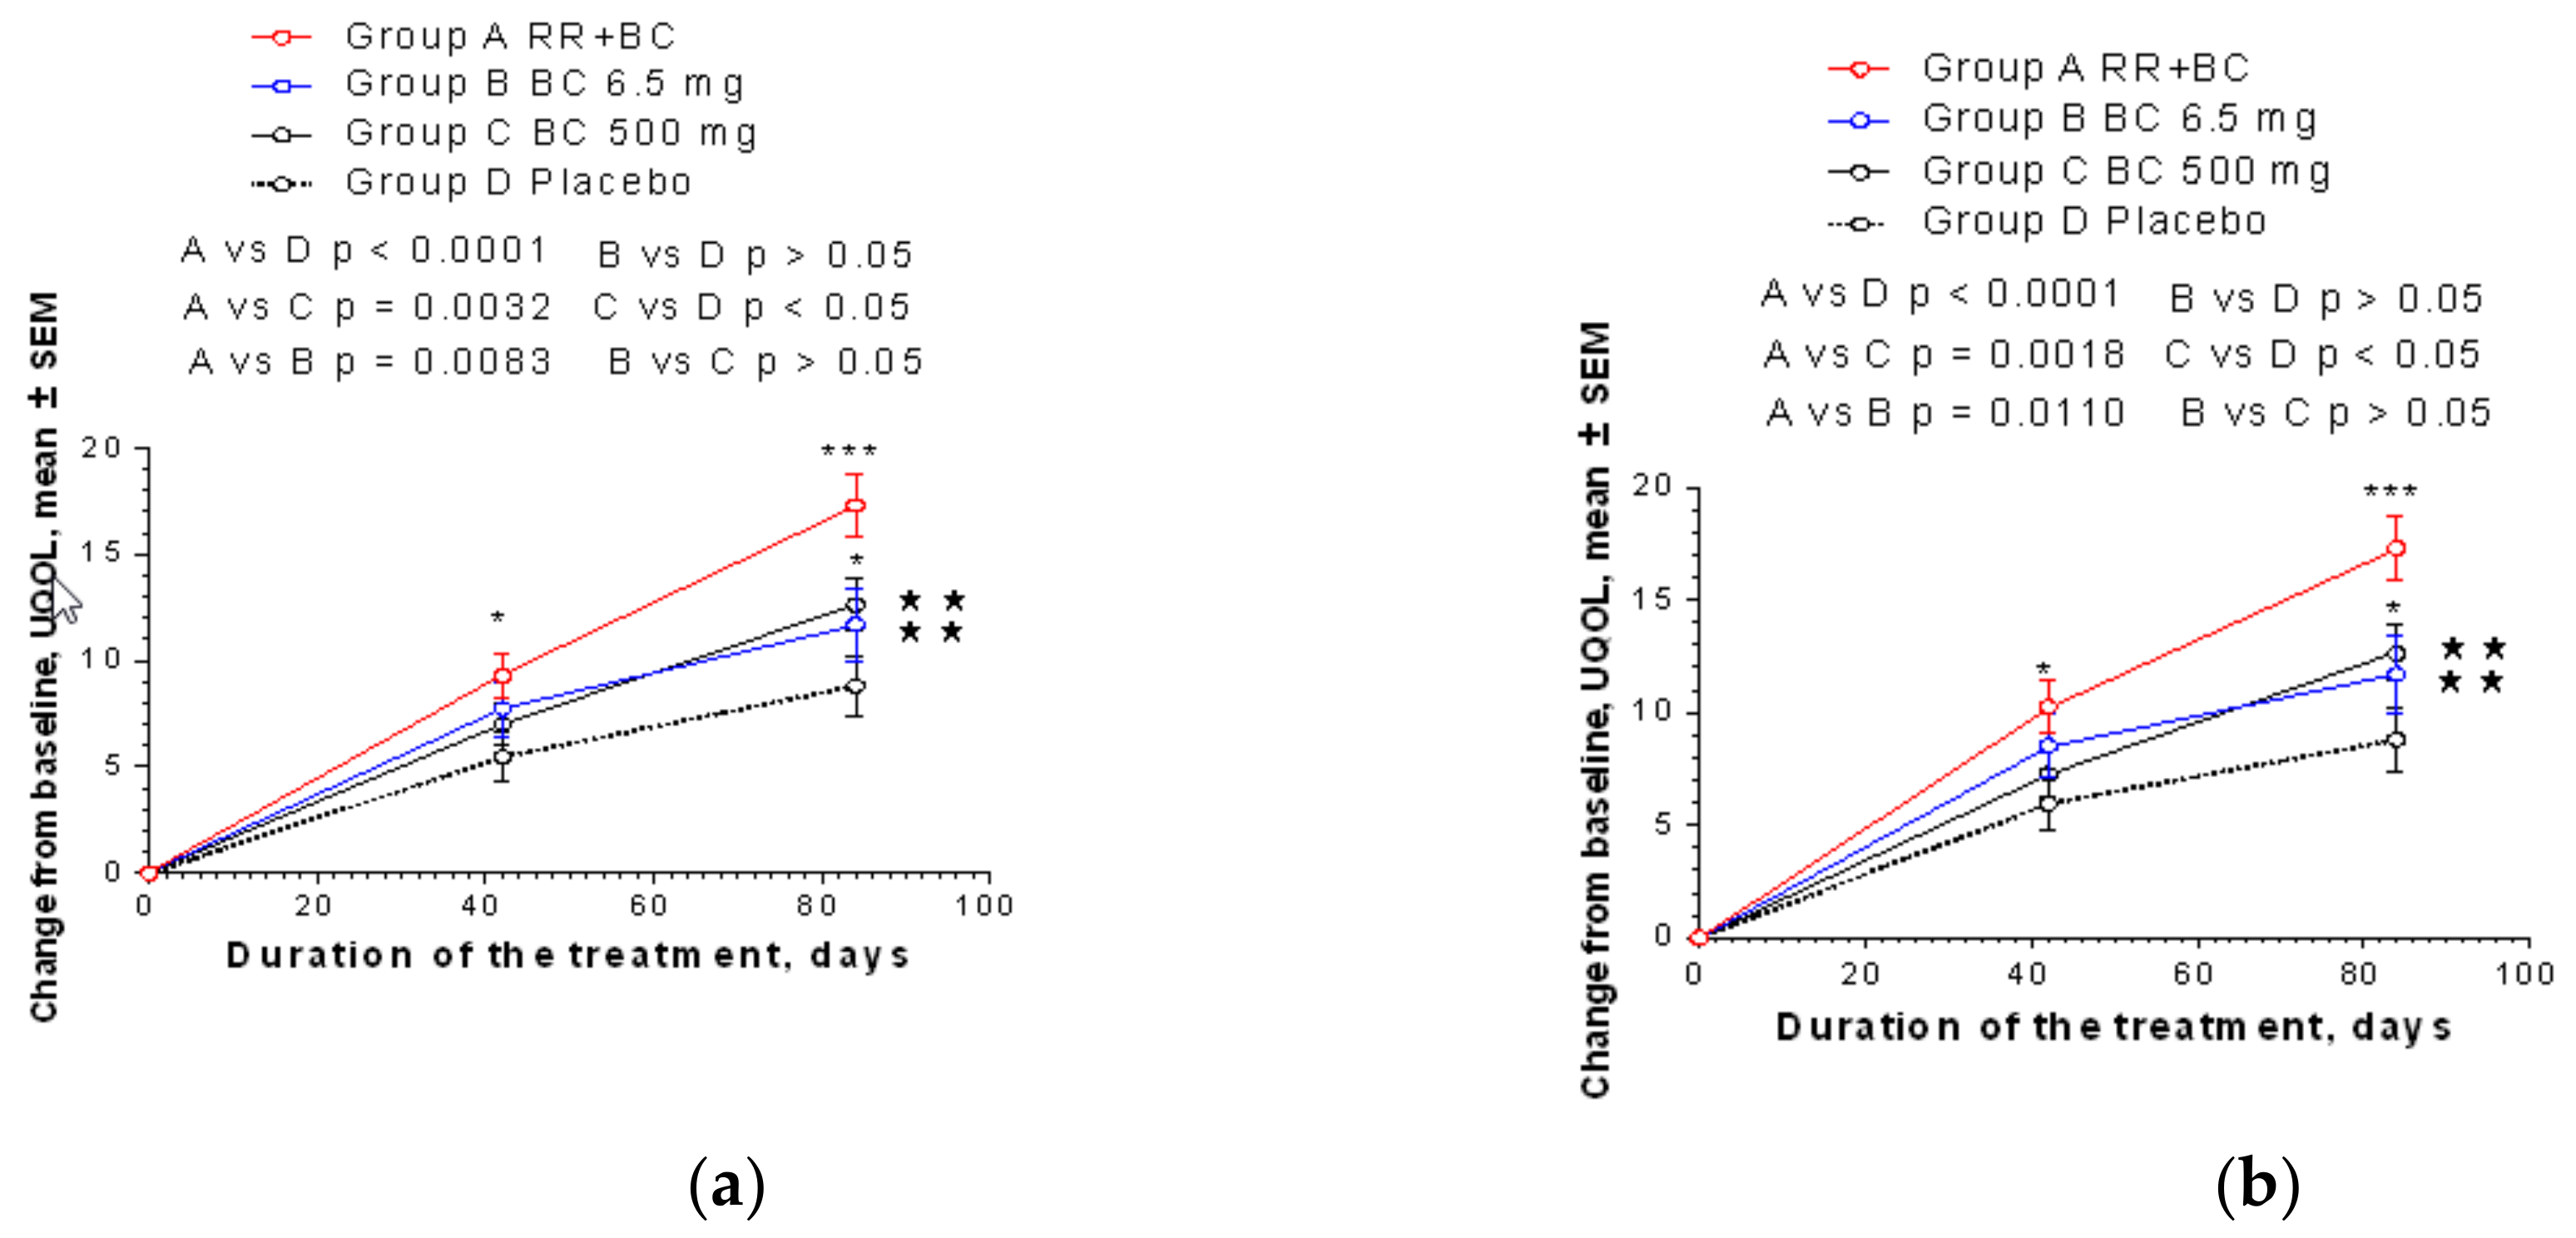
2.2.2. Secondary Efficacy Endpoint
2.3. Safety Evaluation
2.3.1. Extent of Exposure
2.3.2. Adverse Events
3. Discussion
4. Materials and Methods
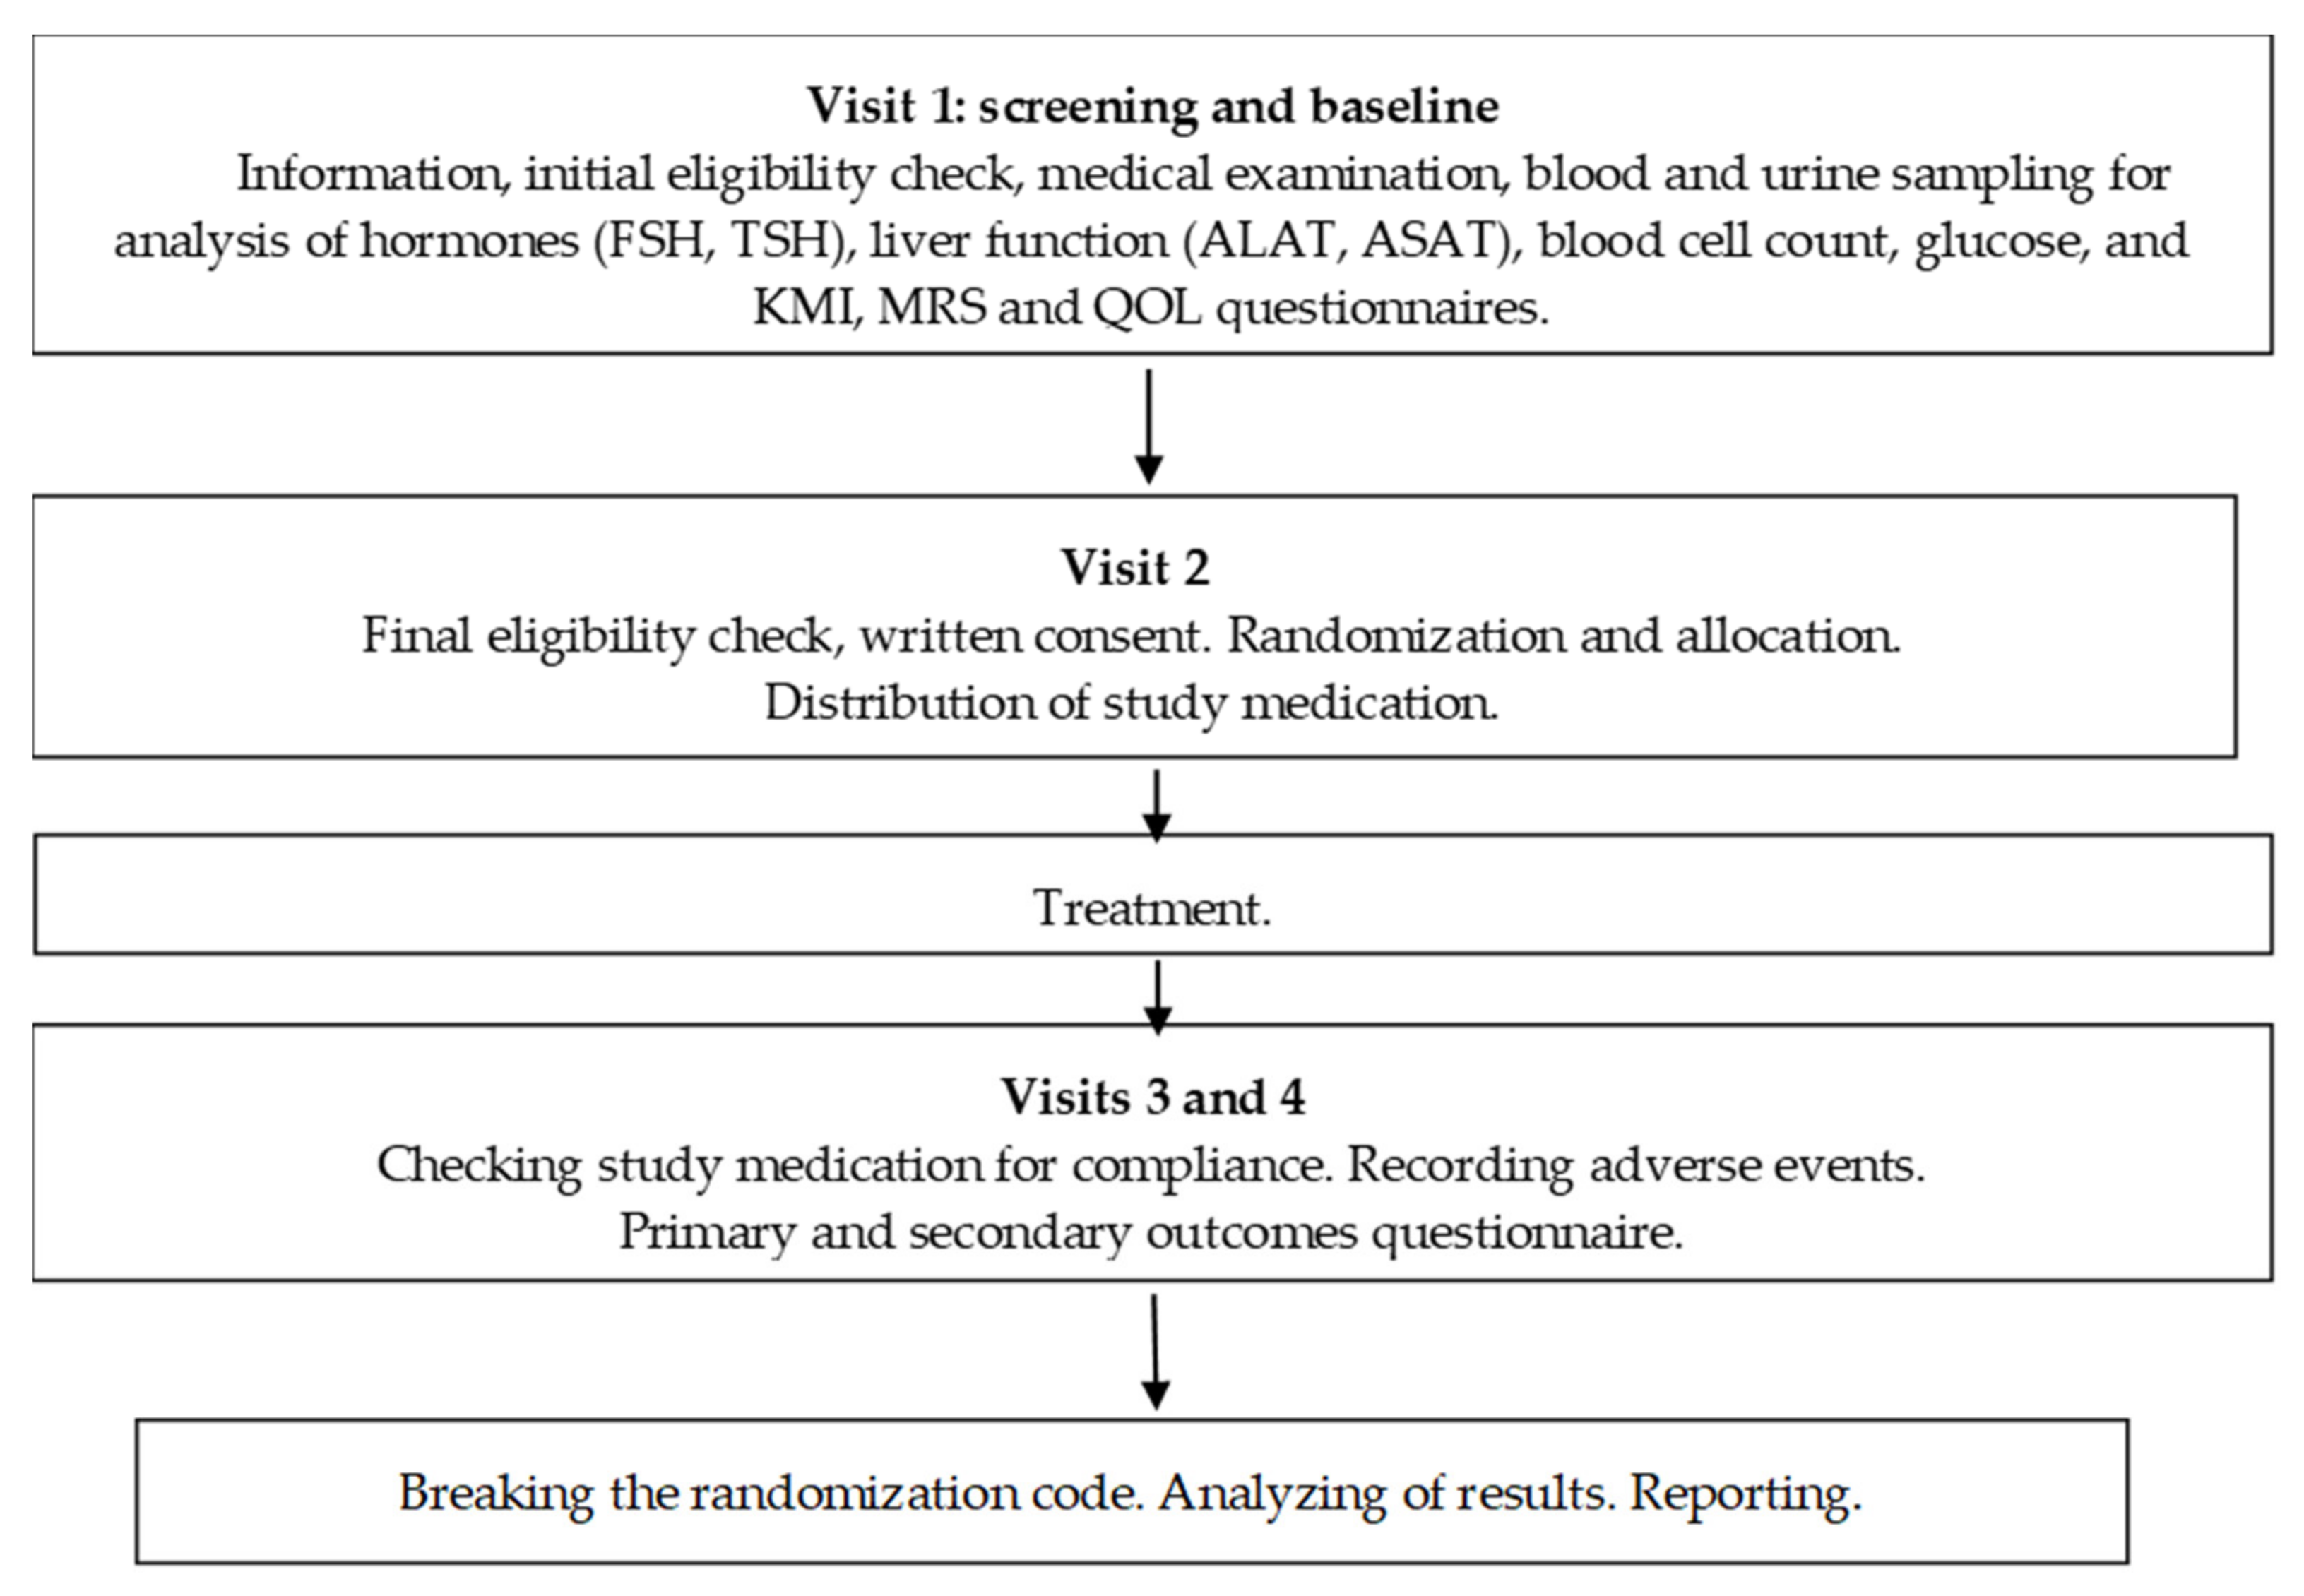
4.1. Study Design
4.2. Selection of the Study Population
4.2.1. Inclusion and Exclusion Criteria
4.2.2. Recruitment and Screening
4.2.3. Participant Withdrawal
4.2.4. Ethics Approval and Consent to Participate
4.3. Intervention and Comparator
4.3.1. Doses and Treatment Regimens
4.3.2. Randomization and Blinding
4.3.3. Allocation Concealment
4.3.4. Implementation and Blinding
4.3.5. Evaluation of Compliance
4.4. Efficacy and Safety Outcomes
- Somatic symptoms (hot flushes, sweating, heart discomfort, sleep problems, and joint and muscular discomfort);
- Psychological symptoms (depressive mood, irritability, anxiety, physical, and mental exhaustion);
- Urogenital symptoms (sexual problems, bladder problems, and dryness of vagina).
4.5. Efficacy and Safety Evaluation
4.5.1. Efficacy Primary Endpoint
4.5.2. Efficacy Secondary Endpoints
4.5.3. Safety Outcomes
4.6. Statistical Analysis
Sample Size Considerations
5. Conclusions
Supplementary Materials
Author Contributions
Funding
Acknowledgments
Conflicts of Interest
Abbreviations
| AE | Adverse event |
| BC | Black cohosh capsules |
| BC500 | Black cohosh capsules, 500 mg |
| CRF | Case report form |
| EC | Ethics committee |
| GCP | Good Clinical Practice |
| ICD | International Classification of Diseases |
| KMI | Kupperman Indexes |
| MRS | Menopause Relief Score |
| RR-BC | Rhodiola-Black cohosh combination (Menopause Relief EP®) capsules |
| UQOL | Utian Quality of Life Scale |
Appendix A. ITT and PP Statistics.


| Score/Subscale | Menopause UQOL Scale Item Nr | KI Scale Item Nr | MRS Scale Item Nr | Symptoms Group | Climacteric Symptoms |
|---|---|---|---|---|---|
| Vasomotor | 1,2 3 | 1 3 | hot flushes, sweating sleep disorders | Sensation of rising heat, outbreaks of sweating Difficulty in falling asleep, difficulty in remaining asleep through the night, waking too early | |
| Psychological/vegetative | 12 11, 20 1, 7–10, 16, 21,22 | 4 5 | 5 4 6 | nervousness/irritability, depressive mood, impaired performance/memory | Nervousness, inner tension, aggressivity Despondency, sadness, tearfulness, lack of drive, mood fluctuations Susceptibility to physical and mental exhaustion, poor concentration, forgetfulness |
| Somatic | 10 | 2 10 | cardiac symptoms joint and muscle symptoms | Palpitations, racing heartbeat, irregular beats, tightness in chest Pain predominantly affecting the finger joints, rheumatic symptoms, itching | |
| Urogenital/Atrophy | 15 | 7 8 9 | disorders of sexuality dyspareunia, vaginal dryness | Reduced libido, sexual activity, and satisfaction Symptoms during urination, frequent need to pass urine, accidental incontinence Feeling of dryness of the vagina, symptoms during sexual intercourse | |
| 6 | vertigo | sensation of whirling and loss of balance | |||
| 7 | asthenia | weakness | |||
| 9 | headache | ||||
| 12 | anxiety |
| (a) | ||||||||||
| Time after Treatment | A, n = 55 | B, n = 55 | C, n = 55 | D, n = 55 | Difference and p-Value | |||||
| A vs. PL | B vs. PL | C vs. PL | A vs. B | A vs. C | B vs. C | |||||
| Day 0 | 0 | 0 | 0 | 0 | 0 | 0 | 0 | 0 | 0 | 0 |
| Day 42 | 12.20 ± 8.99 n = 54 | 9.40 ± 7.28 n = 53 | 10.65 ± 7.14 n = 54 | 5.64 ± 7.77 n = 53 | 6.16 <0.001 *** | 3.36 >0.05 ns | 4.610 <0.01 ** | 2.80 >0.05 ns | 1.55 >0.05 ns | 1.25 >0.05 ns |
| Day 84 | 22.35 ± 8.97 n = 48 | 15.58 ± 9.81 n = 48 | 18.42 ± 9.30 n = 52 | 8.80 ± 12.07 n = 50 | 12.55 <0.001 *** | 6.78 <0.001 *** | 9.62 <0.001 *** | 6.77 <0.001 *** | 3.93 <0.05 * | 2.84 >0.05 ns |
| Two-way ANOVA | <0.0001 *** | 0.0001 *** | <0.0001 *** | <0.0001 *** | 0.0203 * | 0.0757 ns | ||||
| (b) | ||||||||||
| Time after Treatment | A, n = 48 | B, n = 48 | C, n = 52 | D, n = 50 | Difference and p-Value | |||||
| A vs. PL | B vs. PL | C vs. PL | A vs. B | A vs. C | B vs. C | |||||
| Day 0 | 0 | 0 | 0 | 0 | 0 | 0 | 0 | 0 | 0 | 0 |
| Day 42 | 13.50 ± 8.58 | 10.50 ± 6.70 | 10.81 ± 7.11 | 6.08 ± 7.77 | 7.42 <0.001 *** | 4.42 <0.05 * | 4.73 <0.01 ** | 3.00 >0.05 ns | 2.69 >0.05 ns | 0.31 >0.05 ns |
| Day 84 | 22.35 ± 8.97 | 15.58 ± 9.81 | 18.42 ± 9.30 | 8.80 ± 12.07 | 14.06 <0.001 *** | 7.29 <0.001 *** | 10.13 <0.001 *** | 6.77 <0.001 *** | 3.93 <0.05 * | 2.84 >0.05 ns |
| Two-way ANOVA | <0.0001 *** | <0.0001 *** | <0.0001 *** | 0.0001 *** | 0.0064 ** | 0.183 ns | ||||
| (a) | ||||||||||
| Time after Treatment | A, n = 55 | B, n = 55 | C, n = 55 | D, n = 55 | Difference and p-Value | |||||
| A vs. PL | B vs. PL | C vs. PL | A vs. B | A vs. C | B vs. C | |||||
| Day 0 | 0 | 0 | 0 | 0 | 0 | 0 | 0 | 0 | 0 | 0 |
| Day 42 | 7.18 ± 5.78 n = 54 | 6.17 ± 5.25 n = 53 | 7.44 ± 5.92 n = 54 | 3.81 ± 5.47 n = 53 | 3.37 <0.05 ** | 2.37 >0.05 ns | 3.63 <0.01 ** | 1.01 >0.05 ns | 0.26 >0.05 ns | −1.27 >0.05 |
| Day 84 | 12.27 ± 6.03 n = 48 | 10.02 ± 7.38 n = 48 | 12.60 ± 7.35 n = 52 | 5.56 ± 7.60 n = 50 | 6.71 <0.001 *** | 4.46 <0.001 *** | 7.04 <0.001 *** | 2.25 >0.05 ns | 0.33 >0.05 ns | −2.58 >0.05 ns |
| Two-way ANOVA | <0.0001 *** | 0.0001 *** | <0.0001 *** | >0.05 ns | 0.7316 ns | 0.0306 * | ||||
| (b) | ||||||||||
| Time after Treatment | A, n = 48 | B, n = 48 | C, n = 52 | D, n = 50 | Difference and p-Value | |||||
| A vs. PL | B vs. PL | C vs. PL | A vs. B | A vs. C | B vs. C | |||||
| Day 0 | 0 | 0 | 0 | 0 | 0 | 0 | 0 | 0 | 0 | 0 |
| Day 42 | 8.02 ± 5.57 | 6.85 ± 5.04 | 7.65 ± 5.92 | 3.98 ± 5.56 | 4.04 <0.001 *** | 2.87 <0.05 * | 3.67 <0.01 ** | 1.17 >0.05 ns | 0.37 >0.05 | −0.8 >0.05 ns |
| Day 84 | 12.27 ± 6.03 | 10.02 ± 7.38 | 12.60 ± 7.35 | 5.56 ± 7.68 | 6.71 <0.001 *** | 4.46 <0.001 *** | 7.04 <0.001 *** | 2.25 >0.05 ns | 0.33 >0.05 ns | −2.58 <0.05 * |
| Two-way ANOVA | <0.0001 *** | 0.0001 *** | <0.0001 *** | 0.0389 * | 0.9808 ns | 0.0561 ns | ||||
| (a) | ||||||||||
| Time after Treatment | A, n = 55 | B, n = 55 | C, n = 55 | D, n = 55 | Difference and p-Value | |||||
| A vs. PL | B vs. PL | C vs. PL | A vs. B | A vs. C | B vs. C | |||||
| Day 0 | 0 | 0 | 0 | 0 | 0 | 0 | 0 | 0 | 0 | 0 |
| Day 42 | 9.30 ± 7.92 n = 54 | 7.74 ± 9.56 n = 53 | 7.00 ± 7.51 n = 54 | 5.47 ± 8.28 n = 53 | 3.824 <0.05 * | 5.472 >0.05 ns | 1.528 >0.05 ns | 1.560 <0.05 ns | 2.296 >0.05 ns | 0.7360 >0.05 ns |
| Day 84 | 17.31 ± 10.03 n = 48 | 11.71 ± 11.76 n = 48 | 12.63 ± 8.98 n = 52 | 8.80 ± 10.33 n = 50 | 8.51 <0.001 *** | 8.800 >0.05 ns | 3.830 >0.05 ns | 5.600 <0.01 ** | 4.680 <0.001 ** | 0.9200 >0.05 ns |
| Two-way ANOVA | <0.0001 *** | 0.0595 ns | 0.0260 * | 0.0083 ** | 0.0032 ** | 0.943 ns | ||||
| (b) | ||||||||||
| Time after Treatment | A, n = 48 | B, n = 48 | C, n = 52 | D, n = 50 | Difference and p-Value | |||||
| A vs. PL | B vs. PL | C vs. PL | A vs. B | A vs. C | B vs. C | |||||
| Day 0 | 0 | 0 | 0 | 0 | 0 | 0 | 0 | 0 | 0 | 0 |
| Day 42 | 10.27 ± 7.78 | 8.54 ± 9.70 | 7.27 ± 7.52 | 5.96 ± 8.216 | 4.31 <0.05 * | 2.58 >0.05 ns | 1.31 >0.05 ns | 1.73 >0.05 ns | 3.00 >0.05 ns | 1.27 >0.05 ns |
| Day 84 | 17.31 ± 10.03 | 11.71 ± 11.76 | 12.63 ± 8.98 | 8.80 ± 10.33 | 8.51 <0.001 *** | 2.91 >0.05 ns | 3.83 <0.05 * | 5.6 <0.01 ** | 4.68 <0.01 ** | −0.92 >0.05 ns |
| Two-way ANOVA | <0.0001 *** | 0.0573 ns | 0.0382 * | 0.0110 * | 0.0018 * | 0.897 ns | ||||
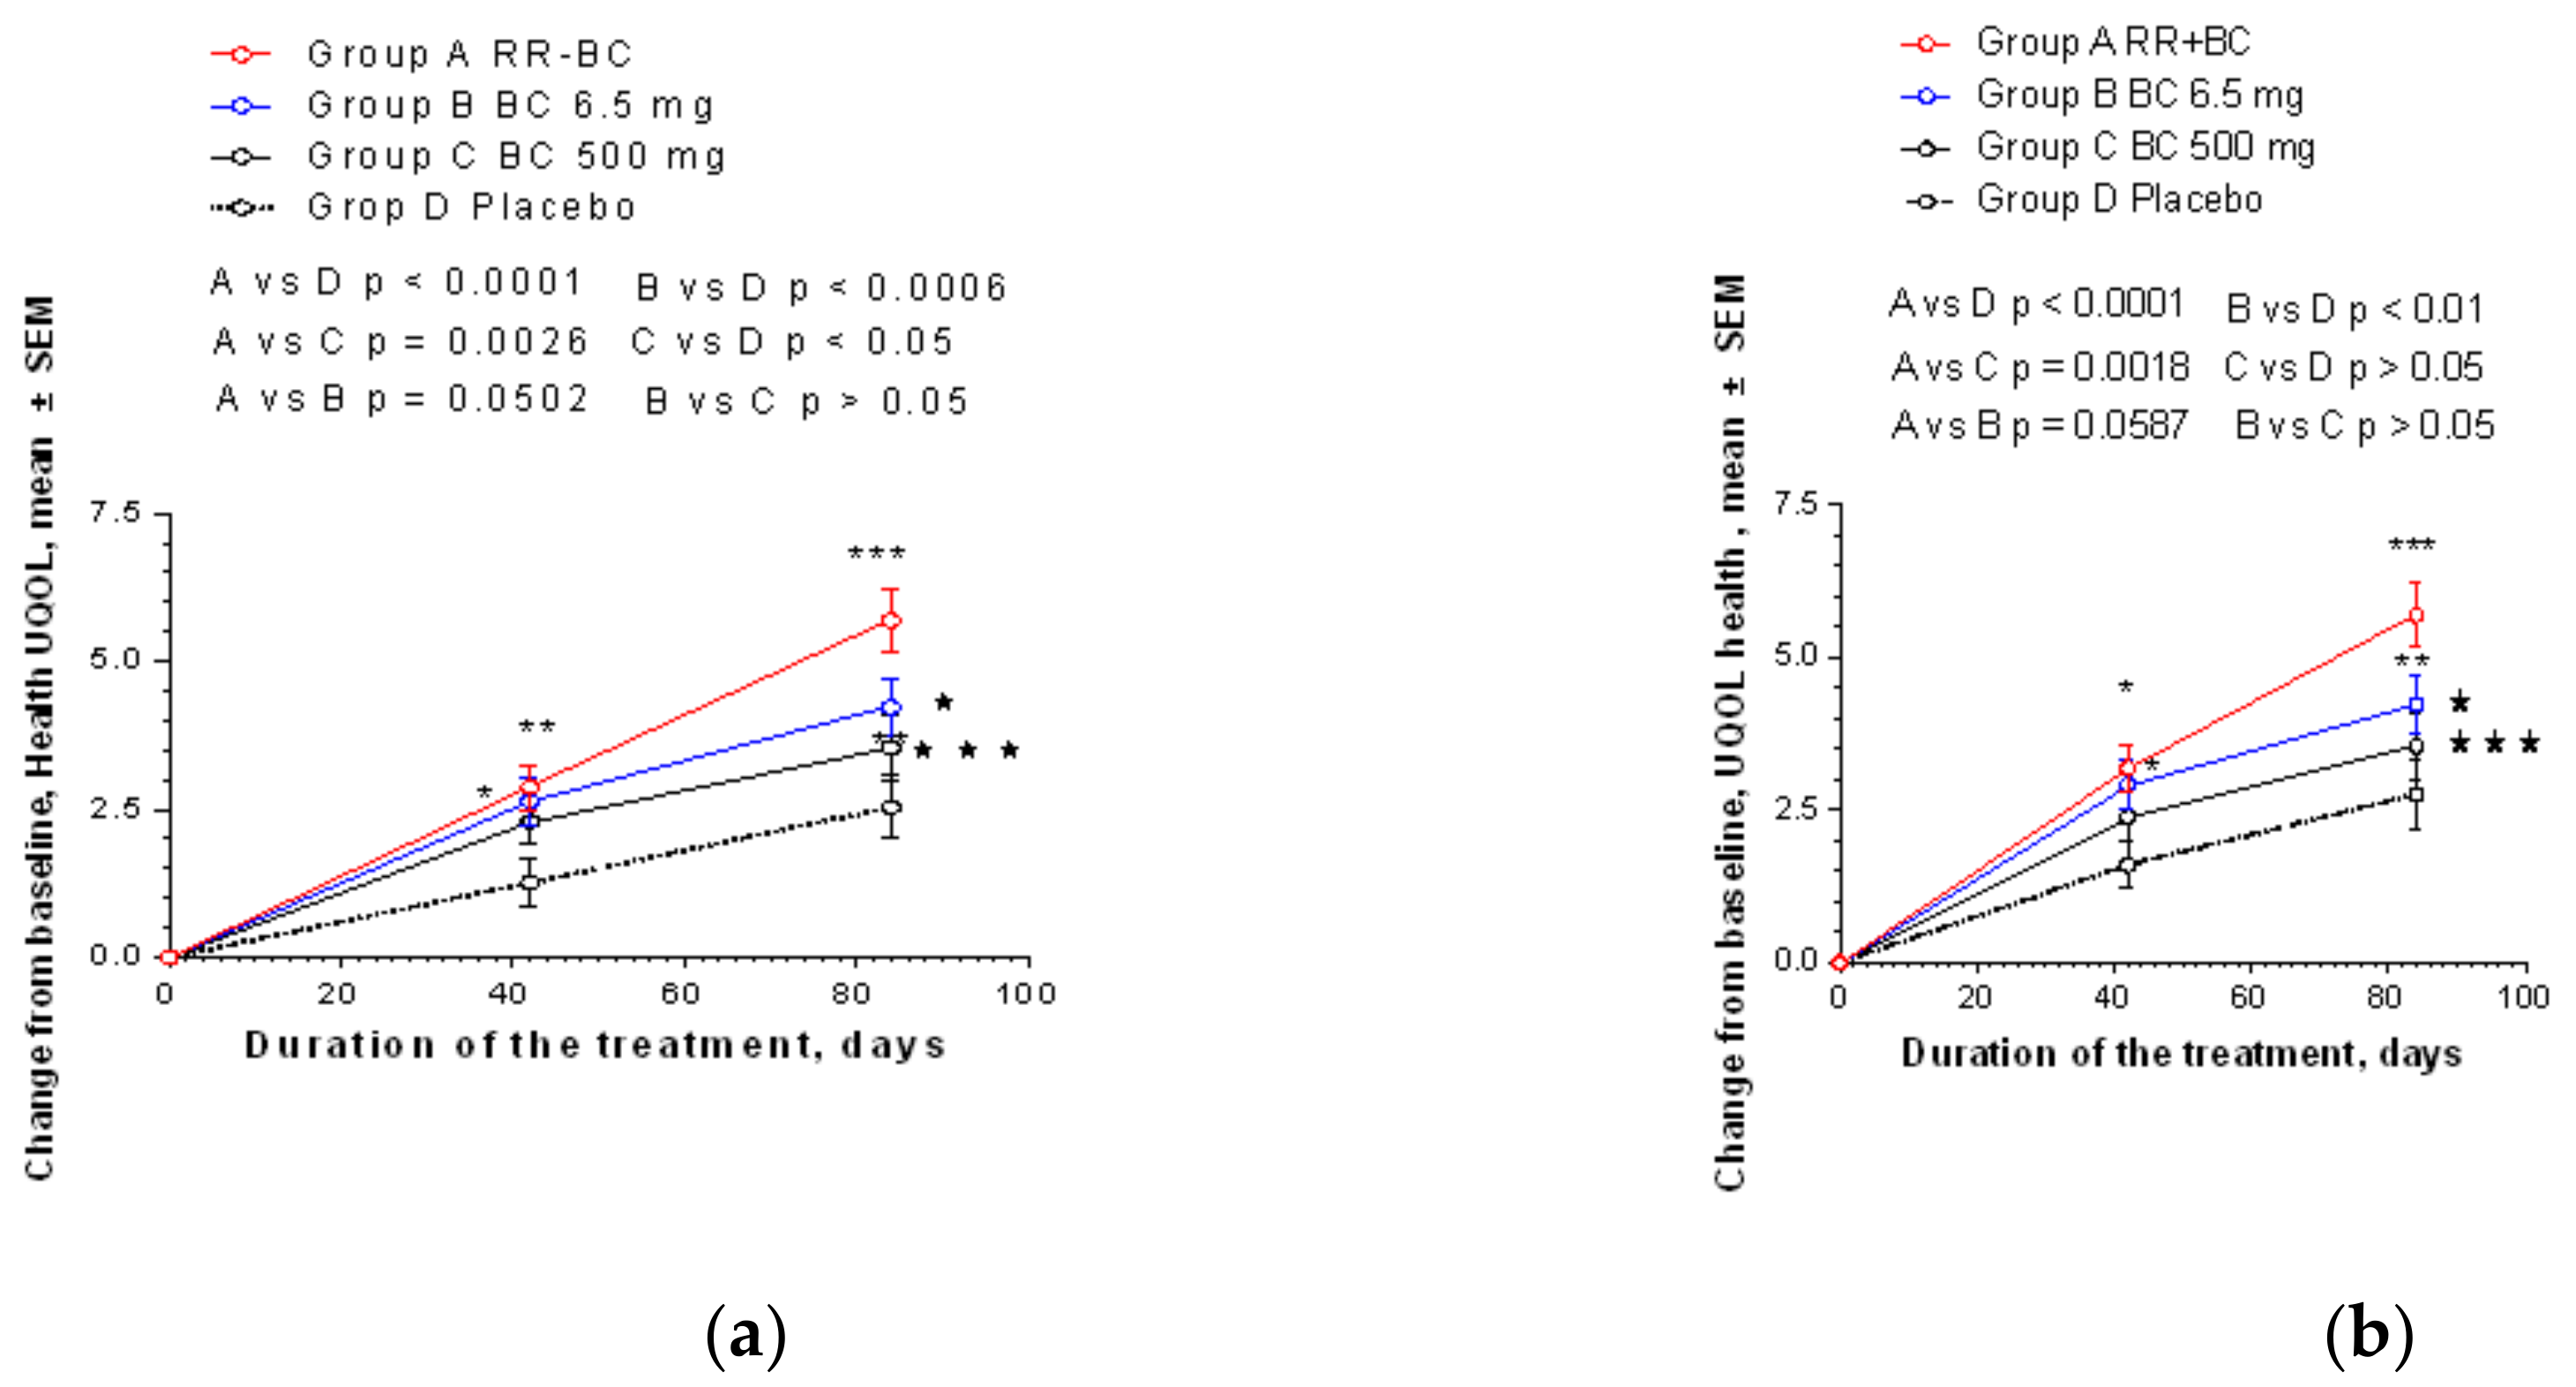
| (a) | ||||||||||
| Time after Treatment | A, n = 55 | B, n = 55 | C, n = 55 | D, n = 55 | Difference and p-Value | |||||
| A vs. PL | B vs. PL | C vs. PL | A vs. B | A vs. C | B vs. C | |||||
| Day 0 | 0 | 0 | 0 | 0 | 0 | 0 | 0 | 0 | 0 | 0 |
| Day 42 | 2.87 ± 2.75 n = 54 | 2.64 ± 2.916 n = 53 | 2.29 ± 2.88 n = 54 | 1.26 ± 2.90 n = 50 | 3.83 >0.05 ns | 1.378 <0.05 * | 1.032 >0.05 ns | 0.23 <0.05 ns | 0.57 >0.05 ns | 0.346 >0.05 ns |
| Day 84 | 5.69 ± 3.55 | 4.23 ± 3.33 | 3.54 ± 3.90 | 2.76 ± 3.94 | 5.36 <0.001 *** | 1.689 <0.01 ** | 0.998 >0.05 ns | 1.46 <0.05 * | 2.15 <0.001 *** | −0.691 >0.05 ns |
| Two-way ANOVA | <0.0001 *** | 0.0006 *** | 0.0278 * | 0.0502 ns | 0.0026 * | 0.247 ns | ||||
| (b) | ||||||||||
| Time after Treatment | A, n = 48 | B, n = 48 | C, n = 52 | D, n = 50 | Difference and p-Value | |||||
| A vs. PL | B vs. PL | C vs. PL | A vs. B | A vs. C | B vs. C | |||||
| Day 0 | 0 | 0 | 0 | 0 | 0 | 0 | 0 | 0 | 0 | 0 |
| Day 42 | 3.19 ± 2.75 | 2.92 ± 2.93 | 2.38 ± 2.90 | 1.60 ± 2.74 | 1.59 <0.05 * | 1.32 <0.05 * | 0.785 >0.05 ns | 0.271 >0.05 ns | 0.80 >0.05 ns | 0.53 >0.05 ns |
| Day 84 | 5.69 ± 3.55 | 4.23 ± 3.33 | 3.54 ± 3.90 | 2.76 ± 3.94 | 2.928 <0.001 *** | 1.47 <0.05 * | 7.778 >0.05 ns | 1.459 <0.05 * | 2.15 <0.05 *** | 0.69 >0.05 ns |
| Two-way ANOVA | <0.0001 *** | 0.0031 ** | 0.1037 ns | 0.0587 ns | 0.0018 ** | 0.192 ns | ||||
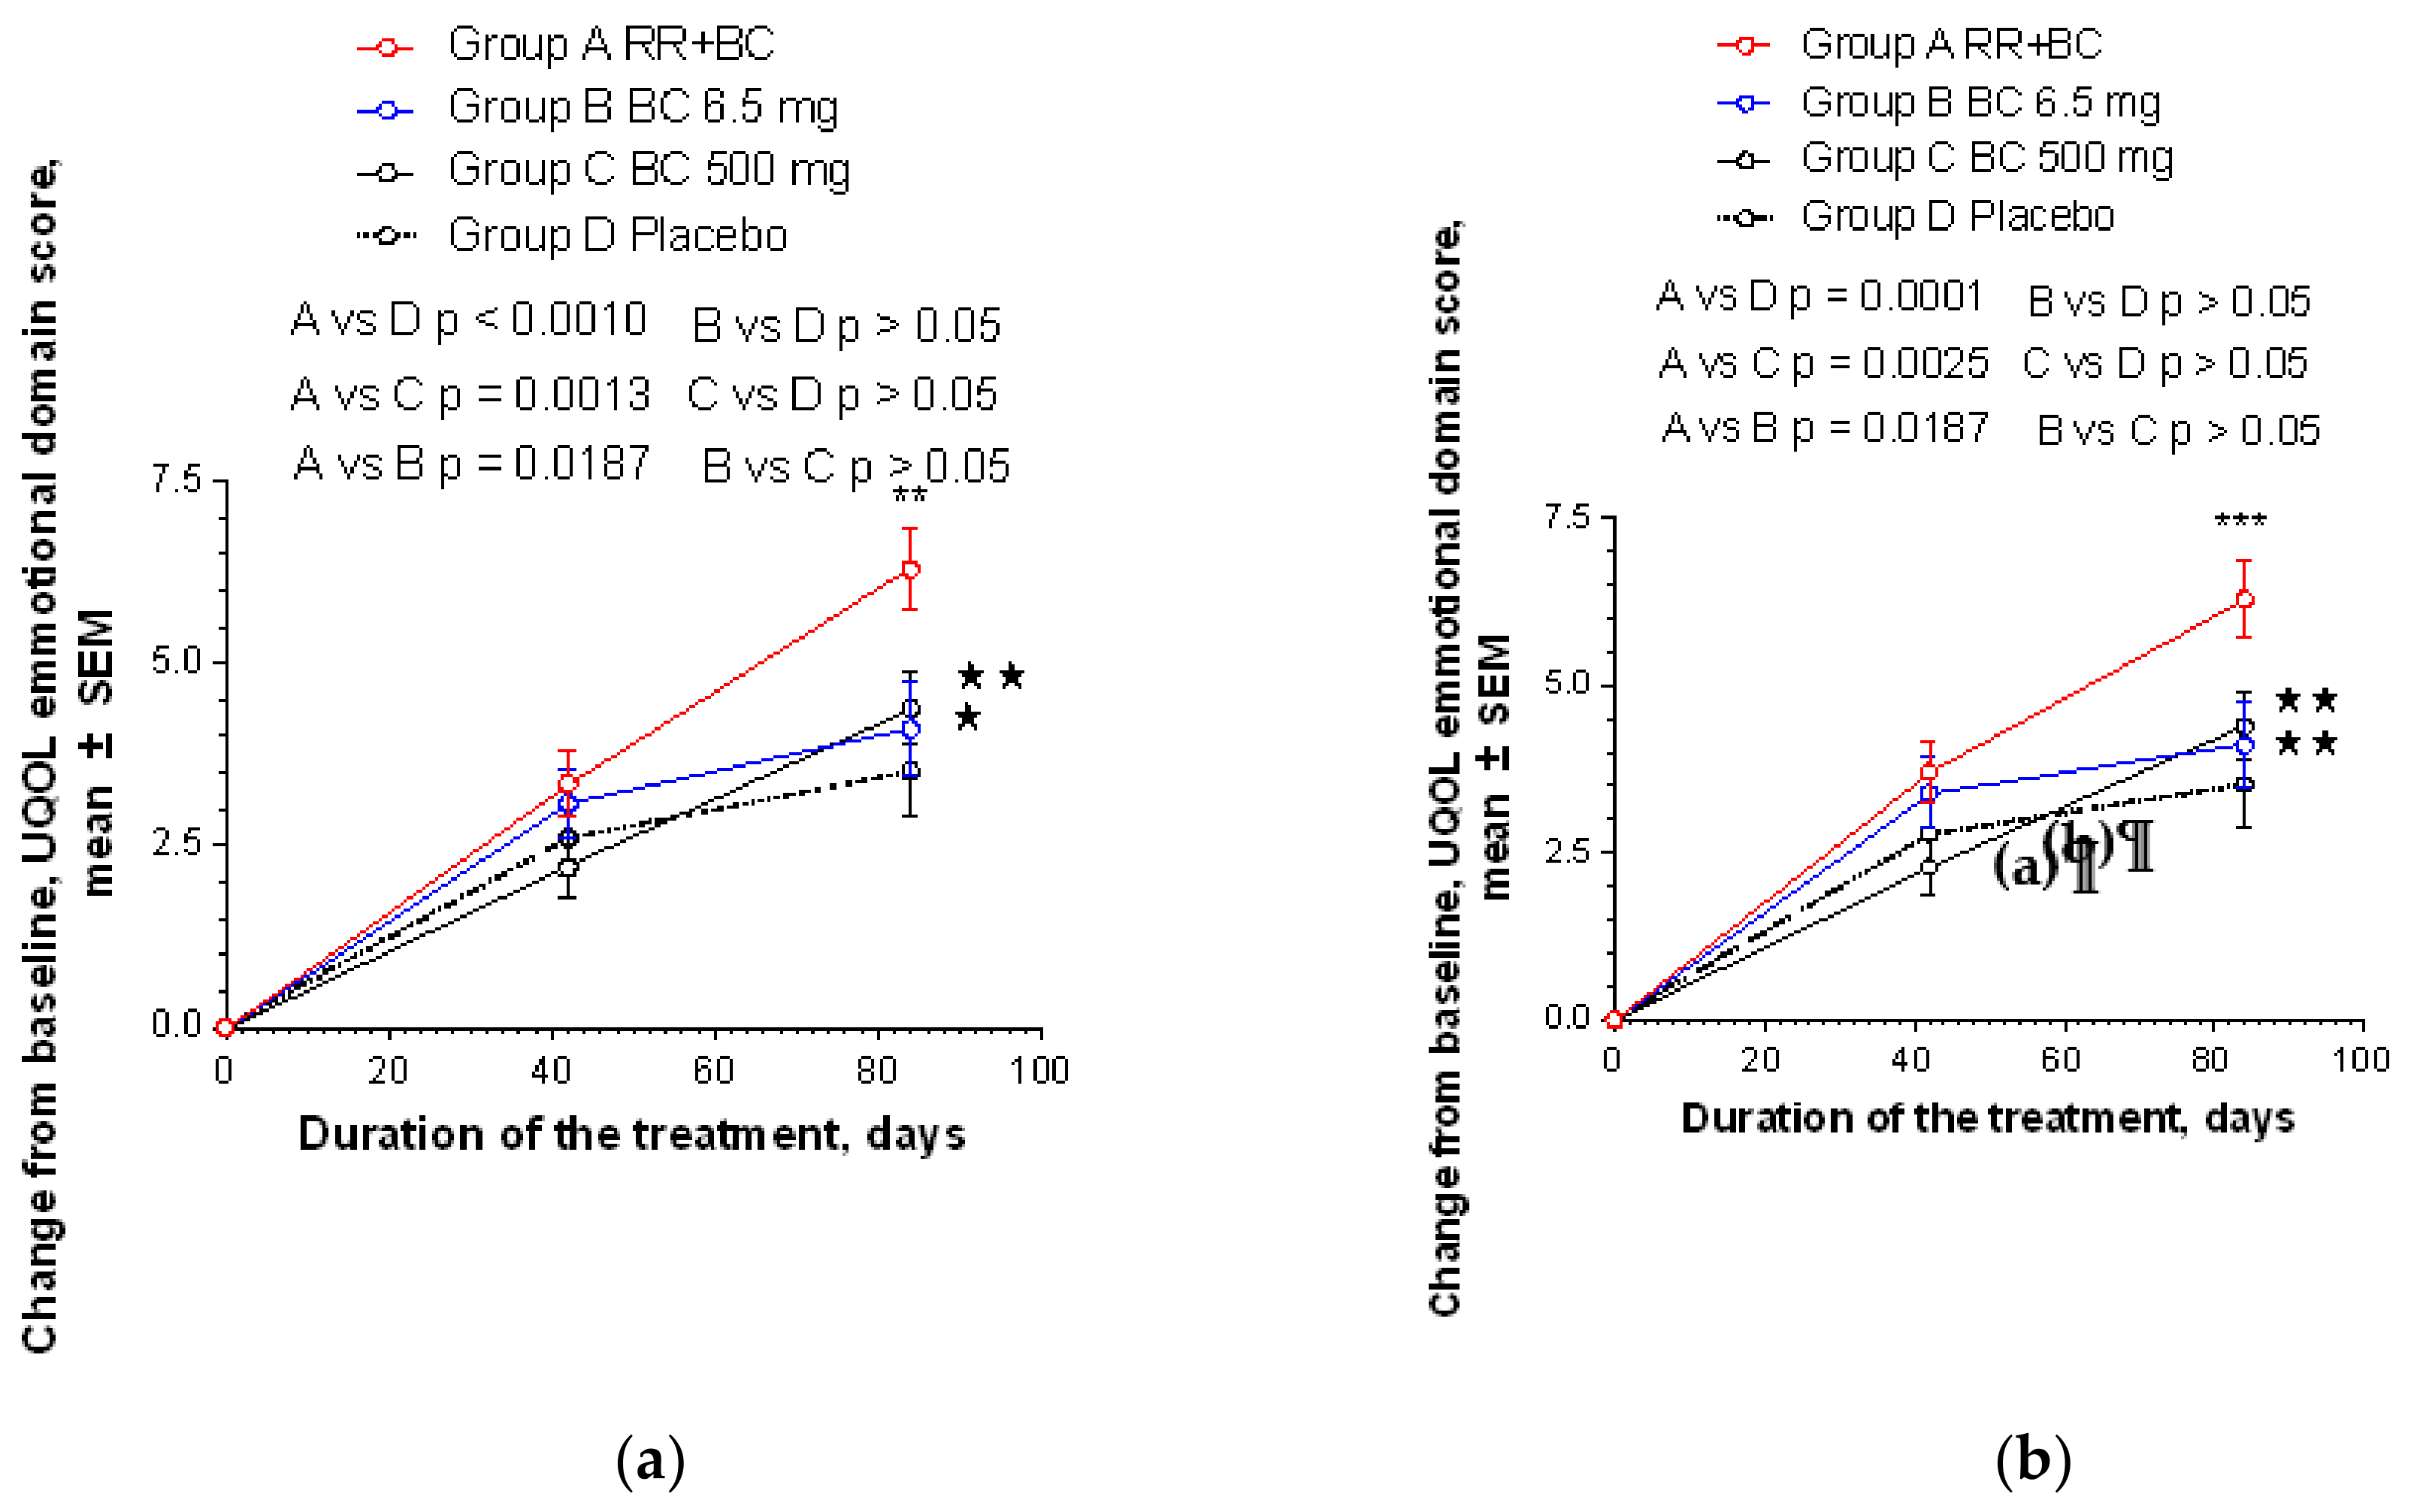
| (a) | ||||||||||
| Time after Treatment | A, n = 55 | B, n = 55 | C, n = 55 | D, n = 55 | Difference and p-Value | |||||
| A vs. PL | B vs. PL | C vs. PL | A vs. B | A vs. C | B vs. C | |||||
| Day 0 | 0 | 0 | 0 | 0 | 0 | 0 | 0 | 0 | 0 | 0 |
| Day 42 | 3.35 ± 3.27 n = 54 | 3.07 ± 3.58 n = 53 | 2.20 ± 3.04 n = 54 | 2.60 ± 3.79 n = 53 | 0.75 >0.05 ns | 0.47 >0.05 ns | −0.4 >0.05 ns | 0.28 <0.05 ns | 1.15 >0.05 ns | 0.87 >0.05 |
| Day 84 | 6.29 ± 3.94 n = 48 | 4.10 ± 4.44 n = 48 | 4.38 ± 3.58 n = 52 | 3.52 ± 4.46 n = 50 | 2.772 <0.01 *** | 0.584 >0.05 ns | 0.865 >0.05 ns | 0.277 <0.01 ** | 1.91 <0.01 ** | −0.281 >0.05 ns |
| Two-way ANOVA | <0.001 ** | 0.3440 ns | 0.648 | 0.0187 * | 0.001 ** | 0.56 ns | ||||
| (b) | ||||||||||
| Time after Treatment | A, n = 48 | B, n = 48 | C, n = 52 | D, n = 50 | Difference and p-Value | |||||
| A vs. PL | B vs. PL | C vs. PL | A vs. B | A vs. C | B vs. C | |||||
| Day 0 | 0 | 0 | 0 | 0 | 0 | 0 | 0 | 0 | 0 | 0 |
| Day 42 | 3.71 ± 3.27 | 3.40 ± 3.62 | 2.29 ± 3.06 | 2.78 ± 3.83 | 0.93 >0.05 ns | 0.62 >0.05 ns | –0.49 >0.05 ns | 3.31 >0.05 ns | 1.148 >0.05 ns | 1.11 >0.05 ns |
| Day 84 | 6.29 ± 3.94 | 4.10 ± 4.44 | 4.38 ± 3.58 | 3.52 ± 4.46 | 2.772 <0.001 *** | 0.584 >0.05 ns | 0.865 >0.05 ns | 2.188 <0.01 ** | 1.91 <0.01 ** | –0.28 >0.05 ns |
| Two-way ANOVA | 0.0001 *** | 0.3076 ns | 0.7236 ns | 0.0250 * | 0.0013 ** | 0.430 ns | ||||
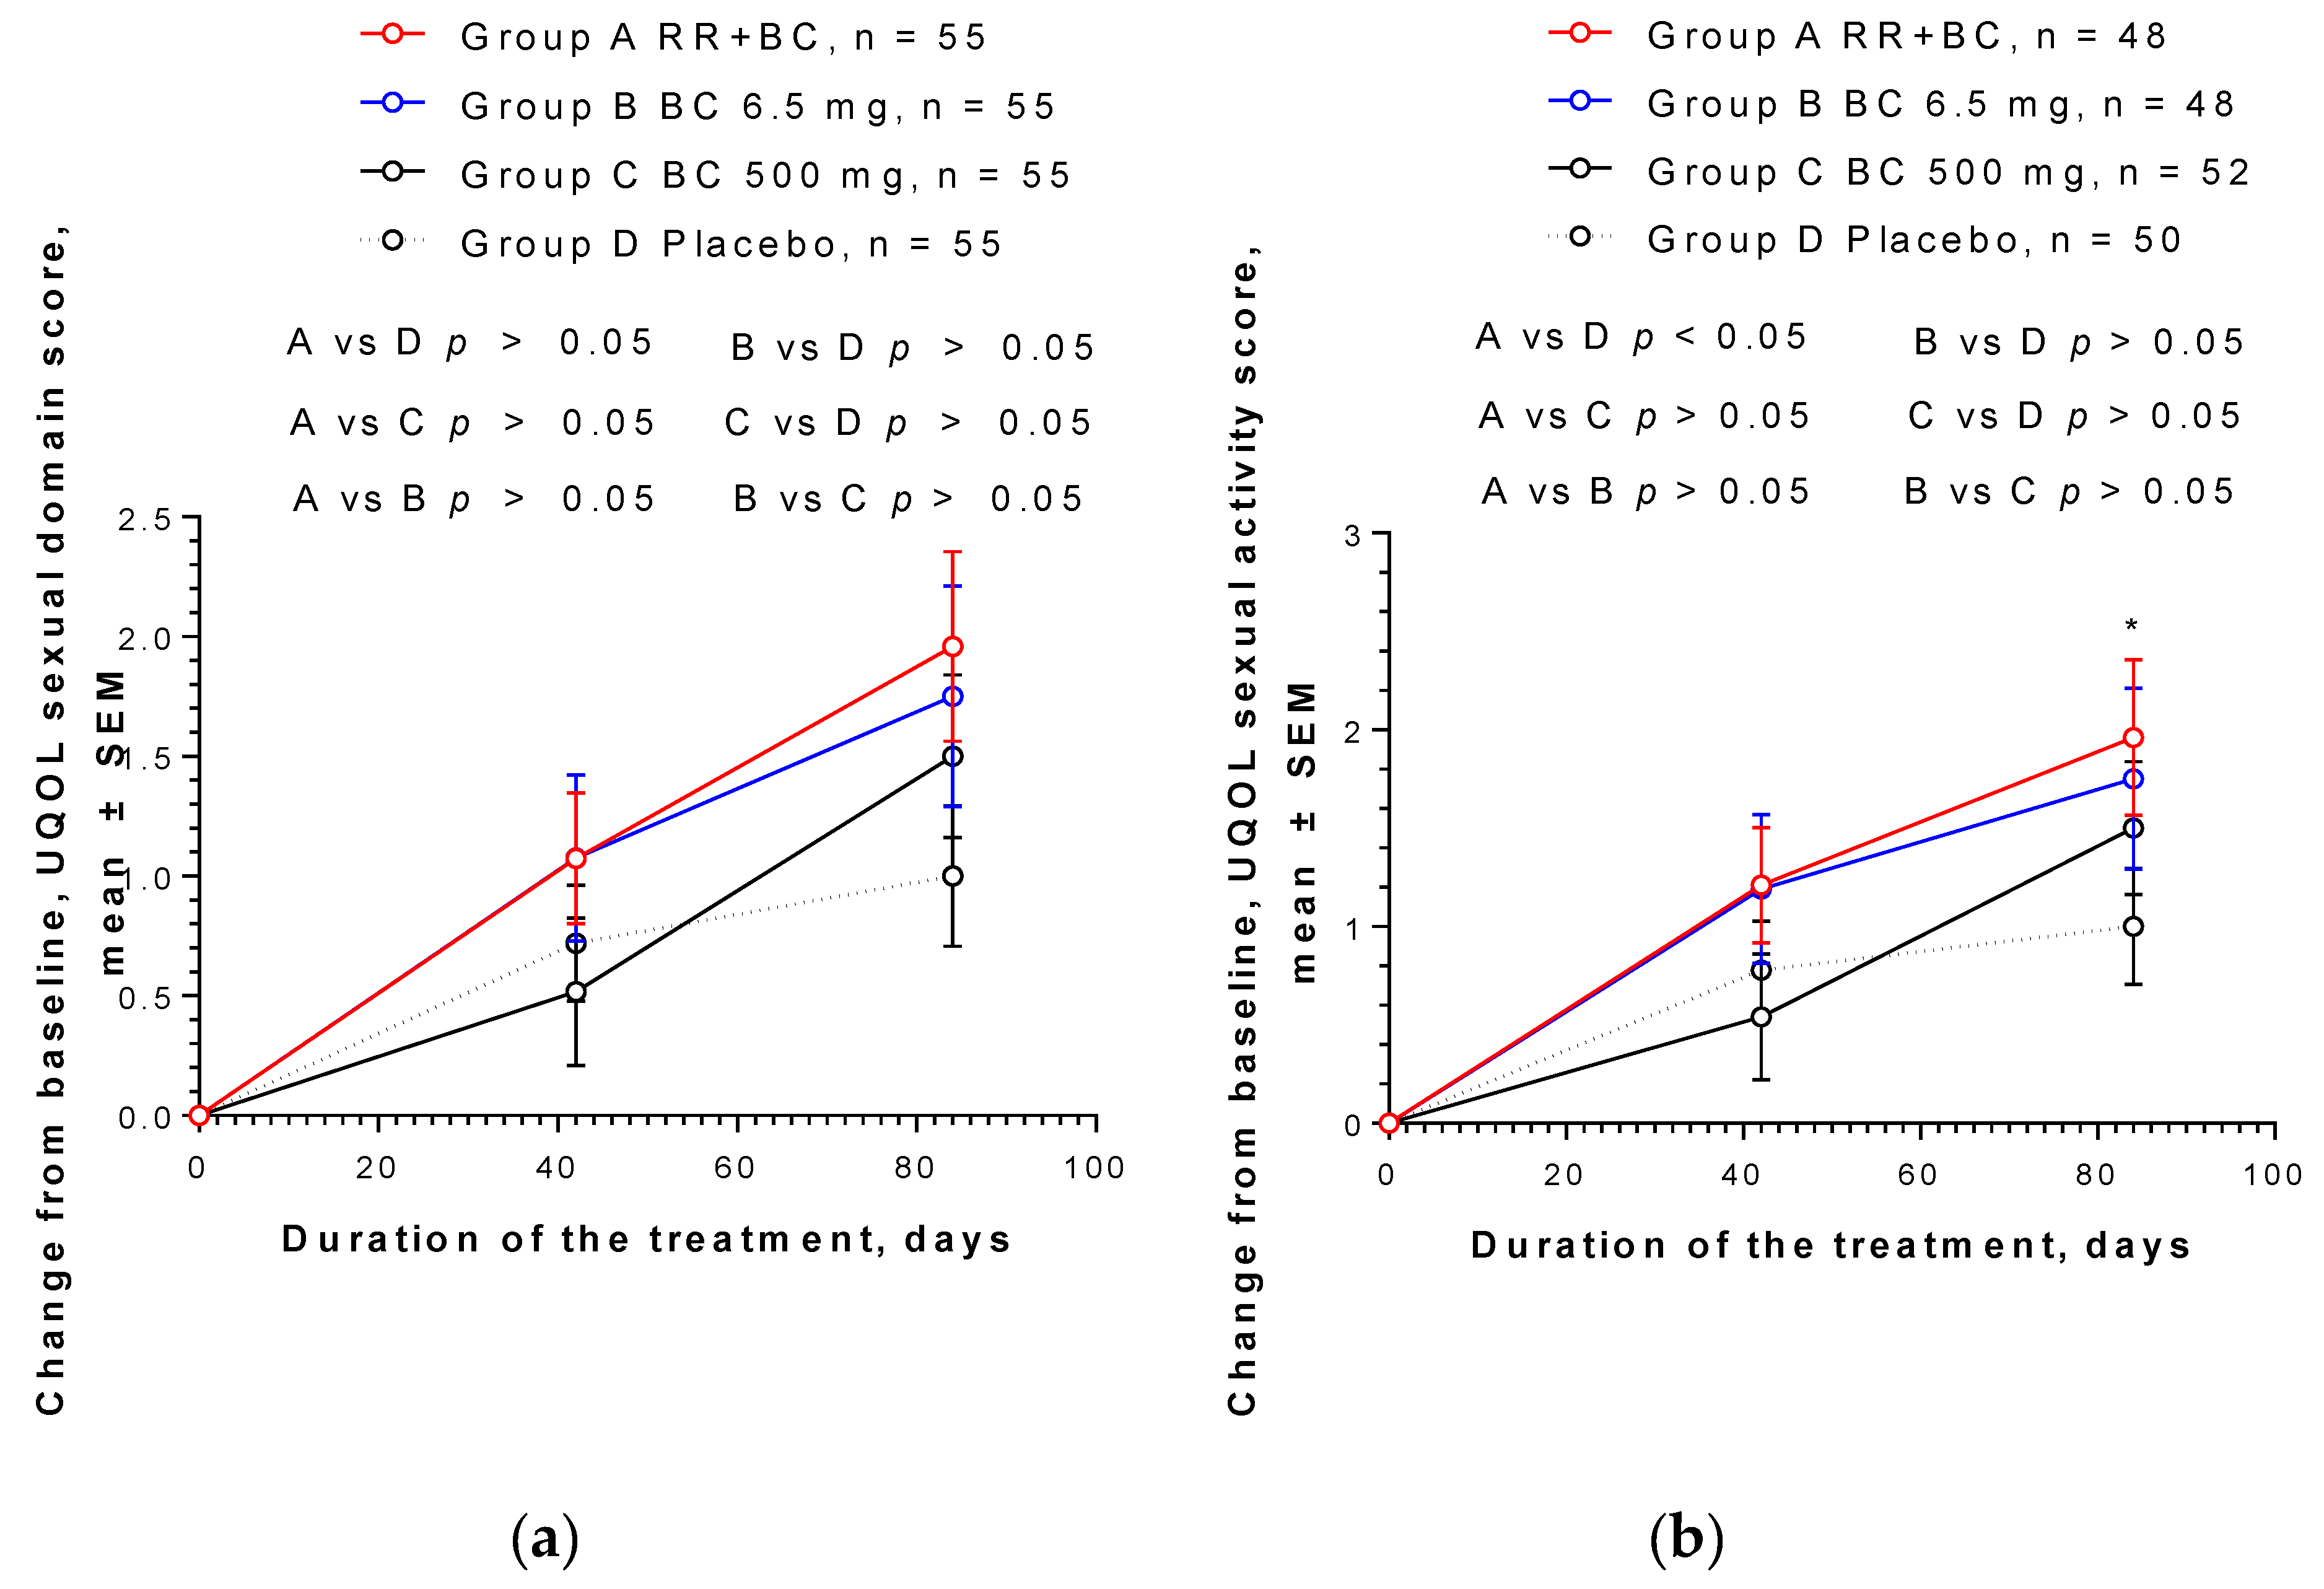
| (a) | ||||||||||
| Time after Treatment | A, n = 55 | B, n = 55 | C, n = 55 | D, n = 55 | Difference and p-Value | |||||
| A vs. PL | B vs. PL | C vs. PL | A vs. B | A vs. C | B vs. C | |||||
| Day 0 | 0 | 0 | 0 | 0 | 0 | 0 | 0 | 0 | 0 | 0 |
| Day 42 | 1.074 ± 2.0 n = 54 | 1.075 ± 2.53 n = 53 | 0.518 ± 2.27 n = 54 | 0.72 ± 1.76 n = 53 | 0.202 >0.05 ns | 0.355 >0.05 ns | −0.20 >0.05 ns | 0.001 >0.05 ns | 0.556 >0.05 ns | 0.557 >0.05 ns |
| Day 84 | 1.96 ± 2.74 n = 48 | 1.75 ± 3.19 n = 48 | 1.50 ± 2.45 n = 52 | 1.00 ± 2.08 n = 50 | 0.50 >0.05 ns | 0.75 >0.05 ns | 0.50 >0.05 ns | 0.21 >0.05 ns | 0.46 >0.05 ns | −0.25 >0.05 ns |
| Two-way ANOVA | >0.05 ns | >0.05 ns | >0.05 ns | >0.05 ns | >0.05 ns | >0.05 ns | ||||
| (b) | ||||||||||
| Time after Treatment | A, n = 48 | B, n = 48 | C, n = 52 | D, n = 50 | Difference and p-Value | |||||
| A vs. PL | B vs. PL | C vs. PL | A vs. B | A vs. C | B vs. C | |||||
| Day 0 | 0 | 0 | 0 | 0 | 0 | 0 | 0 | 0 | 0 | 0 |
| Day 42 | 1.21 ± 2.03 | 1.19 ± 2.63 | 0.54 ± 2.31 | 0.78 ± 1.77 | 0.43 >0.05 ns | 0.41 >0.05 ns | −0.24 >0.05 ns | 0.02 >0.05 ns | 0.67 >0.05 ns | 0.65 >0.05 |
| Day 84 | 1.96 ± 2.74 | 1.75 ± 3.19 | 1.50 ± 2.45 | 1.00 ± 2.09 | 0.96 <0.05 * | 0.75 >0.05 ns | 0.50 >0.05 ns | −0.21 >0.05 ns | 0.46 >0.05 ns | 0.25 >0.05 |
| Two-way ANOVA | 0.027 | 0.101 ns | 0.669 ns | 0.766 ns | 0.097 ns | 0.23 ns | ||||
References
- Santoro, N.; Randolph, J.F., Jr. Reproductive hormones and the menopause transition. Obstetr. Gynecol. Clin. N. Am. 2011, 38, 455–466. [Google Scholar] [CrossRef] [Green Version]
- Henneicke-von Zepelin, H.H. 60 years of Cimicifuga racemose medicinal products. Clinical research milestones, current study findings and current development. Wien. Med. Wochenschr. 2017, 167, 147–159. [Google Scholar] [CrossRef] [Green Version]
- Beral, V. Breast cancer and hormone-replacement therapy in the Million Women Study. Lancet 2003, 362, 419–427. [Google Scholar] [CrossRef]
- WHO Scientific Group on Research on the Menopause in the 1990s (1994: Geneva, Switzerland) & World Health Organization. Research on the Menopause in the 1990s; WHO Scientific Group Technical Report Series; WHO Scientific Group: World Health Organization: Geneva, Switzerland, 1996; Volume 866, pp. 1–107. Available online: https://apps.who.int/iris/handle/10665/41841. (accessed on 15 April 2020).
- Johnson, T.L.; Fahey, J.W. Black cohosh: Coming full circle? J. Ethnopharmacol. 2012, 141, 775–779. [Google Scholar] [CrossRef] [PubMed]
- Guo, Y.; Yin, T.; Wang, X.; Zhang, F.; Pan, G.; Lv, H.; Wang, X.; Orgah, J.O.; Zhu, Y.; Wu, H. Traditional uses, phytochemistry, pharmacology and toxicology of the genus Cimicifuga: A review. J. Ethnopharmacol. 2017, 209, 264–282. [Google Scholar] [CrossRef] [PubMed]
- European Union Herbal Monograph on Cimicifuga racemosa (L.) Nutt., rhizoma. Final; EMA/HMPC/48745/2017; Committee on Herbal Medicinal Products (HMPC): Fort Riley, KS, USA, 27 March 2018.
- Assessment Report on Cimicifuga racemosa (L.) Nutt., Rhizome. Final; EMA/HMPC/48744/2017; Committee on Herbal Medicinal Products (HMPC): Fort Riley, KS, USA, 27 March 2018.
- Black Cohosh root. In Herbal medicine. In Expanded Commission E Monographs; Blumenthal, M., Goldberg, A., Brinckmann, J., Eds.; American Botanical Council: Austin, TX, USA, 2000; pp. 22–26. [Google Scholar]
- Cimcifugae rhizoma. Black Cohosh. In ESCOP Monographs: The Scientific Foundation for Herbal Medicinal Products, 2nd ed.; ESCOP: Exeter, UK; Exeter-Stutgard, UK.: New York, NY, USA, 2003; pp. 79–91. [Google Scholar]
- Schellenberg, R.; Saller, R.; Hess, L.; Melzer, J.; Zimmermann, C.; Drewe, J.; Zahner, C. Dose-Dependent Effects of the Cimicifuga racemosa Extract Ze 450 in the Treatment of Climacteric Complaints: A Randomized, Placebo-Controlled Study. Evid. Based Complement. Alternat. Med. 2012, 2012, 260301. [Google Scholar] [CrossRef] [PubMed] [Green Version]
- Drewe, J.; Zimmermann, C.; Zahner, C. The effect of a Cimicifuga racemosa extracts Ze 450 in the treatment of climacteric complaints—An observational study. Phytomedicine 2013, 20, 659–666. [Google Scholar] [CrossRef]
- Liske, E.; Hänggi, W.; Henneicke-von Zepelin, H.H.; Boblitz, N.; Wüstenberg, P.; Rahlfs, V.W. Physiological investigation of a unique extract of black cohosh (cimicifugae racemosa rhizoma): A 6-month clinical study demonstrates no systemic estrogenic effect. J. Women’s Health Gender-Based Med. 2002, 11, 163–174. [Google Scholar] [CrossRef] [Green Version]
- Mohammad-Alizadeh-Charandabi, S.; Shahnazi, M.; Nahaee, J.; Bayatipayan, S. Efficacy of black cohosh (Cimicifuga racemosa L.) in treating early symptoms of menopause: A randomized clinical trial. Chin. Med. 2013, 8, 20. [Google Scholar] [CrossRef] [Green Version]
- Shahnazi, M.; Nahaee, J.; Mohammad-Alizadeh-Charandabi, S.; Bayatipayan, S. Effect of black cohosh (cimicifuga racemosa) on vasomotor symptoms in postmenopausal women: A randomized clinical trial. J. Caring Sci. 2013, 2, 105–113. [Google Scholar]
- The Vitamin Shoppe. Available online: https://www.vitaminshoppe.com/p/solaray-black-cohosh-545-mg-120-capsules/so-1692 (accessed on 15 April 2020).
- Amazon Best Sellers. Available online: https://www.amazon.com/Best-Sellers-Health-Personal-Care-Black-Cohosh-Herbal-Supplements/zgbs/hpc/3764761 (accessed on 15 April 2020).
- Panossian, A.; Danielyan, A.; Mamikonyan, G.; Wikman, G. Methods of Phytochemical Standardisation of Rhizoma Cimicifugae racemosae. Phytochem. Anal. 2004, 15, 100–108. [Google Scholar] [CrossRef] [PubMed]
- Seo, E.J.; Klauck, S.M.; Efferth, T.; Panossian, A. Adaptogens in chemobrain (Part I): Plant extracts attenuate cancer chemotherapy-induced cognitive impairment–Transcriptome-wide microarray profiles of neuroglia cells. Phytomedicine 2019, 55, 80–91. [Google Scholar] [CrossRef] [PubMed]
- Jacob, R.; Nalini, G.; Chidambaranathan, N. Neuroprotective effect of Rhodiola rosea Linn against MPTP induced cognitive impairment and oxidative stress. Ann. Neurosci. 2013, 20, 47–51. [Google Scholar] [CrossRef] [PubMed] [Green Version]
- Nakamura, S.; Li, X.; Matsuda, H.; Ninomiya, K.; Morikawa, T.; Yamaguti, K.; Yoshikawa, M. Bioactive constituents from Chinese natural medicines. XXVI. Chemical structures and hepatoprotective effects of constituents from roots of Rhodiola sachalinensis. Chem. Pharm. Bull. 2007, 55, 1505–1511. [Google Scholar] [CrossRef] [PubMed] [Green Version]
- Gerbarg, P.L.; Brown, R.P. Pause menopause with Rhodiola rosea, a natural selective estrogen receptor modulator. Phytomedicine 2016, 23, 763–769. [Google Scholar] [CrossRef]
- Hu, X.; Zhang, X.; Qiu, S.; Yu, D.; Lin, S. Salidroside induces cell-cycle arrest and apoptosis in human breast cancer cells. Biochem. Biophys. Res. Commun. 2010, 398, 62–67. [Google Scholar] [CrossRef]
- Sun, A.Q.; Ju, X.L. Advances in Research on Anticancer Properties of Salidroside. Chin. J. Integr. Med. 2020, 1–8. [Google Scholar] [CrossRef]
- Li, Y.; Pham, V.; Bui, M.; Song, L.; Wu, C.; Walia, A.; Uchio, E.; Smith-Liu, F.; Zi, X. Rhodiola rosea L.: An herb with anti-stress, anti-aging, and immunostimulating properties for cancer chemoprevention. Curr. Pharmacol. Rep. 2017, 3, 384–395. [Google Scholar] [CrossRef]
- Kupperman, S.; Wetchler, B.B.; Blatt, M.H. Contemporary therapy of the menopausal syndrome. JAMA 1959, 171, 1627–1637. [Google Scholar] [CrossRef]
- Heinemann, L.A.; Do Minh, T.; Strelow, F.; Gerbsch, S.; Schnitker, J.; Schneider, H.P. The Menopause Rating Scale (MRS) as outcome measure for hormone treatment? A validation study. Health Qual. Life Outcomes 2004, 2, 67. [Google Scholar] [CrossRef] [Green Version]
- Schneider, H.P.; Heinemann, L.A.; Rosemeier, H.P.; Potthoff, P.; Behre, H.M. The Menopause Rating Scale (MRS): Comparison with Kupperman index and quality-of-life scale SF-36. Climacteric 2000, 3, 50–58. [Google Scholar] [CrossRef] [PubMed]
- The North American Menopause Society (NAMN), Menopause QOL Instrument (UQOL). Available online: https://www.menopause.org/publications/clinical-practice-materials/menopause-qol-instrument-(uqol) (accessed on 15 April 2020).
- Panossian, A.G. Adaptogens in mental and behavioral disorders. Psychiatr. Clin. N. Am. 2013, 36, 49–64. [Google Scholar] [CrossRef] [PubMed]
- Panossian, A.G. Adaptogens: Tonic herbs for fatigue and stress. Altern. Complement. Ther. 2003, 9, 327–332. [Google Scholar] [CrossRef]
- Panossian, A.; Amsterdam, J. Adaptogens in Psychiatric Practice. In Complementary and Integrative Treatments in Psychiatric Practice; Gerbarg, P.L., Muskin, P.R., Brown, R.P., Eds.; American Psychiatric Publishing Assiciation: Arlington, MA, USA, 2017; pp. 155–181. [Google Scholar]
- Panossian, A.; Gerbarg, P. Potential Use of Plant Adaptogens in Age-related Disorder. In Complementary, Alternative, and Integrative Interventions in Mental Health and Aging; Lavretsky, H., Sajatovic, M., Reynolds, C.F., III, Eds.; Oxford University Press: New York, NY, USA, 2016; pp. 197–211. [Google Scholar]
- Panossian, A.; Wikman, G. Effects of adaptogens on the central nervous system and the molecular mechanisms associated with their stress-protective activity. Pharmaceuticals 2010, 3, 188–224. [Google Scholar] [CrossRef] [PubMed]
- Panossian, A.; Wikman, G.; Sarris, J. Rosenroot (Rhodiola rosea): Traditional use, chemical composition, pharmacology and clinical efficacy. Phytomedicine 2010, 7, 481–493. [Google Scholar] [CrossRef]
- Amsterdam, J.D.; Panossian, A.G. Rhodiola rosea L. as a putative botanical antidepressant. Phytomedicine 2016, 23, 770–783. [Google Scholar] [CrossRef]
- Panossian, A.; Wikman, G. Evidence Based Efficacy and Effectiveness of Rhodiola SHR-5 Extract in Treating Stress- and Age-Associated Disorders. In Rhodiola rosea, Series: Traditional Herbal Medicines for Modern Times; Cuerrier, A., Ampong-Nyarko, K., Eds.; CRC Press: Boca Raton, FL, USA, 2014; pp. 203–221. [Google Scholar]
- Assessment Report on Rhodiola rosea L., Rhizoma et Radix. Based on Article 16d(1), Article 16f and Article 16h of Directive 2001/83/EC as Amended Traditional Use) Final; EMA/HMPC/232100/2011; Committee on Herbal Medicinal Products (HMPC): Fort Riley, KS, USA, 27 March 2012.
- Community Herbal Monograph on Rhodiola rosea L., Rhizoma et Radix. Based on Article 16d(1), Article 16f and Article 16h of Directive 2001/83/EC as Amended Traditional Use) Final; EMA/HMPC/232091/2011; Committee on Herbal Medicinal Products (HMPC): Fort Riley, KS, USA, 27 March 2012.
- Dimpfel, W.; Schombert, L.; Panossian, A.G. Assessing the Quality and Potential Efficacy of Commercial Extracts of Rhodiola rosea L. by Analyzing the Salidroside and Rosavin Content and the Electrophysiological Activity in Hippocampal Long-Term Potentiation, a Synaptic Model of Memory. Front. Pharmacol. 2018, 9, 425. [Google Scholar] [CrossRef] [Green Version]
- Darbinyan, V.; Aslanyan, G.; Amroyan, E.; Gabrielyan, E.; Malmström, C.; Panossian, A. Clinical trial of Rhodiola rosea L. extract SHR-5 in the treatment of mild to moderate depression. Nord. J. Psychiatry 2007, 61, 343–348. [Google Scholar] [CrossRef]
- Darbinyan, V.; Kteyan, A.; Panossian, A.; Gabrielian, E.; Wikman, G.; Wagner, H. Rhodiola rosea in stress induced fatigue—A double blind cross-over study of a standardized extract SHR-5 with a repeated low-dose regimen on the mental performance of healthy physicians during night duty. Phytomedicine 2000, 7, 365–371. [Google Scholar] [CrossRef]
- Mao, J.J.; Xie, S.X.; Zee, J.; Soeller, I.; Li, Q.S.; Rockwell, K.; Amsterdam, J.D. Rhodiola rosea versus sertraline for major depressive disorder: A randomized placebo-controlled trial. Phytomedicine 2015, 22, 394–399. [Google Scholar] [CrossRef] [Green Version]
- Olsson, E.M.; von Schéele, B.; Panossian, A.G. A randomized double-blind placebo controlled parallel group study of SHR-5 extract of Rhodiola rosea roots as treatment for patients with stress related fatigue. Planta Med. 2009, 75, 105–112. [Google Scholar] [CrossRef] [PubMed] [Green Version]
- Tao, H.; Wu, X.; Cao, J.; Peng, Y.; Wang, A.; Pei, J.; Xiao, J.; Wang, S.; Wang, Y. Rhodiola species: A comprehensive review of traditional use, phytochemistry, pharmacology, toxicity, and clinical study. Med. Res. Rev. 2019, 39, 1779–1850. [Google Scholar] [CrossRef] [PubMed]
- Panossian, A.; Hamm, R.; Wikman, G.; Efferth, T. Mechanism of action of Rhodiola, salidroside, tyrosol and triandrin in isolated neuroglial cells: An interactive pathway analysis of the downstream effects using RNA microarray data. Phytomedicine 2014, 21, 1325–1348. [Google Scholar] [CrossRef] [PubMed]
- NIH US National Liblary of Medicine. ClinicalTrials.gov. Effect of Menopause Relief EP-40 in Women with Menopausal Symptoms. Available online: https://clinicaltrials.gov/ct2/show/study/NCT03461380?term=NCT03461380&cond=%22Menopause%22&rank=1 (accessed on 15 April 2020).
- ICD-10 Version: 2010, ICD-10, Version for 2014. Available online: http://apps.who.int/classifications/icd10/browse/2010/en#/N95.1 (accessed on 15 April 2020).


| (a) | |||||||
| Mean ± SD | Mean Difference and p-Value | ||||||
| A | B | C | Placebo | A vs. PL | B vs. PL | C vs. PL | |
| (n = 55) | (n = 55) | (n = 55) | (n = 55) | ||||
| Age (years) | 52.36 ± 7.30 | 52.60 ± 8.07 | 52.56 ± 8.58 | 52.53 ± 6.75 | −0.164 | 0.073 | 0.036 |
| p > 0.05 ns | p > 0.05 ns | p > 0.05 ns | |||||
| BMI (kg/m2) | 25.71 ± 2.63 | 26.08 ± 3.42 | 26.23 ± 2.80 | 25.97 ± 3.22 | −0.255 | 0.109 | 0.262 |
| p > 0.05 ns | p > 0.05 ns | p > 0.05 ns | |||||
| MRS | 18.78 ± 6.65 | 19.82 ± 7.96 | 21.05 ± 7.31 | 18.60 ± 8.22 | 0.1818 | −1.236 | 2.455 |
| p > 0.05 ns | p > 0.05 ns | p > 0.05 ns | |||||
| KMI | 32.07 ± 7.99 | 31.25 ± 8.249 | 31.51 ± 8.366 | 29.76 ± 9.50 | 2.309 | 1.491 | 1.745 |
| p > 0.05 ns | p > 0.05 ns | p > 0.05 ns | |||||
| UOQL | 77.36 ± 14.50 | 79.18 ± 16.60 | 78.69 ± 14.49 | 78.73 ± 13.17 | −1.364 | 0.454 | −0.036 |
| p > 0.05 ns | p > 0.05 ns | p > 0.05 ns | |||||
| (b) | |||||||
| Mean ± SD | Mean Difference and p-Value | ||||||
| A | B | C | Placebo | A vs. PL | B vs. PL | C vs. PL | |
| (n = 48) | (n = 48) | (n = 52) | (n = 50) | ||||
| Age (years) | 52.36 ± 7.30 | 52.60 ± 8.07 | 52.56 ± 8.58 | 52.53 ± 6.75 | −0.164 | 0.073 | 0.036 |
| p > 0.05 ns | p > 0.05 ns | p > 0.05 ns | |||||
| BMI (kg/m2) | 25.71 ± 2.63 | 26.08 ± 3.42 | 26.23 ± 2.80 | 25.97 ± 3.22 | −0.255 | 0.109 | 0.262 |
| p > 0.05 ns | p > 0.05 ns | p > 0.05 ns | |||||
| MRS | 17.79 ± 6.39 | 19.75 ± 7.96 | 20.85 ± 7.35 | 18.78 ± 8.56 | −0.984 | 0.975 | 2.17 |
| p > 0.05 ns | p > 0.05 ns | p > 0.05 ns | |||||
| KMI | 30.98 ± 7.76 | 31.19 ± 8.42 | 31.04 ± 8.26 | 29.90 ± 9.59 | 1.313 | 1.521 | 1.138 |
| p > 0.05 ns | p > 0.05 ns | p > 0.05 ns | |||||
| UOQL | 78.39 ± 14.78 | 78.77 ± 15.71 | 80.48 ± 12.68 | 78.78 ± 13.31 | −0.117 > 0.05 ns | 0.266 | 1.701 |
| p > 0.05 ns | p > 0.05 ns | ||||||
| (a) | ||||||||||
| Time after Treatment | A | B | C | Placebo | Difference and p-Value | |||||
| (n = 55) | (n = 55) | (n = 55) | (n = 55) | A vs. PL | B vs. PL | C vs. PL | A vs. B | A vs. C | B vs. C | |
| Day 0 | 0 | 0 | 0 | 0 | 0 | 0 | 0 | 0 | 0 | 0 |
| n = 55 | n = 55 | n = 55 | n = 55 | |||||||
| Day 42 | 1.07 ± 2.0 | 1.07 ± 2.53 | 0.52 ± 2.27 | 0.72 ± 1.76 | 0.202 > 0.05 ns | 0.355 > 0.05 ns | −0.20 > 0.05 ns | 0.001 > 0.05 ns | 0.556 > 0.05 ns | 0.557 > 0.05 ns |
| n = 54 | n = 53 | n = 54 | n = 53 | |||||||
| Day 84 | 1.96 ± 2.74 | 1.75 ± 3.19 | 1.50 ± 2.45 | 1.00 ± 2.08 | 0.50 > 0.05 ns | 0.75 > 0.05 ns | 0.50 > 0.05 ns | 0.21 > 0.05 ns | 0.46 > 0.05 ns | -0.25 > 0.05 ns |
| n = 48 | n = 48 | n = 52 | n = 50 | |||||||
| Two-way ANOVA, p | >0.05 ns | >0.05 ns | >0.05 ns | >0.05 ns | >0.05 ns | >0.05 ns | ||||
| (b) | ||||||||||
| Time after Treatment | A | B | C | Placebo | Difference and p-Value | |||||
| (n = 48) | (n = 48) | (n = 52) | (n = 50) | A vs. PL | B vs. PL | C vs. PL | A vs. B | A vs. C | B vs. C | |
| Day 0 | 0 | 0 | 0 | 0 | 0 | 0 | 0 | 0 | 0 | 0 |
| Day 42 | 1.21 ± 2.03 | 1.19 ± 2.63 | 0.54 ± 2.31 | 0.78 ± 1.77 | 0.43 > 0.05 ns | 0.41 > 0.05 ns | −0.24 > 0.05 ns | 0.02 > 0.05 ns | 0.67 > 0.05 ns | 0.65 > 0.05 ns |
| Day 84 | 1.96 ± 2.74 | 1.75 ± 3.19 | 1.50 ± 2.45 | 1.00 ± 2.09 | 0.96 < 0.05 * | 0.75 > 0.05 ns | 0.50 > 0.05 ns | −0.21 > 0.05 ns | 0.46 > 0.05 ns | 0.25 > 0.05 ns |
| Two-way ANOVA, p | 0.027 | 0.101 ns | 0.667 ns | 0.766 ns | 0.097 ns | 0.232 ns | ||||
| Treatment Groups | Number of Subjects Who Experienced AEs | % | Number of Adverse Events | % of Total AEs | Odds Ratio (D/A) Significance Level, p-Value |
|---|---|---|---|---|---|
| 5 of 55 | 9.1 | 6 of 29 | 20.7 | 2.0417 (z = 1.302) p = 0.1930 |
| 5 of 55 | 9.1 | 6 of 29 | 20.7 | |
| 5 of 55 | 9.1 | 6 of 29 | 20.7 | |
| 6 of 55 | 10.9 | 11 of 29 | 37.9 | |
| Total | 21 of 220 | 9.5 | 29 | 100 |
| AE | Treatment Related | Disease Related | Group A (n = 55) | Group B (n = 55) | Group C (n = 55) | Group D (n = 55) | ||||
|---|---|---|---|---|---|---|---|---|---|---|
| n | % | n | % | n | % | n | % | |||
| Hot flashes | Yes | 2 | 3.6 | 3 | ||||||
| Sweating | Yes | 1 | 1.8 | 1 | ||||||
| Tachycardia | Yes | 1 | ||||||||
| Sleep disturbance | Yes | 1 | ||||||||
| Gastrointestinal pain | Yes | 2 | 3.6 | 3 | 5.4 | 2 | 2 | |||
| Nausea | Yes | 1 | 1.8 | 1 | ||||||
| Vomiting | Yes | 1 | 1.8 | 1 | ||||||
| Diarrhea | 1 | |||||||||
| Hypertension | Yes | 1 | ||||||||
| Headache | Yes | 1 | 1.8 | |||||||
| Allergic reaction | Yes | |||||||||
| Increase of appetite | Yes | 1 | ||||||||
| Anxiety | Yes | 1 | ||||||||
| Skin rush/pruritus | Yes | 1 | 1.8 | 1 | ||||||
| Total | 6 | 10.9 | 6 | 10.9 | 6 | 10.9 | 11 | |||
| Visit 1 | Visit 2 | At Home | Visit 3 | Visit 4 | |
|---|---|---|---|---|---|
| Day -7 Screening Baseline | Day 0 | Days 1–4 | Day 42 | Day 84 | |
| Eligibility check/Information | x | ||||
| Informed consent | x | x | |||
| Clinical examination | x | x | x | ||
| Enrolment and allocation to IP | x | ||||
| Treatment | x | x | x | ||
| MRS score | x | x | x | ||
| KMI score | x | x | x | ||
| QOL score | x | x | x | ||
| TSH | x | ||||
| FSH | x | ||||
| E2 | x | ||||
| Urinalysis | x | ||||
| IP accountability | x | x | |||
| AEs | x | x |
© 2020 by the authors. Licensee MDPI, Basel, Switzerland. This article is an open access article distributed under the terms and conditions of the Creative Commons Attribution (CC BY) license (http://creativecommons.org/licenses/by/4.0/).
Share and Cite
Pkhaladze, L.; Davidova, N.; Khomasuridze, A.; Shengelia, R.; Panossian, A.G. Actaea racemosa L. Is More Effective in Combination with Rhodiola rosea L. for Relief of Menopausal Symptoms: A Randomized, Double-Blind, Placebo-Controlled Study. Pharmaceuticals 2020, 13, 102. https://doi.org/10.3390/ph13050102
Pkhaladze L, Davidova N, Khomasuridze A, Shengelia R, Panossian AG. Actaea racemosa L. Is More Effective in Combination with Rhodiola rosea L. for Relief of Menopausal Symptoms: A Randomized, Double-Blind, Placebo-Controlled Study. Pharmaceuticals. 2020; 13(5):102. https://doi.org/10.3390/ph13050102
Chicago/Turabian StylePkhaladze, Lali, Nina Davidova, Archil Khomasuridze, Ramaz Shengelia, and Alexander G. Panossian. 2020. "Actaea racemosa L. Is More Effective in Combination with Rhodiola rosea L. for Relief of Menopausal Symptoms: A Randomized, Double-Blind, Placebo-Controlled Study" Pharmaceuticals 13, no. 5: 102. https://doi.org/10.3390/ph13050102