Article

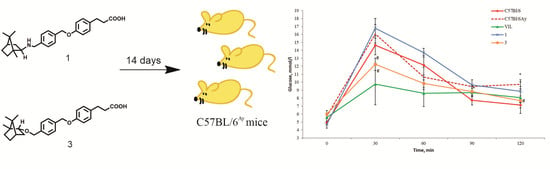
Bornyl Derivatives of p-(Benzyloxy)Phenylpropionic Acid: In Vivo Evaluation of Antidiabetic Activity

1
N. N. Vorozhtsov Institute of Organic Chemistry, Siberian Branch of Russian Academy of Sciences, 630090 Novosibirsk, Russia
2
Reasearch Center of Innovative Medicines, Laboratory for Information Technology in Pharmacology and Computer Modeling of Drugs, Volgograd State Medical University, Ministry of Health of Russian Federation, 400131 Volgograd, Russia
*
Authors to whom correspondence should be addressed.
Pharmaceuticals 2020, 13(11), 404; https://doi.org/10.3390/ph13110404
Submission received: 14 October 2020 / Revised: 12 November 2020 / Accepted: 16 November 2020 / Published: 19 November 2020

Abstract

:
A series of bornyl derivatives of p-(benzyloxy)phenylpropionic acid were prepared, and their hypoglycemic activities were examined by an oral glucose tolerance test in mice. The results of this test revealed two compounds, 1 and 3, that can reduce the blood level of glucose similarly to reference compound vildagliptin. Both compounds were tested in an experiment on mice with metabolic disorders: the C57BL/6Ay strain. Along with hypoglycemic properties, the two compounds showed different abilities to correct lipid metabolism disorders. In silico prediction revealed that the studied substances are most likely bifunctional multitarget hypoglycemic compounds whose mechanism of action is based on a pronounced reduction in insulin resistance and a strong incretin-mimetic effect. The difference in the size of effects of these compounds on biochemical parameters of blood in the experiment on C57BL/6Ay mice was in good agreement with the computational prediction of the priority ranking of biological targets for these compounds. These results indicate that bornyl derivatives of p-(benzyloxy)phenylpropionic acid have a good potential as new agents for diabetes mellitus treatment due to their hypoglycemic and lipid-normalizing properties.

Graphical Abstract

1. Introduction

Currently, global prevalence of diabetes mellitus among adults is 8.5%, and this figure is growing [1]. Diabetes mellitus is classified into type 1 diabetes mellitus and type 2 diabetes mellitus (T2DM), with the proportion of T2DM cases being almost 95%.
T2DM is a multisystem disease characterized by a disorder of many metabolic pathways, primarily carbohydrate metabolism. This disorder is caused by the body’s inability to use insulin to process glucose (i.e., insulin resistance). In the early stages of the disease, hyperglycemia contributes to the development of severe disturbances in insulin secretion. Uncompensated metabolism in T2DM leads to dyslipidemia with excessive concentrations of lipoproteins and lipids in the blood. Such metabolic disorders cause rapid progression of atherosclerosis and damage to the nervous system [2].
At T2DM diagnosis (usually accidental), patients already have complications of the disease in the form of visual impairment (retinopathy), kidney problems (micro- or macroproteinuria), and vascular lesions in the heart, brain, and lower extremities. The above complications are the main cause of death and high disability of T2DM patients. In addition, due to its chronicity, T2DM has become a costly disease for patients and their families as well as for the healthcare system [3,4]. Weight loss and lifestyle changes can partially suppress hyperglycemia [5], but antidiabetic drugs are needed to control glycemia and lipid levels [6]. The main adverse effects of modern oral antidiabetic agents include hypoglycemia, fluid retention, osteoporosis, and heart failure, which limit their clinical use. Therefore, the development of new antidiabetic candidate compounds for the control of various parameters of metabolic disturbances (hyperglycemia, hyperinsulinemia, and hypertriglyceridemia) with minimization of adverse effects remains the primary and most important task in the treatment of T2DM [7].
Medicinal preparations based on natural compounds are widespread in the pharmaceutical market [8] and often have a good safety profile and a milder (often prolonged) action and usually do not cause severe adverse effects and drug tolerance. Natural compounds are considered by researchers as potential therapeutic agents for diabetes mellitus [7]; however, only a small proportion of published research in the field of hypoglycemic agents is related to the targeted synthetic modification of natural metabolites.
In recent years, monoterpenoids have been reported to have antidiabetic effects. Various in vitro and in vivo data now suggest that despite their structural simplicity, monoterpenes hold promise as antidiabetic lead compounds either on their own or as part of structural moieties in complex compounds [9]. In particular, research has revealed that borneol has a beneficial effect on hyperglycemia along with antioxidant and antihyperlipidemic actions against streptozotocin-induced diabetes in rats in a dose-dependent manner [10].
Phenylpropanoic acid is a convenient structure for the synthesis of many targeted medicinal agents with hypoglycemic action [11]. In particular, substituted phenylpropanoic acids are agonists of receptors FFA4 [12], peroxisome proliferator-activated receptors (PPARs) [13] and protein tyrosine phosphatase 1B (PTP1B) inhibitors [14].
Previously, we have synthesized bornyl derivative 1 (Figure 1) containing a pharmacophoric fragment of phenylpropanoic acid, for which a significant hypoglycemic effect—noninferior to that of reference compound vildagliptin (VIL)—was demonstrated in an oral glucose tolerance test (OGTT) performed on mice, and affinity for one of the targets of diabetes therapy (free fatty acid receptor 1) was confirmed [15].
The aim of the present study was to synthesize structural analogs of compound 1 and to test them in vivo to identify new compounds with hypoglycemic activity and to assess the structure–activity relationship. As in vivo models, we used two mouse strains: C57BL/6 for hypoglycemic-action screening by the OGTT and C57BL/6Ay for evaluation of selected compounds’ effects on animals with obesity and impaired glucose tolerance. In this case, the OGTT, blood biochemical assays, and liver histology examinations were performed. In silico prediction methods were used to explain differences in the action of structural analogs.

2. Results

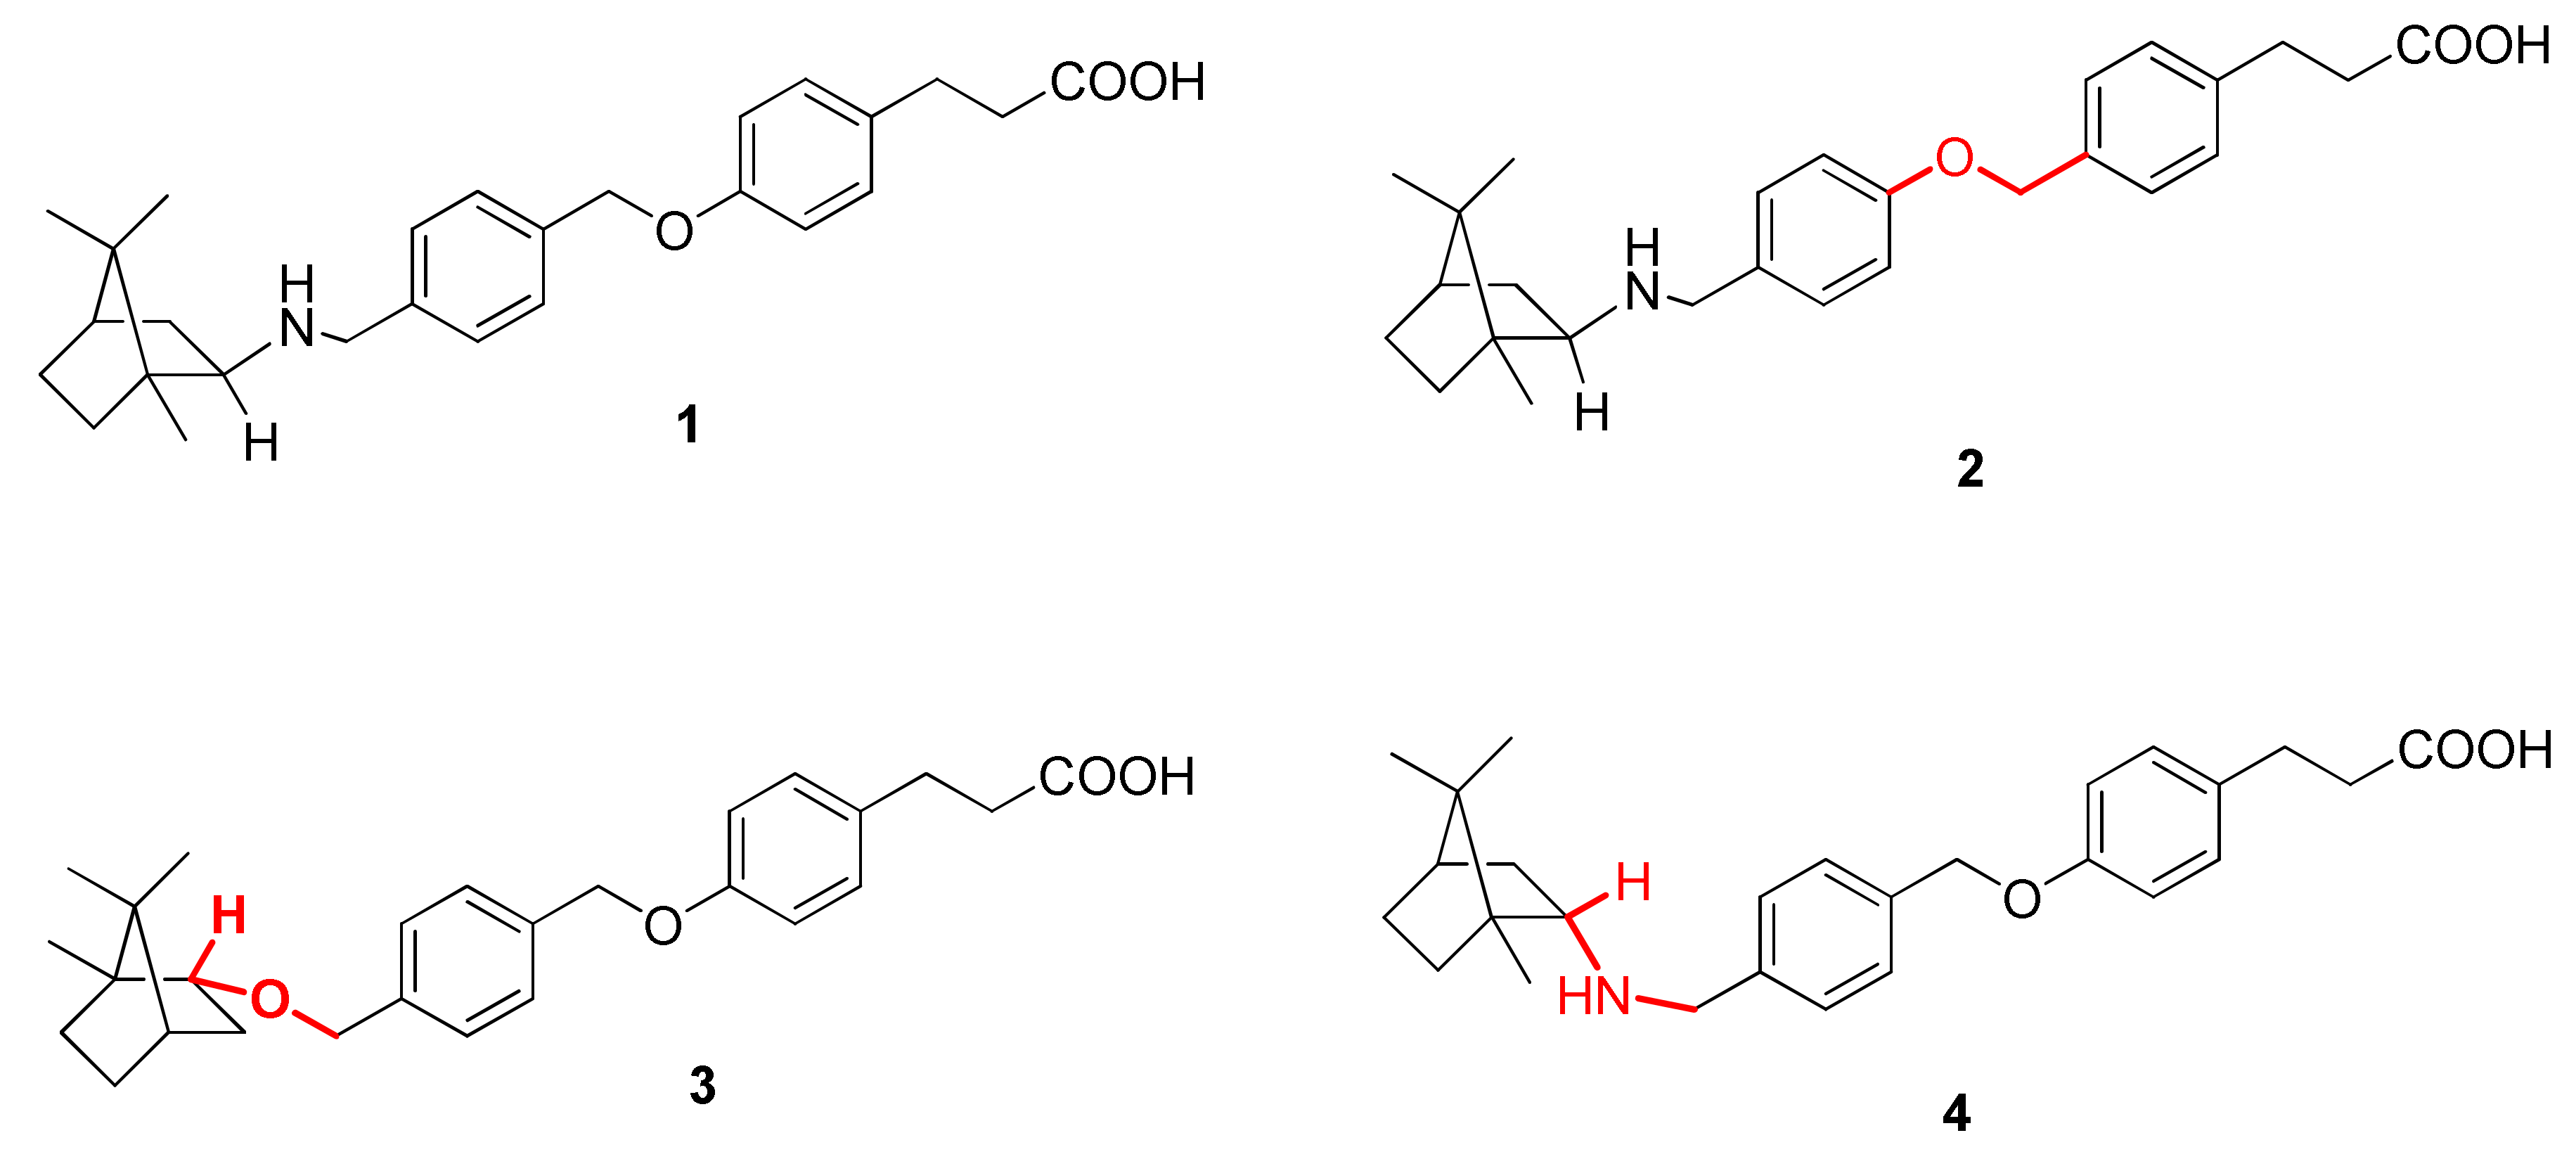
2.1. Compound Selection

To determine the influence of structural features on biological activity, compound 1 analogs (24) with structural differences (Figure 1) were synthesized in this work. We synthesized derivative 2, which features an unchangeable structure of a bornylamine substituent with an inverted structure of the oxymethylene linker. In a reaction with the natural compound borneol, derivative 3 was obtained in which a nitrogen atom was replaced by oxygen. As in compound 3, the hydroxyl group of borneol is at the endo-position of the bornyl core in contrast to the exo-position of the amino group of bornylamine in compound 1, we synthesized compound 4 (which shows the endo-configuration of the amino group) to reveal the impact of this center’s stereochemistry on biological activity.

2.2. Synthesis

The synthesis of compound 1, including the synthesis of key intermediate bromide 5, has been described in our other study [15].
Bromide 5 was reacted with endo-bornylamine 6 when heated in acetonitrile in the presence of N,N-diisopropylethylamine (DIPEA; Scheme 1). Compound 7 (methyl ether) was isolated with a yield of 67% after chromatography. Sequential treatment of compound 7 with lithium hydroxide in a mixture of methanol–THF–water (4:2:3, where THF is tetrahydrofuran) and diluted hydrochloric acid led to the formation of compound 4 as hydrochloride with a yield of 52%.
To obtain compound 3, bromide 5 was reacted with borneol 8 without a solvent in the presence of DIPEA and catalytic amounts of potassium iodide. Methyl ether 9 was isolated with a 41% yield after chromatography. Alkaline hydrolysis of methyl ether 9 was performed in the same way as described above; acid 3 was obtained in an 84% yield.
For the synthesis of compound 2 (it contains an inverse oxymethylene linker), we synthesized a new scaffold, 14 (Scheme 2). For this purpose, 4-hydroxybenzaldehyde 10 was reacted with 1,4-bis(bromomethyl)benzene 11 in acetone in the presence of potassium carbonate when heated, while bromaldehyde 12 formed with a yield of 62%. Resulting bromaldehyde 12 was reacted with diethylmalonate in THF in the presence of sodium hydride, and thus resulting in compound 13 with a yield of 67%. Krapcho decarboxylation of compound 13 with sodium chloride in aqueous dimethyl sulfoxide (DMSO) led to the formation of aldehyde 14 in a 78% yield. Reductive amination of aldehyde 14 with exo-bornylamine 6 led to amine 15 formation, hydrolysis of which by means of lithium hydroxide led to acid 2 in the form of hydrochloride with a yield of 44%.

2.3. In Silico Analysis

For the synthesized compounds, we made a computer prediction of a profile of targeted hypoglycemic activities towards relevant biotargets.
For comprehensive in silico evaluation of the compounds’ mechanism of hypoglycemic action, 24 key biotargets (Table 1) were chosen that had been verified in molecular pharmacology as important factors of diabetes pathogenesis [16,17,18].
Table 2 presents the indices of significance of the predicted biotargets, as calculated by a Microcosm BioS system [20,21] and reflecting the magnitude of the impact of the studied bornyl derivatives on these biotargets as well as structural similarity of these compounds to the nearest analogues from the quantitative structure–activity relationship (QSAR) base of standards.
To clarify the targeted nature of the antidiabetic activity of the studied compounds, they were docked into the binding sites of the three predicted most significant targets PPARD, FFAR1, and DPP4 (see Table 3).
Optimized 3D (three-dimensional) models of compounds were constructed by the methods of molecular mechanics and quantum chemistry sequentially in software MarvinSketch 17.1.23 [23] and MOPAC2016 [24].
Through a previously developed technique [25], three most valid experimental 3D models of the indicated Homo sapiens proteins were found: 3OZ0 for PPARD, 4PHU for FFAR1, and 3G0B for DPP4 [26].
Ensemble docking into specific sites of three valid models was performed using the AutoDock Vina 1.1.2 software [27] (10 conformers for each compound in 10 conformers five times in each site of each model, with the calculation of 50 obtained values of minimum docking energies ΔE).
A comparison of the calculated parameters of the level of targeted activity, obtained by the method of similarity to standards (Ind) and by the method of docking (ΔE), was performed by the entanglement method. This method, in contrast to correlation analysis (which reveals only linear continuous dependencies), allows the identification of any kind of relationship between two variables: linear or nonlinear, continuous or discrete.
In the present study, for each target k for each compound i, the value of each calculated indicator Indki or ΔEki was converted into binary estimates, in accordance with their position relative to the mean value, according to the following rules:
  • 1 if Indki > mean (Indki), 0 otherwise;
  • 1 if ΔEki < mean (ΔEki), 0 otherwise.
A comparison of the two obtained series of binary estimates was performed via Spearman’s nonparametric correlation test.
The results of the analysis are shown in Table 4.

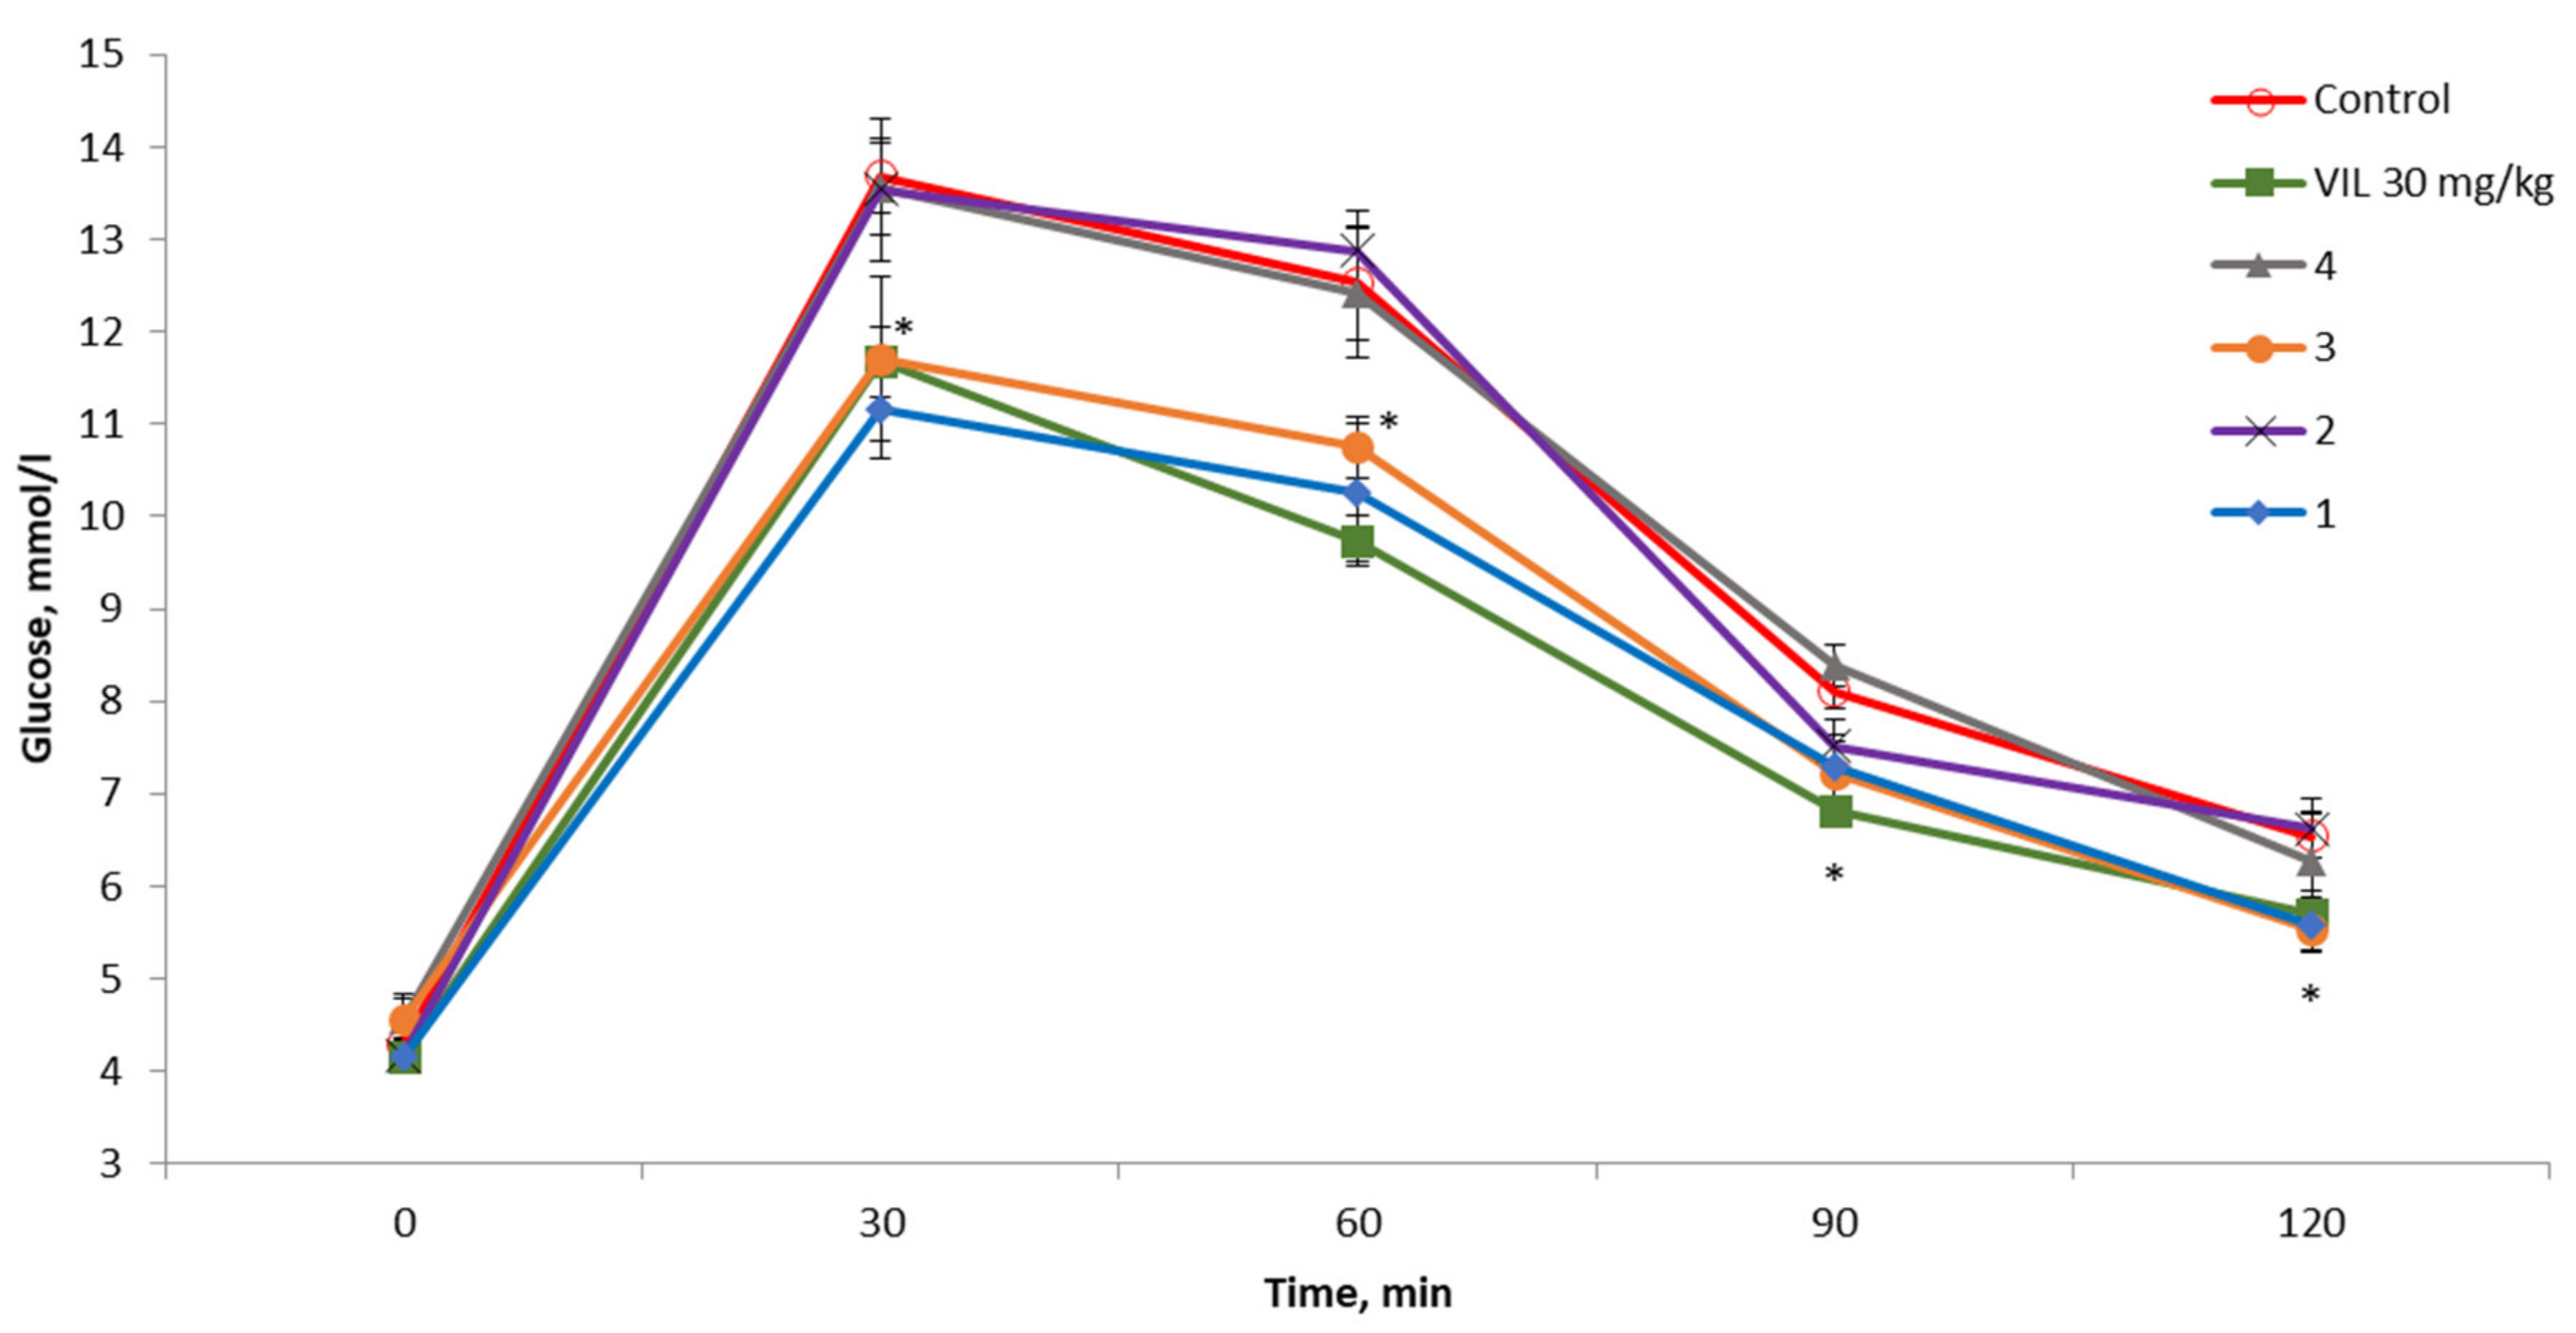
2.4. The OGTT in C57BL/6 Mice

Compounds 14 were evaluated by the OGTT in a dose of 30 mg/kg. It was found that compounds 1 and 3 have hypoglycemic activity that is noninferior to the comparison compound VIL (Figure 2). These substances were selected for further evaluation in C57BL/6Ay (hereafter: AY) mice.

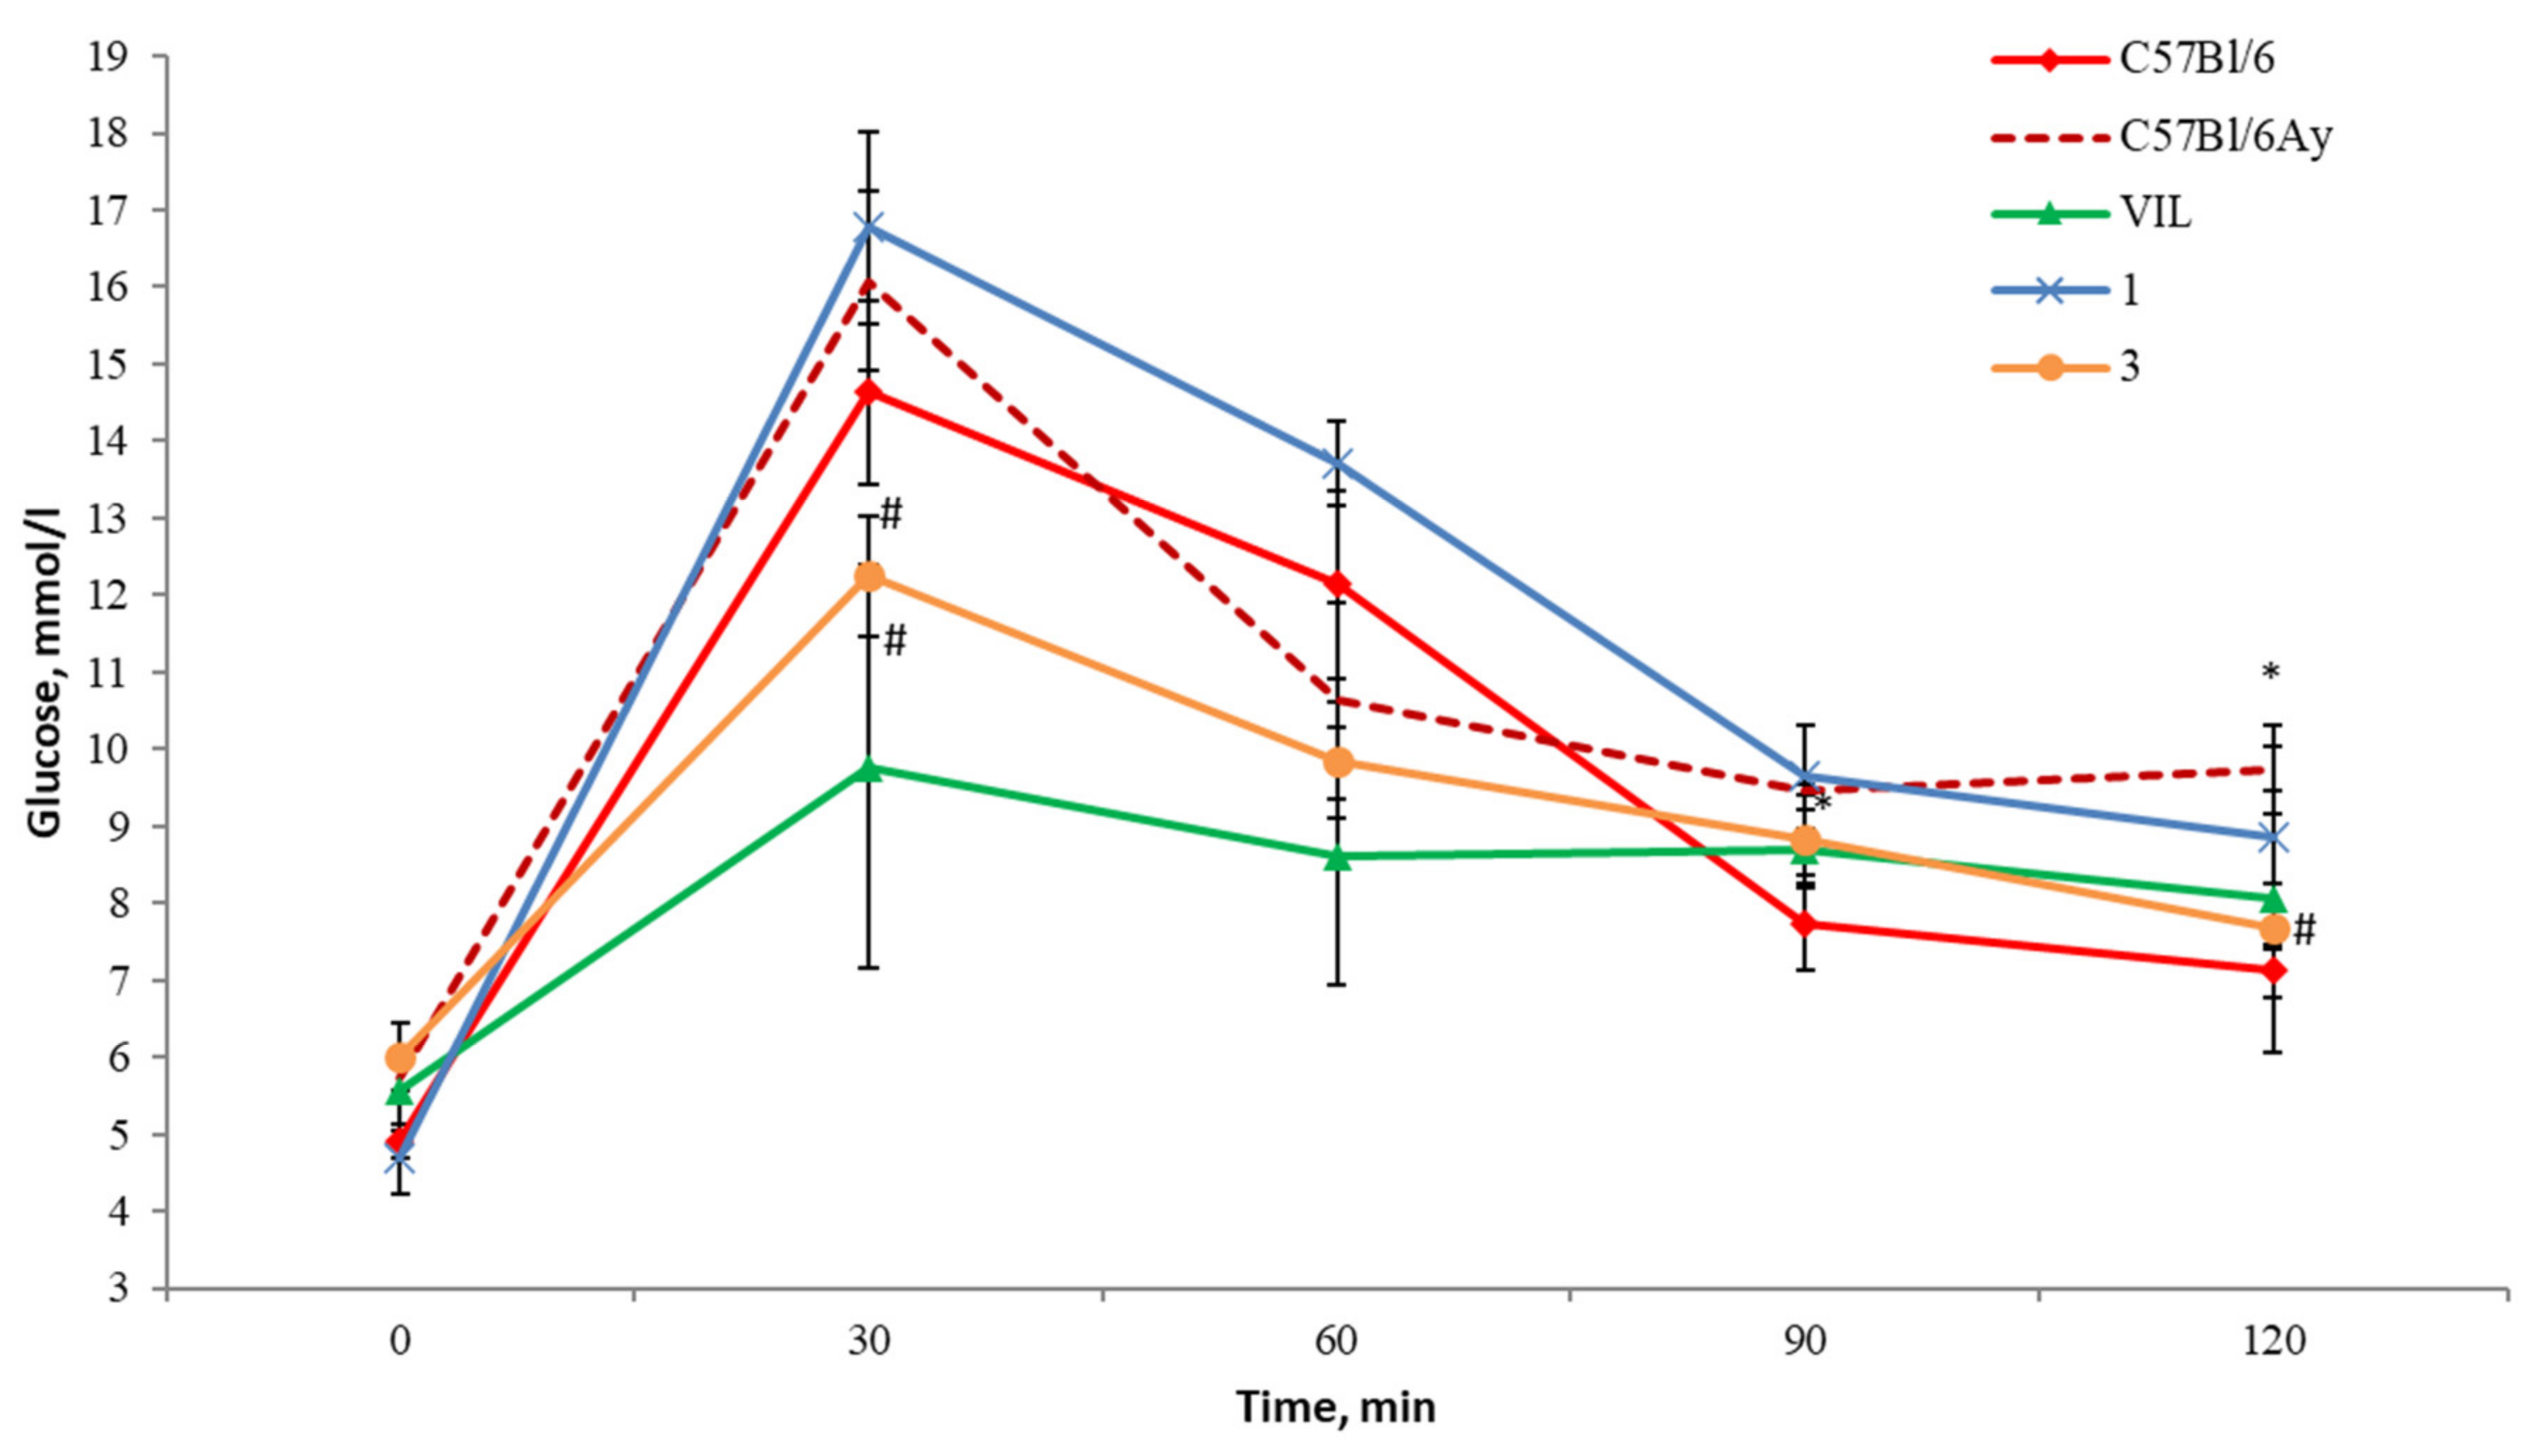
2.5. The OGTT in AY Mice

Compound 1 or 3 or a preparation of reference compound VIL was given intragastrically to male AY mice for 2 weeks. The mice were kept on a high-calorie diet for 2 months before the drug administration to accelerate obesity and to disturb glucose tolerance. After the first administration of a tested substance, the OGTT was immediately performed, and glucose tolerance was found to be impaired in AY mice (Figure 3), as evidenced by an increase in blood glucose levels at 90 and 120 min after the glucose administration as compared with untreated C57BL/6 mice.
The studied substances did not show a hypoglycemic effect. The glycemic profile after the administration of compound 3 virtually matched that of the untreated AY mice, whereas administration of compound 1 exerted a hyperglycemic effect by significantly increasing blood glucose concentration in these animals (Figure 3). In this experiment, a statistically significant decrease in blood glucose concentration was noted only in the positive control group (VIL; Figure 3).
After 14 days of administration, another OGTT was carried out, where it was found that glucose tolerance in untreated AY mice (Figure 4) remained abnormal.
At the same time, a significant hypoglycemic effect was detected in group three (treatment with compound 3), judging by a lower glycemic curve (Figure 4) and area under the glycemic curve (AUC) (Figure 5). The hyperglycemic effect of compound 1 decreased after the 2 week administration, but the total glucose level in these animals did not differ from that in the untreated AY group (Figure 5). The administration of VIL for 2 weeks also improved the results of the OGTT; there was a significant decrease in the blood glucose level in this group.

2.6. A Biochemical Blood Assay in Treated AY Mice

Two days after the last OGTT, the animals were decapitated, and blood was collected for biochemical testing.
Table 5 shows that compound 1 decreased cholesterol concentration in the blood of AY mice, according to a reduction in total cholesterol and high-density lipoprotein cholesterol; in addition, there was a significant decrease in blood glucose concentration. Compound 3 did not show such an effect. The biochemical profile of AY mice in the VIL group was generally similar to that in the untreated AY group.

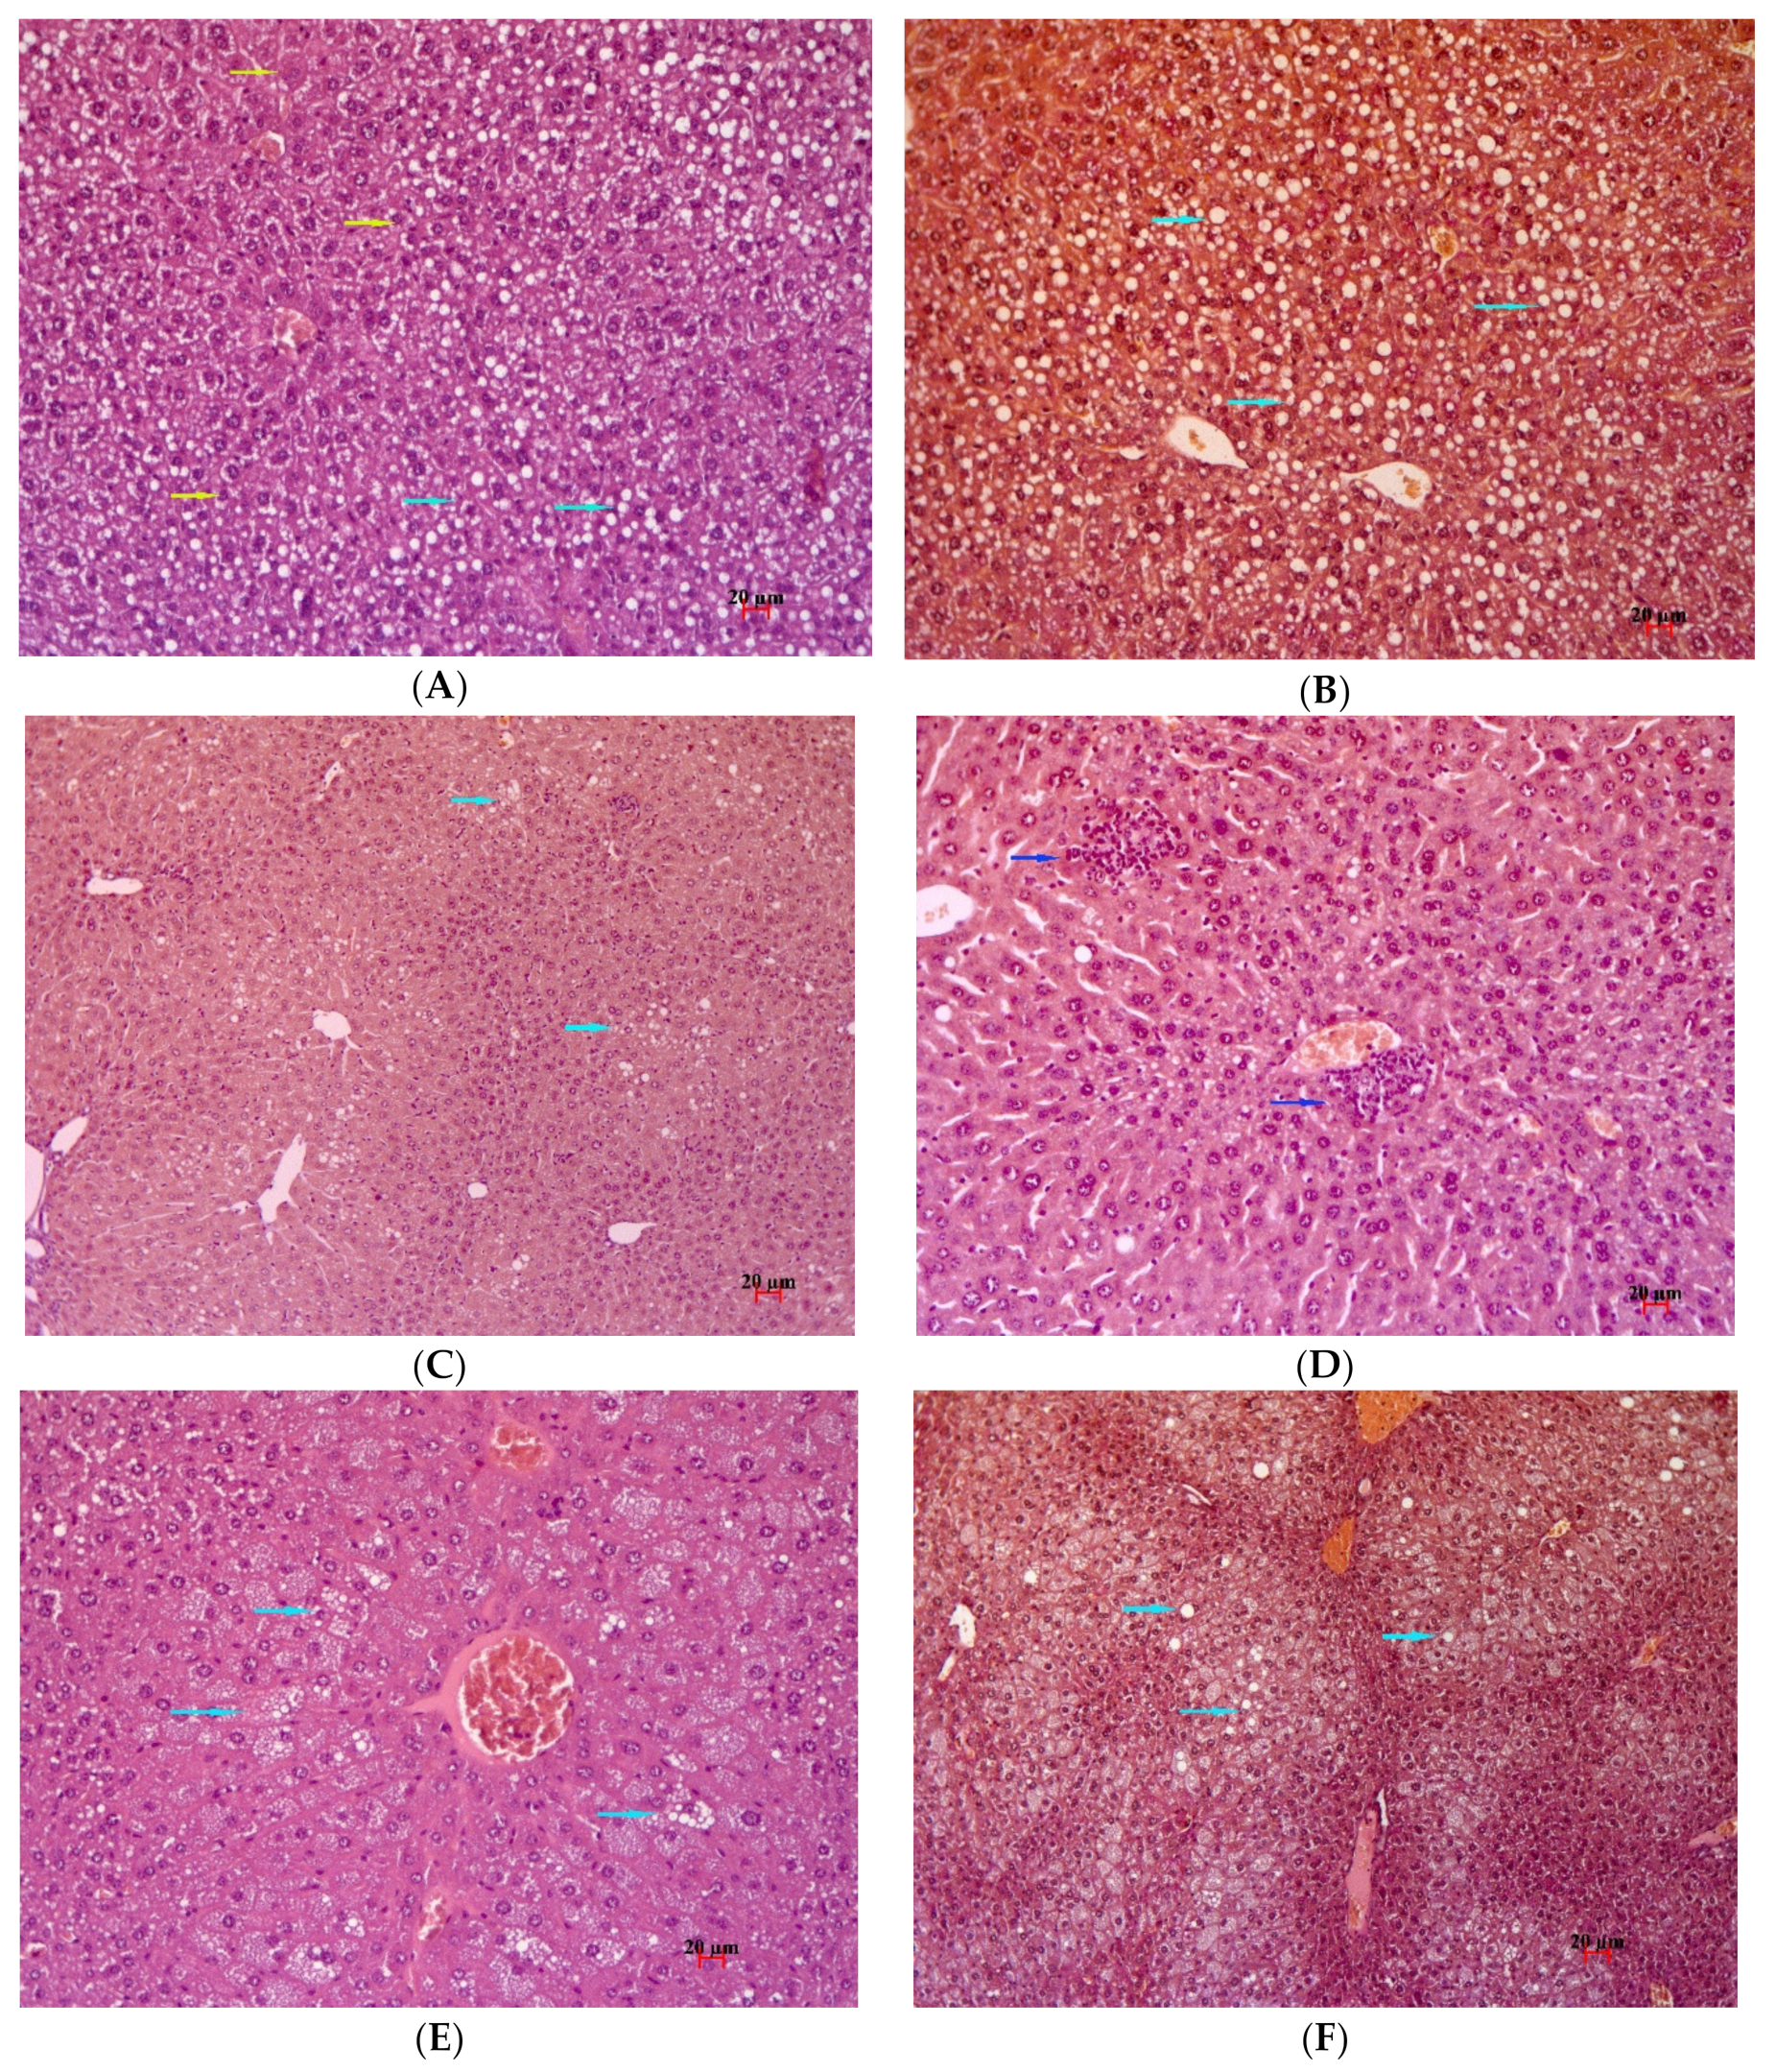
2.7. Histological Examination

At the end of the experiment, the liver was collected from the mice for histological examination. In untreated C57BL/6 mice, liver architectonics were found to be preserved; bile capillaries, veins, and arteries had typical structure, and there were no signs of pathological infiltration, necrosis, and fibrosis (Figure 6A). Dystrophic changes in the form of focal cytoplasm disruption were registered in hepatocytes of periportal zones, and nuclear polymorphism was often observed in hepatocytes. In sinusoids, Kupffer cells without signs of increased activity and stand-alone mononuclear leukocytes were detectable.
In the liver of AY mice in the untreated group, after 14 days, typical signs of damage were observed in the form of pronounced polymorphic lipid infiltration of hepatocytes (Figure 6B). All animals in this group showed signs of an increase in the regenerative activity of the liver, as evidenced by slight differences in nuclei and in hepatocyte size (different sizes of hepatocytes, nuclei, and intranuclear inclusions) and activated Kupffer cells (Figure 6C). Glycogen was not detectable in hepatocytes (Figure 6D).
In AY mice treated with VIL, no obvious signs of normalization of metabolic disturbances were observed. The prime sign of liver damage was well-pronounced polymorphic infiltration of hepatocytes with cellular and nuclear polymorphism (Figure 7A). In contrast to the untreated group of AY mice, fatty degeneration was localized mainly to the central zones of lobules. Activated Kupffer cells were found in sinusoids. Glycogen was not detectable in hepatocytes (Figure 7B).
In AY mice that received 1 for 14 days, there was alleviation of metabolic disturbances. Only one animal in this group manifested small-vesicle fat dystrophy (in small foci), which was localized to the central sections of lobules, and necrosis of hepatocytes in small foci was observed (Figure 7C). In other animals of this group, there were no obvious signs of metabolic disturbances. Activated Kupffer cells were found in sinusoids. Glycogen in hepatocytes was not detectable (Figure 7D).
AY mice treated with 3 for 14 days showed partial correction of the metabolic abnormalities. Fatty degeneration in this group was more pronounced than in the animals that received 1 for 14 days (Figure 7E). For the most part, small-vesicle fatty degeneration was observed in these mice. It should be noted that in all animals of this group, there was an increase in regenerative activity in the form of hypertrophy of hepatocytes with nuclear polymorphism. In sinusoids, enlarged Kupffer cells were seen. Additionally, a narrowing of sinusoidal lumens was visible, which was associated with hypertrophy of hepatocytes (Figure 7F). No glycogen was detectable in hepatocytes.

3. Discussion

In this study, we synthesized new bornyl derivatives of p-(benzyloxy)phenylpropionic acid. The new compounds have structural features that distinguish them from previously obtained compound 1, which manifested a hypoglycemic effect that is noninferior to the reference drug VIL in experiments on animal models [15]. Compound 2 has an inverted oxymethylene linker structure; in compound 3, the terpenoid fragment is linked to the p-(benzyloxy)phenylpropionic acid moiety by an oxygen atom instead of nitrogen. In a stereoisomer of compound 1, i.e., acid 4, the amino group of the bornyl part is located at the endo-position, in contrast to the exo-arrangement of the amino group in compound 1.
The evaluation of the synthesized compounds in the OGTT performed on C57BL/6 mice at a dose of 30 mg/kg showed that only compounds 1 and 3 have hypoglycemic activity. Both of them reduced blood glucose levels to ~15% at each time point after the glucose load. The size of the observed effect of these compounds was noninferior to that of the reference drug VIL. The obtained data indicate that both the change in the oxymethylene linker structure and the configuration of the amino group in the bornyl substituent have a significant influence on the hypoglycemic properties of these compounds.
Compounds 1 and 3 were selected for further characterization in an experiment on AY mice. These mice carry an autosomal spontaneous yellow mutation at the agouti locus (Ay mice), which causes uncontrolled and ubiquitous expression of the Agouti gene. The gene product, the Agouti protein, is a natural antagonist of melanocortin receptors, i.e., the mutation reduces the activity of melanocortin receptors in all cells of the body, thereby causing an increase in appetite and a decrease in energy expenditure. With age, AY mice develop obesity, T2DM, hyperglycemia, and hyperinsulinemia [28].
Our experiments on AY mice uncovered obvious differences in effects between compounds 1 and 3. The first administration of 3 caused no effect on the glycemic curve in the OGTT test. The 14 day administration improved glucose uptake, most likely due to a decrease in insulin resistance because the effect materialized only after 2 weeks of administration. Liver histological examination revealed alleviation (by treatment with 3) of the fatty degeneration but it was less pronounced than that of compound 1. By contrast, 1 after the first administration to AY mice caused pronounced elevation of the blood glucose level in the OGTT; this hyperglycemic effect significantly diminished after 14 days of treatment with 1 along with prominent liver function recovery.
To clarify the difference in the biological action between the studied compounds, the profiles of effects of the new bornyl derivatives on biotargets relevant to hypoglycemic properties were analyzed by in silico methods.
According to the in silico data (Table 2), the studied compounds have a significant effect on 12 out of the 24 analyzed biotargets. The average index of the activity level, IndMean, was ≥ 0 (not lower than the average), which indicates a pronounced multitargeting effect of these compounds. Eight of these 12 significant targets can be regarded as highly significant because IndMean was ≥1 (activity above average). Among these, one biotarget, PPARδ, is very highly significant, i.e., the bornyl derivatives have high activity towards this target.
It should be noted that high similarity coefficients, TMean ≥ 0.4 (highlighted in bold in Table 2), support the validity of the calculated indices of the activity level. In this context, the top six highly significant targets—PPARδ, FFAR1, DPP4, PYGL, PTPN1, and FFAR4—can be considered especially interesting.
A comparison of the data between Table 1 and Table 2 suggests that, in general, the studied bornyl derivatives exert a bifunctional multitarget effect with high significance; mainly, they decrease insulin resistance (five significant targets: PPARδ, FFAR1, PTPN1, FFAR4, and PPARα) and also have properties of incretin-mimetics (three significant targets: DPP4, GIPR, and GLP1R).
The sum of indices of the activity level for significant targets affecting insulin resistance and having the effect of incretin-mimetics, Σ IndMean, was 10.50, whereas the sum for 12 significant targets, Σ IndMean, was 14.77. This means that for the bornyl derivatives, this well-pronounced combined activity is the main multitarget mechanism behind their hypoglycemic effect.
It is also possible that the studied substances influence the processes of glycolysis and glycogen synthesis (two significant targets: PDK4 and PFKM), gluconeogenesis and glycogenolysis (one significant target: PYGL), and the degradation of poly- and oligosaccharides (one significant target: AMY2A), but these are minor multitarget hypoglycemic properties of the bornyl derivatives.
Compound 3 has 17 significant biotargets in the range of activity IndMean ≥ 0, among which 12 are very significant, with IndMean ≥ 1; the other three compounds have 12 and 8 such biotargets, respectively. Compound 3 is the only molecule for which there are two biotargets, PPARD and FFAR1, with IndMean > 3 (very highly active).
The sum of indices of the activity level for all biotargets, Σ IndMean, for compound 3 is 16.21, whereas for the other three compounds, this value ranges from 0.12 to −1.40. At the same time, for compound 3, the sum of indices of the activity level, Σ IndMean, for significant biotargets is 24.36, and for the other three structures, this index is in the range 14.21 to 15.36.
Among the 17 biotargets significant for compound 3, six affect insulin resistance and four cause incretin-mimetic actions. Thus, compound 3 can be considered a bifunctional multitarget hypoglycemic agent whose mechanism of action can be based on a pronounced ability to reduce insulin resistance and a strong incretin-mimetic effect.
A nonparametric analysis of the correlation of the two predictive parameters obtained by the method of similarity to standards (Ind) and by the docking method (ΔE) showed that there is a statistically highly significant interdependence between them (p = 9.06 × 10⁻³).
Thus, by the docking method, the present authors show the validity of the estimates obtained by the method of similarity to standards. Vice versa, the validity of the calculated estimates obtained by the docking method was confirmed by the results of the prediction by the method of similarity to standards. It should be emphasized that the calculated estimates of the effect on three significant biotargets obtained by the two methods for active substance 3 correlate very well:
For PPARD, the highest Ind value corresponds to the highest docking energy ΔE;
For FFAR1 also, the highest value of the Ind estimate corresponds to the highest docking energy ΔE;
For DPP4, the lowest value of the Ind estimate corresponds to the minimum docking energy ΔE.
Therefore, the results on the prediction of targeted activity indicate a high probability of interaction of compound 3 with a large number of biotargets responsible for a decrease in insulin resistance: peroxisome proliferator-activated receptor delta, free fatty acid receptor 1 (GPR40), peroxisome proliferator-activated receptor gamma, free fatty acid receptor 2 (GPR43), protein-tyrosine phosphatase 1B (PTP1B), and free fatty acid receptor 4 (GPR120). These calculation results are consistent with the less pronounced alleviation (compared with compound 1) of fatty degeneration of the liver during the administration of 3. The latter observation suggests that the liver condition improvement in these mice is due to the decrease in insulin resistance caused by 1 but is not a key factor leading to glucose metabolism improvement. The hypoglycemic effect seen in the OGTT during the selection of a lead compound in the experiment on C57BL/6 mice (without T2DM and without concomitant insulin resistance) is most likely due to the action of 3 on free fatty acid receptor 1 (GPR40), trace amine-associated receptor 1, and to a lesser extent dipeptidyl peptidase 4 [29,30]. The lack of effect after the first administration of 3 to AY mice is probably due to insufficient stimulation of the insulin release for overcoming insulin resistance in these mice [31]. According to the results of our biochemical assays, the fasting glucose level after 14 days of administration of 3 also tends to decrease, indicating the need for longer administration of this substance to obtain a reliable effect.
On the contrary, the predicted activity of compound 1 is more indicative of its incretin-mimetic effect because of the inhibition of DPP4 and activation of GPR40, while actions on the targets responsible for a decrease in insulin resistance are much less likely. These data can explain the effect of 1 in the OGTT performed on normal mice free of T2DM and of insulin resistance [15]. Its hyperglycemic action in the OGTT in AY mice may be mediated by the action of glucose-dependent insulinotropic polypeptide (GIP), which is a DPP4 substrate and its concentration increases when DPP4 is inhibited [30]. It is known that GIP not only stimulates the secretion of insulin but also promotes the release of glucagon, which induces an increase in glucose production in the liver. During DPP4 deficiency (inhibition or a knockout in mice), the sensitivity of pancreatic β-cells to this hormone may diminish, and as a result, insulin secretion may decrease, which, along with the action of glucagon and fatty liver disease, raises blood glucose levels [32]. In addition, it is known that the effect of VIL, a selective DPP4 inhibitor, can decrease with increasing doses; this phenomenon is also related to stronger inhibition of the enzyme not only in blood plasma but also, for example, in the wall of blood vessels of the pancreas [33]. The reason for this is that DPP4 that is dissolved in the blood may originate from endothelial or epithelial cells and from circulating leukocytes [32]. The observed decrease in this effect after 14 days of treatment with 1 is most likely associated with attenuated severity of fatty degeneration of the liver; this change can normalize liver function, restore insulin sensitivity, and normalize lipid metabolism. The mechanism underlying this effect may be partially due to PPAR-α activation as well as to actions on other targets that have not been evaluated in this work. In our experiment, VIL at a dose of 30 mg/kg inhibited DPP4 apparently only in blood plasma, and this phenomenon did not lead to DPP4 deficiency and the above-mentioned compensatory effect of GIP. The 14 day administration of VIL, in contrast to compounds 1 and 3, had no impact on fatty degeneration of the liver in AY mice, and thus once again confirming the multitarget effect of 1 and 3. In the future, it is necessary to conduct additional experiments for elucidating the mechanisms of action of 1 and 3 including measurement of insulin and levels of in silico-predicted target proteins.

4. Materials and Methods

4.1. Chemistry

1H and 13C NMR spectra were acquired on Bruker spectrometers AV-400 at 400.13 MHz (1H) and 100.61 MHz (13C), AV-600 at 600.30 MHz (1H) and 150.95 MHz (13C) in deuterated chloroform (CDCl3) or deuterated dimethyl sulfoxide (DMSO-d6); chemical shifts δ in parts per million (ppm) were measured relative to residual CHCl3 [δ(CHCl3) 7.26, δ(CHCl3) 77.00 ppm] or DMSO-d6 [δ(DMSO-d6) 2.50, δ(DMSO-d6) 39.51 ppm], and J was measured in Hertz. The attached proton test (APT) modification of the J-modulated spin-echo (JMOD) experiment was performed. The structure of the products was determined by means of 1H and 13C NMR spectra. Optical rotation was measured on a polar 3005 spectrometer (CHCl3 solution). High-resolution mass spectrometry (HRMS) was conducted using a DFS Thermo Scientific spectrometer in full scan mode (m/z 15–500, 70 eV electron impact ionization, and direct sample injection). Column chromatography was performed on silica gel (60–200 mesh, Macherey-Nagel). Infrared spectra (IR) were measured on a Vector 22 FTIR spectrometer in potassium bromide (KBr) pellets. All the compounds reported in this paper had purity of at least 95%. Spectral and analytical measurements were carried out at the Multi-Access Chemical Service Center of Siberian Branch of Russian Academy of Sciences (SB RAS).
Exo-bornylamine (exo-6), bromide 5, and compound 1 were synthesized according to the procedure described previously [9]. Endo-bornylamine (endo-6) was isolated as a minor isomer during exo-bornylamine purification by column chromatography. The structure of the obtained compounds was established in an analysis of the NMR spectra in accordance with ref. [34].
NMR spectra for compounds 2-4 and 12-15 are presented in the Supplementary (Figure S1–S13).
All reagents were analytically pure and were used as received without purification. In addition, 1,4-Bis(bromomethyl)benzene 11 (97%) and sodium hydride (60% dispersion in mineral oil) were bought from Acros organics. DIPEA and 4-hydroxybenzaldehyde were acquired from Carl Roth®®. Borneol was purchased from the Pilot Plant Department of the Novosibirsk Institute of Organic Chemistry SB RAS. Solvents were distilled prior to use: THF by distillation from sodium/benzophenone under nitrogen, whereas dichloromethane and acetonitrile were distilled from phosphorus pentoxide.

4.1.1. General Procedure for Hydrolysis

To a stirred mixture of ester (1.0 mmol) in 0.5 mL of methanol, 1.0 mL of THF, and 1.0 mL of water, we added solid LiOH monohydrate (2.2 mmol) at 0 °С. The reaction mixture was stirred at room temperature for 4 h. Methanol and THF were distilled off in vacuum, 5 mL of water was added to the residue, and 2 M hydrochloric acid was added with cooling to adjust pH to 2–3. The precipitate was filtered off and washed with distilled water.

4.1.2. 3-(4-((4-(((1R,2R,4R)-1,7,7-Trimethylbicyclo[2.2.1]heptan-2-ylamino)methyl)- phenoxy)methyl)phenyl)propanoic acid hydrochloride 2

Acid 2 was synthesized from ester 15. White solid, yield 44%. Melting point (m.p.) (decomposition) 154.2 °C. [α]D27 −41 (c 0.147, EtOH). HRMS for C27H35O3N+ m/z calcd. [M]+ 421.2612, found 421.2617. IR (KBr, cm−1): ν 833, 1012, 1250, 1383, 1419, 1516, 1612, 1707. 1H NMR (300 MHz, DMSO-d6): δ 0.77 (3Н, s), 0.85–1.07 (8H, m), 1.39–1.76 (4H, m), 2.04 (2H, d, J = 9.5), 2.50–2.60 (2Н, t, J = 7.5), 2.77–2.91 (3Н, m), 3.90–4.09 (2Н, d), 5.02–5.12 (2Н, s), 7.02 (2Н, d, J = 8.3), 7.19–7.28 (2Н, d), 7.34 (2H, d, J = 7.9), 7.55 (2H, d, J = 7.8), 8.35–9.98 (2Н, br.s, NH2+). 13C NMR (101 MHz, DMSO-d6): δ 11.9, 20.1, 20.4, 26.5, 30.1, 33.7, 35.2, 36.3, 44.4, 46.7, 48.4, 50.3, 64.2, 69.0, 114.7 (2C), 127.9 (2C), 128.3 (2C), 131.5 (2C), 134.6, 140.6, 158.1, 173.8. Found, %: Cl 7.82. C27H36O3NCl. Calcd, %: Cl 7.74.

4.1.3. 3-(4-(4-(((1S,2R,4R)-1,7,7-Trimethylbicyclo[2.2.1]heptan-2-yloxy)methyl)- benzyloxy)phenyl)propanoic acid 3

Acid 3 was synthesized from ester 9. White solid, yield 65%. M.p. (decomposition) 136.7 °C. [α]D25 −25 (c 0.130, CHCl3). HRMS for C27H34O4+ m/z calcd. [M]+ 422.2452, found 422.2456. IR (KBr, cm−1): ν 810, 827, 1124, 1248, 1514, 1707. 1H NMR (400 MHz, CDCl3): δ 0.81–0.94 (9Н, m), 1.10 (1H, d.d, J = 13.0, 3.2), 1.19–1.31 (2Н, m), 1.62–1.77 (2Н, m), 2.04–2.19 (2Н, m), 2.61–2.69 (2Н, t, J= 7.6), 2.90 (2H, t, J = 7.7), 3.66–3.74 (1Н, m), 4.42–4.49 (1Н, m), 4.55–4.62 (1Н, m), 5.03 (2Н, s), 6.91 (2H, d, J = 8.5), 7.13 (2H, d, J = 8.5), 7.33–7.43 (4Н, m). 13C NMR (75 MHz, CDCl3): δ 14.0, 18.9, 19.8 (2C), 26.8, 28.3, 29.7, 35.7, 36.1, 45.0, 47.9, 49.3, 69.9, 71.2, 84.4, 114.9 (2C), 127.4 (2C), 127.4 (2C), 129.2 (2C), 132.5, 135.9, 139.3, 157.4, 178.4.

4.1.4. 3-(4-(4-(((1R,2S,4R)-1,7,7-Trimethylbicyclo[2.2.1]heptan-2-ylamino)methyl)- benzyloxy)phenyl)propanoic acid hydrochloride 4

Acid 4 was synthesized from ester 7. White solid, yield 55%. [α]D25 +19 (c 0.308, CHCl3). HRMS for C27H34O4+ m/z calcd. [M]+ 421.2612, found 421.2610. 1H NMR (400 MHz, DMSO-d6): δ 0.70 (3H, s), 0.80 (3H, s), 0.88 (3H, s), 1.21 (1H, m), 1.33–1.49 (2H, m), 1.60–1.76 (3H, m), 1.87–1.99 (1H, m), 2.44–2.54 (2H, m), 2.73 (2H, t, J = 7.1), 3.08 (1H, br. s.), 4.04–4.25 (2H, m), 5.10 (2H, br. s.), 6.90 (2H, d, J = 7.9), 7.12 (2H, d, J = 7.9), 7.48 (d, J = 7.4), 7.64 (2H, d, J = 7.5), 8.86 (1H, br. s.), 9.41 (1H, br. s.), 11.93–12.23 (1H, br. s.). 13C NMR (75 MHz, DMSO-d6): δ 13.1, 18.1, 19.0, 26.9, 27.2, 29.5, 32.2, 35.5, 43.5, 48.1, 48.8, 49.7, 62.3, 68.7, 114.7 (2C), 127.7 (2C), 129.2 (2C), 130.6 (2C), 131.1, 133.1, 138.1, 156.5, 173.8. Found, %: Cl 7.87. C27H36O3NCl. Calcd, %: Cl 7.74.

4.1.5. Methyl 3-(4-(4-(((1R,2S,4R)-1,7,7-trimethylbicyclo[2.2.1]heptan-2-ylamino)- methyl)phenethyl)phenyl)propanoate 7

A solution of bromide 5 (1.18 mmol), amine endo-6 (1.46 mmol), and N,N-diisopropylethylamine (2.01 mmol) in acetonitrile (7 mL) was refluxed for 2 h. Ethyl acetate (20 mL) and a 5% sodium hydroxide solution (10 mL) were added. The organic layer was separated, and the aqueous layer was extracted with ethyl acetate (2 × 10 mL). Combined organic layers were washed with water (10 mL) and brine (10 mL) and were dried over magnesium sulfate. The solvent was evaporated in vacuum, and the residue was purified by silica gel column chromatography using chloroform–methanol 100:1. White solid, 52% yield. M.p. 84.5–87.1 °C. HRMS for C28H37O3N+ m/z calcd. [M]+ 435.2768, found 435.2765. 1H NMR (300 MHz, CDCl3): δ = 7.41–7.33 (4H, m), 7.11 (2H, d, J = 8.6), 6.92–6.88 (2H, m), 5.02 (2H, s), 3.90–3.83 (1H, m), 3.77–3.70 (1H, m), 3.67 (3H, s), 2.94–2.83 (3H, m), 2.65–2.57 (2H, m), 2.22–2.09 (1H, m), 1.85 (1H, d.d.d, J = 4.2, 8.9, 12.6), 1.79–1.59 (2H, m), 1.34–1.13 (3H, m), 0.91–0.81 (10H, m). 13C NMR (101 MHz, CDCl3): δ 14.3, 18.7, 19.8, 27.4, 28.4, 30.1, 35.9, 38.0, 45.0, 48.3, 48.8, 51.6, 52.8, 62.6, 69.9, 114.8 (2C), 127.5 (2C), 128.2 (2C), 129.2 (2C), 132.8, 135.4, 141.1, 157.3, 173.4.

4.1.6. Methyl 3-(4-(4-(((1S,2R,4R)-1,7,7-trimethylbicyclo[2.2.1]heptan-2-yloxy)methyl)- benzyloxy)phenyl)Propanoate 9

A mixture of borneol 8 (1.2 mmol), bromide 5 (242 mg, 0.8 mmol), diisopropylethylamine (490 μL, 2.4 mmol), and potassium iodide (1 mg, 0.03 mmol) was stirred in an inert atmosphere at 150 °С for 1 h. The mixture was cooled, 10 mL of ethyl acetate was added, and the obtained solution was washed successively with 2 mL of water and 2 mL of brine. The organic phase was separated and dried over magnesium sulfate. The latter was filtered off, and the solvent was evaporated under reduced pressure. The residue was purified by column chromatography (eluent: chloroform). White powder, yield 41%. M.p. 66.5–68.4 °C. [α]D25 +32 (c 0.137, CHCl3). HRMS for C28H36O4+ m/z calcd. [M]+ 436.2608, found 436.2620. IR (KBr, cm−1): ν 829, 1171, 1514, 1732. 1H NMR (400 MHz, CDCl3): δ 0.84 (3H, s), 0.86 (3H, s), 0.89–0.94 (3H, с), 1.10 (1H, d.d, J = 13.0, 3.2), 1.20–1.31 (2H, m), 1.63–1.78 (2H, m), 2.07–2.19 (2H, m), 2.60 (2H, t, J = 7.7), 2.90 (2H, t, J = 7.7), 3.66–3.73 (4H, m), 4.46 (1H, d, J = 12.2), 4.58 (1H, d, J = 12.2), 5.03 (2H, s), 6.90 (2H, d, J = 8.6), 7.11 (2H, d, J = 8.5), 7.34–7.42 (4H, m). 13C NMR (126 MHz, CDCl3): δ 14.0, 18.9, 19.8 (2C), 26.8, 28.3, 30.1, 35.9, 36.1, 45.1, 47.9, 49.3, 51.5, 69.9, 71.3, 84.4, 114.9 (2С), 127.4 (2С), 127.4 (2C), 129.2 (2C), 132.9, 136.0, 139.4, 157.4, 173.3.

4.1.7. 4-(4-(Bromomethyl)benzyloxy)benzaldehyde 12

A solution of hydroxyaldehyde 10 (620 mg 3.4 mmol) and potassium carbonate (1.30 g, 9.4 mmol) in 10 mL of acetone was refluxed with stirring for 1 h. The resulting solution was cooled to room temperature and decanted into a dropping funnel, and the volume of the solution was brought to 40 mL. Then, 1,4-Bis(bromomethyl)benzene 11 (3.58 g, 13.6 mmol) in acetone (150 mL) was added to the residue. With stirring, the previously obtained solution of hydroxyaldehyde 10 in acetone was added dropwise to a boiling solution of 1,4-bis(bromomethyl)benzene for 2 h. After all the solution was added, the reaction mixture was refluxed for another 2 h. The solution was cooled to room temperature, and the precipitate was filtered off. The precipitate was washed twice with 20 mL of chloroform. The combined filtrates were evaporated in a rotary evaporator, and the residue was recrystallized from acetone to isolate an excess of 1,4-bis-(bromomethyl)benzene. The mother liquor was evaporated, and the residue was purified by column chromatography (hexane–ethyl acetate 20:1 → 9:1). White solid, yield 62%. 1H NMR (400 MHz, CDCl3): δ 4.51 (2H, s), 5.14 (2H, s), 7.07 (2H, d, J = 8.6), 7.38–7.48 (4H, m), 7.84 (2H, d, J = 8.7), 9.89 (1H, s).

4.1.8. Diethyl 2-(4-((4-Formylphenoxy)methyl)benzyl)malonate 13

To an ice-cooled suspension of sodium hydride (76 mg, 1.9 mmol) in 5 mL of THF, diethyl malonate (500 μL, 3.3 mmol) was added dropwise with stirring. After 1 h, a solution of bromaldehyde 12 (477 mg, 1.6 mmol) in 2 mL of THF was added dropwise. After 2 h, the mixture was poured into 30 mL of ethyl acetate and washed through 10 mL of 2 M hydrochloric acid, 10 mL of water, and 10 mL of brine. The organic phase was dried with magnesium sulfate. The latter was filtered off, and the solvent was evaporated under reduced pressure. The residue was purified by column chromatography (hexane–ethyl acetate 4:1). Colorless liquid, yield 67%. HRMS for C22H24O6+ m/z calcd. [M]+ 384.1567, found 384.1564. IR (neat, cm−1): ν 1159, 1228, 1254, 1601, 1693, 1732, 1747. 1H NMR (500 MHz, CDCl3) δ 1.20 (6H, t, J = 7.1), 3.23 (2H, d, J = 7.7), 3.64 (1H, t, J = 7.9), 4.10–4.21 (4H, m), 5.11 (2H, s), 7.06 (2H, d, J = 8.7), 7.24 (2H, d, J = 8.0), 7.34 (2H, d, J = 8.0), 7.83 (2H, d, J = 8.7), 9.88 (1H, s). 13C NMR (126 MHz, CDCl3): δ 14.0, 34.3, 53.7, 61.5 (2C), 70.0, 115.1 (2C), 127.7 (2C), 129.2 (2C), 130.1, 131.9 (2C), 134.4, 138.2, 163.7, 168.7 (2C), 190.7.

4.1.9. Ethyl 3-(4-((4-Formylphenoxy)methyl)phenyl)propanoate 14

A solution of 13 (1.67 g, 4.3 mmol), sodium chloride (0.38 g, 6.5 mmol), and water (0.12 mL, 6.5 mmol) in 5 mL of dimethyl sulfoxide was refluxed for 4 h. After the completion of the reaction, the mixture was poured into 40 mL of ethyl acetate and washed successively with water (2 × 10 mL) and brine (10 mL). The organic phase was dried with magnesium sulfate, which was next filtered off, and the solvent was evaporated under reduced pressure. The residue was purified by column chromatography (eluent: hexane–ethyl acetate 4:1). White solid, yield 78%. M.p. 36.1–36.4 °С. HRMS for C19H20O4+ m/z calcd. [M]+ 312.1356, found 312.1360. IR (KBr, cm−1): ν 835, 1163, 1255, 1578, 1603, 1689, 1718, 1728. 1H NMR (400 MHz, CDCl3): δ 1.23 (3H, t, J = 7.1), 2.62 (2H, t, J = 7.8), 2.96 (2H, t, J = 7.7), 4.12 (2H, q, J = 7.1), 5.10 (2H, s), 7.06 (2H, d, J = 8.7), 7.24 (2H, d, J = 8.1), 7.35 (2H, d, J = 8.1), 7.79–7.86 (2H, m), 9.87 (1H, s). 13C NMR (126 MHz, CDCl3): δ 14.2, 30.6, 35.7, 60.4, 70.1, 115.1 (2C), 127.8 (2C), 128.7 (2C), 130.1, 131.9 (2C), 133.8, 140.8, 163.7, 172.7, 190.7.

4.1.10. Ethyl 3-(4-((4-(((1R,2R,4R)-1,7,7-Trimethylbicyclo[2.2.1]heptan-2-ylamino)methyl)- phenoxy)methyl)phenyl)propanoate 15

Sodium triacetoxyborohydride (406 mg, 1.92 mmol) was added to a mixture of aldehyde 14 (325 mg, 1.0 mmol), amine exo-6 (1.3 mmol), and acetic acid (58 μL, 1.0 mmol) in 10 mL of methylene chloride. The reaction mixture was stirred at room temperature for 5 h. Then, 10 mL of chloroform was added, and the resulting solution was washed sequentially with 5 mL of 5% sodium hydroxide, 5 mL of water, and 5 mL of brine and was dried over anhydrous magnesium sulfate. The latter was filtered off, and the solvent was evaporated under reduced pressure. The residue was purified by column chromatography (eluent: chloroform–methanol 20:1). Colorless oil, yield 77%. [α]D25 −52 (c 0.137, CHCl3). HRMS for C29H39O3N+ m/z calcd. [M]+ 449.2925, found 449.2926. IR (neat, cm−1): ν 822, 1173, 1240, 1510, 1736. 1H NMR (500 MHz, CDCl3): δ 0.87 (3H, s), 0.93 (3H, s), 1.08–1.15 (5H, m), 1.17–1.22 (1H, m), 1.25–1.30 (3H, m), 1.50–1.78 (5H, m), 2.65 (3H, q, J = 7.6), 2.99 (2H, t, J = 7.7), 3.59 (1H, d, J = 13.1), 3.75 (1H, d, J = 13.1), 4.17 (2H, q, J = 7.2), 5.04 (2H, s), 6.95 (2H, d, J = 7.0), 7.23–7.29 (4H, m), 7.38 (2H, d, J = 7.5). 13C NMR (126 MHz, CDCl3): δ 12.1, 14.1, 20.5, 20.5, 27.3, 30.6, 35.7, 36.8, 38.8, 45.3, 46.6, 48.3, 52.0, 60.2, 66.2, 69.8, 114.5 (2C), 127.6 (2C), 128.4 (2C), 129.0 (2C), 133.8, 135.1, 140.2, 157.6, 172.6.

4.2. Biological Experiments

Statistical analysis was performed by the Mann–Whitney U test. Data are shown as mean ± SEM. Data with p < 0.05 were considered statistically significant.

4.2.1. Animals

Male C57BL/6 and AY mice weighing 22–25 g were obtained from the specific pathogen-free animal facility of the Institute of Cytology and Genetics SB RAS. The animals were kept under standard conditions with free access to water and feed in humidity-and-temperature–controlled rooms on a 12/12 h light-and-dark cycle. All manipulations with animals were carried out in strict accordance with the laws of the Russian Federation, a decree of the Ministry of Health of the Russian Federation no. 199n of 4 January 2016, and Directive 2010/63/EU of the European Parliament and of the Council of the European Union of 22 September 2010 on the protection of animals used for scientific purposes. The protocol of the animal experiment was approved by the Ethics Committee of N.N. Vorozhtsov Institute of Organic Chemistry SB RAS (protocol no. P-12-122019-14).

4.2.2. The OGTT

The test was performed on mice after a 12 h fast (n = 6 in each group). Oral glucose loading (2.5 g/kg) was done in all the groups of mice. Prior to dissolution in water, all compounds were mixed with two drops of Tween 80. VIL tablets (Galvus, Novartis Farmaceutica SA, Barcelona, Spain) were dissolved in water. The tested compounds were given by oral gavage 30 min prior to the glucose load. Blood glucose was quantified with a ONE TOUCH Select blood glucose meter (LIFESCAN Inc., Milpitas, CA, USA) before dosing (time 0) and at 30, 60, 90, and 120 min after the glucose load. The area under the glycemic curve was calculated using Tai’s model [35].

4.2.3. The Design of the Experiment on AY Mice

The mice were fed standard chow plus lard and cookies ad libitum for 60 days until they gained body weight more than 35 g. After that, the following groups were set up: 1) AY mice + compound 1 30 mg/kg, 2) AY mice + compound 3 30 mg/kg, 3) AY mice + VIL 30 mg/kg, 4) AY mice + vehicle (water + 2 drops of Tween 80), and 5) untreated C57BL/6 mice. Each group consisted of 8 animals. The diet stayed the same until the end of the experiment. All compounds were administered by oral gavage once a day. OGTT was performed on the first and 14th days of the experiment. At the end of the experiment (16 days), blood was drawn for biochemical assays, and the liver was excised for histological evaluation.

4.2.4. Biochemical Assays

After 16 days of treatment, mice were euthanized, blood was collected from the jugular vein, and serum was separated by centrifugation at 1640× g for 15 min. Serum total cholesterol, total triglycerides, high-density and low-density lipoprotein cholesterol, and glucose levels were quantified in all groups using standard diagnostic kits (Vector-Best, Novosibirsk, Russia) and a Stat Fax 3300 spectrophotometer (Awareness Technology Inc., Palm City, FL, USA).

4.2.5. Histological Examination

Each liver was fixed in 10% neutral buffered formalin for 7 days, then standard dehydration in ascending ethanol concentrations and xylene was carried out, and the specimens were embedded in paraffin on an AP 280 workstation using Histoplast (Thermo Fisher Scientific, Waltham, MA, USA) with a melting point of 58 °C. Tissue slices with a thickness of 4.5 μm were prepared on a rotational NM 335E microtome with disposable interchangeable blades. The slices were stained with periodic acid–Schiff, hematoxylin and eosin, and orange G and examined under a light microscope at a magnification of ×100–200.

4.3. Computational Analyses

The prediction of activity towards the biotargets that determine hypoglycemic activity of phenylpropanoic acid derivatives was performed by the 2D (two-dimensional) structural similarity method using the Microcosm BioS v20.6.6 system (June 2020), which includes the original QSAR database containing verified and processed information on the chemical structure and activity levels of 625,888 known compounds studied by the international scientific community for 11,509 types of targeted biological activity [19]. Preprocessing of structural information was carried out in the IT Microcosm software [20]. In Microcosm BioS QSAR-base, an ordered series of values of each type of activity, Act, is divided into deciles and each decile range is assigned (on a 10-point scale) an ordinal index of an activity level, IndAct, which takes the following values: +5 (very highly active); +4 (greatly active); +3 (highly active); +2 (significantly above moderate); +1 (above moderate); 0 (moderate); −1 (below moderate); −2 (significantly below moderate); −3 (weakly active); −4 (very weakly active); −5 (inactive). For each analyzed compound i for each type of predicted activity, Act, using the QL-modified Tanimoto similarity coefficient [20,22], 10 nearest neighbors j were calculated with indices of the activity level IndAct,i,j. The average value of these indices is a metric of the expected level of this activity IndMean,i for compound i. In this case, for each compound i, the average similarity coefficient TMean,i was computed in relation to 10 standards; this metric reflects the degree of the presence of this type of activity in the untested compound, whereas indicator IndMean,i characterizes the possible level of this activity.

5. Conclusions

In this work, we synthesized four bornyl derivatives of p-(benzyloxy)phenylpropionic acid and analyzed (by in silico methods) the profile of their effects on biotargets relevant to hypoglycemic action. The computational prediction showed that the studied substances are most likely bifunctional multitarget hypoglycemic compounds whose mechanism of action is based on a reduction in insulin resistance and a strong incretin-mimetic effect. Biological experiments confirmed the calculated data. The two active substances selected in the OGTT yielded different results in C57BL/6Ay mice, which are characterized by impaired carbohydrate and lipid metabolism. Even though compounds 1 and 3 exert incretin-mimetic action in normal mice and have similar chemical structures, they have different effects under the conditions of lipid and carbohydrate metabolism disorders and fatty degeneration of the liver. Compound 3 reduces insulin resistance to a greater extent and restores liver function to a lesser extent, whereas compound 1 almost completely normalizes liver function and lipid metabolism but only indirectly reduces insulin resistance. All the findings indicate a difference between the studied substances in the targets of their pharmacological action.
These results mean that bornyl derivatives of p-(benzyloxy)phenylpropionic acid hold promise as new therapeutic agents for diabetes mellitus due to their hypoglycemic and lipid-normalizing properties.

Supplementary Materials

Supplementary materials can be found at https://www.mdpi.com/1424-8247/13/11/404/s1. Figure S1. 1H NMR spectrum of compound 2. Figure S2. 13C NMR spectrum of compound 2. Figure S3. 1H NMR spectrum of compound 3. Figure S4. APT spectrum of compound 3. Figure S5. 1H NMR spectrum of compound 4. Figure S6. APT spectrum of compound 4. Figure S7. 1H NMR spectrum of compound 12. Figure S8. 1H NMR spectrum of compound 13. Figure S9. APT spectrum of compound 13. Figure S10. 1H NMR spectrum of compound 14. Figure S11. APT spectrum of compound 14. Figure S12. 1H NMR spectrum of compound 15. Figure S13. APT spectrum of compound 15.

Author Contributions

Chemistry investigation, S.K. under the supervision of O.L.; in vivo investigation, D.B., D.K., and N.Z. under the supervision of M.K. and T.T.; in silico investigation P.V. and A.K.; methodology, N.S. and P.V.; project administration, O.L.; supervision, O.L.; writing—original draft, S.K., O.L., M.K., and P.V.; writing—review and editing, O.L., P.V., M.K., and N.S. All authors have read and agreed to the published version of the manuscript.

Funding

This study was funded by the Russian Science Foundation grant no. 20-13-00029.

Acknowledgments

The authors would like to acknowledge the Multi-Access Chemical Research Center SB RAS for spectral and analytical measurements. The English language was corrected by shevchuk-editing.com.

Conflicts of Interest

The authors declare no conflict of interest. The funders had no role in the design of the study; in the collection, analyses, or interpretation of data; in the writing of the manuscript; or in the decision to publish the results.

References

  1. Roglic, G. WHO Global report on diabetes: A summary. Int. J. Non-Commun. Dis. 2016, 1, 3–8. [Google Scholar] [CrossRef]
  2. Sonksen, P.; Sonksen, J. Insulin: Understanding its action in health and disease. Br. J. Anaesth. 2000, 85, 69–79. [Google Scholar] [CrossRef] [PubMed] [Green Version]
  3. Tabish, S.A. Is Diabetes Becoming the Biggest Epidemic of the Twenty-first Century? Int. J. Health Sci. 2007, 1, V–VIII. [Google Scholar]
  4. Riddle, M.C.; Herman, W.H. The Cost of Diabetes Care—An Elephant in the Room. Diabetes Care 2018, 45, 929–932. [Google Scholar] [CrossRef] [Green Version]
  5. Carbone, S.; Buono, M.G.D.; Ozemek, C.; Lavie, C.J. Obesity, risk of diabetes and role of physical activity, exercise training and cardiorespiratory fitness. Prog. Cardiovasc. Dis. 2019, 62, 327–333. [Google Scholar] [CrossRef]
  6. American Diabetes Association. 9. Pharmacologic approaches to glycemic treatment: Standards of medical care in diabetes-2019. Diabetes Care 2019, 42, 90–102. [Google Scholar] [CrossRef] [Green Version]
  7. Vieira, R.; Souto, S.B.; Sánchez-López, E.; Machado, A.L.; Severino, P.; Jose, S.; Santini, A.; Fortuna, A.; García, M.L.; Silva, A.M.; et al. Sugar-Lowering Drugs for Type 2 Diabetes Mellitus and Metabolic Syndrome—Review of Classical and New Compounds: Part-I. Pharmaceuticals 2019, 12, 152. [Google Scholar] [CrossRef] [Green Version]
  8. Newman, D.J.; Cragg, G.M. Natural Products as Sources of New Drugs over the Nearly Four Decades from 01/1981 to 09/2019. J. Nat. Prod. 2020, 83, 770–803. [Google Scholar] [CrossRef]
  9. Habtemariam, S. Antidiabetic Potential of Monoterpenes: A Case of Small Molecules Punching above Their Weight. Int. J. Mol. Sci. 2017, 19, 4. [Google Scholar] [CrossRef] [Green Version]
  10. Kodikonda, M.; Naik, P.R. Ameliorative effect of borneol, a natural bycyclic monoterpene against hyperglycemia, hyperlipidemia and oxidative stress in streptozotocin-induced diabetic Wistar rats. Biomed. Pharmacother. 2017, 96, 336–347. [Google Scholar]
  11. Rogachev, A.D.; Kuranov, S.O.; Salakhutdinov, N.F. Chemical approach to the design of effective antidiabetic agents. Russ. Chem. Rev. 2016, 85, 1313–1337. [Google Scholar] [CrossRef]
  12. Sparks, S.M.; Aquino, C.; Banker, P.; Collins, J.L.; Cowan, D.; Diaz, C.; Dock, S.T.; Hertzog, D.L.; Liang, X.; Swiger, E.D.; et al. Exploration of phenylpropanoic acids as agonists of the free fatty acid receptor 4 (FFA4): Identification of an orally efficacious FFA4 agonist. Bioorg. Med. Chem. Lett. 2017, 27, 1278–1283. [Google Scholar] [CrossRef] [PubMed]
  13. Hiroyuki, M.; Hashimoto, Y. Structural development studies of subtype-selective ligands for peroxisome proliferator-activated receptors (PPARs) based on the 3,4-disubstituted phenylpropanoic acid scaffold as a versatile template. PPAR Res. 2008, 689859. [Google Scholar]
  14. Tang, Y.-B.; Liu, J.-Z.; Zhang, S.-E.; Du, X.; Nie, F.; Tian, J.-Y.; Ye, F.; Huang, K.; Hu, J.-P.; Li, Y.; et al. 3-Phenylpropanoic acid-based phosphotyrosine (pTyr) mimetics: Hit evolution to a novel orally active protein tyrosine phosphatase 1B (PTP1B) inhibitor. ChemMedChem 2014, 9, 918–921. [Google Scholar] [CrossRef]
  15. Kuranov, S.O.; Luzina, O.A.; Onopchenko, O.; Pishel, I.; Zozulya, S.; Gureev, M.; Salakhutdinov, N.F.; Krasavin, M. Exploring bulky natural and natural-like periphery in the design of p-(benzyloxy)phenylpropionic acid agonists of free fatty acid receptor 1 (GPR40). Bioorg. Chem. 2020, 99, 103830. [Google Scholar] [CrossRef] [PubMed]
  16. Levien, T.L.; Baker, D.E. New Drugs in Development for the Treatment of Diabetes. Diabetes Spectrum 2009, 22, 92–106. [Google Scholar] [CrossRef] [Green Version]
  17. Croasdell, G. American Diabetes association—70th scientific sessions—Research on novel therapeutics. Drugs 2010, 13, 588. [Google Scholar]
  18. Tyurenkov, I.N.; Kurkin, D.V.; Volotova, E.V.; Bakulin, D.A.; Lomkina, E.M. Drug discovery for type 2 diabetes mellitus and metabolic syndrome: Ten novel biological targets. Diabetes Mellit. 2015, 18, 101–109. [Google Scholar] [CrossRef] [Green Version]
  19. Bateman, A. UniProt: A worldwide hub of protein knowledge. Nucleic Acids Res. 2019, 47, 506–515. [Google Scholar]
  20. Vassiliev, P.M.; Spasov, A.A.; Kosolapov, V.A.; Kucheryavenko, A.F.; Gurova, N.A.; Anisimova, V.A. Consensus Drug Design Using IT Microcosm. In Application of Computational Techniques in Pharmacy and Medicine; Gorb, L., Kuzmin, V., Muratov, E., Eds.; Springer: Dordrecht, The Netherlands, 2014; Volume 17, pp. 369–431. [Google Scholar]
  21. Vasilyev, P.M.; Luzina, O.A.; Babkov, D.A.; Appazova, D.T.; Salakhutdinov, N.F.; Spasov, A.A. Studying dependences between the chemotype structure of some natural compounds and the spectrum of their targeted activities correlated with the hypoglycemic effect. J. Struct. Chem. 2019, 60, 1827–1832. [Google Scholar] [CrossRef]
  22. Kubinyi, H. Similarity and Dissimilarity: A Medicinal Chemist’s View. In 3D QSAR in Drug Design. Three-Dimensional Quantitative Structure Activity Relationships; Kubinyi, H., Folkers, G., Martin, Y.C., Eds.; Springer: Dordrecht, The Netherlands, 2002; Volume 2. [Google Scholar]
  23. MarvinSketch, ChemAxon Kft. Available online: http://www.chemaxon.com/products/marvin/marvinsketch/ (accessed on 17 November 2020).
  24. MOPAC. Stewart Computational Chemistry. Available online: http://openmopac.net (accessed on 17 November 2020).
  25. Vassiliev, P.M.; Spasov, A.A.; Yanaliyeva, L.R.; Kochetkov, A.N.; Vorfolomeyeva, V.V.; Klochkov, V.G.; Appazova, D.T. Neural network modeling of multitarget RAGE inhibitory activity. Biochem. Suppl. Ser. B Biomed. Chem. 2019, 13, 256–263. [Google Scholar]
  26. RCSB PDB, Protein Data Bank. Available online: https://www.rcsb.org/ (accessed on 17 November 2020).
  27. Trott, O.; Olson, A.J. AutoDock Vina: Improving the speed and accuracy of docking with a new scoring function, efficient optimization and multithreading. J. Comp. Chem. 2010, 31, 455–461. [Google Scholar] [CrossRef] [PubMed] [Green Version]
  28. Piskunova, Y.V.; Kazantceva, A.Y.; Baklanov, A.V.; Bazhan, N.M. Mutation yellow in agouti loci prevents age-related increase of skeletal muscle genes regulating free fatty acids oxidation. Vavilov J. Genet. Breed. 2018, 22, 265–272. [Google Scholar] [CrossRef]
  29. Oh, D.Y.; Olefsky, J.M. G protein-coupled receptors as targets for anti-diabetic therapeutics. Nat. Rev. Drug Discov. 2016, 15, 161–172. [Google Scholar] [CrossRef] [PubMed]
  30. Raab, S.; Wang, H.; Uhles, S.; Cole, N.; Alvarez-Sanchez, R.; Künnecke, B.; Ullmer, C.; Matile, H.; Bedoucha, M.; Norcross, R.D.; et al. Incretin-like effects of small molecule trace amine-associated receptor 1 agonists. Mol. Metab. 2015, 5, 47–56. [Google Scholar] [CrossRef]
  31. Ayala, J.E.; Samuel, V.T.; Morton, G.J.; Obici, S.; Croniger, C.M.; Shulman, G.I.; Wasserman, D.H.; McGuinness, O.P.; NIH Mouse Metabolic Phenotyping Center Consortium. Standard operating procedures for describing and performing metabolic tests of glucose homeostasis in mice. Dis. Model. Mech. 2010, 3, 525–534. [Google Scholar] [CrossRef] [Green Version]
  32. Lambeir, A.M.; Durinx, C.; Scharpé, S.; Meester, I.D. Dipeptidyl-Peptidase IV from Bench to Bedside: An Update on Structural Properties, Functions, and Clinical Aspects of the Enzyme DPP IV. Crit. Rev. Clin. Lab. Sci. 2003, 40, 209–294. [Google Scholar] [CrossRef]
  33. Burkey, B.F.; Li, X.; Bolognese, L.; Balkan, B.; Mone, M.; Russell, M.; Hughes, T.E.; Wang, P.R. Acute and Chronic Effects of the Incretin Enhancer Vildagliptin in Insulin-Resistant Rats. J. Pharmacol. Exp. Ther. 2005, 315, 688–695. [Google Scholar] [CrossRef] [Green Version]
  34. Carman, R.; Greenfield, K. The endo—And exo 1,7,7-Trimethylbicyclo[2.2.1]heptan- 2-amines (Bornan-2-amines) and their acetamides. Aust. J. Chem. 1984, 37, 1785–1790. [Google Scholar] [CrossRef]
  35. Tai, M.M. A Mathematical Model for the Determination of Total Area under Glucose Tolerance and Other Metabolic Curves. Diabetes Care 1994, 17, 152–154. [Google Scholar] [CrossRef] [Green Version]
Figure 1. New bornyl derivatives.
Pharmaceuticals 13 00404 g001
Scheme 1. Reactions and conditions. a: N,N-diisopropylethylamine (DIPEA), CH3CN, reflux; b: DIPEA, potassium iodide, 150 °C; c: LiOH monohydrate, tetrahydrofuran (THF)/MeOH/H2O; d: HCl, H2O.
Pharmaceuticals 13 00404 sch001
Scheme 2. Reactions and conditions. a: K2CO3, acetone; b: CH2(COOEt)2, NaH, THF, 0 °C; c: NaCl, H2O, dimethyl sulfoxide (DMSO); d: exo-(1R)-6, NaBH(OAc)3, AcOH, CH2Cl2; e: LiOH monohydrate, THF/MeOH/H2O; f: HCl, H2O.
Pharmaceuticals 13 00404 sch002
Figure 2. Oral glucose tolerance test (OGTT) results in C57BL/6 mice. All tested compounds (14) were administered at a dose of 30 mg/kg. * p < 0.05 as compared with untreated mice.
Pharmaceuticals 13 00404 g002
Figure 3. OGTT results in C57BL/6Ay (AY) mice after the first administration of compound 1 or 3. * p < 0.05 as compared with untreated C57BL/6 mice, # p < 0.05 as compared with untreated AY mice.
Pharmaceuticals 13 00404 g003
Figure 4. OGTT results in AY mice after 14 days of drug administration at a dose of 30 mg/kg. * p < 0.05 as compared with untreated C57BL/6 mice, # p < 0.05 as compared with untreated AY mice.
Pharmaceuticals 13 00404 g004
Figure 5. OGTT results in AY mice. AUC: area under the glycemic curve; * p < 0.05 vs. untreated AY mice on the first day of dosing; # p < 0.05 vs. untreated AY mice on the 14th day of dosing; A p < 0.05 vs. untreated C57BL/6 mice on the first day of dosing; B p < 0.05 vs. untreated C57BL/6 mice on the 14th day of dosing; C p < 0.05 vs. vildagliptin (VIL) on the first day of dosing; D p < 0.05 vs. compound 1 on the first day of dosing; E p < 0.05 vs. 3 on the first day of dosing.
Pharmaceuticals 13 00404 g005
Figure 6. Histological examination of the liver of аn untreated C57BL/6 mouse (A) and an untreated AY mouse (BD) at the end of the experiment. A. Nuclear polymorphism of hepatocytes. Staining with hematoxylin and eosin, magnification ×200. (B) Polymorphic lipid infiltration of hepatocytes. Staining with hematoxylin and eosin; magnification ×200. (C). Polymorphic lipid infiltration, nuclear polymorphism of hepatocytes. Staining with hematoxylin and eosin; magnification ×400. (D) Polymorphic lipid infiltration, no glycogen. Staining: periodic acid–Schiff, hematoxylin, and orange G; magnification ×200. Light blue arrow: lipid infiltration, black arrow: Kupffer cell, green arrow: nuclear polymorphism.
Pharmaceuticals 13 00404 g006
Figure 7. Histological examination of the liver of AY mice treated with VIL or compound 1 or 3. (A) The liver of an AY mouse after 14 days of VIL administration. Polymorphic lipid infiltration and hepatocyte polymorphism. Staining: hematoxylin and eosin; magnification ×200. (B) The liver of an AY mouse after 14 days of administration of VIL. Polymorphic lipid infiltration, no glycogen. Staining: periodic acid–Schiff, hematoxylin, and orange G; magnification ×200. (C) The liver of an AY mouse that received 1 for 14 days. Polymorphic lipid infiltration, no glycogen. Staining: periodic acid–Schiff, hematoxylin, and orange G; magnification ×200. (D) The liver of an AY mouse that received 1 for 14 days. Fine necrosis of hepatocytes. Staining: hematoxylin and eosin; magnification ×200. (E) The liver of an AY mouse who received 3 for 14 days. Small-vesicle fat dystrophy, hepatocyte hypertrophy. Staining with hematoxylin and eosin; magnification ×200. (F) The liver of an AY mouse that received 3 for 14 days. Small-vesicle fat dystrophy, no glycogen. Staining: periodic acid–Schiff, hematoxylin, orange G; magnification ×200. Light blue arrow: lipid infiltration, yellow arrow: polymorphic hepatocytes, blue arrow: necrosis.
Pharmaceuticals 13 00404 g007
Table 1. Biotargets corresponding to possible hypoglycemic activities of the phenylpropanoic acid derivatives 1.
Target Name 2Protein Symbol 3UniProt 4Ligand 5
Cleavage of poly- and oligosaccharides
Pancreatic alpha-amylaseAMY2AP04746inhibitor
Maltase-glucoamylase, intestinalMGAMO43451inhibitor
Insulinogens
Sulfonylurea receptor 1SUR1Q09428inhibitor
Incretin mimetics
Dipeptidyl peptidase 4DPP4P27487inhibitor
Gastric inhibitory polypeptide receptorGIPRP48546agonist
Glucagon-like peptide receptor 1GLP1RP43220agonist
Trace amine-associated receptor 1TAAR1Q96RJ0agonist
Insulin resistance
Free fatty acid receptor 1 (GPR40)FFAR1O14842agonist
Free fatty acid receptor 2 (GPR43)FFAR2O15552agonist
Free fatty acid receptor 3 (GPR41)FFAR3O14843agonist
Free fatty acid receptor 4 (GPR120)FFAR4Q5NUL3agonist
Peroxisome proliferator-activated receptor alphaPPARAQ07869agonist
Peroxisome proliferator-activated receptor deltaPPARDQ03181agonist
Peroxisome proliferator-activated receptor gammaPPARGP37231agonist
Protein-tyrosine phosphatase 1B (PTP1B)PTPN1P18031inhibitor
Gluconeogenesis and glycogenolysis
Glycogen phosphorylase, liver formPYGLP06737inhibitor
Glycogen phosphorylase, muscle formPYGMP11217inhibitor
GlucagonGCGP01275inhibitor
Glucagon receptorGCGRP47871inhibitor
Phosphoenolpyruvate carboxykinase, cytosolicPCK1P35558inhibitor
Fructose-1,6-bisphosphatase 1FBP1P09467inhibitor
Glycolysis and glycogen synthesis
Pyruvate dehydrogenase kinase 4PDK4Q16654activator
6-phosphofructokinase, muscle typePFKMP08237activator
Glucose transport
Sodium/glucose cotransporter 2SGLT2P31639inhibitor
1 The biotargets are grouped by mechanism of action. 2 A common name for a biotarget. 3 An abbreviated name of a biotarget (matches the symbol of the gene for expressed protein). 4 A unique protein identifier in UniProtKB [19]. 5 A type of ligand that exerts hypoglycemic action.
Table 2. In silico-predicted relevance of biotargets and corresponding hypoglycemic activity of bornyl derivatives 1.
Target NameProtein SymbolIndMean 1TMean 2
Peroxisome proliferator-activated receptor deltaPPARD2.930.624
Free fatty acid receptor 1 (GPR40)FFAR11.870.684
Dipeptidyl peptidase 4DPP41.860.478
Glycogen phosphorylase, liver formPYGL1.700.460
Protein-tyrosine phosphatase 1B (PTP1B)PTPN11.590.418
Free fatty acid receptor 4 (GPR120)FFAR41.580.651
Pancreatic alpha-amylaseAMY2A1.570.195
6-phosphofructokinase, muscle typePFKM1.000.230
Gastric inhibitory polypeptide receptorGIPR0.350.426
Peroxisome proliferator-activated receptor alphaPPARA0.330.627
Glucagon-like peptide receptor 1GLP1R0.000.181
Pyruvate dehydrogenase kinase 4PDK40.000.145
Trace amine-associated receptor 1TAAR1−0.180.441
Maltase-glucoamylase, intestinalMGAM−0.250.118
Peroxisome proliferator-activated receptor gammaPPARG−0.280.586
Glycogen phosphorylase, muscle formPYGM−0.330.381
Sulfonylurea receptor 1SUR1−0.500.479
Free fatty acid receptor 3 (GPR41)FFAR3−0.750.194
Glucagon receptorGCGR−0.760.430
Sodium/glucose cotransporter 2SGLT2−1.310.491
Fructose-1,6-bisphosphatase 1FBP1−1.450.384
Free fatty acid receptor 2 (GPR43)FFAR2−1.450.459
GlucagonGCG−1.650.486
Phosphoenolpyruvate carboxykinase, cytosolicPCK1−2.500.228
1 The average index of the expected activity level. Indices for highly important targets (strongly explaining the hypoglycemic activity) are bold; indices for medium-importance targets are bold and italic; other targets are defined as low-importance targets. 2 The average QL-modified Tanimoto similarity coefficient [20,22]. The values corresponding to high similarity of predicted and reference structures are highlighted in bold. Table 3 presents a profile of calculated activity levels for each of the four studied substances in relation to 24 analyzed biotargets.
Table 3. Profiles of targeted hypoglycemic activities of bornyl derivatives 14.
Target Name1234
Peroxisome proliferator-activated receptor delta2.702.503.802.70
Free fatty acid receptor 1 (GPR40)1.401.603.081.40
Dipeptidyl peptidase 42.002.540.892.00
Glycogen phosphorylase, liver form1.701.701.701.70
Protein-tyrosine phosphatase 1B (PTP1B)1.791.711.081.79
Free fatty acid receptor 4 (GPR120)1.701.901.001.70
Pancreatic alpha-amylase1.401.901.581.40
6-phosphofructokinase, muscle type1.001.001.001.00
Gastric inhibitory polypeptide receptor0.320.510.270.32
Peroxisome proliferator-activated receptor alpha0.20−1.102.000.20
Glucagon-like peptide receptor 10.000.000.000.00
Pyruvate dehydrogenase kinase 40.000.000.000.00
Trace amine-associated receptor 1−0.90−1.102.20−0.90
Maltase-glucoamylase, intestinal−0.20−0.20−0.40−0.20
Peroxisome proliferator-activated receptor gamma−0.90−0.901.60−0.90
Glycogen phosphorylase, muscle form−1.10−0.801.70−1.10
Sulfonylurea receptor 1−0.50−0.50−0.50−0.50
Free fatty acid receptor 3 (GPR41)−0.75−0.75−0.75−0.75
Glucagon receptor−0.83−0.66−0.70−0.83
Sodium/glucose cotransporter 2−1.90−2.100.65−1.90
Fructose-1,6-bisphosphatase 1−1.60−0.70−1.90−1.60
Free fatty acid receptor 2 (GPR43)−2.70−2.201.80−2.70
Glucagon−1.73−1.73−1.40−1.73
Phosphoenolpyruvate carboxykinase, cytosolic−2.50−2.50−2.50−2.50
Total sum of indices of activity levels−1.400.1216.21−1.40
Sum of significant indices of activity levels14.2115.3624.3614.21
The table shows the average index of an expected activity level for each relation. Indices for highly important targets (strongly explaining the hypoglycemic activity) are bold; indices for medium-importance targets are bold and italic; other targets are defined as low-importance targets.
Table 4. A comparison of predictive estimates of the targeted activity of compounds 1–4. The estimates were obtained by the method of similarity to standards and by the docking method.
TargetCompoundInd 1ΔE 2BinInd 4BinΔE 5
Peroxisome proliferator-
activated receptor delta
12.70−9.3000
22.50−9.4000
33.80−9.8011
42.70−9.7001
Mean 32.93−9.55
Free fatty acid receptor 1
(GPR40)
11.40−10.0000
21.60−9.8000
33.08−10.2011
41.40−10.1001
Mean1.87−10.03
Dipeptidyl peptidase 412.00−9.1011
22.54−9.1011
30.89−8.8000
42.00−9.1011
Mean1.86−9.03
Spearman test RSp0.7143
p9.06 × 10−3
1 The index of the level of activity, as calculated by the method of similarity to standards (see Table 3). 2 Docking energy, kcal/mol. 3 Average values for a biotarget and activity level indicator. 4 Binary assessment of the level of activity, as calculated by the method of similarity to standards. 5 A binary estimate of the level of activity, as calculated by the docking method.
Table 5. Blood biochemical parameters in treated AY mice at the end of the experiment.
GroupTC, mmol/LTGs, mmol/LHDL-C,
mg/dL
LDL-C,
mg/dL
Glu, mmol/L
C57BL/6 mice1.59 ± 0.140.54 ± 0.0482.66 ± 5.2915.13 ± 2.025.55 ± 0.38
AY mice2.59 ± 0.27 *0.64 ± 0.0399.33 ± 6.3810.36 ± 1.497.15 ± 0.69 *
VIL, 30 mg/kg3.26 ± 0.10 *0.46 ± 0.04109.67 ± 5.23 *13.13 ± 0.958.41 ± 0.43 *
1, 30 mg/kg1.79 ± 0.21 #0.58 ± 0.0278.30 ± 5.73 #9.38 ± 1.255.16 ± 0.52 #
3, 30 mg/kg2.80 ± 0.25 *0.64 ± 0.0690.48 ± 8.610.78 ± 1.386.58 ± 1.06
* p ≤ 0.05 as compared with untreated C57BL/6 mice, # p < 0.05 as compared with untreated AY mice. TC: total cholesterol, TGs: triglycerides, HDL-C: high-density lipoprotein cholesterol, LDL-C: low-density lipoprotein cholesterol, Glu: glucose.
Publisher’s Note: MDPI stays neutral with regard to jurisdictional claims in published maps and institutional affiliations.

