
Lessons Learnt from Monitoring the Etna Volcano Using an IoT Sensor Network through a Period of Intense Eruptive Activity
 , , ,
, , ,
Abstract
:1. Introduction
2. Material and Methods
2.1. The Sensors
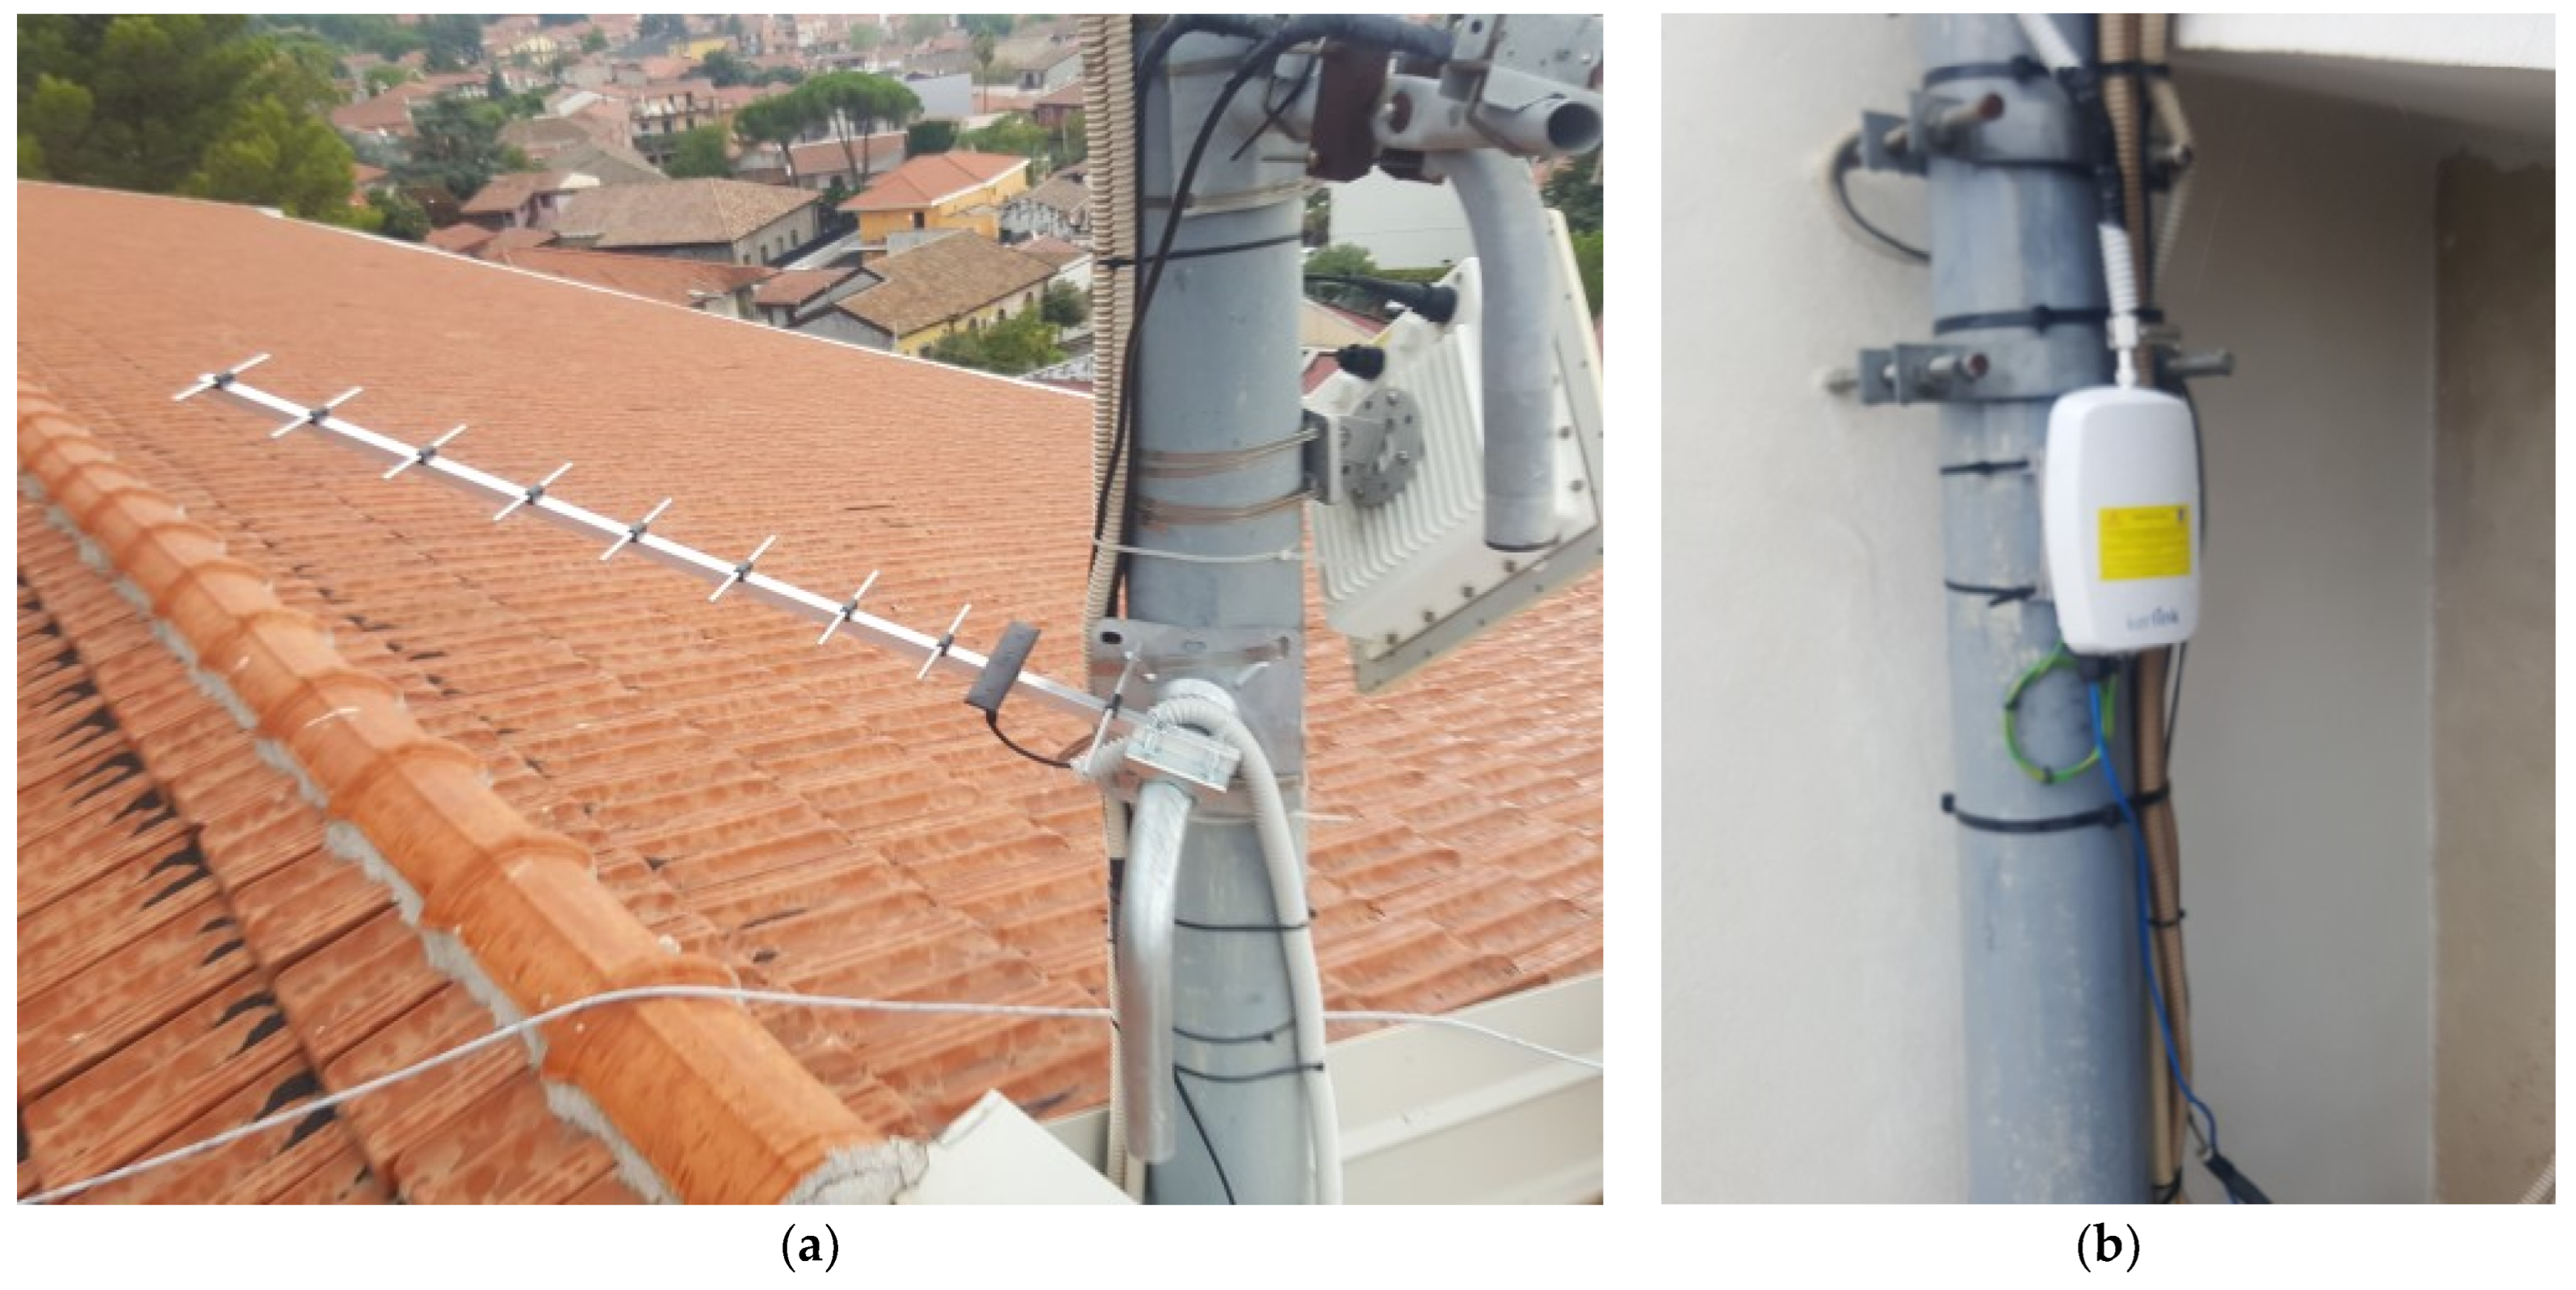
2.2. The Communicating Nodes
2.3. The Gateways
2.4. The Clermont-Ferrand University Data Lake
3. Results
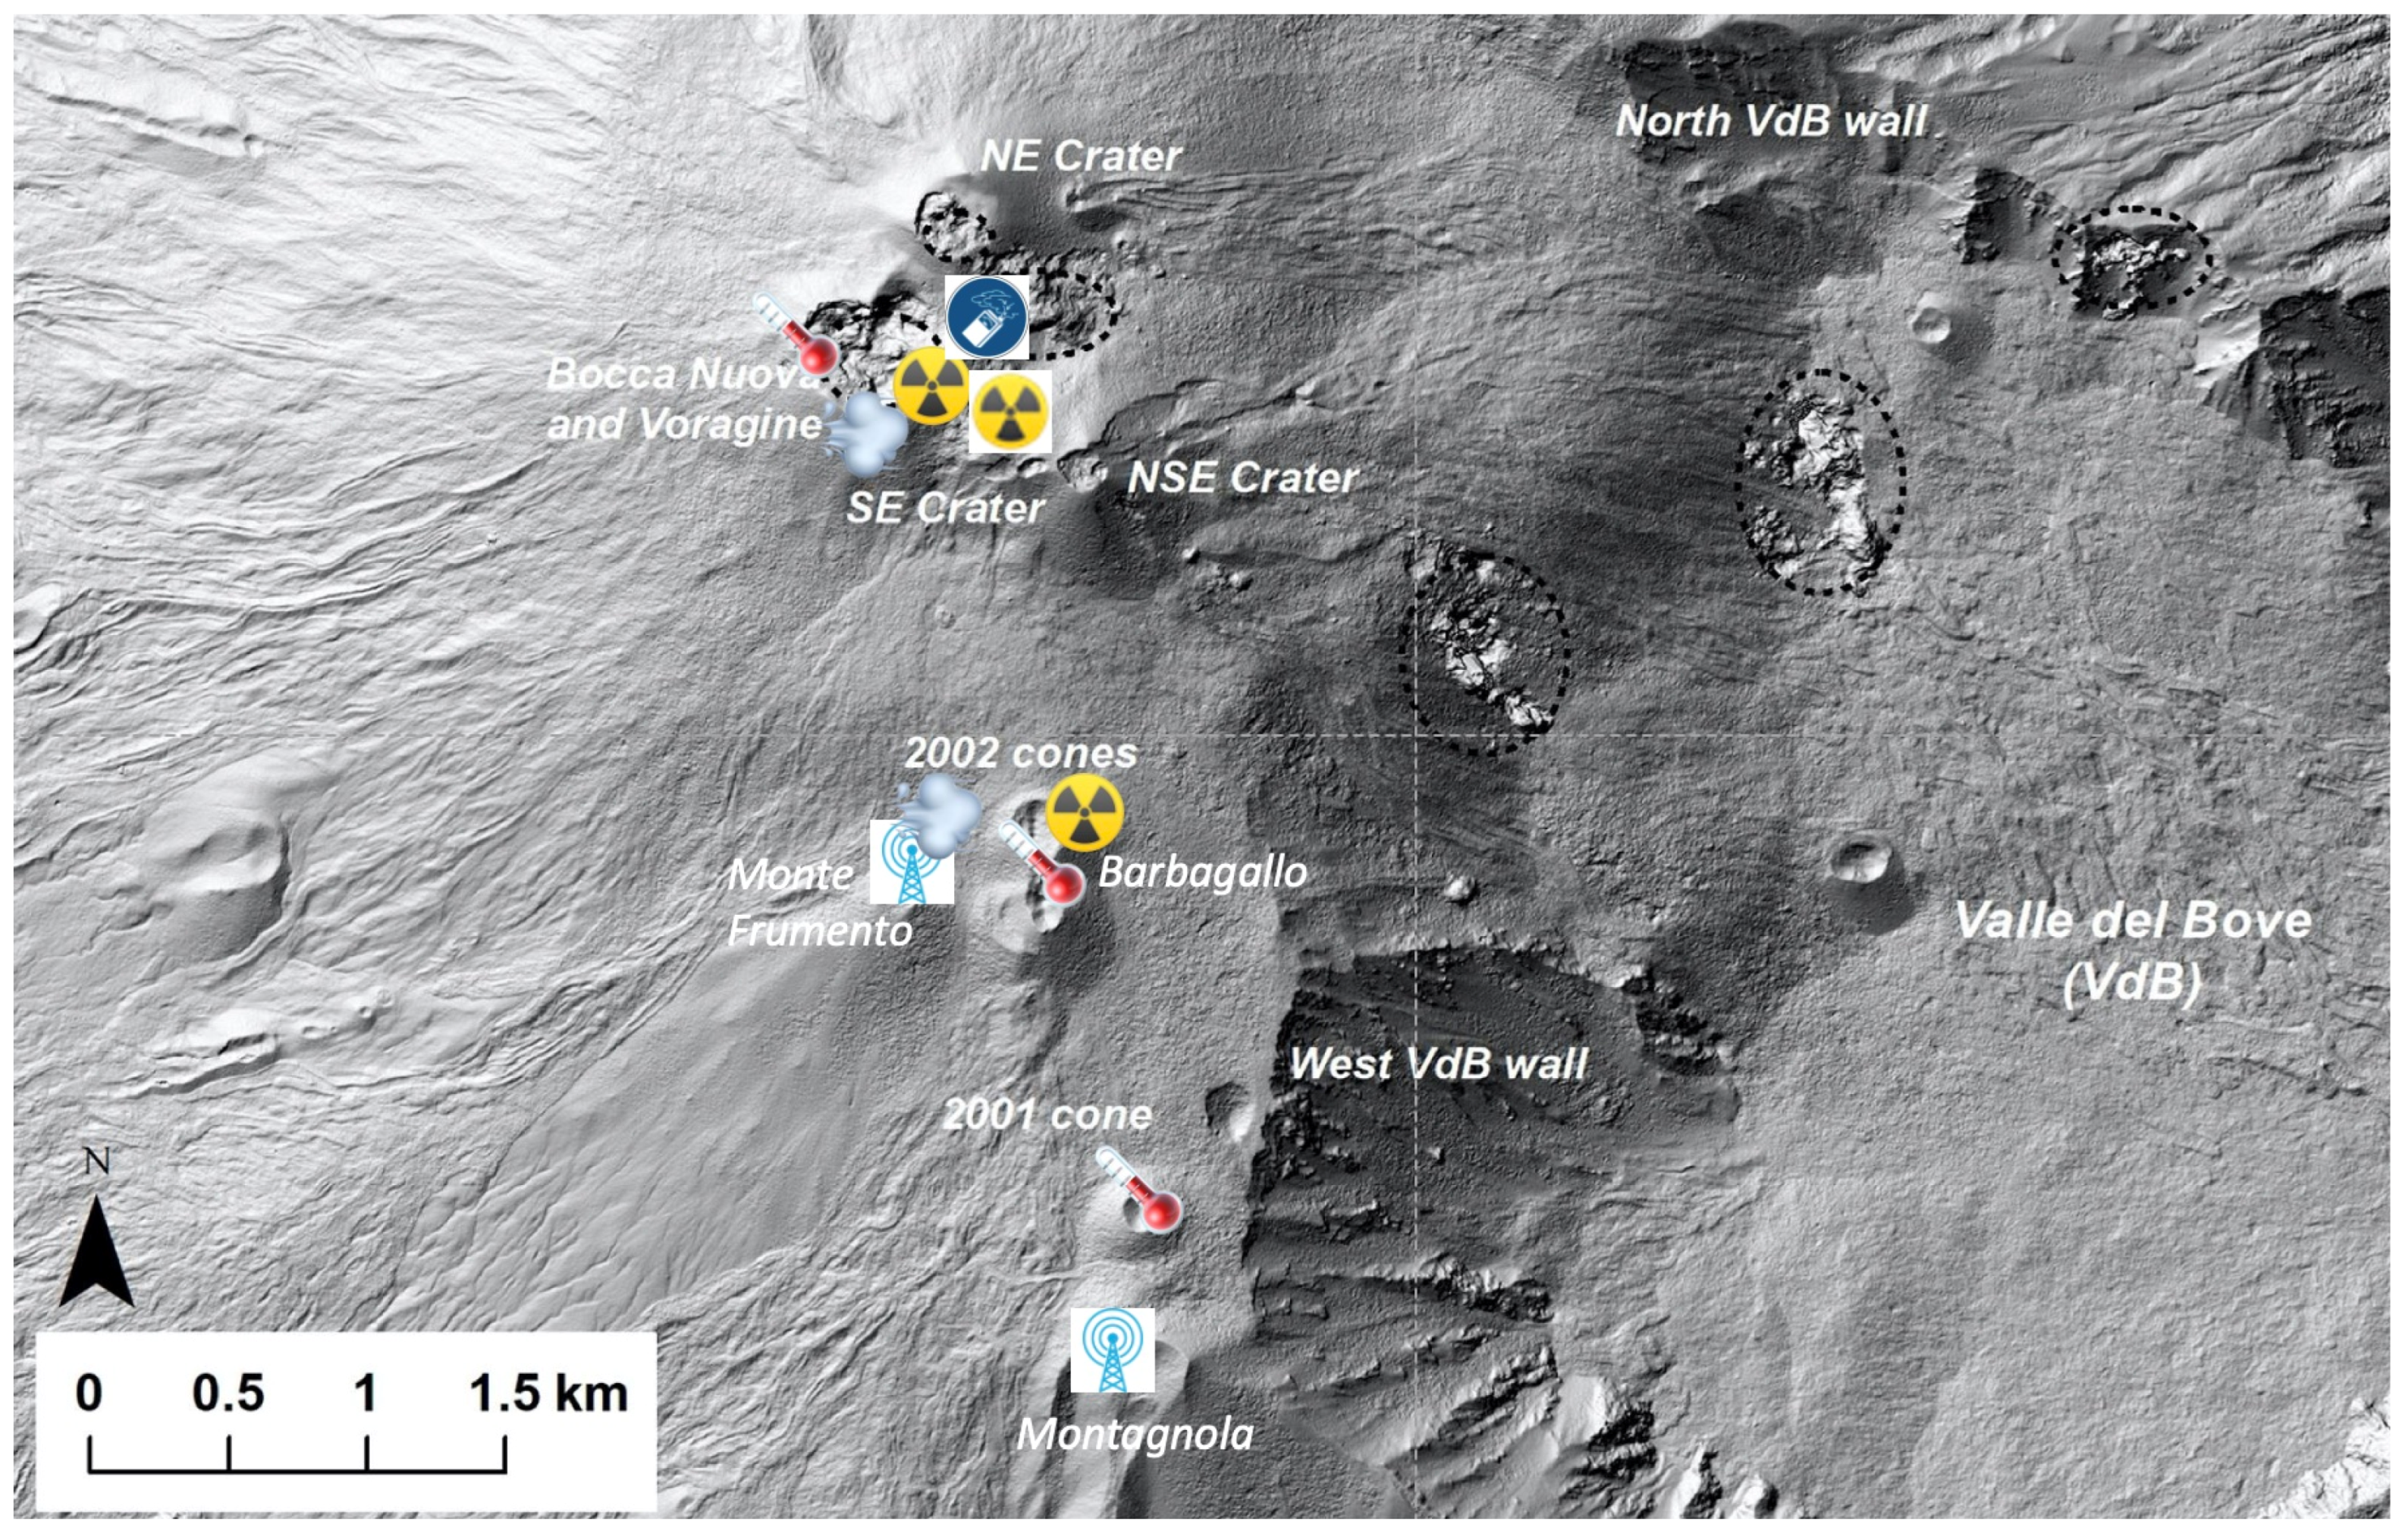
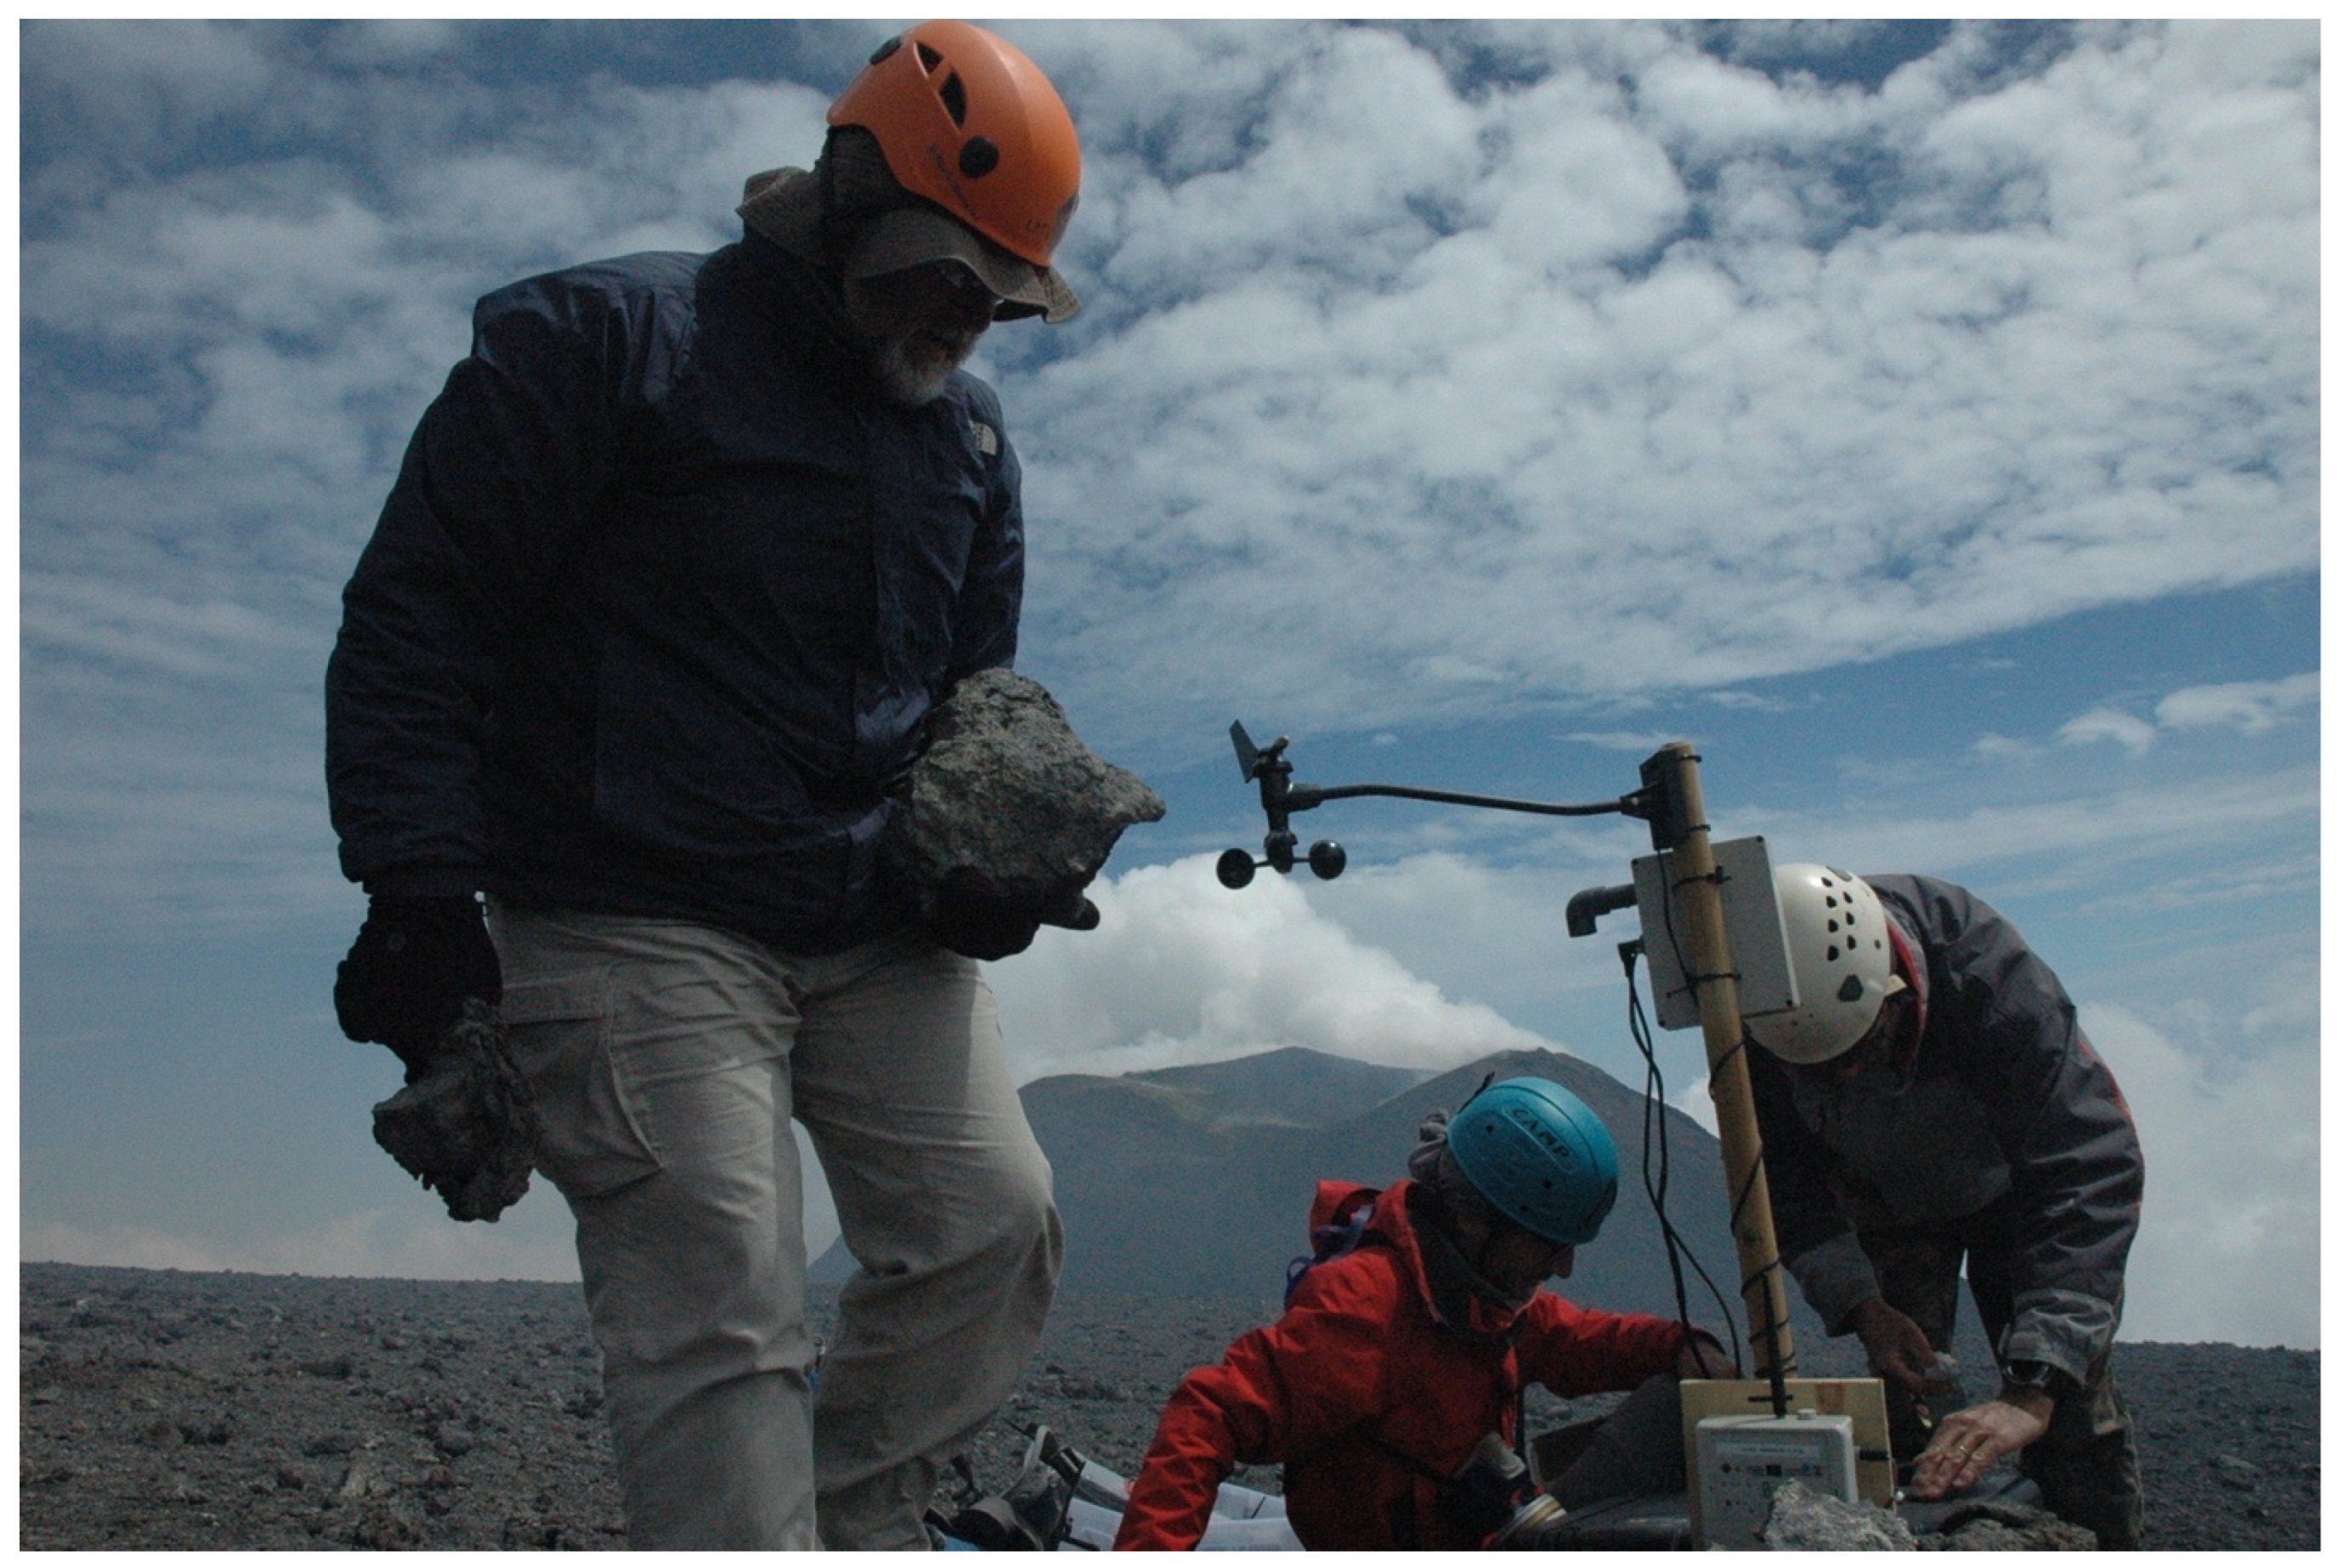
3.1. Sensor Network Deployed during September 2021 Field Trip
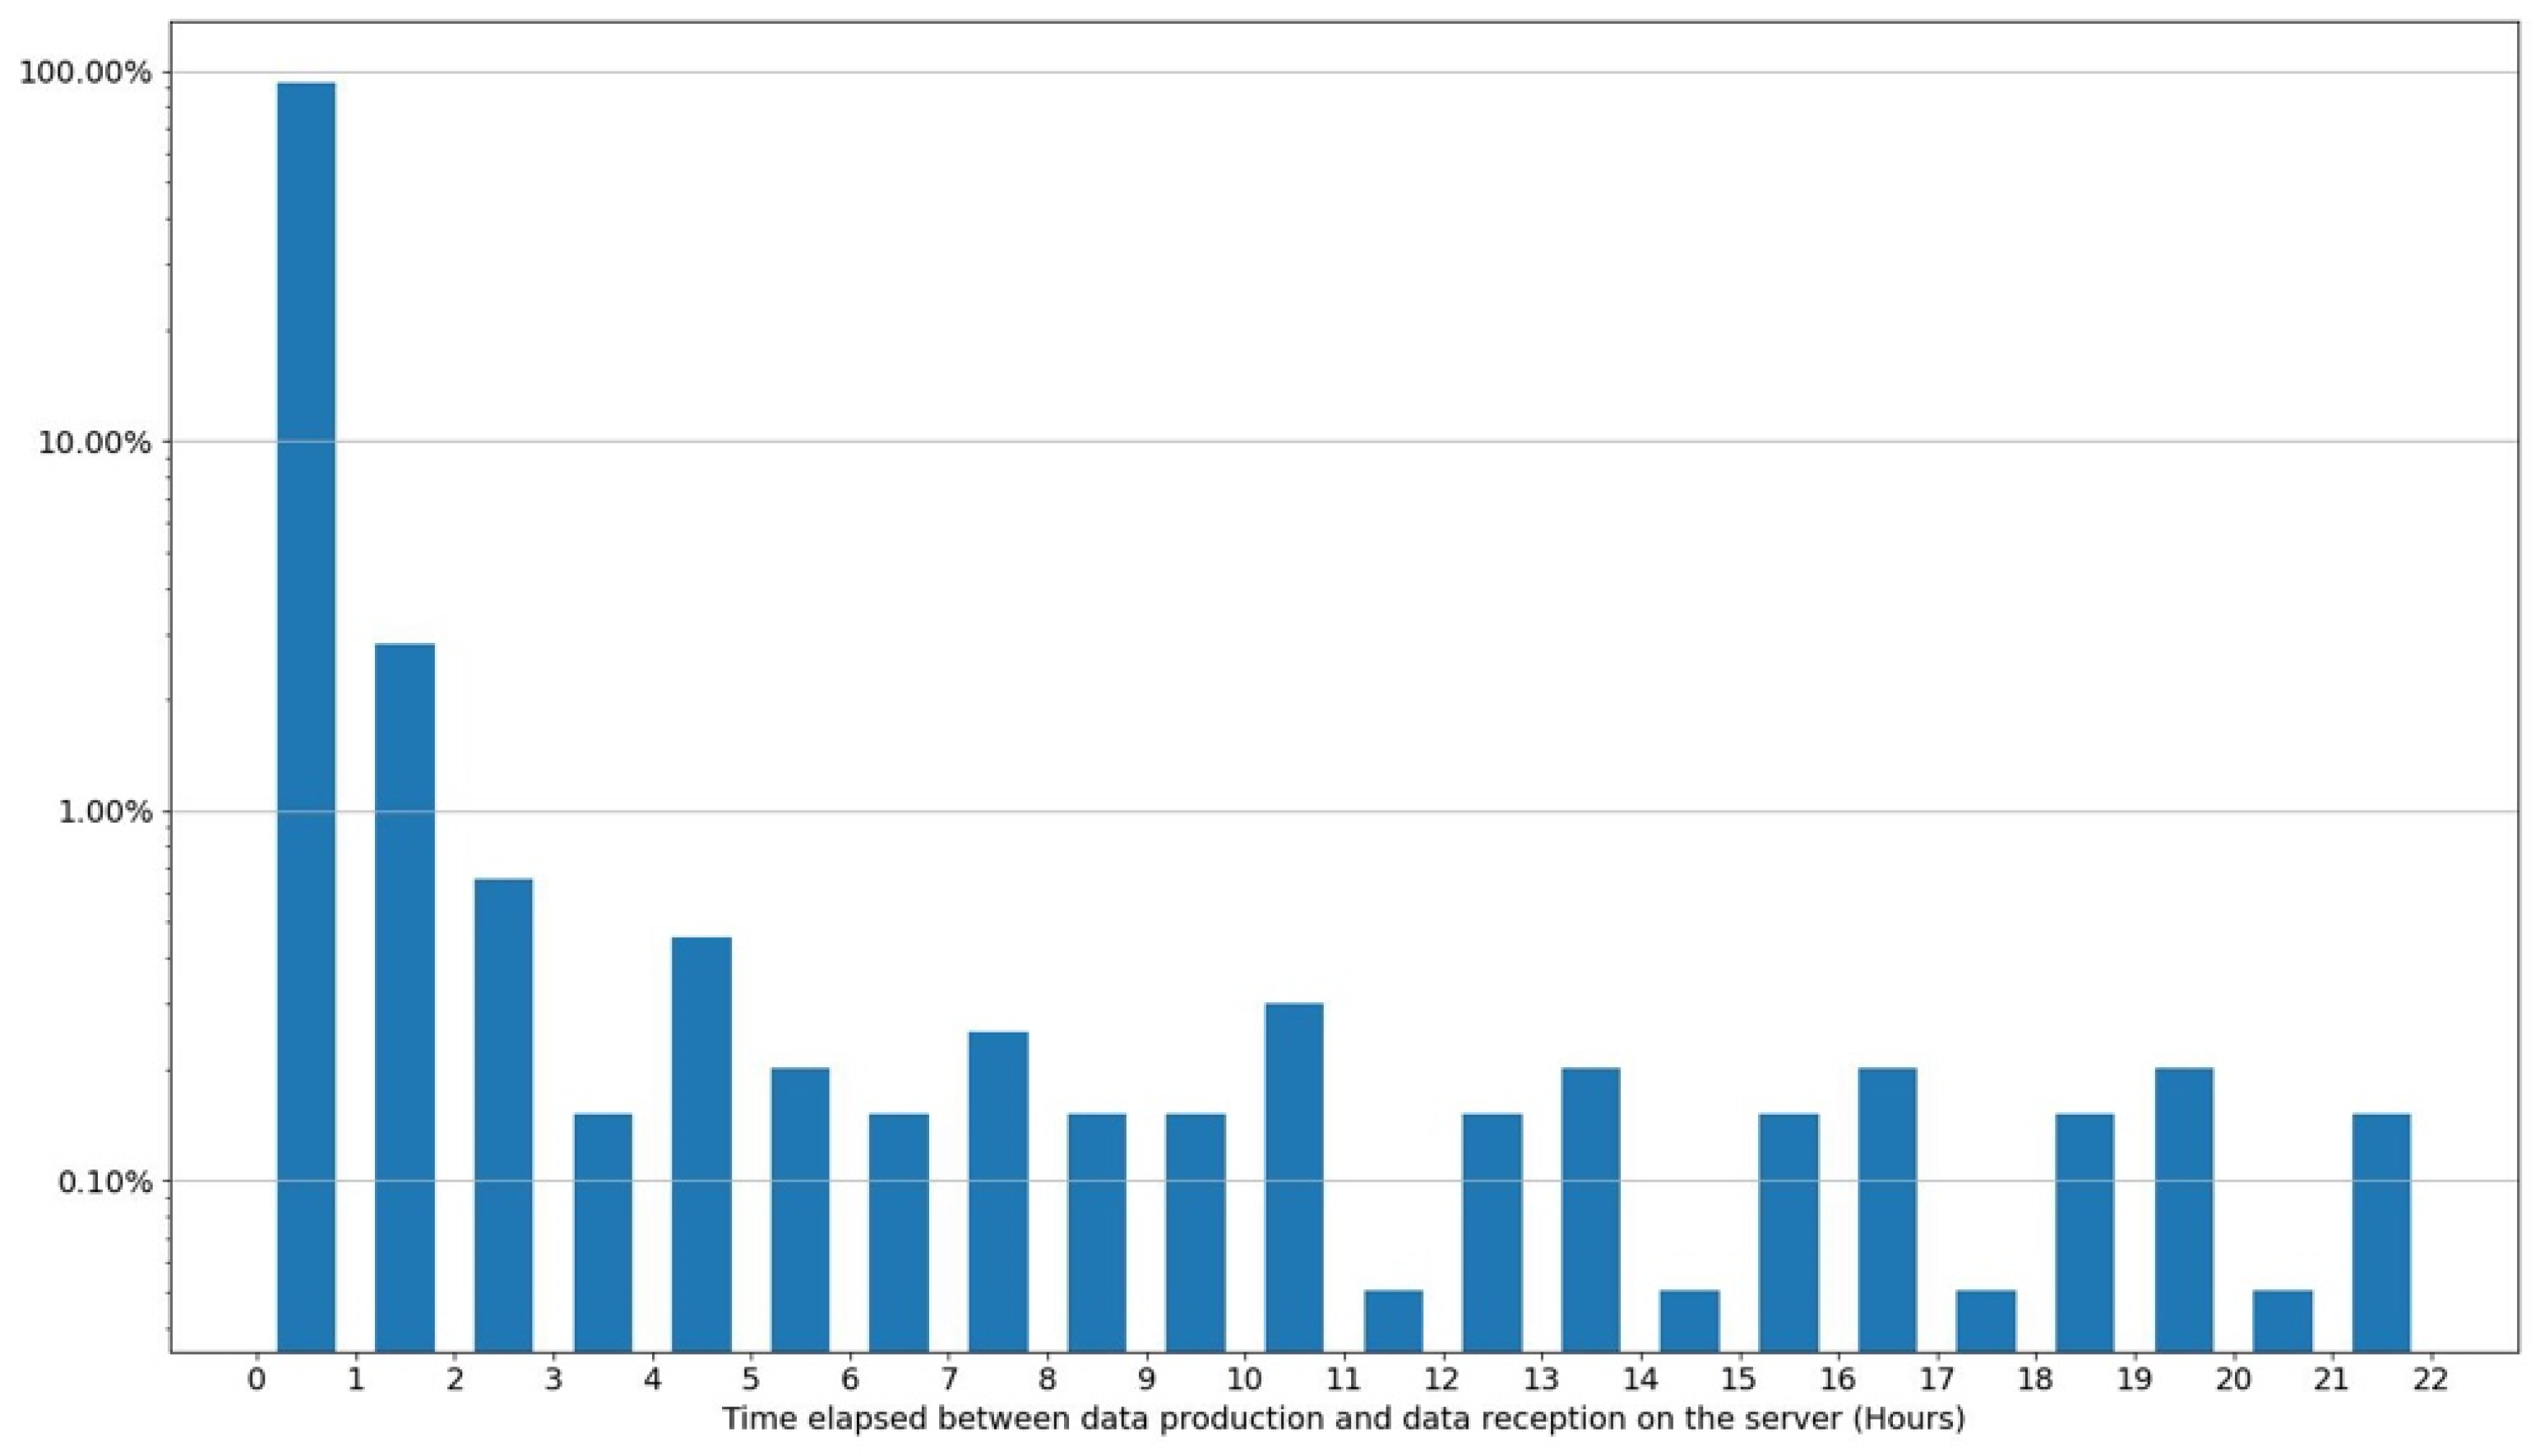
3.1.1. Performances of the Deployed Network
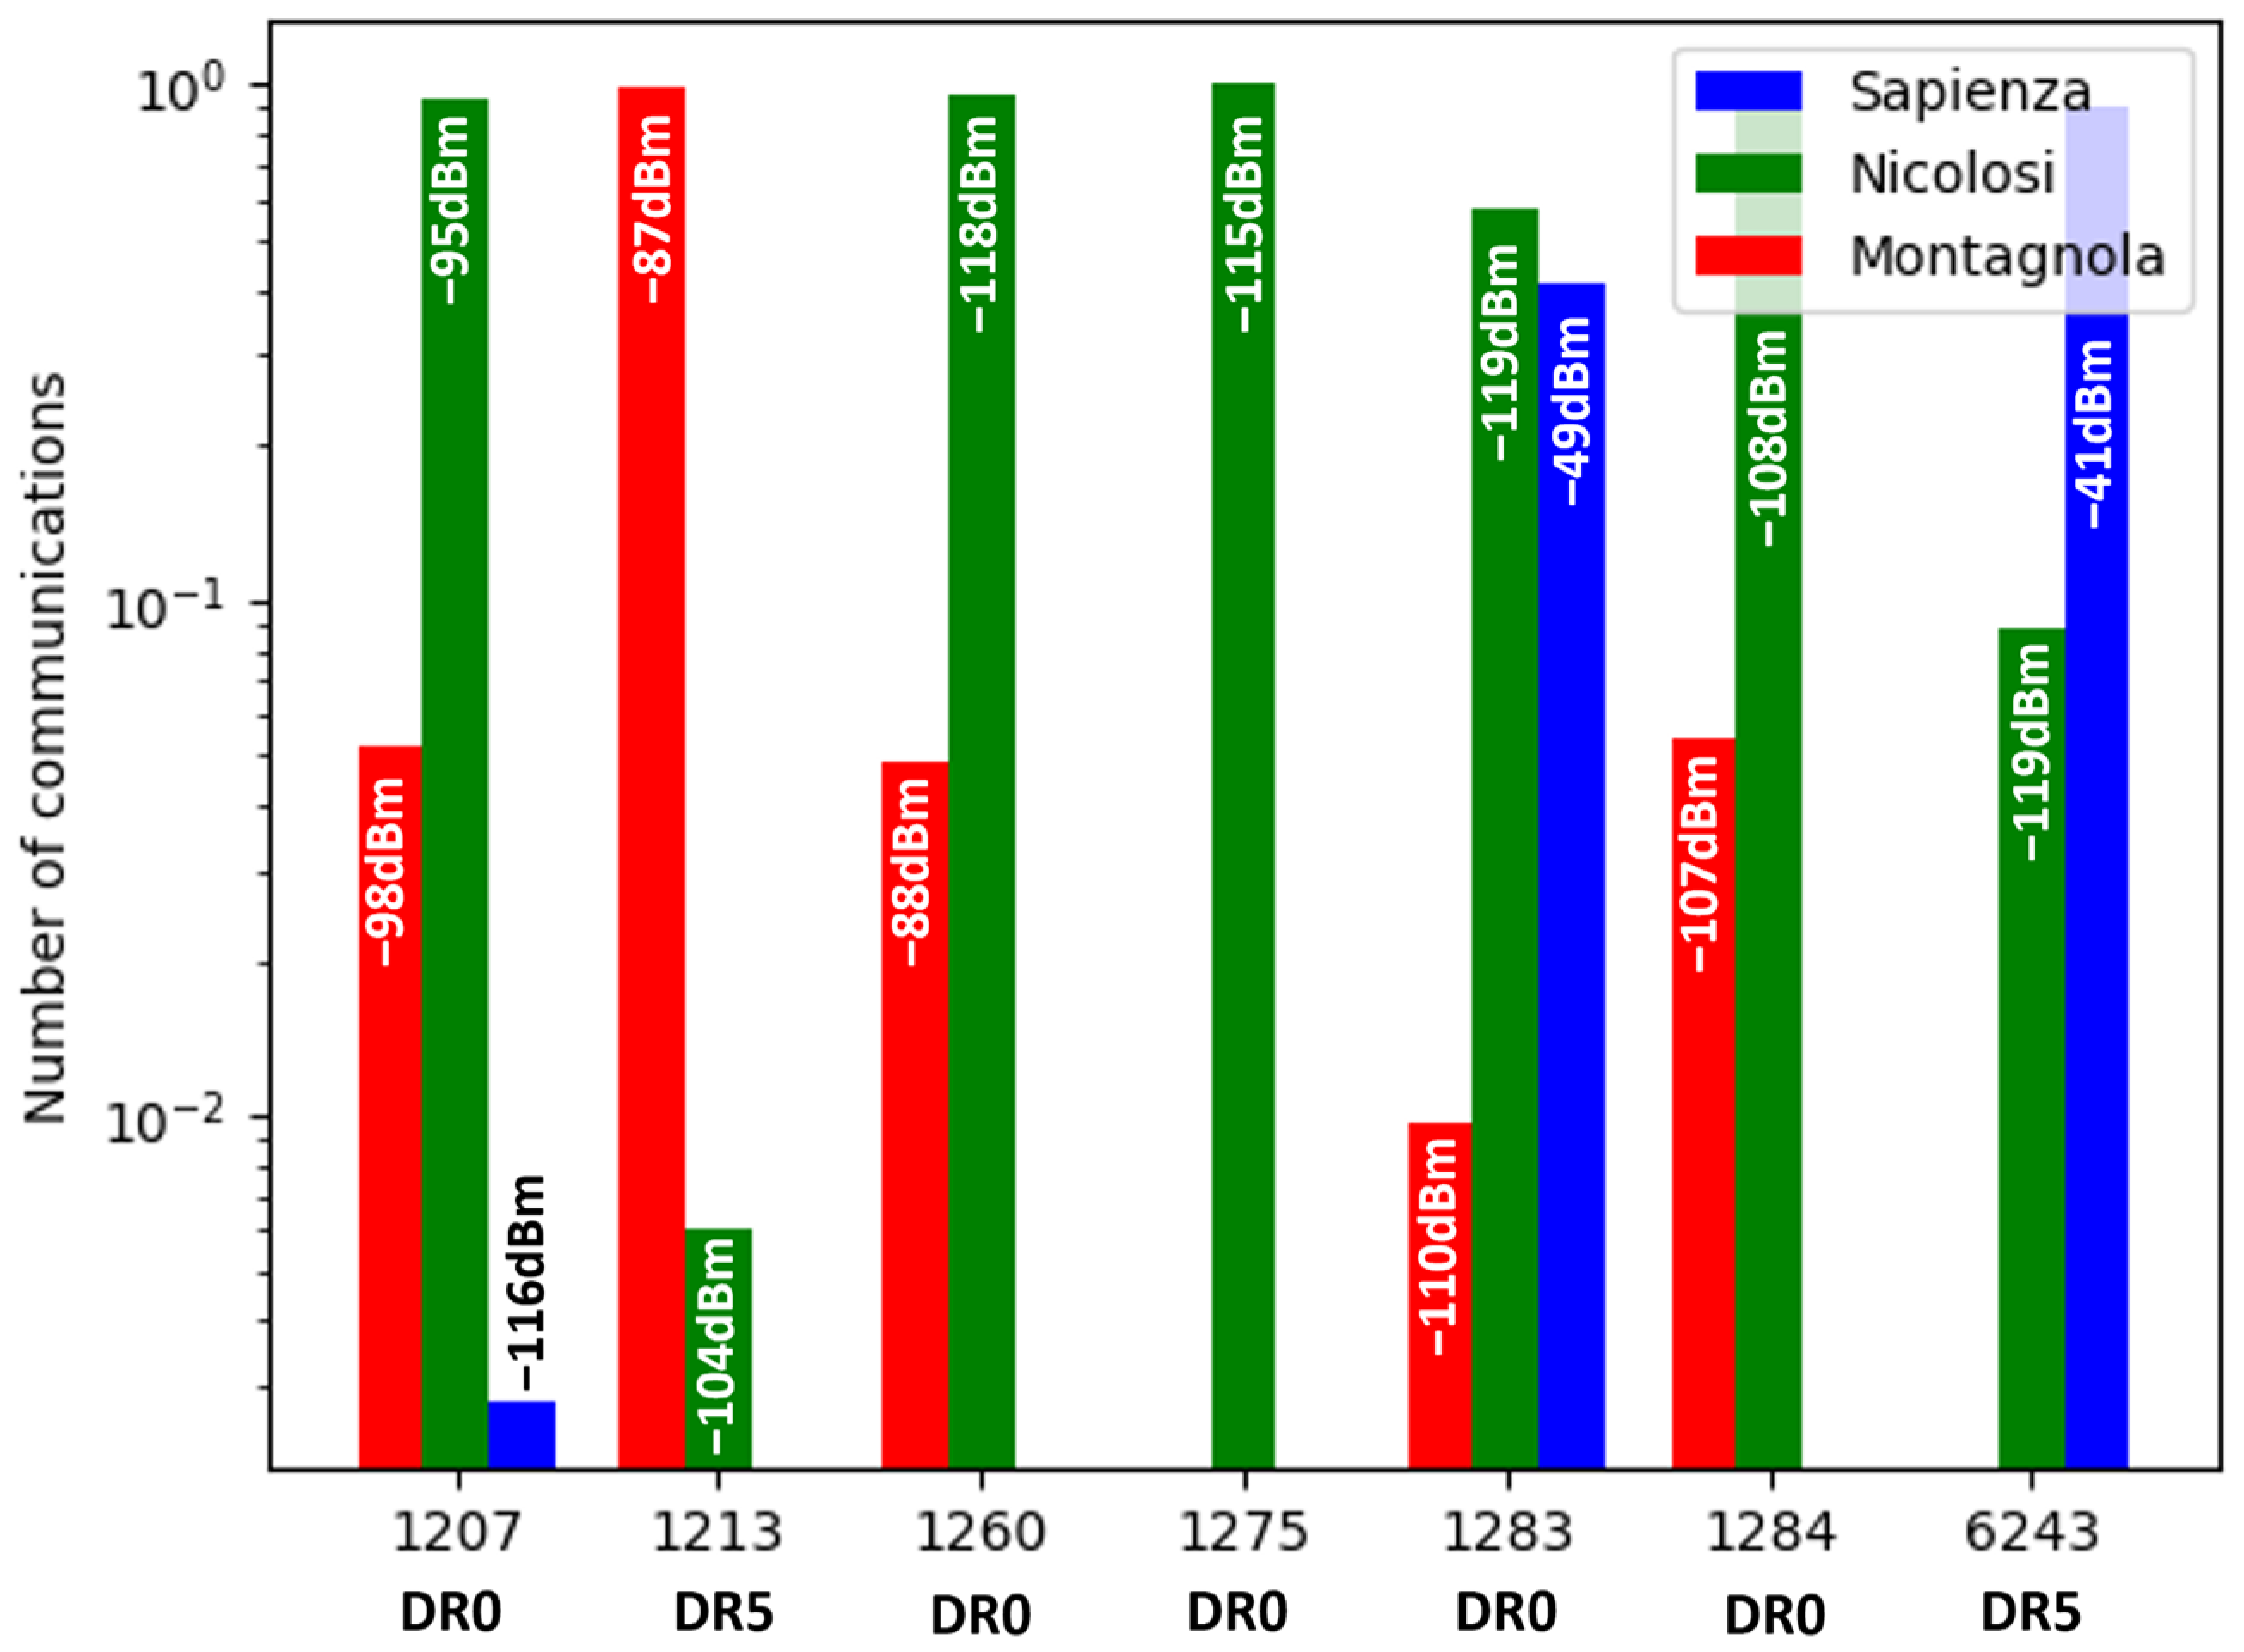
3.1.2. Communication Sharing between Gateways
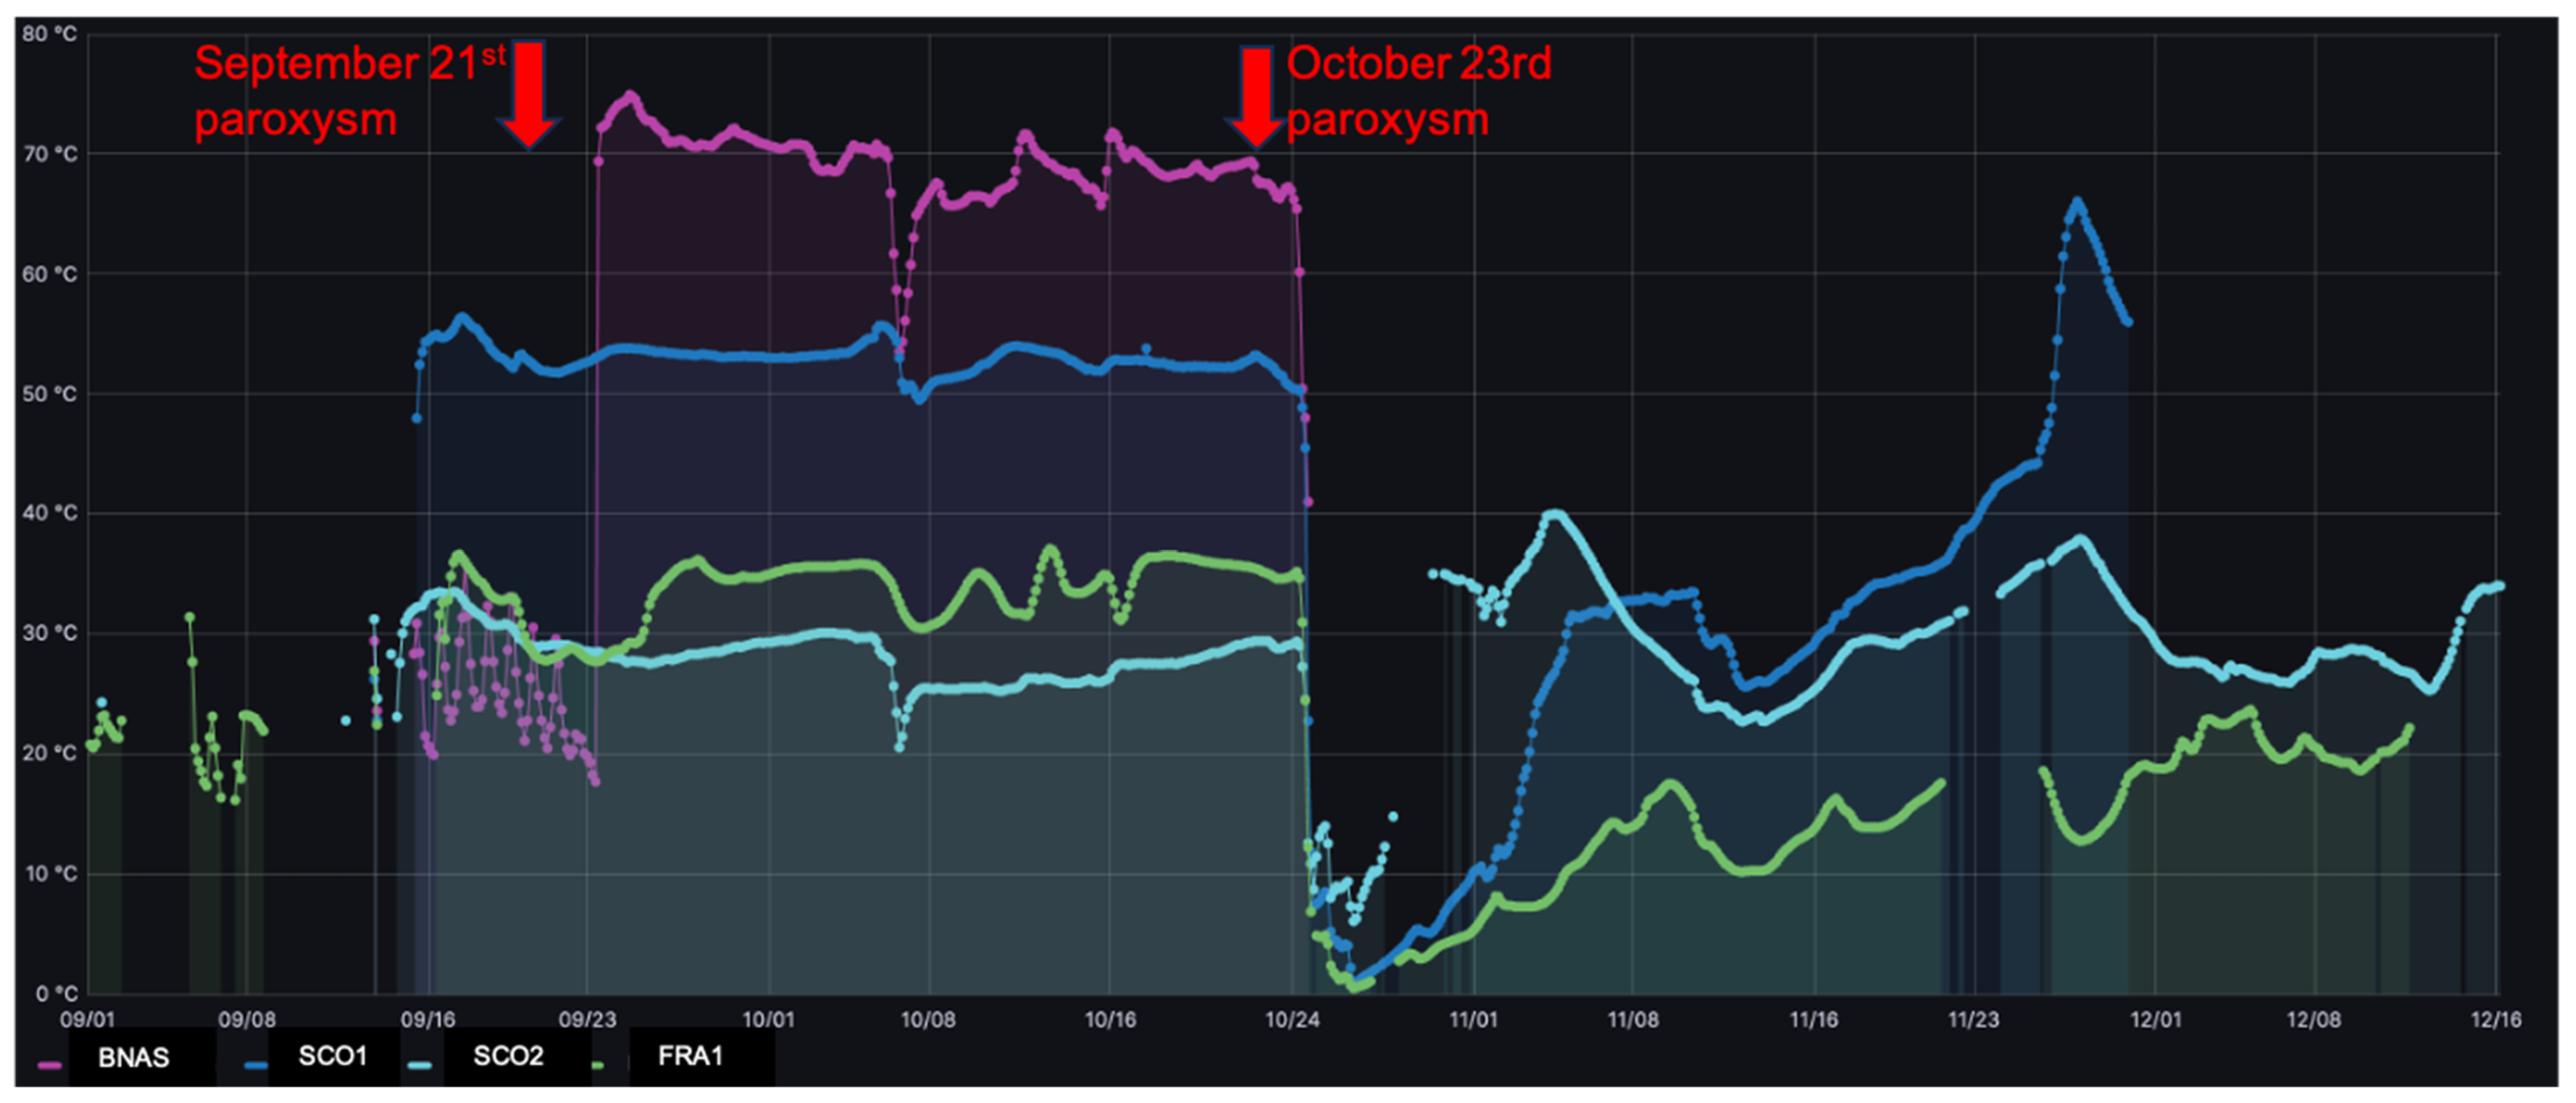
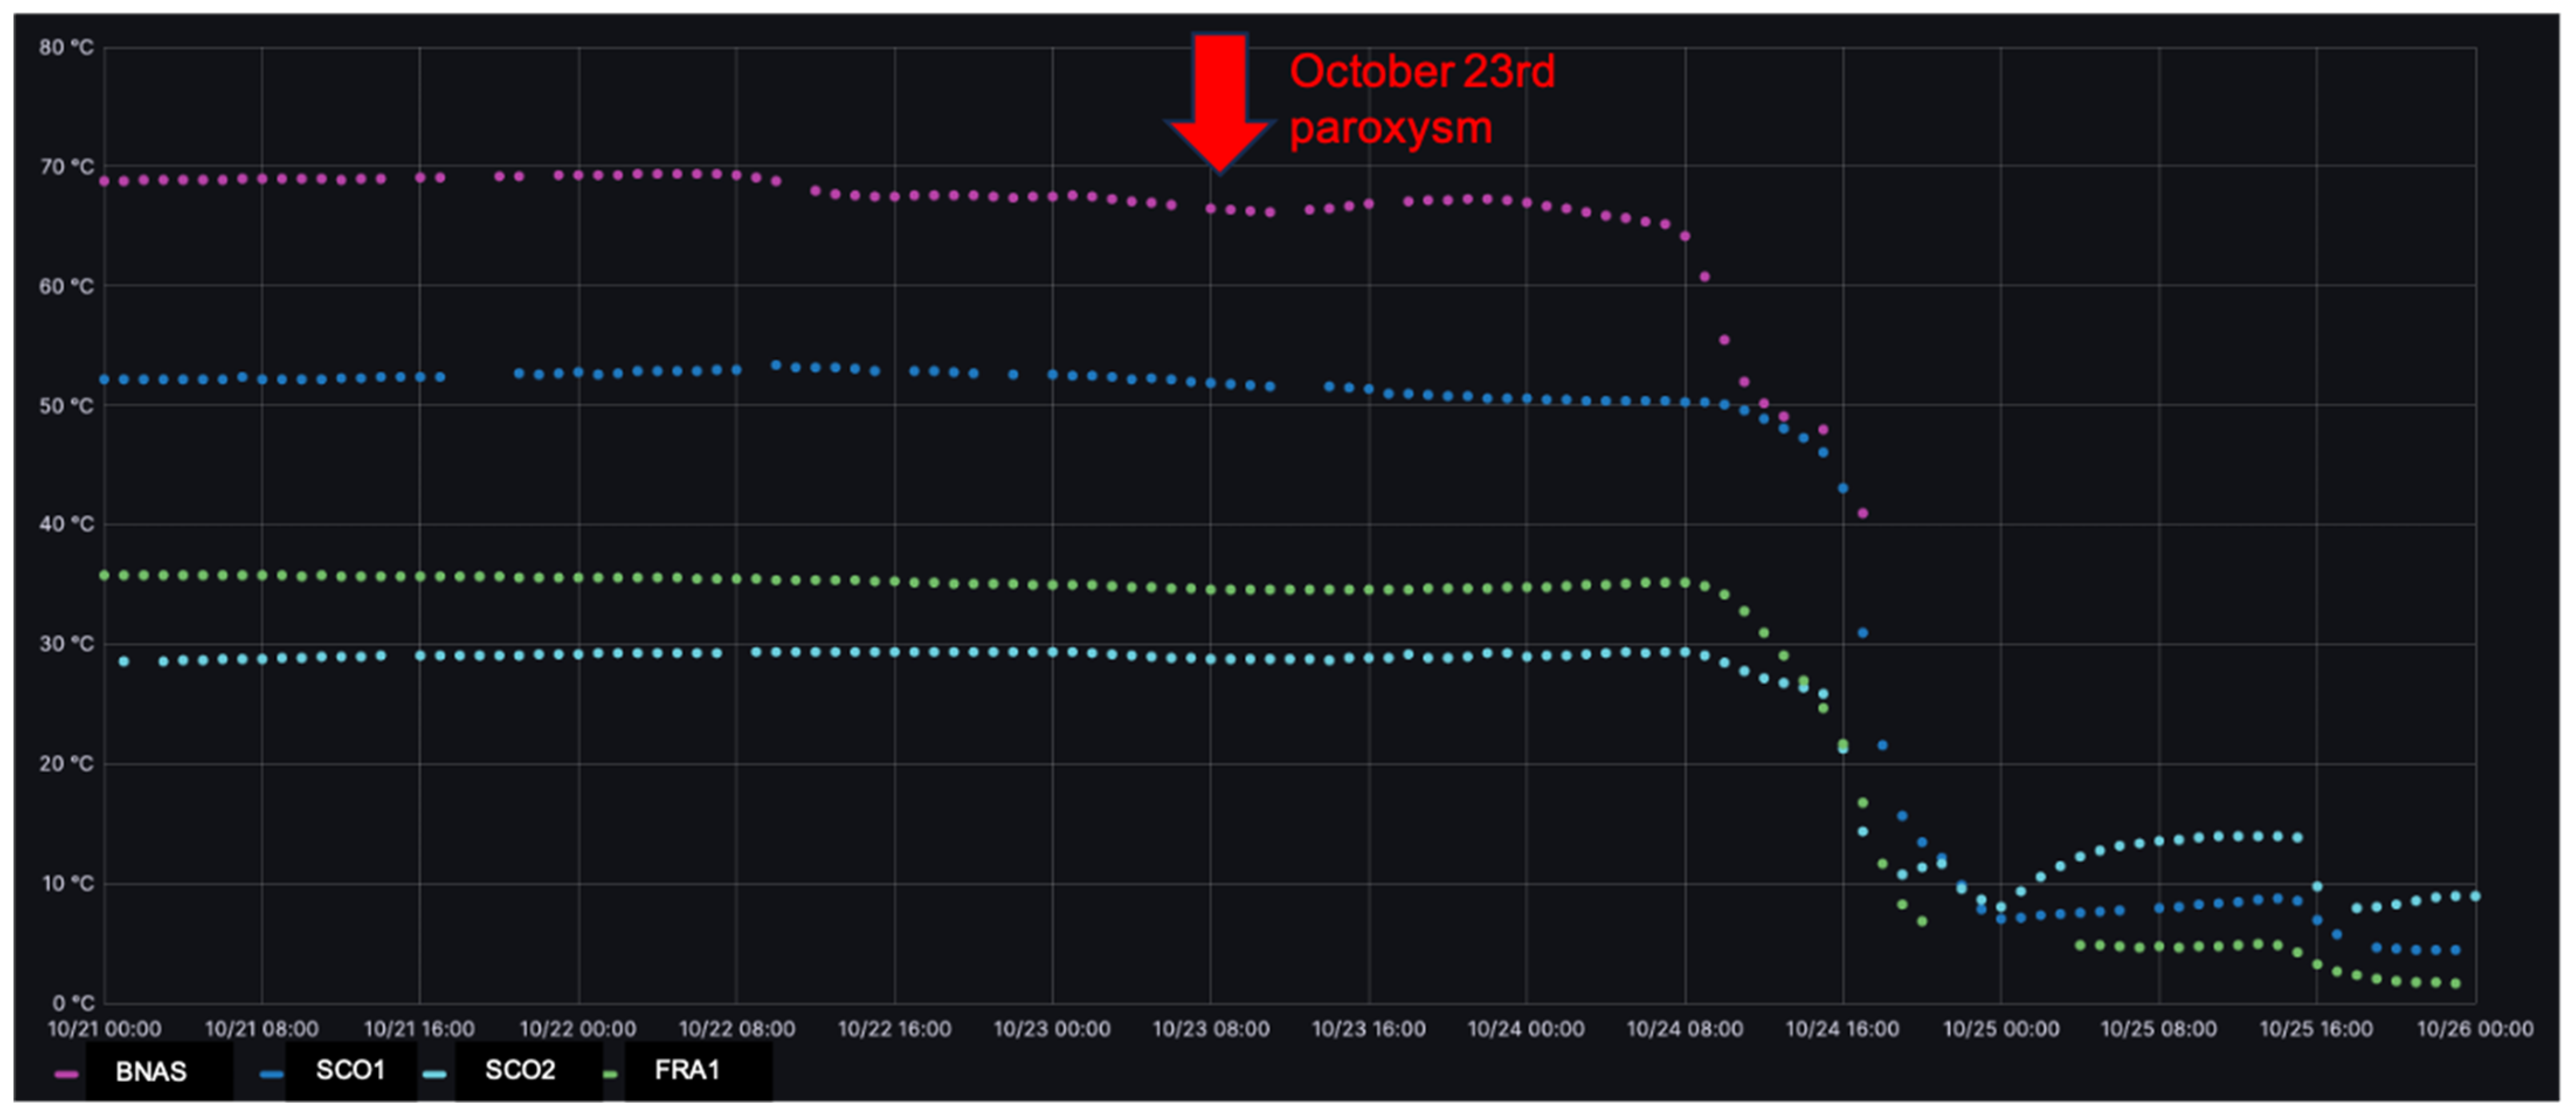
3.1.3. Temperature Measurements
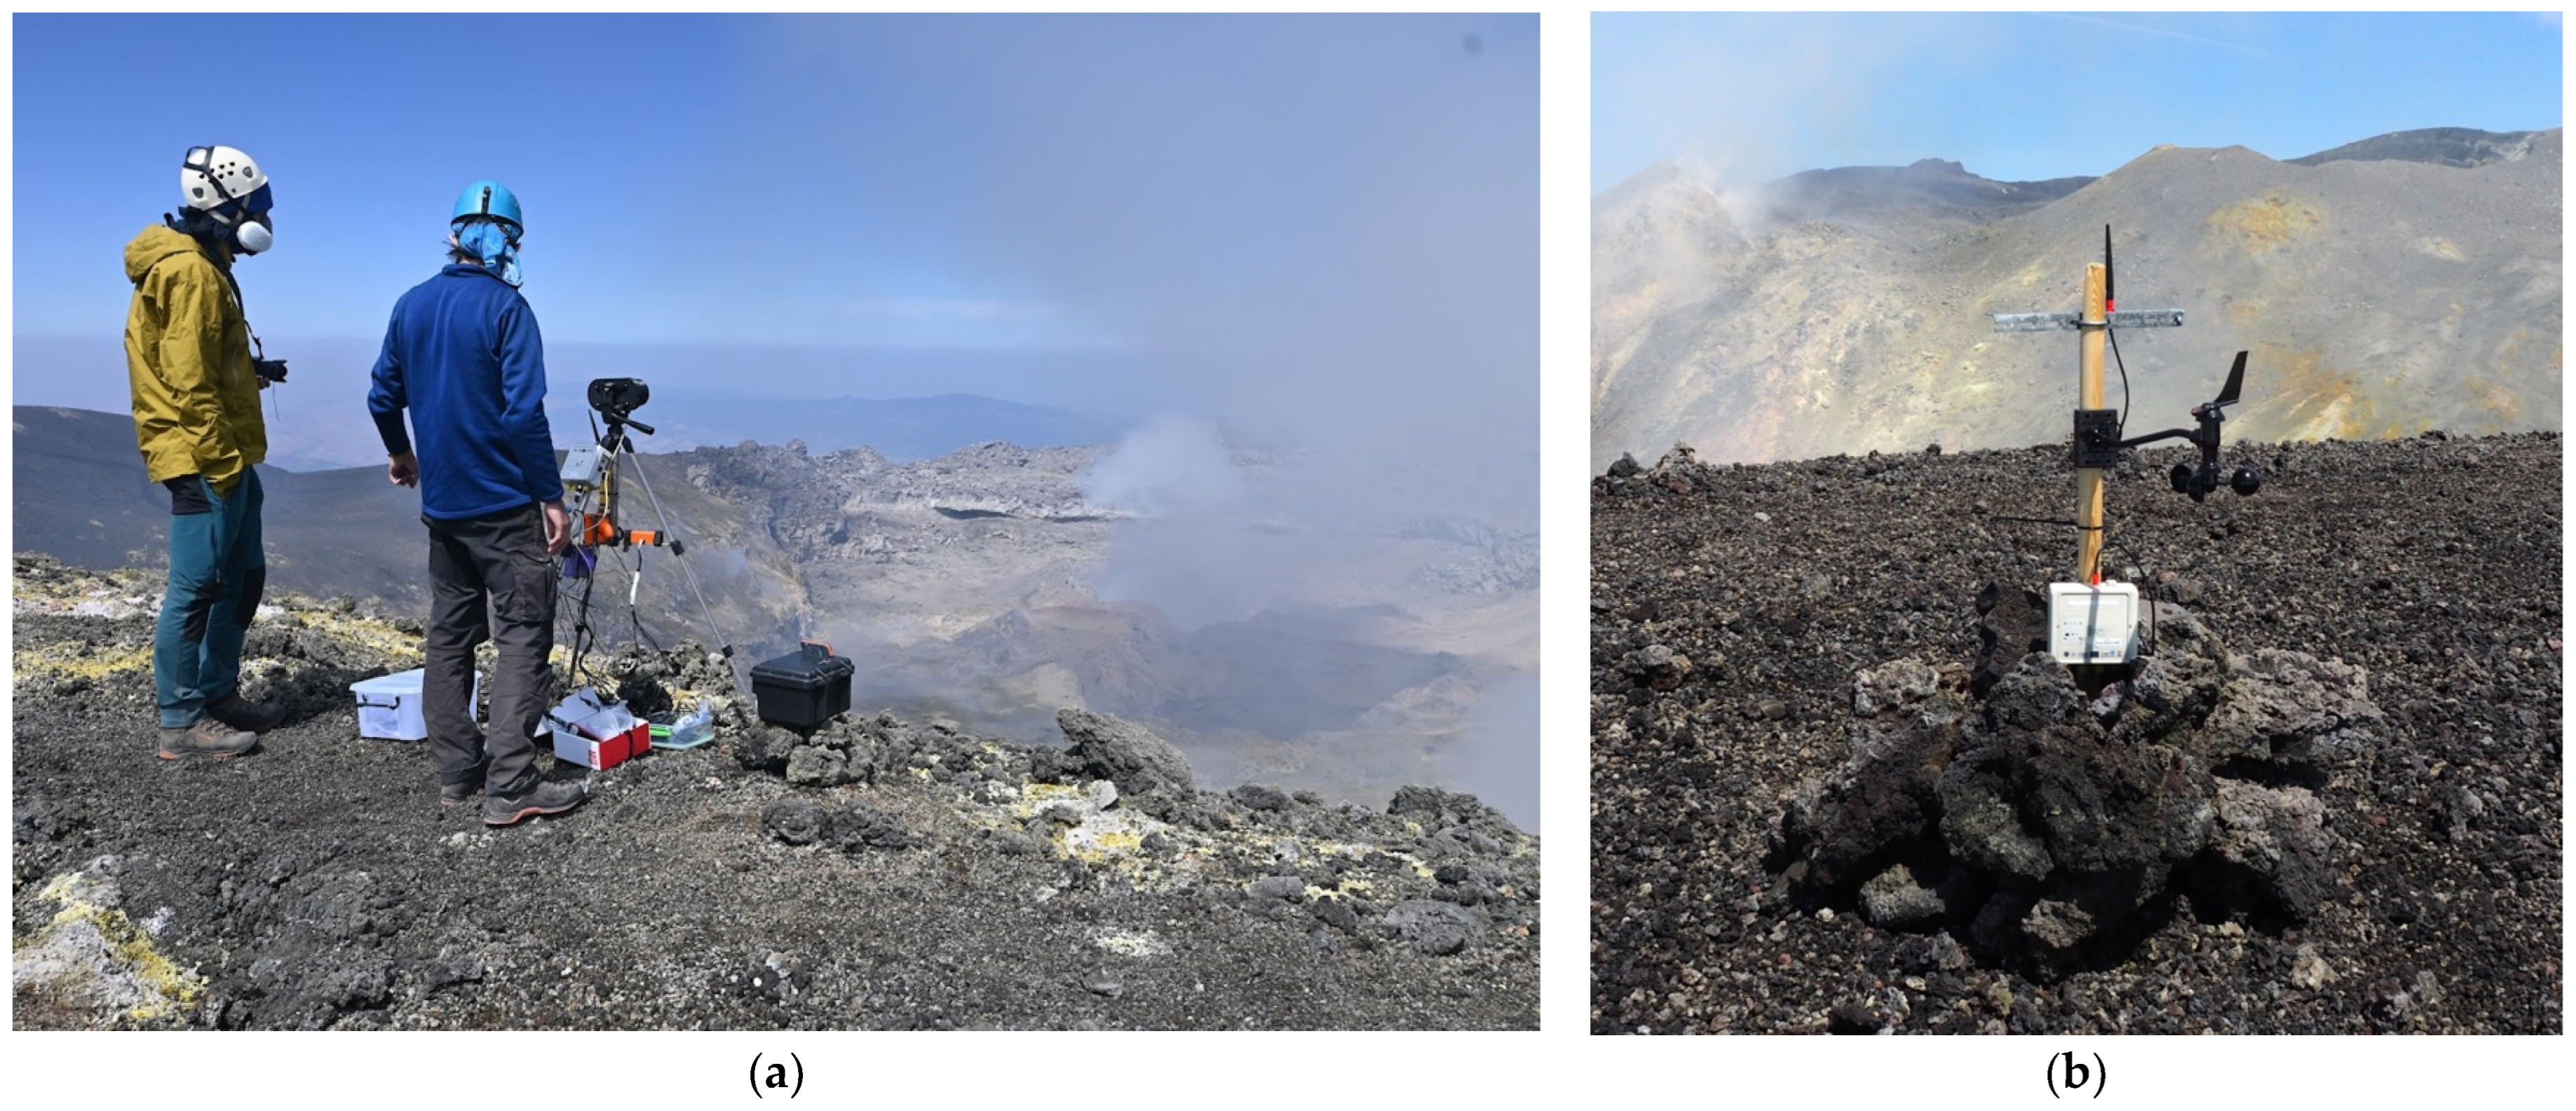
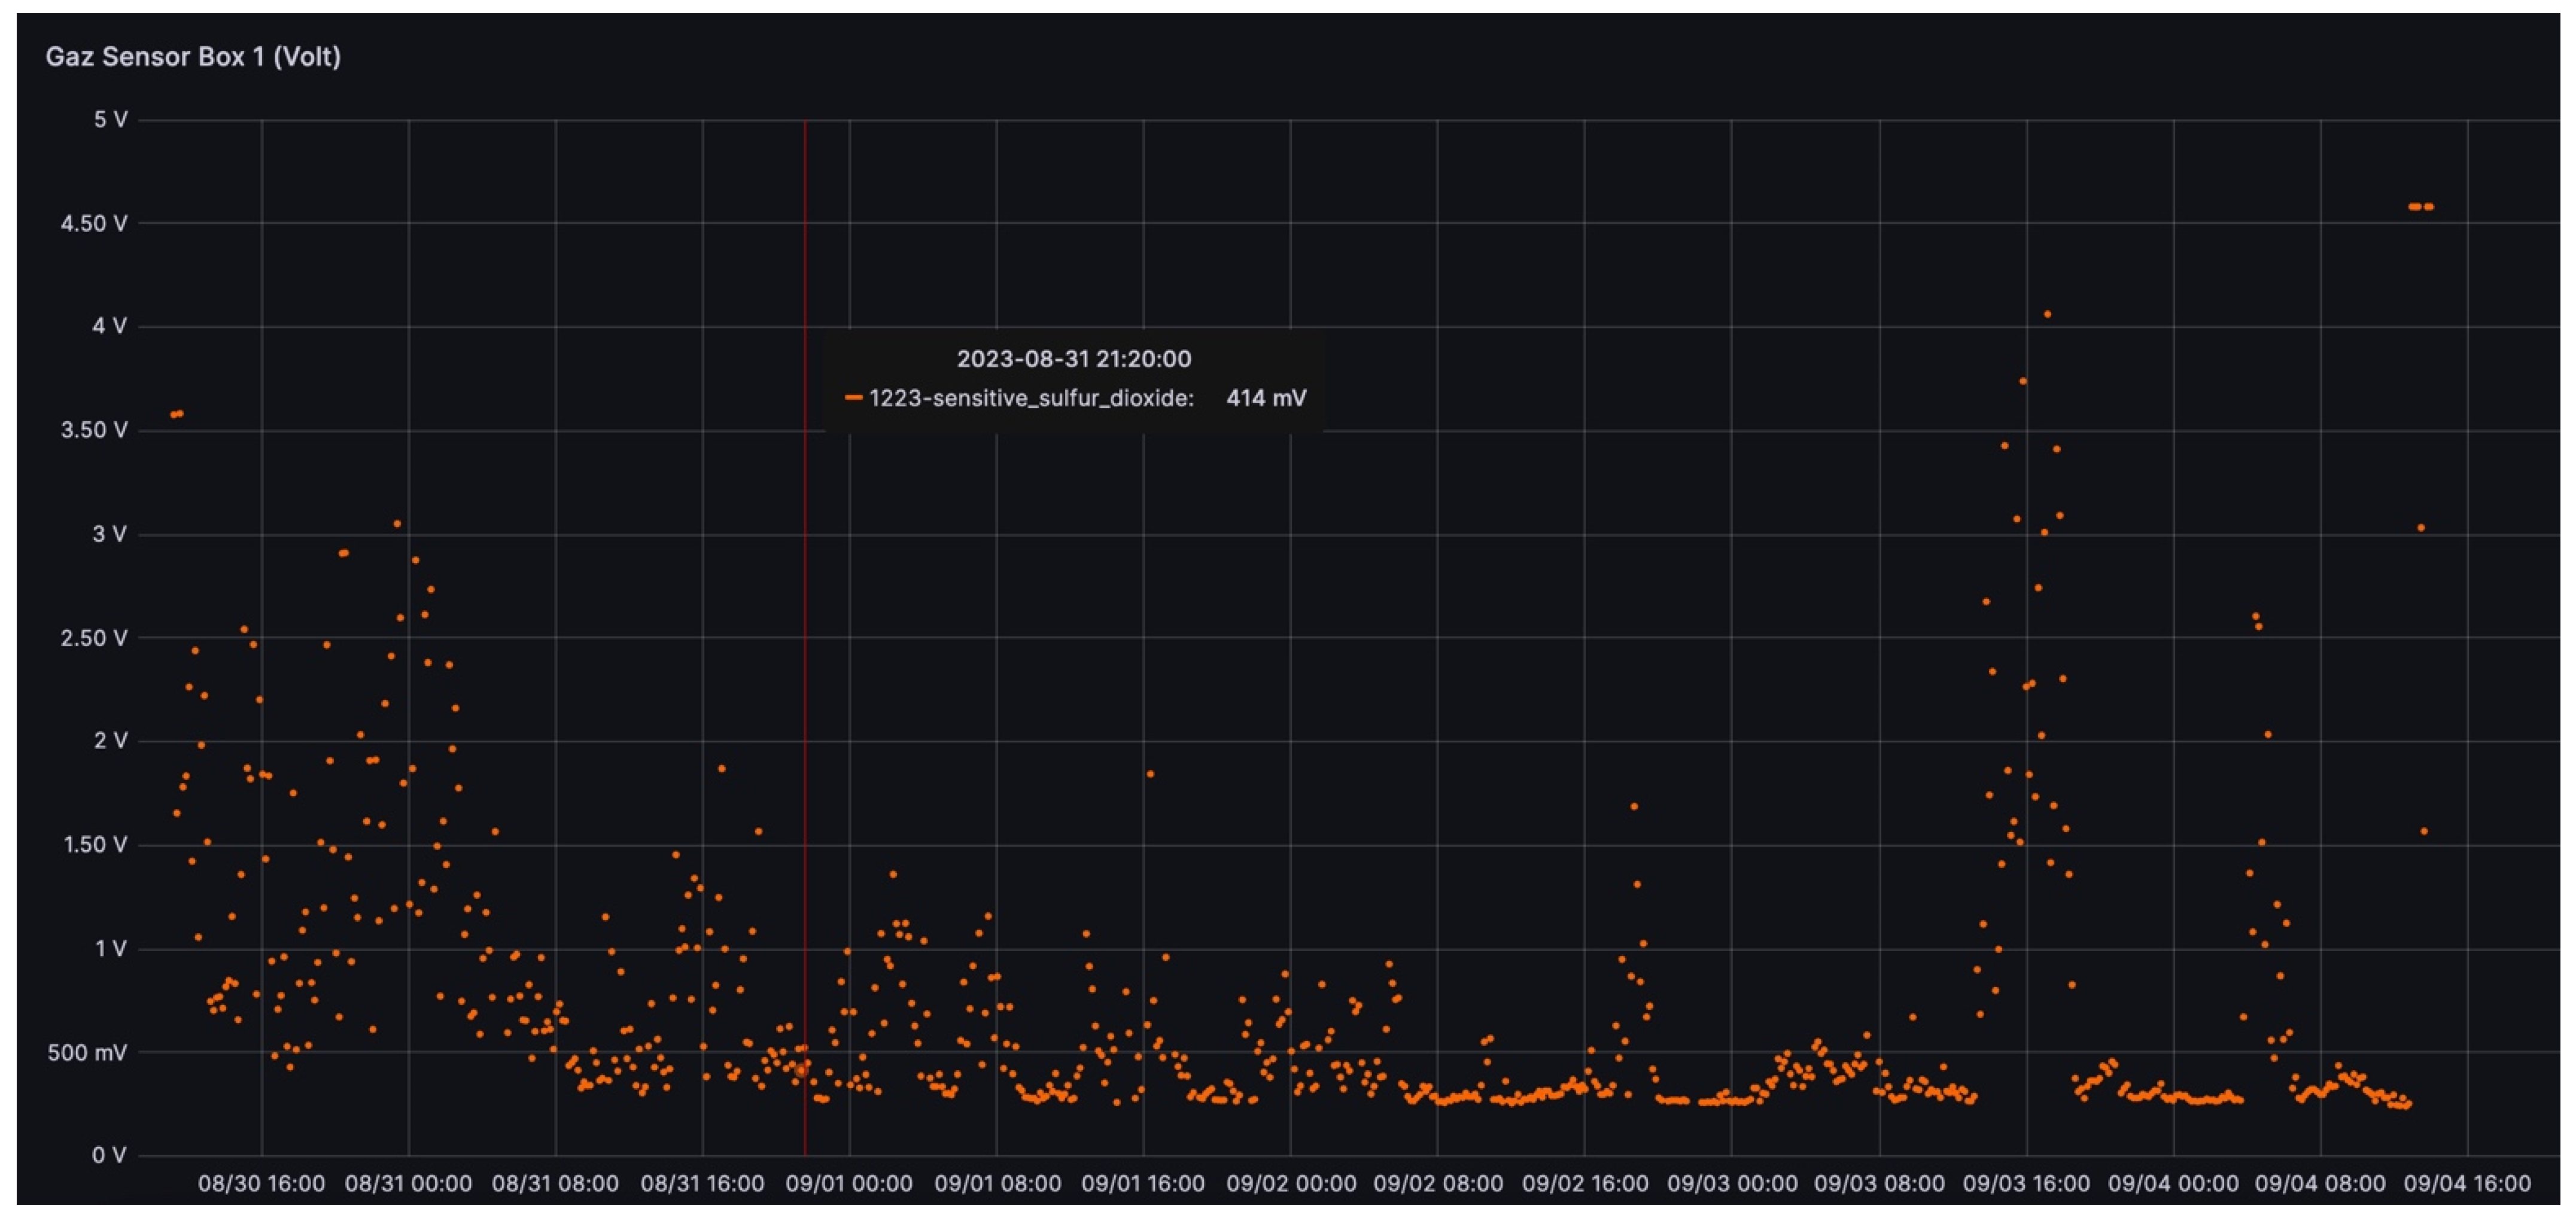
3.2. Results during August 2023 Field Trip
4. Discussion
5. Conclusions
6. Perspectives
Author Contributions
Funding
Institutional Review Board Statement
Informed Consent Statement
Data Availability Statement
Acknowledgments
Conflicts of Interest
References
- Werner-Allen, G.; Lorincz, K.; Ruiz, M.C.; Marcillo, O.; Johnson, J.B.; Lees, J.; Welsh, M. Deploying a wireless sensor network on an active volcano. IEEE Internet Comput. 2006, 10, 18–25. [Google Scholar] [CrossRef]
- Werner-Allen, G.; Johnson, J.; Ruiz, M.; Lees, J.; Welsh, M. Monitoring volcanic eruptions with a wireless sensor network. In Proceedings of the Second European Workshop on Wireless Sensor Networks, Istanbul, Turkey, 2 February 2005; pp. 108–120. [Google Scholar] [CrossRef]
- Rawat, P.; Singh, K.D.; Chaouchi, H.; Bonnin, J.M. Wireless sensor networks: A survey on recent developments and potential synergies. J. Supercomput. 2013, 68, 1–48. [Google Scholar] [CrossRef]
- Lopes Pereira, R.; Trindade, J.; Gonçalves, F.; Suresh, L.; Barbosa, D.; Vazão, T. A wireless sensor network for monitoring volcano-seismic signals. Nat. Hazards Earth Syst. Sci. 2014, 14, 3123–3142. [Google Scholar] [CrossRef]
- Lara, R.; Benítez, D.; Caamaño, A.; Zennaro, M.; Rojo-Álvarez, J.L. On Real-Time Performance Evaluation of Volcano-Monitoring Systems with Wireless Sensor Networks. IEEE Sens. J. 2015, 15, 3514–3523. [Google Scholar] [CrossRef]
- Amaliya, V.F.; Lakudo, H.; Ulum, A.H.; Destarina, L.; Seno, S.; Rakhmadi, F.A.; Aminah, N.S.; Evita, M.; Djamal, M. Development of IoT- Based Volcano Early Warning System. J. Phys. Conf. Ser. 2021, 1772, 012009. [Google Scholar] [CrossRef]
- Evita, M.; Irham, H.; Aminah, N.S.; Kane, H.; Srigutomo, W.; Meilano, I.; Setiawan, A.; Suryanto, W.; Suyanto, I.; Darmawan, H.; et al. Development of an Internet of Things Based Volcano Monitoring System. IOP Conf. Ser. Earth Environ. Sci. 2021, 830, 012023. [Google Scholar] [CrossRef]
- Patel, P.; Pandey, A.K. IoT based Volcano Multiparameter Surveillance Method. In Proceedings of the 2023 3rd International Conference on Advance Computing and Innovative Technologies in Engineering (ICACITE), Greater Noida, India, 12–13 May 2023; pp. 2277–2281. [Google Scholar] [CrossRef]
- Awadallah, S.; Moure, D.; Torres-González, P. An Internet of Things (IoT) Application on Volcano Monitoring. Sensors 2019, 19, 4651. [Google Scholar] [CrossRef] [PubMed]
- Terray, L.; Royer, L.; Sarramia, D.; Achard, C.; Bourdeau, E.; Chardon, P.; Claude, A.; Fuchet, J.; Gauthier, P.-J.; Grimbichler, D.; et al. From Sensor to Cloud: An IoT Network of Radon Outdoor Probes to Monitor Active Volcanoes. Sensors 2020, 20, 2755. [Google Scholar] [CrossRef] [PubMed]
- Mekki, K.; Bajic, E.; Chaxel, F.; Meyer, F. A comparative study of LPWAN technologies for large-scale IoT deployment. ICT Express 2019, 5, 1–7. [Google Scholar] [CrossRef]
- Corsaro, R.A.; Miraglia, L. Near Real-Time Petrologic Monitoring on Volcanic Glass to Infer Magmatic Processes During the February–April 2021 Paroxysms of the South-East Crater, Etna. Front. Earth Sci. 2022, 10, 828026. [Google Scholar] [CrossRef]
- Harris, A.J.L.; Maciejewski, A.J.H. Thermal surveys of the Vulcano Fossa fumarole field 1994–1999: Evidence for fumarole migration and sealing. J. Volcanol. Geotherm. Res. 2000, 102, 119–147. [Google Scholar] [CrossRef]
- Coppola, D.; Laiolo, M.; Cigolini, C.; Massimetti, F.; Delle Donne, D.; Ripepe, M.; Arias, H.; Barsotti, S.; Parra, C.B.; Centeno, R.G.; et al. Thermal remote sensing for global volcano monitoring: Experiences from the MIROVA system. Front. Earth Sci. 2019, 7, 1746–1763. [Google Scholar] [CrossRef]
- Chiodini, G.; Cioni, R.; Marini, L.; Panichi, C. Origin of the fumarolic fluids of Vulcano Island, Italy and implications for volcanic surveillance. Bull. Volcanol. 1995, 57, 99–110. [Google Scholar] [CrossRef]
- Madonia, P.; Rizzo, A.L.; Diliberto, I.S.; Favara, R. Continuous monitoring of fumarole temperatures at Mount Etna (Italy). J. Volcanol. Geotherm. Res. 2013, 257, 12–20. [Google Scholar] [CrossRef]
- Liotta, M.; Rizzo, A.; Paonita, A.; Caracausi, A.; Martelli, M. Sulfur isotopic compositions of fumarolic and plume gases at Mount Etna (Italy) and inferences on their magmatic source. Geochem. Geophys. Geosystem 2012, 13. [Google Scholar] [CrossRef]
- Bisson, M.; Spinetti, C.; Andronico, D.; Palaseanu-Lovejoy, M.; Buongiorno, M.F.; Alexandrov, O.; Cecere, T. Ten years of volcanic activity at Mt Etna: High-resolution mapping and accurate quantification of the morphological changes by Pleiades and Lidar data. Int. J. Appl. Earth Obs. Geoinf. 2021, 102, 102369. [Google Scholar] [CrossRef]
- Available online: https://algade.com/wp-content/uploads/2023/03/NT-AER2Plus-AER2C-EN.pdf (accessed on 7 January 2024).
- Terray, L.; Gauthier, P.-J.; Breton, V.; Giammanco, S.; Sigmarsson, O.; Salerno, G.; Caltabiano, T.; Falvard, A. Radon activity in volcanic gases of Mt. Etna by passive dosimetry. J. Geophys. Res. Solid Earth 2020, 125, e2019JB019149. [Google Scholar] [CrossRef]
- Giammanco, S.; Melián, G.; Neri, M.; Hernández, P.A.; Sortino, F.; Barrancos, J.; López, M.; Pecoraino, G.; Perez, N.M. Active tectonic features and structural dynamics of the summit area of Mt. Etna (Italy) revealed by soil CO2 and soil temperature surveying. J. Volcanol. Geotherm. Res. 2016, 311, 79–98. [Google Scholar] [CrossRef]
- PT100. Available online: https://befr.rs-online.com/web/p/rtd-sensors/8722727 (accessed on 7 January 2024).
- Wong, A.; Chow, Y.T. Solar-Supplied Satellite Internet Access Point for the Internet of Things in Remote Areas. Sensors 2020, 20, 1409. [Google Scholar] [CrossRef] [PubMed]
- Elastic. What Is ELK Stack. 2024. Available online: https://www.elastic.co/elastic-stack (accessed on 7 January 2024).
- Mobaraki, B.; Komarizadehasl, S.; Castilla Pascual, F.J.; Lozano-Galant, J.A. Application of Low-Cost Sensors for Accurate Ambient Temperature Monitoring. Buildings 2022, 12, 1411. [Google Scholar] [CrossRef]


| Device Name | Device Type | Location | Latitude N | Longitude E | Altitude (m) |
|---|---|---|---|---|---|
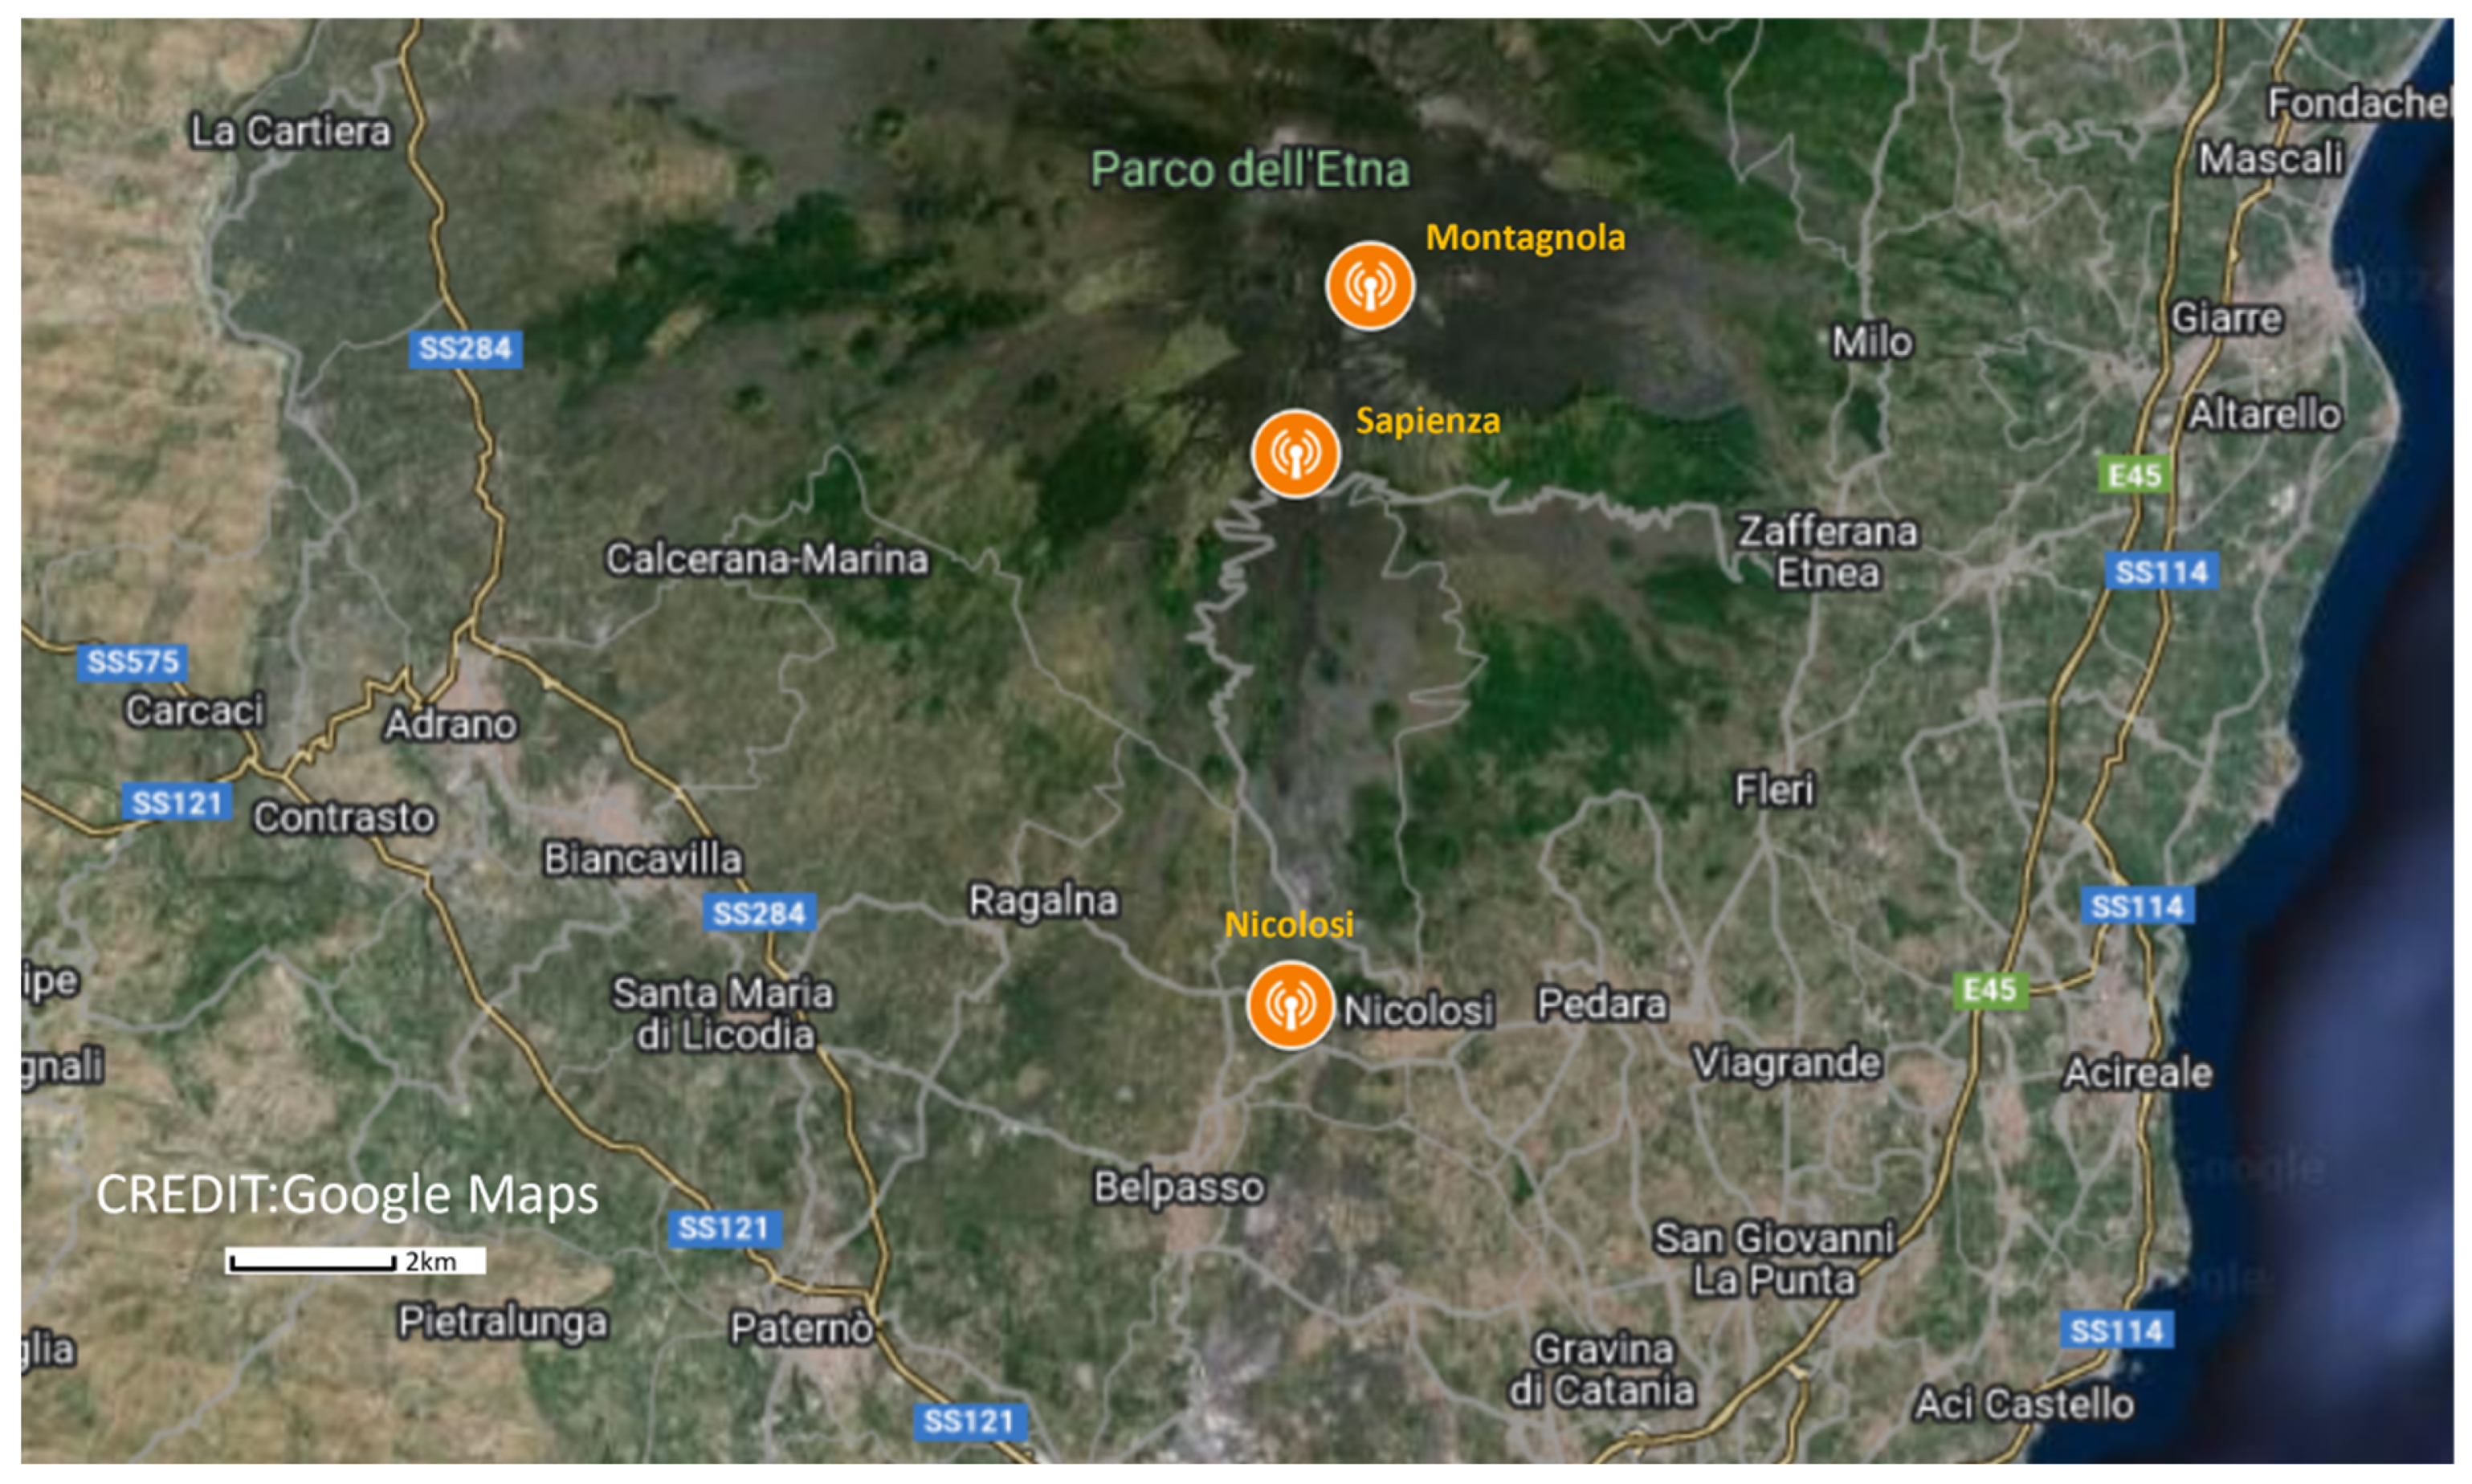
| NIC | Gateway | Scuola Dusmet, Nicolosi | 37°36′50.40″ | 15°01′08.76″ | 731 |
| MON | Gateway | INGV shelter, Montagnola | 37°43′08.55″ | 15°0′13.21″ | 2600 |
| SAP | Gateway | Esagonal, Sapienza area | 37°42′0.00″ | 14°59′57.49″ | 1903 |
| MFRU | Communicating node n°1284 | Monte Frumento, meteorological station | 37°43′57.27″ | 14°59′43.35″ | 2827 |
| SCO2/node RLT | Communicating node n°1207 | Scoria cone 2002, thermal monitoring station | 37°43′54.16″ | 15°0′0.59″ | 2911 |
| FRA1/Node OPGC | Communicating node n°1213 | Scoria cone 2001, thermal monitoring station | 37°43′12.90″ | 15°0′18.30″ | 2640 |
| SCO1/2001 top | Communicating node n°1260 | Scoria cone 2001, thermal monitoring station | 37°43′18.52″ | 15°0′16.84″ | 2696 |
| ESAP | Communicating node n°1283 | Esagonal, pluviometer | 37°42′0.00″ | 14°59′57.49″ | 1903 |
| ESAM | Communicating node n°6243 | Esagonal, meteorological station | 37°42′0.00″ | 14°59′57.49″ | 1903 |
| BNAS/Bocca Nuova | Communicating node n°1275 | Bocca Nuova south, thermal monitoring station | 37°44′56.90″ | 14°59′29.83″ | 3235 |
| Gateway/Node | MFRU | SCO2 | FRA1 | SCO1 | ESAM | ESAP | BNAS |
|---|---|---|---|---|---|---|---|
| NIC | 13.48 | 13.35 | 12.01 | 12.19 | 9.77 | 9.77 | 15.39 |
| MON | 1.69 | 1.47 | 0.19 | 0.33 | 2.26 | 2.26 | 3.56 |
| SAP | 3.75 | 3.66 | 2.42 | 2.59 | 0.00 | 0.00 | 5.65 |
| Communicating Node Name | Node Number | Node Location | Data Rate | First Transmission Failure Rate (%) | Number of Packets Received | Number of Packets Expected | Data Loss Rate (%) |
|---|---|---|---|---|---|---|---|
| SCO2 | 1207 | Scoria cone 2002 | 0 | 15% | 1663 | 1968 | 15% |
| SCO1 | 1260 | Scoria cone 2001 | 0 | 6% | 1710 | 1810 | 6% |
| BNAS | 1275 | Bocca Nuova sud | 0 | 2% | 877 | 937 | 2% |
| ESAP | 1283 | Esagonal, Sapienza | 0 | 46% | 1049 | 1934 | 46% |
| MFRU | 1284 | Monte Frumento | 0 | 12% | 1715 | 1940 | 12% |
| ESAM | 6243 | Esagonal, Sapienza | 5 | 7% | 1976 | 1976 | 0% |
| FRA1 | 1213 | Scoria cone 2001 | 5 | 36% | 1883 | 1946 | 3% |
| Nodes | Sensor Type | GPS Coordinates | Installation Time | Dismantling Time | Connectivity to Gateways | Position |
|---|---|---|---|---|---|---|
| 1223 | Gas | 37.732576° N, 14.995165° E | 26 August 2023 14 h 30 min | 27 August 2023 16 h | Yes | 1 m above ground |
| 1271 | Gas | 37.732576° N, 14.995165° E | 26 August 2023 14 h 30 min | 27 August 2023 16 h | Yes | 1 m above ground |
| 1288 | Gas | 37.733392° N 14.997995° E | 26 August 2023 11 h 20 min | 26 August 2023 16 h | No | On the ground |
| 1302 | Gas | 37.733392° N 14.997995° E | 26 August 2023 11 h 20 min | 26 August 2023 16 h | No | On the ground |
| 1223 | Gas | 37.749065° N, 14.995015° E | 30 August 2023 | 4 September 2023 | Yes | 1 m above ground |
| 1271 | Gas | 37.749065° N, 14.995015° E | 30 August 2023 | 4 September 2023 | Yes | 1 m above ground |
| 1288 | Gas | 37.748882° N 14.994205° E | 30 August 2023 | 4 September 2023 | Yes | 1 m above ground |
| 1302 | Gas | 37.748882° N 14.994205° E | 30 August 2023 | 4 September 2023 | No | 1 m above ground |
| 1280 | Anemometer | 37.748718° N, 14.992689° E | 29 August 2023 | 4 September 2023 | Yes | 1 m above ground |
| Nodes | Data Rate (DR) | Number of Packets Received | Nicolosi Gateway | Montagnola Gateway | ||
|---|---|---|---|---|---|---|
| Communication Rate (%) | RSSI (dBm) | Communication Rate (%) | RSSI (dBm) | |||
| 1223 | 5 | 1319 | 100 | −114 | 0 | - |
| 1271 | 5 | 1259 | 96 | −111 | 4 | −109 |
| 1288 | 5 | 73 | 99 | −119 | 1 | −110 |
| 1280 | 5 | 511 | 90 | −108 | 10 | −109 |
| 1302 | 5 | 0 | - | - | - | - |
| Nodes | Number of Expected Packets | Number of Missing Packets | Data Loss Rate |
|---|---|---|---|
| 1223 | 1473 | 154 | 10.5% |
| 1271 | 1342 | 83 | 6% |
| 1288 | 1481 | 1408 | 95.1% |
| 1280 | 519 | 8 | 1.5% |
Disclaimer/Publisher’s Note: The statements, opinions and data contained in all publications are solely those of the individual author(s) and contributor(s) and not of MDPI and/or the editor(s). MDPI and/or the editor(s) disclaim responsibility for any injury to people or property resulting from any ideas, methods, instructions or products referred to in the content. |
© 2024 by the authors. Licensee MDPI, Basel, Switzerland. This article is an open access article distributed under the terms and conditions of the Creative Commons Attribution (CC BY) license (https://creativecommons.org/licenses/by/4.0/).
Share and Cite
Royer, L.; Terray, L.; Rubéo-Lisa, M.; Sudre, J.; Gauthier, P.-J.; Claude, A.; Giammanco, S.; Pecora, E.; Principato, P.; Breton, V. Lessons Learnt from Monitoring the Etna Volcano Using an IoT Sensor Network through a Period of Intense Eruptive Activity. Sensors 2024, 24, 1577. https://doi.org/10.3390/s24051577
Royer L, Terray L, Rubéo-Lisa M, Sudre J, Gauthier P-J, Claude A, Giammanco S, Pecora E, Principato P, Breton V. Lessons Learnt from Monitoring the Etna Volcano Using an IoT Sensor Network through a Period of Intense Eruptive Activity. Sensors. 2024; 24(5):1577. https://doi.org/10.3390/s24051577
Chicago/Turabian StyleRoyer, Laurent, Luca Terray, Maxime Rubéo-Lisa, Julien Sudre, Pierre-Jean Gauthier, Alexandre Claude, Salvatore Giammanco, Emilio Pecora, Paolo Principato, and Vincent Breton. 2024. "Lessons Learnt from Monitoring the Etna Volcano Using an IoT Sensor Network through a Period of Intense Eruptive Activity" Sensors 24, no. 5: 1577. https://doi.org/10.3390/s24051577