
Performance Evaluation Method for Intelligent Computing Components for Space Applications
Abstract
:1. Introduction
2. Related Work
3. Evaluation Method
3.1. Overall Approach
- The algorithms and input configurations in the benchmark need to cover existing spaceborne processing applications, as well as future scenarios and their performance requirements in different space domains;
- The benchmark tests should not be limited to a given processor, such as supporting a single programming model or architecture, but should be able to run on multiple platforms;
- The platform-independent parts of the benchmark should be the same for all platforms to enable fair comparisons;
- It is necessary to use common performance metrics for comparison. The performance metrics used in this evaluation include commonly used metrics such as total execution time, throughput, and FLOPS.
3.2. Common Benchmark—CoreMark-Pro Benchmark
3.3. High-Performance Computing Benchmark
3.3.1. Fast Fourier Transformation Benchmark (FFT)
3.3.2. Finite Impulse Response Benchmark (FIR)
3.3.3. Local Response Normalization Benchmark
3.3.4. Matrix Multiplication Benchmark (GEMM)
3.3.5. Convolution_2D and Correlation_2D Benchmark
3.3.6. Max Pooling and CIFAR-10 Benchmark
3.4. Typical Application Benchmarks in Space
3.4.1. Image Calibration Application Benchmark
3.4.2. AES Encryption Application Benchmark
4. Benchmark Execution and Evaluation
4.1. Experimental Hardware Platforms
4.2. CoreMark-Pro Benchmark Experiment Results
4.3. High-Performance Computing Benchmark Experiment Results
4.3.1. Test Results on GPUs
4.3.2. Test Results on CPUs
4.4. Typical Application Benchmark Experimental Results
4.4.1. Image Calibration Benchmark Test Results
4.4.2. AES Encryption Algorithm Benchmark Test Results
4.5. Data Transmission Time Analysis
5. Conclusions
Author Contributions
Funding
Data Availability Statement
Conflicts of Interest
References
- Lovelly, T.M.; Bryan, D.; Cheng, K.; Kreynin, R.; George, A.D.; Gordon-Ross, A.; Mounce, G. A framework to analyze processor architectures for next-generation on-board space computing. In Proceedings of the 2014 IEEE Aerospace Conference, Big Sky, MT, USA, 1–8 March 2014; pp. 1–10. [Google Scholar] [CrossRef]
- Doyle, R.; Goforth, M.; Some, R.; Powell, W.; Whitaker, W.; Bergman, L.; Johnson, M.; Lowry, M. Human and Robotic Space Mission Use Cases for High-Performance Spaceflight Computing; AIAA: San Diego, CA, USA, 2013. [Google Scholar]
- Doyle, R.; Some, R.; Powell, W.; Mounce, G.; Goforth, M.; Horan, S.; Lowry, M. High Performance Spaceflight Computing; Next-Generation SpaceProcessor: A Joint Investment of NASA and AFRL. In Proceedings of the International Symposium on Artificial Intelligence, Robotics, and Automation in Space (i-SAIRAS), Montreal, QC, Canada, 17–19 June 2014; Canadian Space Agency: Longueuil, QC, Canada, 2014. [Google Scholar]
- Mounce, G.; Lyke, J.; Horan, S.; Powell, W.; Doyle, R.; Some, R. Chiplet based approach for heterogeneous processing and packaging architectures. In Proceedings of the 2016 IEEE Aerospace Conference, Big Sky, MT, USA, 5–12 March 2016; pp. 1–12. [Google Scholar] [CrossRef]
- Can, L. Research on GPU Array Parallel Algorithm for Geometric Correction of Remote Sensing Images. Master’s Thesis, University of Electronic Science and Technology of China, Chengdu, China, 2019. [Google Scholar]
- Liuyang, F. Research on High Performance Processing Methods for Optical Satellite Remote Sensing Data with CPU/GPU Collaboration. Ph.D. Thesis, Wuhan University, Wuhan, China, 2015. [Google Scholar]
- Wesley, P.; Michael, C.; Teresa, S.; Abigail, D.; Sebastian, W. Commercial Off-The-Shelf GPU Qualification for Space Applications; NASA: Washington, DC, USA, 2018. [Google Scholar]
- Li, N.; Xiao, A.; Yu, M.; Zhang, J.; Dong, W. Application of GPU On-orbit and Self-adaptive Scheduling by its Internal Thermal Sensor. In Proceedings of the International Astronautical Congress (IAC), Bremen, Germany, 1–5 October 2018. [Google Scholar]
- Ji, T. Calculation and Analysis of Low Earth Orbit Satellite Constellation Coverage Performance Based on GPU Acceleration. Master’s Thesis, Harbin Institute of Technology, Harbin, China, 2018. [Google Scholar]
- Luchena, D.; Schiattarella, V.; Spiller, D.; Moriani, M.; Curti, F. A New Complementary Multi-Core Data Processor for Space Applications. In Proceedings of the International Astronautical Congress (IAC), Bremen, Germany, 1–5 October 2018. [Google Scholar]
- Williams, J.; Massie, C.; George, A.D.; Richardson, J.; Gosrani, K.; Lam, H. Characterization of Fixed and Reconfigurable Multi-Core Devices for Application Acceleration. ACM Trans. Reconfigurable Technol. Syst. (TRETS) 2010, 3, 1–29. [Google Scholar] [CrossRef]
- Richardson, J.; Fingulin, S.; Raghunathan, D.; Massie, C.; George, A.; Lam, H. Comparative analysis of HPC and accelerator devices: Computation, memory, I/O, and power. In Proceedings of the 2010 Fourth International Workshop on High-Performance Reconfigurable Computing Technology and Applications (HPRCTA), New Orleans, LA, USA, 14 November 2010; pp. 1–10. [Google Scholar] [CrossRef]
- Luo, C.; Zhang, F.; Huang, C.; Xiong, X.; Chen, J.; Wang, L.; Gao, W.; Ye, H.; Wu, T.; Zhou, R.; et al. AIoT Bench: Towards Comprehensive Benchmarking Mobile and Embedded Device Intelligence in Benchmarking, Measuring, and Optimizing; Zheng, C., Zhan, J., Eds.; Springer International Publishing: New York, NY, USA, 2019; pp. 31–35. [Google Scholar]
- EEMBC. The ADAS Mark Benchmark. Available online: https://www.eembc.org/adasmark/index.php (accessed on 15 March 2023).
- Mattson, P.; Reddi, V.J.; Cheng, C.; Coleman, C.; Diamos, G.; Kanter, D.; Micikevicius, P.; Patterson, D.; Schmuelling, G.; Tang, H.; et al. MLPerf: An Industry Standard Benchmark Suite for Machine Learning Performance. IEEE Micro 2020, 40, 8–16. [Google Scholar] [CrossRef]
- Jalle, J.; Hjorth, M.; Andersson, J.; Weigand, R.; Fossati, L. DSP Benchmark Results of the GR740 Rad-Hard Quad-Core Leon4ft; European Space Agency: Paris, France, 2016. [Google Scholar]
- Gaisler, C. GR740-VALT-0010, GR740 Technical Note on Benchmarking and Validation; Gaisler: Göteborg, Sweden, 2019. [Google Scholar]
- Lovelly, T.M.; Wise, T.W.; Holtzman, S.H.; George, A.D. Benchmarking Analysis of Space-Grade Central Processing Units and Field-Programmable Gate Arrays. J. Aerosp. Inf. Syst. 2018, 15, 518–529. [Google Scholar] [CrossRef]
- Kosmidis, L.; Lachaize, J.; Abella, J.; Notebaert, O.; Cazorla, F.J.; Steenari, D. GPU4S: Embedded GPUs in Space. In Proceedings of the 2019 22nd Euromicro Conference on Digital System Design (DSD), Kallithea, Greece, 28–30 August 2019; pp. 399–405. [Google Scholar] [CrossRef]
- Steenari, D.; Kosmidis, L.; Rodriquez-Ferrandez, I.; Jover-Alvarez, A.; Forster, K. OBPMark (On-Board Processing Benchmarks)—Open Source Computational Performance Benchmarks for Space Applications. In Proceedings of the European Workshop on On-Board Data Processing (OBDP), Online, 14–17 June 2021; pp. 14–17. [Google Scholar]
- Wang, L.; Ma, Y.; Yan, J.; Chang, V.; Zomaya, A.Y. pipsCloud: High performance cloud computing for remote sensing big data management and processing. Future Gener. Comput. Syst. 2018, 78, 353–368. [Google Scholar] [CrossRef]
- Lentaris, G.; Maragos, K.; Stratakos, I.; Papadopoulos, L.; Papanikolaou, O.; Soudris, D.; Lourakis, M.; Zabulis, X.; Gonzalez-Arjona, D.; Furano, G. High-Performance Embedded Computing in Space: Evaluation of Platforms for Vision-Based Navigation. J. Aerosp. Inf. Syst. 2018, 15, 178–192. [Google Scholar] [CrossRef]
- Strohmeier, M.; Schfer, M.; Lenders, V.; Martinovic, I. Realities and Challenges of Nextgen Air Traffic Management: The Case of ADS-B. IEEE Commun. Mag. 2014, 52, 111–118. [Google Scholar] [CrossRef]
- Krizhevsky, A.; Sutskever, I.; Hinton, G.E. ImageNet classification with deep convolutional neural networks. Commun. ACM 2012, 60, 84–90. [Google Scholar] [CrossRef]
- Lovelly, T.M. Comparative Analysis of Space-Grade Processors. Ph.D. Thesis, University of Florida, Gainesville, FL, USA, 2017. [Google Scholar]
- Dong, Z. Research on High-Resolution Remote Sensing Image Object Detection Method based on Convolutional Neural Network. Ph.D. Thesis, Wuhan University, Wuhan, China, 2020. [Google Scholar] [CrossRef]
- CIFAR10. Available online: https://www.cs.toronto.edu/~kriz/cifar.html (accessed on 11 July 2023).
- Available online: https://www.nvidia.cn/autonomous-machines/embedded-systems/jetson-agx-xavier/ (accessed on 20 June 2023).
- NVIDIAGPUDirect[EB/OL]. 21 September 2019. Available online: http://developer.nvidia.com/gpudirect (accessed on 17 May 2023).


| Parameter | Jetson AGX Xavier | ASUS FL8000 | Loongson Platform |
|---|---|---|---|
| CPU | Nvidia Carmel 8-core 2.3 GHz | i7-8550U 4-core 1.8 GHz | 3A4000 4-core 1.8 GHz |
| Three-level cache | 4 MB | 8 MB | 8 MB |
| GPU | Volta GV10B 1.4 GHz | Maxwell 940MX 1.2 GHz | Veiglo BI-V100 1.5 GHz |
| CUDA cores | 512 CUDA cores | 384 CUDA cores | 3072 CUDA cores |
| Tensor cores | Support | Not Support | Not Support |
| GPU memory | 32 GB DDR4 Sharing | 2 GB GDDR5 Independent | 32 GB HBM2 Independent |
| Power | 30 W/15 W/10 W | 15–200 W | 220 W |
| CUDA version | CUDA11.4 | CUDA11.4 | CUDA10.2 |
| Calculate Platform | Multi-Core | Single-Core | Scaling |
|---|---|---|---|
| Jetson AGX Xavier | 14,360.88 | 3734.97 | 3.84 |
| ASUS FL8000 | 22,599.79 | 6525.45 | 3.46 |
| Loongson platform | 7040.61 | 1927 | 3.65 |
| Benchmark Name | Jetson AGX Xavier | ASUS FL8000 | Loongson Platform | |||
|---|---|---|---|---|---|---|
| GPU (Cuda) | GPU (Cuda_Opt) | GPU (Cuda) | GPU (Cuda_Opt) | GPU (Cuda) | GPU (Cuda_Opt) | |
| fast_fourier_ transform | 4.705 | 0.400 | 2.984 | 0.294 | 30.962 | 3.601 |
| finite_impulse_ response_filter | 1.043 | 0.523 | 0.214 | 0.788 | 4.582 | 2.454 |
| LRN_bench | 5.361 | 4.269 | 7.149 | 8.907 | 14.206 | 10.532 |
| matrix_multiplica- tion_bench | 138.326 | 47.547 | 336.830 | 127.513 | 51.823 | 56.630 |
| convolution_2D | 5.606 | 5.119 | 10.203 | 8.450 | 17.766 | 11.121 |
| correlation_2D | 8.141 | 5.234 | 18.737 | 19.482 | 93.056 | 14.723 |
| max_pooling | 2.509 | 2.152 | 4.717 | 4.200 | 8.537 | 8.724 |
| cifar_10 | 0.457 | 0.431 | 0.772 | 0.651 | 16.956 | 16.876 |
| cifar_10_muiple | 73.995 | 72.100 | 283.187 | 197.027 | 790.402 | 787.754 |
| relu_bench | 4.704 | 4.302 | 7.280 | 6.424 | 14.973 | 12.910 |
| softmax_bench | 6.827 | 4.305 | 10.679 | 7.025 | 44.284 | 12.680 |
| wavelet_transform | 0.221 | 0.287 | 0.293 | 0.431 | 5.713 | 1.672 |
| Benchmark Name | Jetson AGX Xavier | ASUS FL8000 | Loongson Platform | |||
|---|---|---|---|---|---|---|
| CPU (Omp) | CPU (Omp_Opt) | CPU (Omp) | CPU (Omp_opt) | CPU (Omp) | CPU (Omp_Opt) | |
| fast_fourier_ transform | 0.247 | 0.813 | 0.056 | 0.357 | 0.210 | 1.847 |
| finite_impulse_ response_filter | 1.295 | 0.675 | 0.860 | 0.595 | 2.936 | 1.714 |
| LRN_bench | 22.352 | 17.231 | 16.544 | 12.149 | 86.929 | 77.217 |
| matrix_multiplica- tion_bench | 1824.736 | 212.291 | 1592.956 | 236.281 | 2020.820 | 928.384 |
| convolution_2D | 15.341 | 9.861 | 27.403 | 15.344 | 160.522 | 114.807 |
| correlation_2D | 5.103 | 4.332 | 8.894 | 6.218 | 85.302 | 58.161 |
| max_pooling | 1.671 | 1.542 | 3.910 | 1.873 | 18.803 | 9.848 |
| cifar_10 | 1.330 | 1.013 | 0.996 | 0.617 | 7.686 | 2.702 |
| cifar_10_muiple | 488.251 | 299.511 | 92.495 | 79.795 | 481.898 | 468.590 |
| relu_bench | 3.076 | 2.824 | 4.104 | 2.895 | 14.400 | 8.733 |
| softmax_bench | 5.662 | 4.890 | 12.829 | 7.033 | 54.569 | 53.433 |
| wavelet_transform | 1.255 | 0.689 | 0.891 | 0.353 | 6.032 | 1.680 |
| Image Size | Throughput | |||||
|---|---|---|---|---|---|---|
| Jetson AGX Xavier | ASUS FL8000 | Loongson Platform | ||||
| CPU (Omp) | GPU (Cuda) | CPU (Omp) | GPU (Cuda) | CPU (Omp) | GPU (Cuda) | |
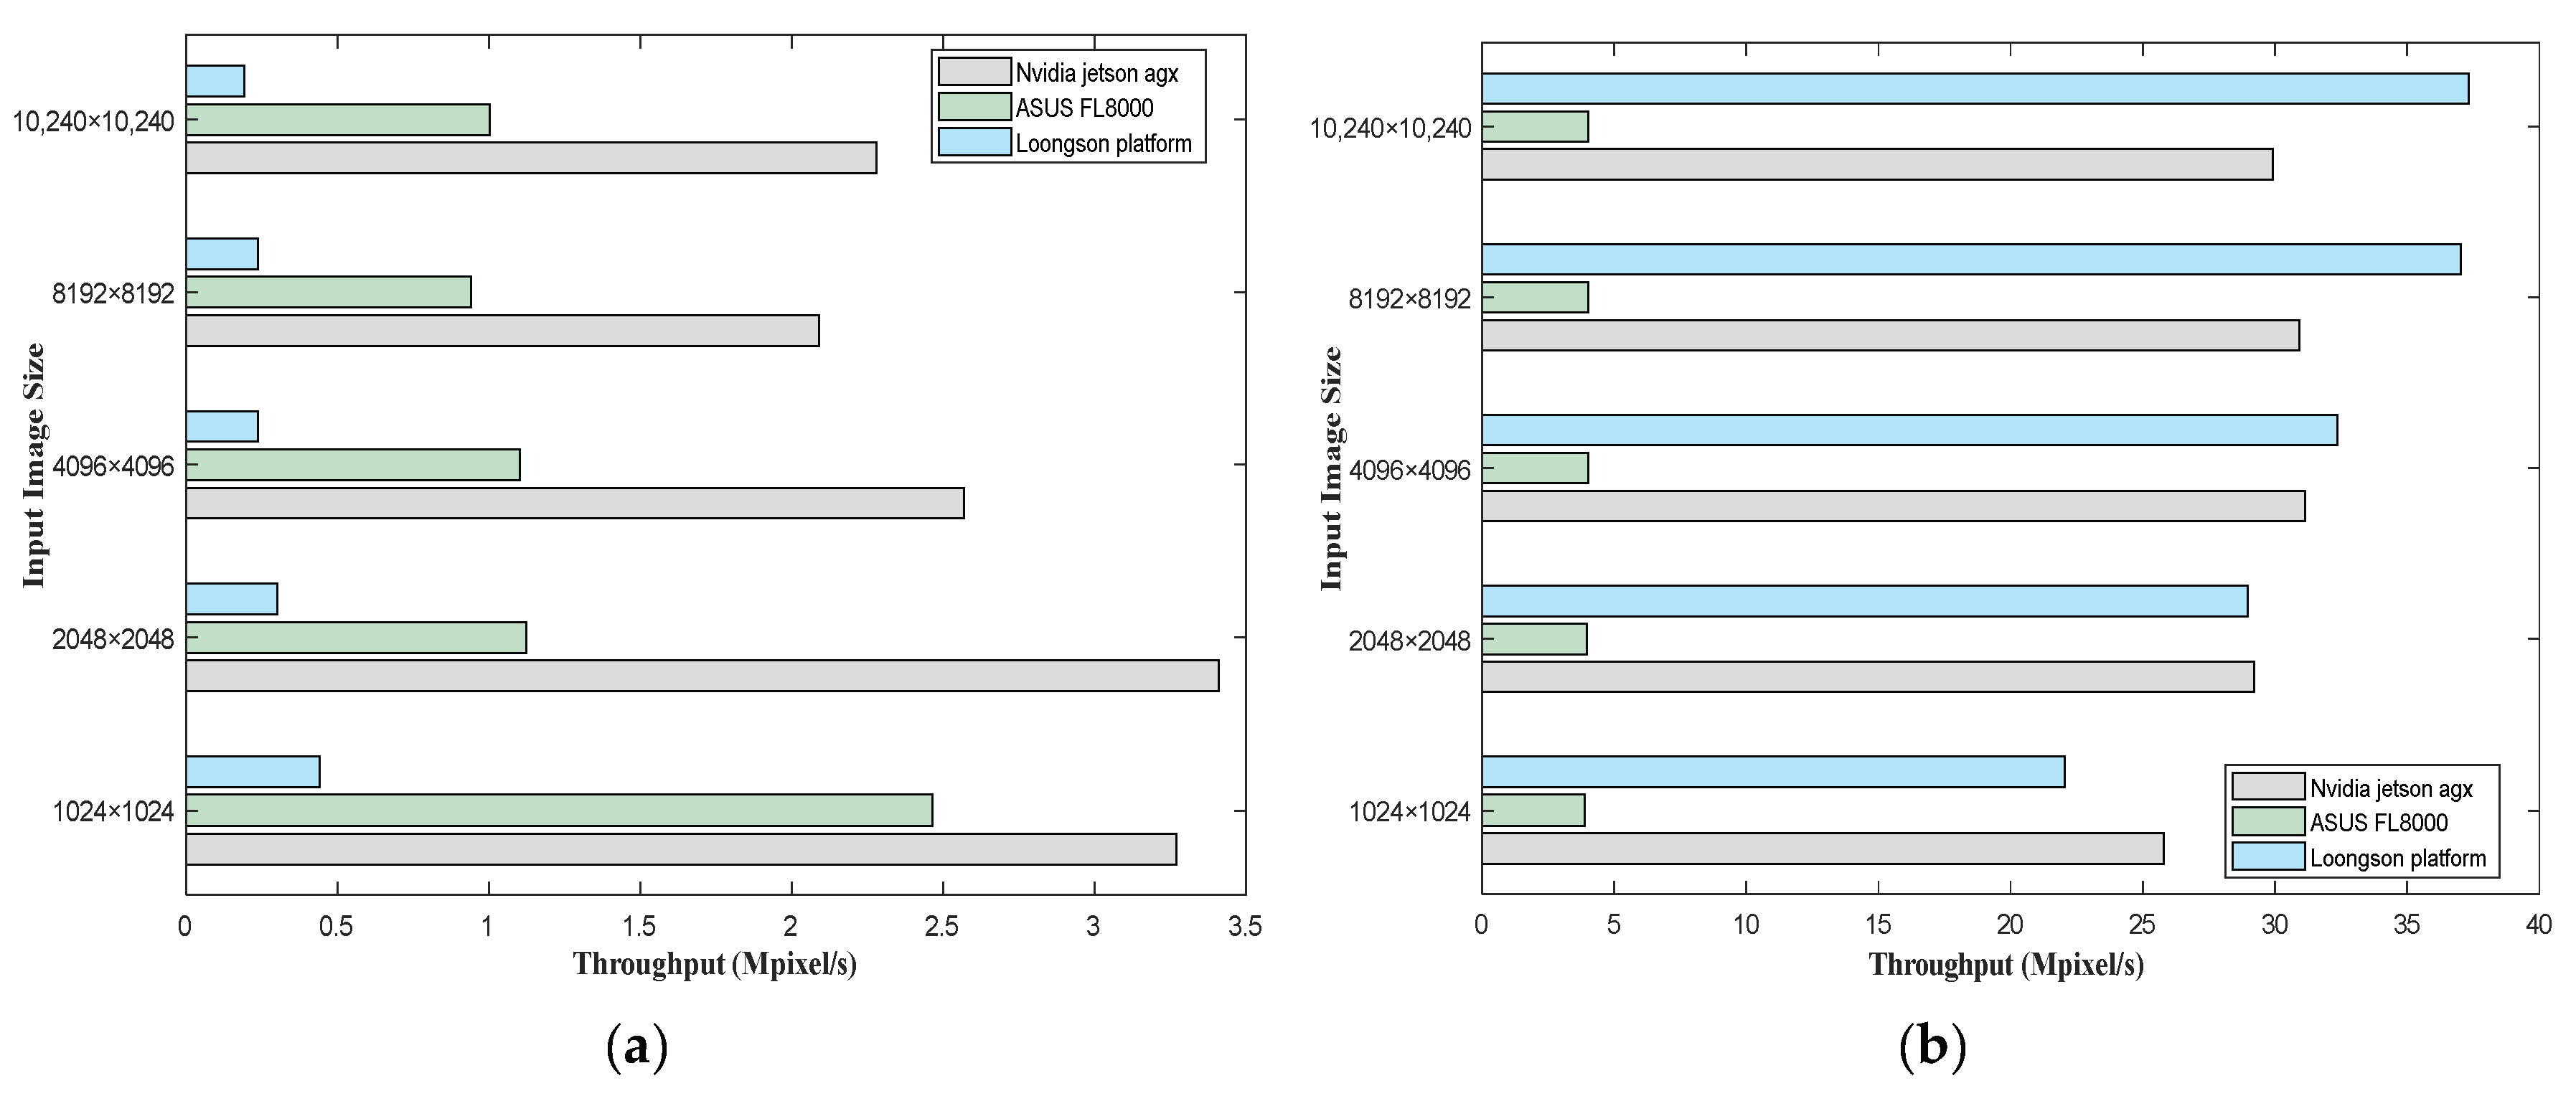
| 1024 × 1024 | 3.27 | 25.78 | 2.46 | 3.88 | 0.44 | 22.05 |
| 2048 × 2048 | 3.41 | 29.20 | 1.12 | 3.96 | 0.30 | 28.97 |
| 4096 × 4096 | 2.57 | 31.15 | 1.10 | 4.01 | 0.24 | 32.36 |
| 8192 × 8192 | 2.09 | 30.93 | 0.94 | 4.02 | 0.24 | 37.02 |
| 10,240 × 10,240 | 2.28 | 29.91 | 1.00 | 4.01 | 0.19 | 37.34 |
| Image Size | Power Consumption | |||||
|---|---|---|---|---|---|---|
| Jetson AGX Xavier | ASUS FL8000 | Loongson Platform | ||||
| CPU (Omp) | GPU (Cuda) | CPU (Omp) | GPU (Cuda) | CPU (Omp) | GPU (Cuda) | |
| 1024 × 1024 | 10.85 | 8.7 | 11.2 | 21.5 | 82.3 | 80.9 |
| 2048 × 2048 | 17.1 | 9.9 | 20.6 | 26.8 | 84.6 | 83.55 |
| 4096 × 4096 | 20.5 | 14.7 | 25.9 | 29.3 | 85.3 | 90.5 |
| 8192 × 8192 | 21 | 20.1 | 27.2 | 32.6 | 86.6 | 93.6 |
| 10,240 × 10,240 | 22.6 | 21.6 | 29.3 | 37.9 | 89.1 | 100.9 |
| Data Length (Bytes) | Throughput | |||||
|---|---|---|---|---|---|---|
| Jetson AGX Xavier | ASUS FL8000 | Loongson Platform | ||||
| CPU (Omp) | GPU (Cuda) | CPU (Omp) | GPU (Cuda) | CPU (Omp) | GPU (Cuda) | |
| 1,048,576 | 82.44 | 101.42 | 36.09 | 23.40 | 4.51 | 190.23 |
| 4,194,304 | 77.43 | 111.37 | 30.36 | 20.76 | 3.91 | 265.05 |
| 16,777,216 | 77.21 | 114.32 | 26.50 | 18.79 | 3.30 | 337.07 |
| 67,108,864 | 76.74 | 117.38 | 25.16 | 3.32 | 407.02 | |
| 104,857,600 | 76.55 | 117.34 | 24.28 | 3.30 | 397.66 | |
| Data Length (Bytes) | Power Consumption | |||||
|---|---|---|---|---|---|---|
| Jetson AGX Xavier | ASUS FL8000 | Loongson Platform | ||||
| CPU (Omp) | GPU (Cuda) | CPU (Omp) | GPU (Cuda) | CPU (Omp) | GPU (Cuda) | |
| 1,048,576 | 5.15 | 5.2 | 9.8 | 16.9 | 77.6 | 79.5 |
| 4,194,304 | 6.65 | 6.8 | 28.7 | 20.7 | 82.9 | 81.2 |
| 16,777,216 | 8.8 | 9 | 31.2 | 27.2 | 84.3 | 84.6 |
| 67,108,864 | 14.5 | 14.9 | 36.8 | 84 | 99.1 | |
| 104,857,600 | 15.6 | 17.94 | 39.9 | 84.7 | 106.8 | |
Disclaimer/Publisher’s Note: The statements, opinions and data contained in all publications are solely those of the individual author(s) and contributor(s) and not of MDPI and/or the editor(s). MDPI and/or the editor(s) disclaim responsibility for any injury to people or property resulting from any ideas, methods, instructions or products referred to in the content. |
© 2023 by the authors. Licensee MDPI, Basel, Switzerland. This article is an open access article distributed under the terms and conditions of the Creative Commons Attribution (CC BY) license (https://creativecommons.org/licenses/by/4.0/).
Share and Cite
Xie, M.; Wang, L.; Ma, M.; Zhang, P. Performance Evaluation Method for Intelligent Computing Components for Space Applications. Sensors 2024, 24, 145. https://doi.org/10.3390/s24010145
Xie M, Wang L, Ma M, Zhang P. Performance Evaluation Method for Intelligent Computing Components for Space Applications. Sensors. 2024; 24(1):145. https://doi.org/10.3390/s24010145
Chicago/Turabian StyleXie, Man, Lianguo Wang, Miao Ma, and Pengfei Zhang. 2024. "Performance Evaluation Method for Intelligent Computing Components for Space Applications" Sensors 24, no. 1: 145. https://doi.org/10.3390/s24010145