
Accurate Cutting-Force Measurement with Smart Tool Holder in Lathe
 , ,
, ,
Abstract
:1. Introduction Precision
2. System Design
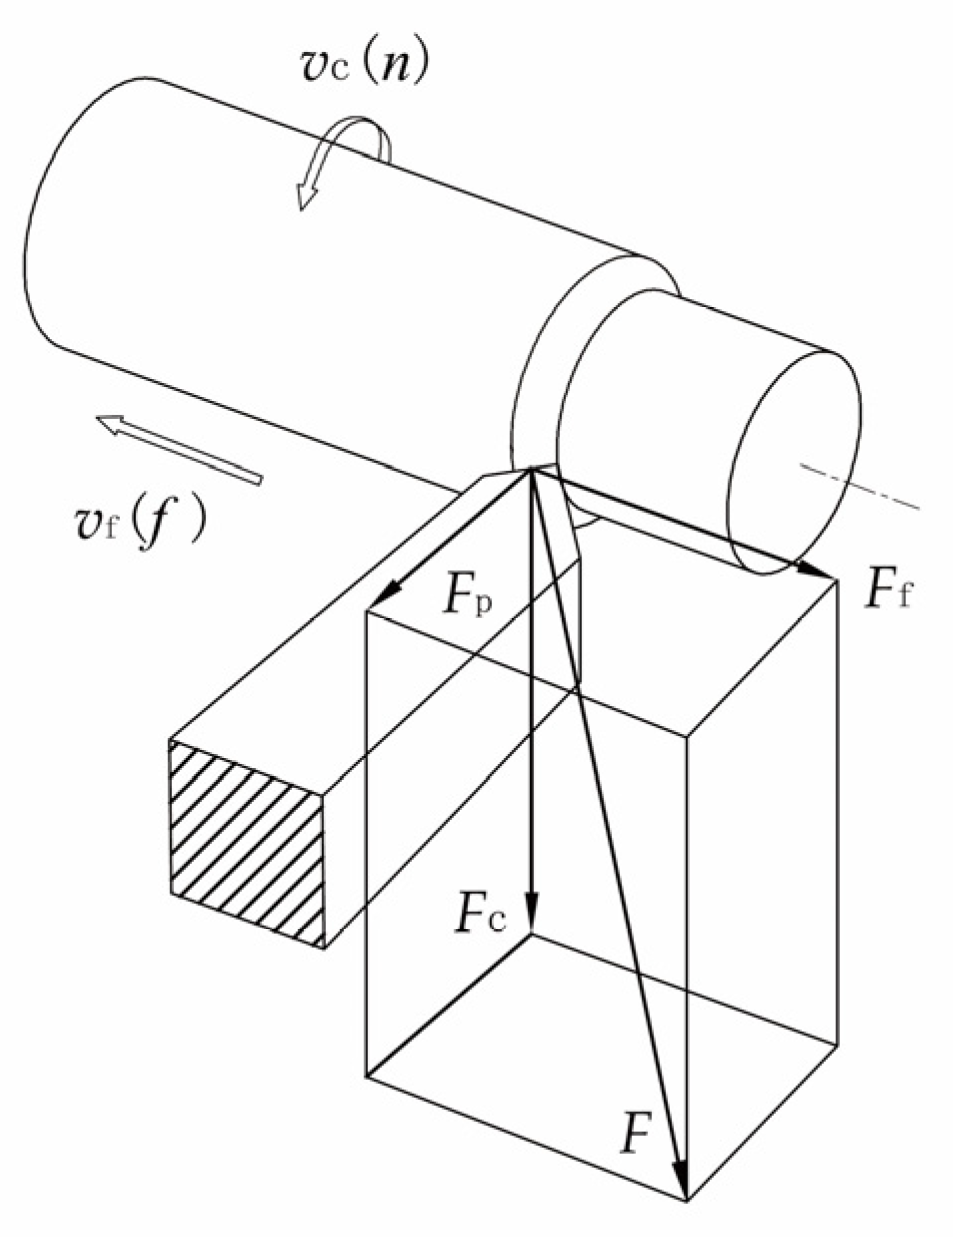
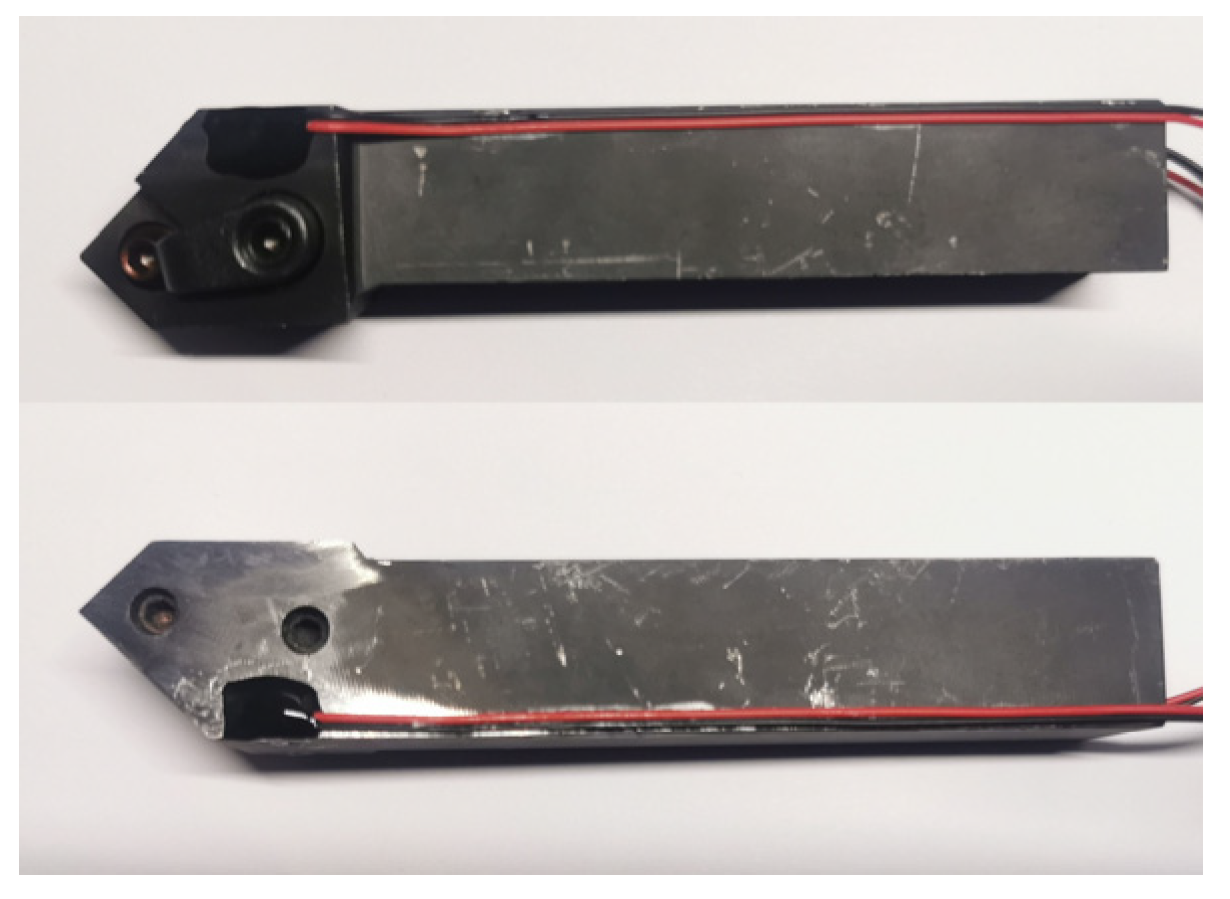
2.1. Device Design
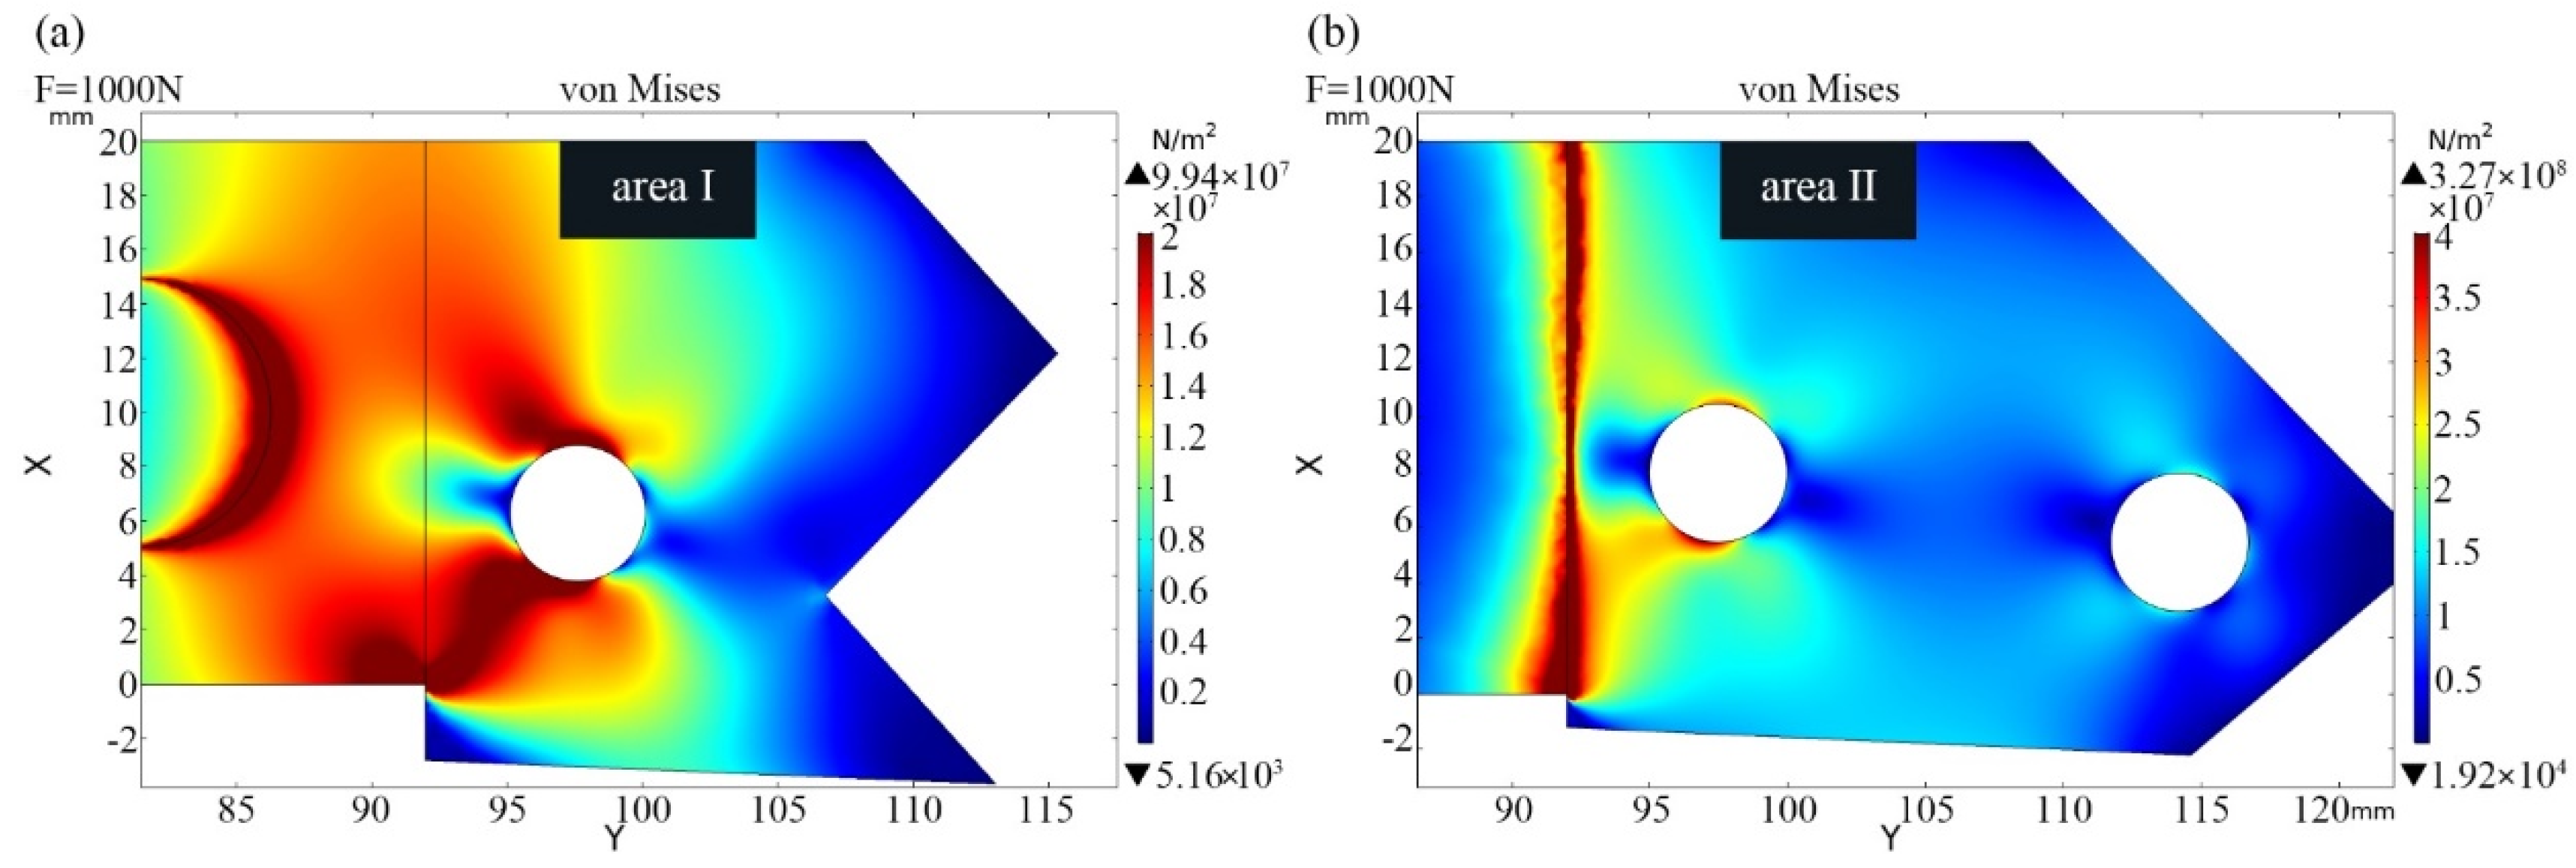
2.2. Finite Element Simulation and Force-Sensing Area Design
2.3. Strain Gauge and Measurement Circuit
2.4. Error Analysis and Compensation of Sensing System
- When the temperature coefficient resistance on a strain gauge is large, the nominal resistance value change caused by the temperature change will be obvious.
- When the linear expansion coefficient of the strain gauge and the tool holder material are different, the additional deformation caused by the change of temperature causes the strain gauge to generate additional resistance.
- —The temperature coefficient of the strain gauge;
- —The strain sensitivity coefficient of the strain gauge;
- —The linear expansion coefficient of the tool holder material;
- —The linear expansion coefficient of the sensitive material on the strain gauge;
- —The amount of change in ambient temperature.
2.4.1. Thermal Zero-Drift Compensation
2.4.2. BP Neural Network Compensation
3. Experimental Works
3.1. Dynamic Calibration Test
3.2. The Static and Dynamic Characteristics
3.2.1. The Static Characteristics
3.2.2. The Dynamic Characteristics
3.3. BP Neural Network Prediction Results
3.4. Performance Results in Cutting Test
4. Conclusions
- The position of the force-sensing area was arranged reasonably by FEA simulation and analysis of the static stress and strain distribution on the surface of the turning tool holder. The semiconductor strain gauges and NTC thermistors were attached to the force-sensing area to detect the strain and temperature.
- The static calibration results show that the main cutting-force sensitivity of the smart tool holder is 1.14 × 10⁻² mV/N, the resolution is 2.09 N, and the nonlinear error is 1.34%. The dynamic calibration test of the smart tool holder was carried out. The first-order intrinsic frequency of the smart tool holder mounted on the lathe ≥6 kHz, which is not lower than the original tool holder, indicating that the stiffness of the smart tool holder does not decrease.
- The BP neural network was trained to compensate the temperature error based on the software compensation, and the average relative error of the prediction result is 1.48%. Finally, the cutting tests show a reliable cutting quality of the smart tool holder while successfully monitoring the main cutting-force signal in the turning process.
Author Contributions
Funding
Institutional Review Board Statement
Informed Consent Statement
Data Availability Statement
Conflicts of Interest
References
- Khorasani, M.; Gibson, I.; Ghasemi, A.H.; Hadavi, E.; Rolfe, B. Laser subtractive and laser powder bed fusion of metals: Review of process and production features. Rapid Prototyp. J. 2023, 29, 935–958. [Google Scholar] [CrossRef]
- Rizzo, A.; Goel, S.; Grilli, M.L.; Iglesias, R.; Jaworska, L.; Lapkovskis, V.; Novak, P.; Postolnyi, B.O.; Valerini, D. The Critical Raw Materials in Cutting Tools for Machining Applications: A Review. Materials 2020, 13, 1377. [Google Scholar] [CrossRef]
- Min, B.K.; O’Neal, G.; Koren, Y.; Pasek, Z. Cutting process diagnostics utilising a smart cutting tool. Mech. Syst. Signal Process. 2002, 16, 475–486. [Google Scholar] [CrossRef]
- Ahmad, M.I.; Yusof, Y.; Daud, M.E.; Latiff, K.; Kadir, A.Z.A.; Saif, Y. Machine monitoring system: A decade in review. Int. J. Adv. Manuf. Technol. 2020, 108, 3645–3659. [Google Scholar] [CrossRef]
- Hopkins, C.; Hosseini, A. A Review of Developments in the Fields of the Design of Smart Cutting Tools, Wear Monitoring, and Sensor Innovation. IFAC-PapersOnLine 2019, 52, 352–357. [Google Scholar] [CrossRef]
- Cao, H.; Zhang, X.W.; Chen, X.F. The concept and progress of intelligent spindles: A review. Int. J. Mach. Tools Manuf. 2016, 112, 21–52. [Google Scholar] [CrossRef]
- Wang, C.; Cheng, K.; Minton, T.; Rakowski, R. Development of a novel surface acoustic wave (SAW) based smart cutting tool in machining hybrid dissimilar material. Manuf. Lett. 2014, 2, 21–25. [Google Scholar] [CrossRef]
- Liu, M.; Bing, J.; Xiao, L.; Yun, K.; Wan, L. Development and Testing of an Integrated Rotating Dynamometer Based on Fiber Bragg Grating for Four-Component Cutting Force Measurement. Sensors 2018, 18, 1254. [Google Scholar] [CrossRef]
- Qin, Y.; Wang, D.; Yang, Y. Integrated cutting force measurement system based on MEMS sensor for monitoring milling process. Microsyst Technol 2020, 26, 2095–2104. [Google Scholar] [CrossRef]
- Ming, L.; Chong, Z.; Liu, D. Cutting Forces Measurement for Milling Process by Using Working Tables with Integrated PVDF Thin-Film Sensors. Sensors 2018, 18, 4031. [Google Scholar] [CrossRef]
- Xiao, C.; Ding, H.; Cheng, K.; Chen, S. Design of an innovative smart turning tool with application to real-time cutting force measurement. Proc. Inst. Mech. Eng. Part B J. Eng. Manuf. 2015, 229, 563–568. [Google Scholar] [CrossRef]
- Chena, Y.L.; Chen, F.; Li, Z.; Zhang, Y.; Ju, B.; Lin, H. Three-axial cutting force measurement in micro/nano-cutting by utilizing a fast tool servo with a smart tool holder. CIRP Ann. Manuf. Technol. 2021, 70, 33–36. [Google Scholar] [CrossRef]
- Wang, C.; Rakowski, R.; Cheng, K. Design and analysis of a piezoelectric film embedded smart cutting tool. Proc. Inst. Mech. Eng. Part B J. Eng. Manuf. 2013, 227, 254–260. [Google Scholar] [CrossRef]
- Welf-Guntram, D.; Gebhardt, S.; Bucht, A.; Kranz, B.; Schneider, J.; Ettrichrätz, M. Performance of a new piezoceramic thick film sensor for measurement and control of cutting forces during milling. Cirp Annals 2018, 67, 45–48. [Google Scholar] [CrossRef]
- Luo, M.; Luo, H.; Axinteb, D.; Liu, D.; Mei, J.; Liao, Z. A wireless instrumented milling cutter system with embedded PVDF sensors. Mech. Syst. Signal Process. 2018, 110, 556–568. [Google Scholar] [CrossRef]
- Cheng, K.; Niu, Z.C.; Wang, R.C.; Rakowski, R.; Bateman, R. Smart Cutting Tools and Smart Machining: Development Approaches, and Their Implementation and Application Perspectives. Chin. J. Mech. Eng. 2017, 30, 1162–1176. [Google Scholar] [CrossRef]
- Wang, C.; Cheng, K.; Chen, X.; Minton, T.; Rakowski, R. Design of an instrumented smart cutting tool and its implementation and application perspectives. Smart Mater. Struct. 2014, 23, 035019. Available online: http://iopscience.iop.org/0964-1726/23/3/035019 (accessed on 1 January 2023.). [CrossRef]
- Xie, Z.; Lu, Y.; Li, J. Development and testing of an integrated smart tool holder for four-component cutting force measurement. Mech. Syst. Signal Process. 2017, 93, 225–240. [Google Scholar] [CrossRef]
- Huang, J.; Pham, D.T.; Ji, C.; Zhou, Z. Smart cutting tool integrated with optical fiber sensors for cutting force measurement in turning. IEEE Trans. Instrum. Meas. 2019, 69, 1720–1727. [Google Scholar] [CrossRef]
- Zhao, Y.; Zhao, Y.L.; Shao, Y.W.; Hu, T.J.; Zhang, Q.; Ge, X.H. Research of a smart cutting tool based on MEMS strain gauge. J. Phys. Conf. Ser. 2018, 986, 012016. [Google Scholar] [CrossRef]
- Jain Rahul, J.; Rathore, K.; Gorana, V.K. Design, Development and Testing of a Three Component Lathe Tool Dynamometer Using Resistance Strain Gauges; Springer India: New Delhi, India, 2016. [Google Scholar] [CrossRef]
- Murthy, K.S.; Rajendran, I. Design and development of strain gauge based milling tool dynamometer. Int. J. Mach. Mach. Mater. 2010, 7, 286–298. [Google Scholar] [CrossRef]
- You, Z.; Zhao, Y.; Liang, S.; Zhou, G. A High Performance Sensor for Triaxial Cutting Force Measurement in Turning. Sensors 2015, 15, 7969. [Google Scholar] [CrossRef]
- Fernández-Lucio, P.; Del Val, A.G. Threading holder based on axial metal cylinder pins to reduce tap risk during reversion instant. Alex. Eng. J. 2023, 66, 845–859. [Google Scholar] [CrossRef]
- de Lacalle, L.N.L.; Lamikiz, A. Recording of real cutting forces along the milling of complex parts. Mechatronics 2006, 16, 21–32. [Google Scholar] [CrossRef]
- Díaz-Tena, E.; Ugalde, U.; López de Lacalle, L.N.; de la Iglesia, A.; Calleja, A.; Campa, F.J. Propagation of assembly errors in multitasking machines by the homogenous matrix method. Int. J. Adv. Manuf. Technol. 2013, 68, 149–164. [Google Scholar] [CrossRef]
- Wang, C.; Ghani, S.B.C.; Cheng, K.; Rakowski, R. Adaptive smart machining based on using constant cutting force and a smart cutting tool. Proc. Inst. Mech. Eng. Part B J. Eng. Manuf. 2012, 227. [Google Scholar] [CrossRef]
- Hannah, R.L.; Reed, S.E. Strain Gage Users’ Handbook, 1st ed.; Springer: Dordrecht, The Netherlands, 1992; pp. 116–131. [Google Scholar]
- Xie, Z.; Lu, Y.; Chen, X. A multi-sensor integrated smart tool holder for cutting process monitoring. Int. J. Adv. Manuf. Technol. 2020, 110, 853–864. [Google Scholar] [CrossRef]
- Totis, G.; Wirtz, G.; Sortino, M.; Veselovac, D.; Kuljanic, E.; Klocke, F. Development of a dynamometer for measuring individual cutting edge forces in face milling. Mech. Syst. Signal Process. 2010, 24, 1844–1857. [Google Scholar] [CrossRef]
- Zhou, C.; Guo, K.; Sun, J. An integrated wireless vibration sensing tool holder for milling tool condition monitoring with singularity analysis. Measurement 2021, 174, 174. [Google Scholar] [CrossRef]
- Ma, L.; Melkote, S.N.; Morehouse, J.B.; Castle, J.B.; Fonda, J.W.; Johnson, M.A. Thin-film PVDF sensor-based monitoring of cutting forces in peripheral end milling. J. Dyn. Syst. Meas. Control 2012, 134, 725–735. [Google Scholar] [CrossRef]
- Uddin, M.S.; Dong, S. On the design and analysis of an octagonal–ellipse ring based cutting force measuring transducer. Measurement 2016, 90, 168–177. [Google Scholar] [CrossRef]


| Parameter | Value |
|---|---|
| Elastic modulus (N/m2) | 2.12 × 10¹¹ |
| Poisson’s ratio (\) | 0.28 |
| Thermal expansion coefficient (1/K) | 1.2 × 10⁵ |
| Model | SYP-120 |
|---|---|
| Nominal resistance value (Ω) | 120 ± 5% |
| Silicon strip size (mm) | 4.7 × 0.22 × 0.02 |
| Nominal sensitivity coefficient | 120 |
| Temperature coefficient of resistance (%/°C) | 0.13 |
| Temperature coefficient of sensitivity (%/°C) | −0.18 |
| Maximum working current (mA) | 50 |
| Operating temperature (°C) | −30~+80 |
| Ultimate strain (με) | 5000 |
| Cutting Depth (mm) | Kistler Dynamometer (N) | Smart Tool Holder (N) |
|---|---|---|
| 0.1 | 32.20 | 33.39 |
| 0.2 | 68.21 | 67.76 |
| 0.3 | 95.58 | 94.38 |
| 0.4 | 115.46 | 116.35 |
| 0.5 | 133.21 | 134.57 |
| Test | Cutting Speed (m/min) | Cutting Depth (mm) | Feed Rate (mm/rev) |
|---|---|---|---|
| 1 | 96 | 0.1 | 0.159 |
| 2 | 96 | 0.2 | 0.159 |
| 3 | 96 | 0.3 | 0.159 |
| 4 | 79 | 0.4 | 0.159 |
| 5 | 61 | 0.5 | 0.159 |
Disclaimer/Publisher’s Note: The statements, opinions and data contained in all publications are solely those of the individual author(s) and contributor(s) and not of MDPI and/or the editor(s). MDPI and/or the editor(s) disclaim responsibility for any injury to people or property resulting from any ideas, methods, instructions or products referred to in the content. |
© 2023 by the authors. Licensee MDPI, Basel, Switzerland. This article is an open access article distributed under the terms and conditions of the Creative Commons Attribution (CC BY) license (https://creativecommons.org/licenses/by/4.0/).
Share and Cite
Song, W.; Zhang, J.; Xiao, G.; Yi, M.; Chen, Z.; Wang, L.; Chen, J.; Xu, C. Accurate Cutting-Force Measurement with Smart Tool Holder in Lathe. Sensors 2023, 23, 4419. https://doi.org/10.3390/s23094419
Song W, Zhang J, Xiao G, Yi M, Chen Z, Wang L, Chen J, Xu C. Accurate Cutting-Force Measurement with Smart Tool Holder in Lathe. Sensors. 2023; 23(9):4419. https://doi.org/10.3390/s23094419
Chicago/Turabian StyleSong, Wandong, Jingjie Zhang, Guangchun Xiao, Mingdong Yi, Zhaoqiang Chen, Li Wang, Jun Chen, and Chonghai Xu. 2023. "Accurate Cutting-Force Measurement with Smart Tool Holder in Lathe" Sensors 23, no. 9: 4419. https://doi.org/10.3390/s23094419