Article

Reflective Fiber Temperature Probe Based on Localized Surface Plasmon Resonance towards Low-Cost and Wireless Interrogation

by
Yang-Duan Su
1,
Carter Neal Leatherman
2,
Yuankang Wang
1 and
Paul Richard Ohodnicki
1,2,*
1
Mechanical Engineering and Materials Science, University of Pittsburgh, Pittsburgh, PA 15260, USA
2
Electrical and Computer Engineering, University of Pittsburgh, Pittsburgh, PA 15260, USA
*
Author to whom correspondence should be addressed.
Sensors 2023, 23(8), 4165; https://doi.org/10.3390/s23084165
Submission received: 12 March 2023 / Revised: 10 April 2023 / Accepted: 16 April 2023 / Published: 21 April 2023

Abstract

:
Reflection fiber temperature sensors functionalized with plasmonic nanocomposite material using intensity-based modulation are demonstrated for the first time. Characteristic temperature optical response of the reflective fiber sensor is experimentally tested using Au-incorporated nanocomposite thin films deposited on the fiber tip, and theoretically validated using a thin-film-optic-based optical waveguide model. By optimizing the Au concentration in a dielectric matrix, Au nanoparticles (NP) exhibit a localized surface plasmon resonance (LSPR) absorption band in a visible wavelength that shows a temperature sensitivity ~0.025%/°C as a result of electron–electron and electron–phonon scattering of Au NP and the surrounding matrix. Detailed optical material properties of the on-fiber sensor film are characterized using scanning electron microscopy (SEM) and focused-ion beam (FIB)-assisted transmission electron microscopy (TEM). Airy’s expression of transmission and reflection using complex optical constants of layered media is used to model the reflective optical waveguide. A low-cost wireless interrogator based on a photodiode transimpedance-amplifier (TIA) circuit with a low-pass filter is designed to integrate with the sensor. The converted analog voltage is wirelessly transmitted via 2.4 GHz Serial Peripheral Interface (SPI) protocols. Feasibility is demonstrated for portable, remotely interrogated next-generation fiber optic temperature sensors with future capability for monitoring additional parameters of interest.

1. Introduction

Embedded temperature sensors that are low-cost and miniaturized to be widely accessible in electrical transmission, energy storage, and power generation facilities have become important to maintain the healthy condition of the device and predict early onset of thermal failures without compromising the general operation and cost of the system. Fiber optic sensors are favored over traditional thermal-resistive-based temperature sensors owing to their compactness by nature and immunity to electromagnetic interference (EMI) in the sensing conditions presented by electric power equipment. In particular, functional thin-film-coated evanescent wave optical fiber sensors receive increasing attention due to their lower fabrication cost compared to fiber Bragg Grating (FBG) or photonic crystal fiber (PCF) temperature sensors, which require expensive femtosecond laser or stacking/drawing equipment to produce the fiber, and their tunability of sensor performance by controlling the doping level and microstructure of the film. Common dielectric materials such as TiO2 were studied as functional thin film sensor elements on optical fibers based on the thermal-optic effect of their refractive indices in response to temperature [1]. In the past decade, the mechanism modulated by wavelength shifts due to the change in refractive indices was further explored with the addition of noble metal film layers or metal NP to various dielectric material hosts to induce surface plasmon resonance (SPR) or LSPR, respectively, creating resonance peaks that can be used as the primary interrogable spectral feature [2,3,4,5,6,7,8,9].
LSPR responses have been demonstrated to be tunable in terms of spectral positions and intensity by modifying precious metal doping levels and heat-treating temperature to control particle size [10,11,12,13], and by changing the refractive index of the dielectric host, such as using oblique deposition methods for the sensing films [14]. LSPR is a particular type of SPR that happens when the propagating distance of surface plasmon polaritons is confined to a scale comparable to the wavelength of incident light [15]. Unlike SPR, it does not require total internal reflectance of propagating light to occur, making LSPR less stringent to be produced and more readily leveraged in engineering of optical materials. Not only were Au-incorporated nanocomposite films systematically characterized to assess the potential sensing performances [16,17], but evanescent wave fiber optic temperature sensors were also demonstrated to adopt Au NP in an oxide matrix as a cladding to detect temperature variations based on shifts in optical transmission spectra [18,19,20,21]. However, most works on plasmonic fiber optic sensors have focusing on using the mechanism of SPR wavelength shifts, which is a result of refractive index change [22,23,24]. Interrogation with wavelength-shifts associated with modifications to a real refractive index may suffer from cross-sensitivity issues due to the fact that it is sensitive to any measurands which impact the real index [25]. In addition, the cost of spectral shift-based interrogators is substantially greater than that of intensity-based interrogation systems due to the need for low linewidth sources and high wavelength resolution detection circuits. In contrast, LSPR intensity modulation has the potential to discriminate multiple parameters with relatively low cost and simple optical interrogation systems, because of the local change in spectral bands or peaks in respond to each measurand. Nevertheless, a potential drawback of intensity-based sensors can be the fact that their accuracy is highly dependent on the stability of the light source, which can be mitigated by multi-wavelength referencing or monitoring the light source intensity.
Prior work successfully demonstrated intensity-based Au/SiO2 LSPR optical fiber temperature sensors in the transmission configuration with an intuitive interpretation of sensor responses based upon the modified film LSPR absorption [26]. However, fiber sensors configured as reflection probes offer distinct advantages in installation during in-operando monitoring of energized electric power facilities such as high-voltage transformers. Naci Inci et al. [27] demonstrated one of the first functional material-based reflection fiber temperature probes with a TiO2 coating of 1 μm on the tip of a single-mode fiber, where the temperature-dependent optical phase change within the TiO2 film is a function of the thermal-optic coefficient and thermal expansion coefficient of the thickness of the film. The results showed decreased reflectance at a single wavelength of 780 nm as the temperature increased. In our work, we demonstrated the first reflection intensity-modulated fiber optic temperature sensor by using a thin film composed of an Au-incorporated nanocomposite, with absorption bands displaying temperature-dependent characteristics of LSPR. The intensity-based temperature dependence is dominated by the resistivity, ρ A u , of Au NP, and is further modified by the optical constant of the matrix phase and thermal expansion. As described in (1), by equating the definition of resistivity of metal to its correlation with drift mobility of free electrons [28], the increased electron–electron and electron–phonon scattering at the surface and bulk film under elevated temperatures increases ρ A u . This results in an increase in electron and phonon collision frequency, ω c , which dampens the intensity of LSPR absorption band and modifies the reflectance of the film. m e * is the effective mass of free electron, e is electronic charge, T is temperature, N is electron density, and C is an independent constant.
ρ A u = m e * T e 2 N C = m e * ω c e 2 N
A less obvious temperature effect is the red shift of the LSPR peak with increasing temperature due to the increase in the refractive index of the matrix phase originating from the change in electronic polarization of the dielectric oxide with temperature. From the fiber optic interrogation perspective, interrogators and light sources dominate system cost and prevent fiber sensor probes being integrated into commercial power equipment [29]. Raghavan et al. [30] designed a wavelength-resolving detector that integrates a position-sensitive photodetector with a dispersive-filter-coated detector to serve as a low-cost FBG interrogator. Our previous works proposed a design of low-cost and wireless interrogation based on a photodiode-TIA circuit that converts optical signals into simple electrical signals [31]. Here, we further incorporate a dual-stage amplifier design with a low-pass filter to account for temperature response time and optical response resolution of the plasmonic sensor. This wireless communicated interrogation is intended for field deployment of intensity-based fiber sensors in medium/high voltage electrical assets, where remote monitoring without electrical wires to access is a personnel and equipment safety requirement. Taken together, to emphasize the practical advantage of reflection-based fiber sensors and wireless interrogation, and the cost-effectiveness of intensity-based sensor/interrogator, this work aims to provide a theoretical guide towards reflection-mode optical waveguide modeling and experimental validation. This is examined in the context of AuNP-incorporated oxide LSPR temperature fiber sensors when combined with a wireless signal demodulation circuit, which is an area that currently lacks discussion in the literature for these sensing materials on an optical fiber platform.

2. Materials and Experimental Procedures

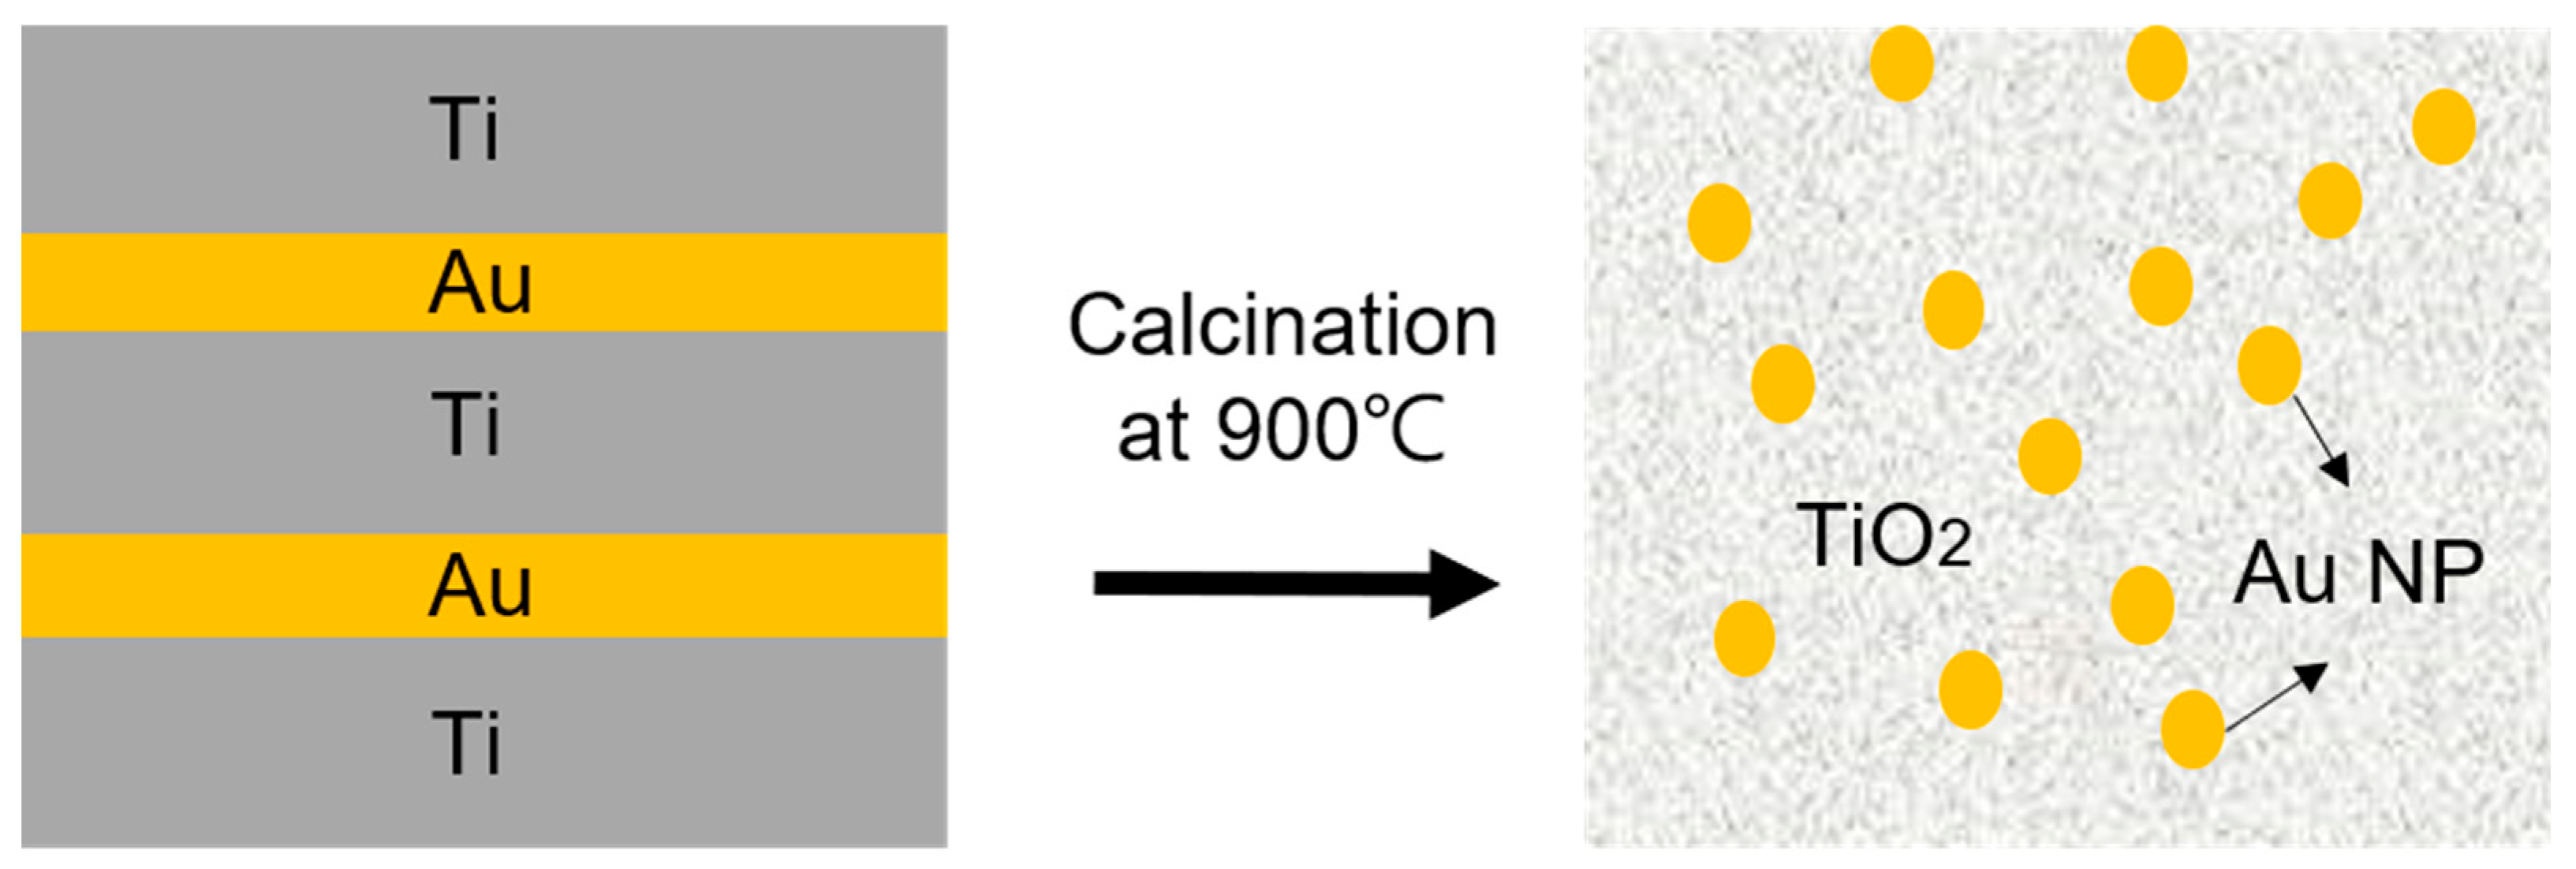
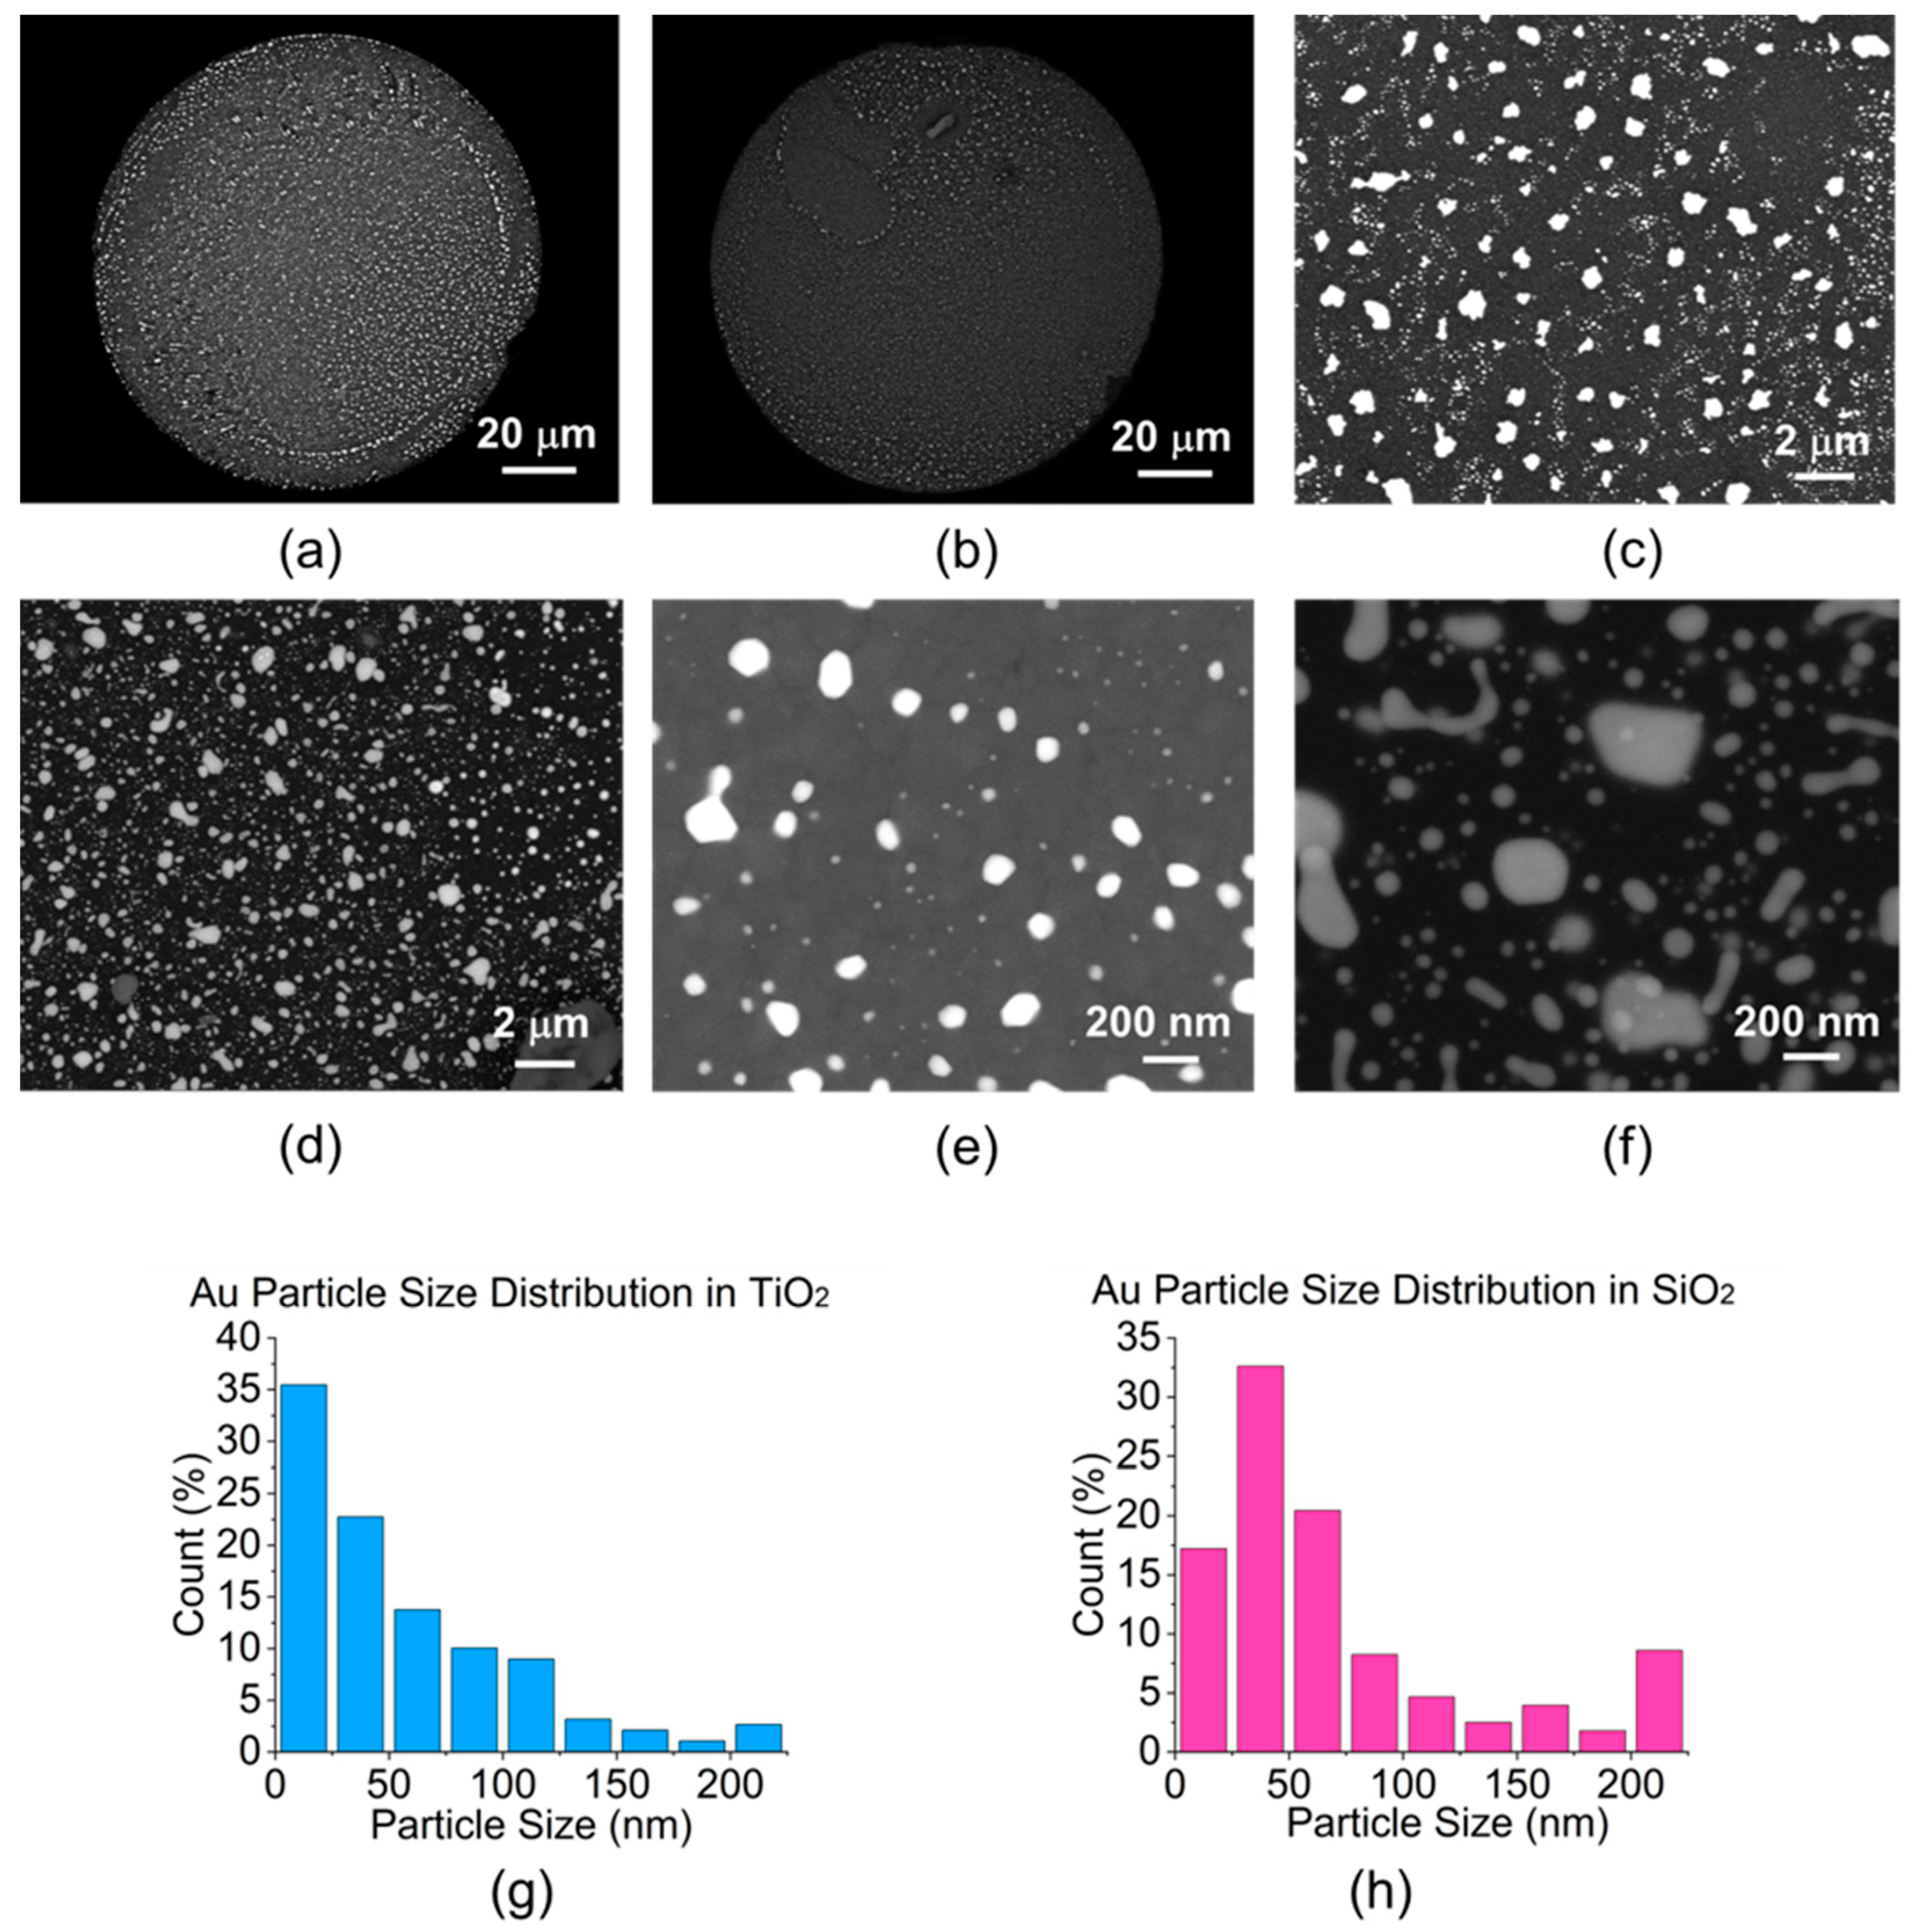
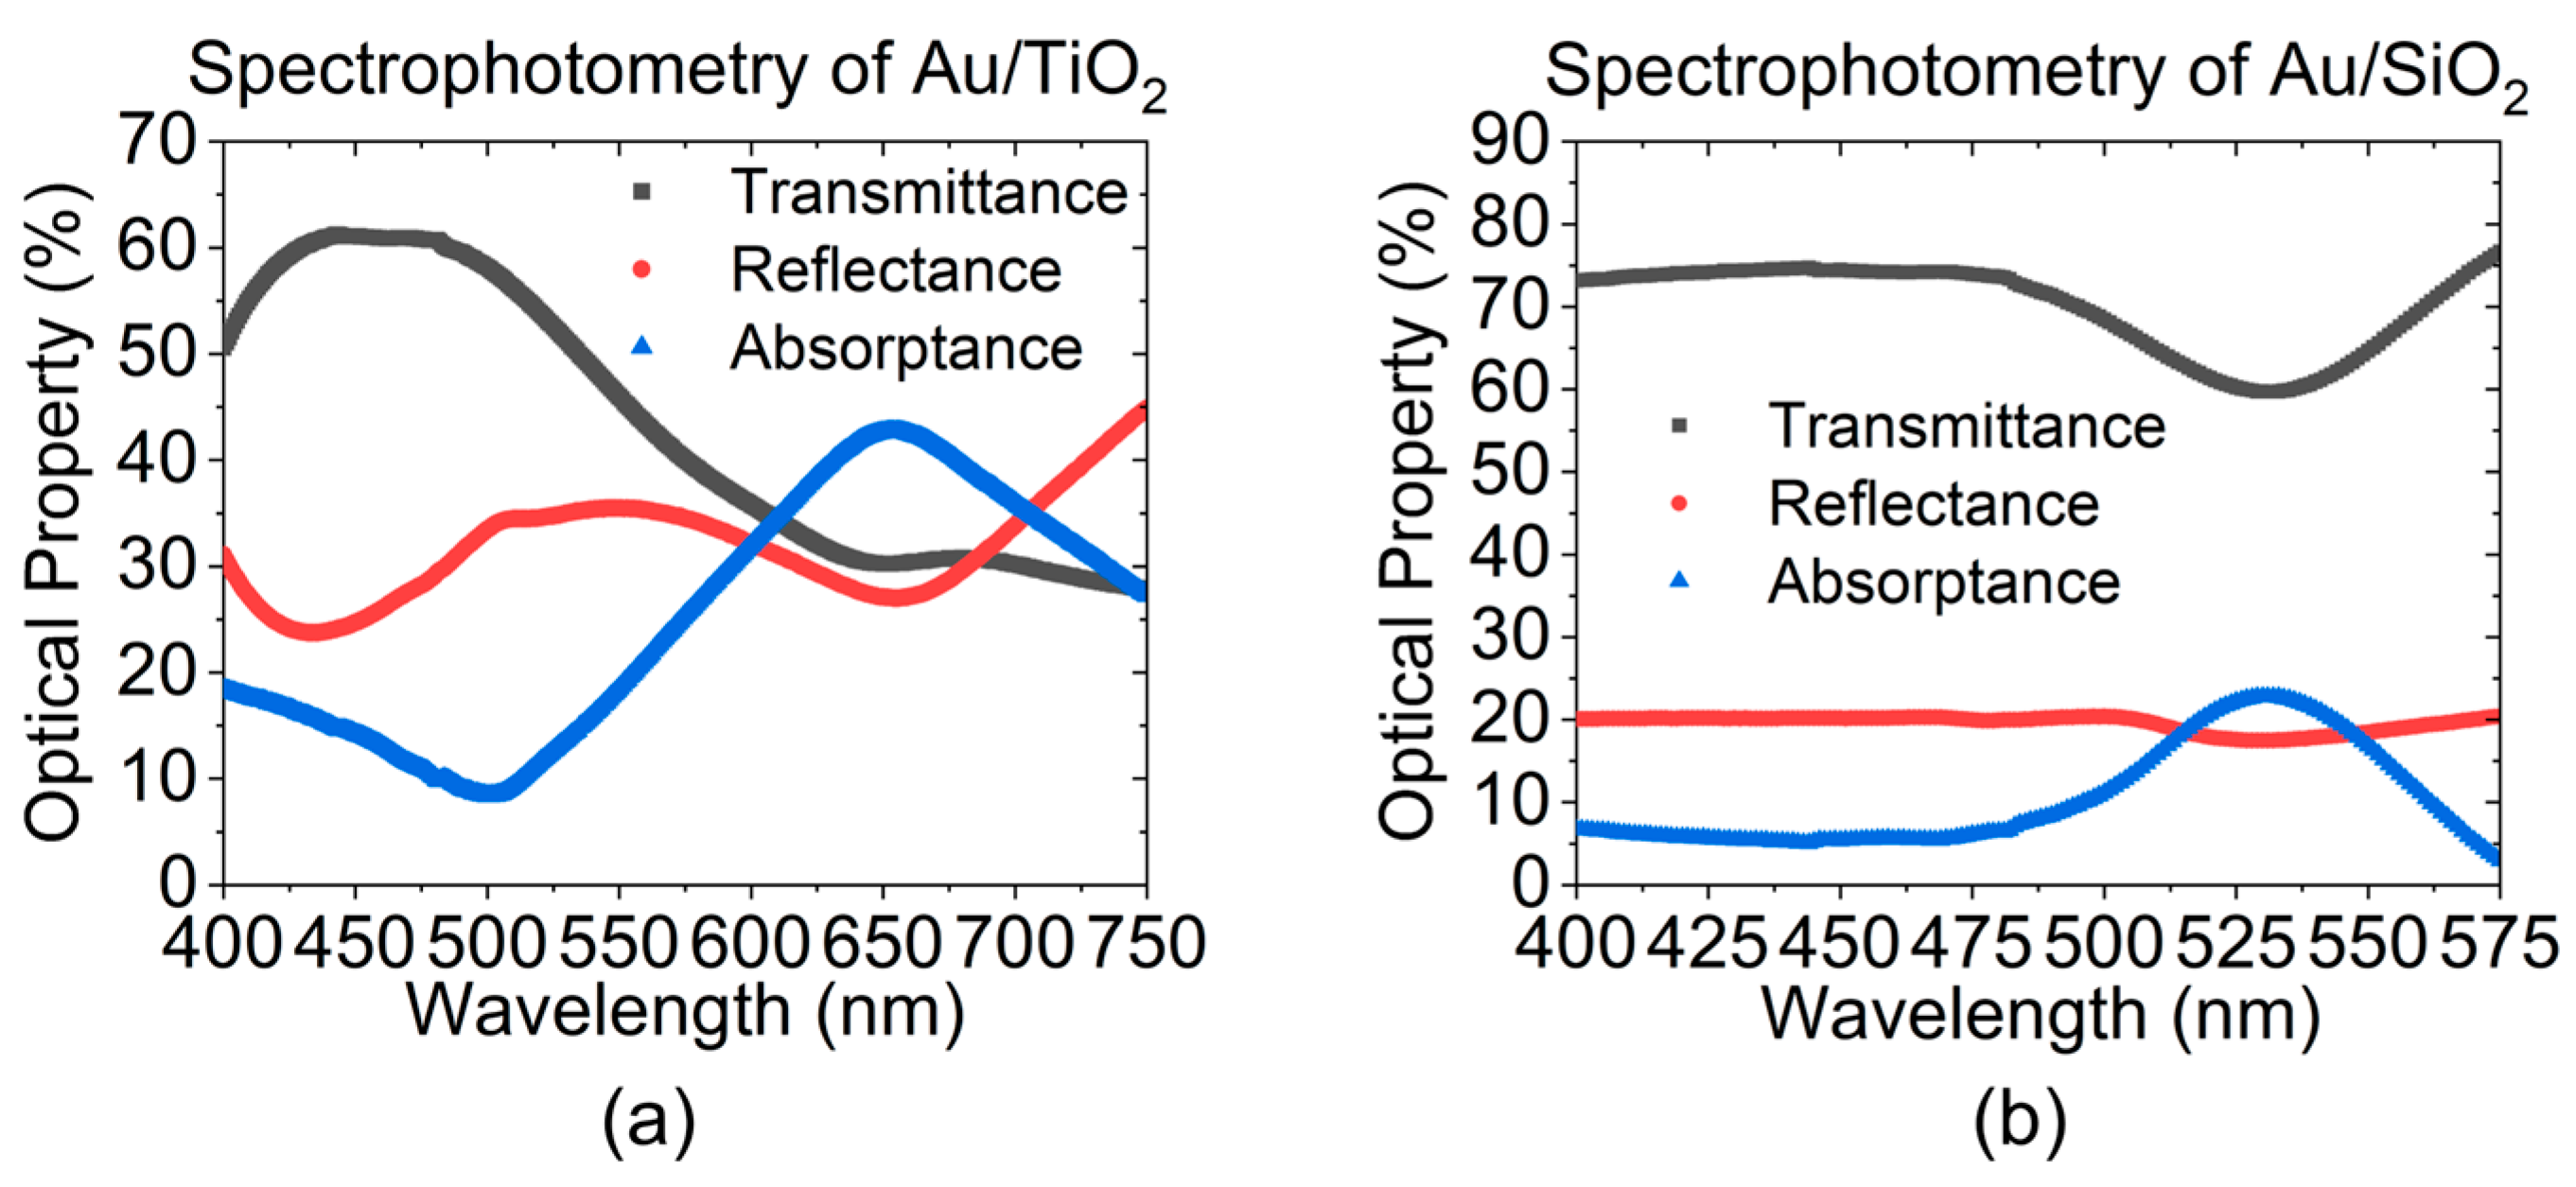
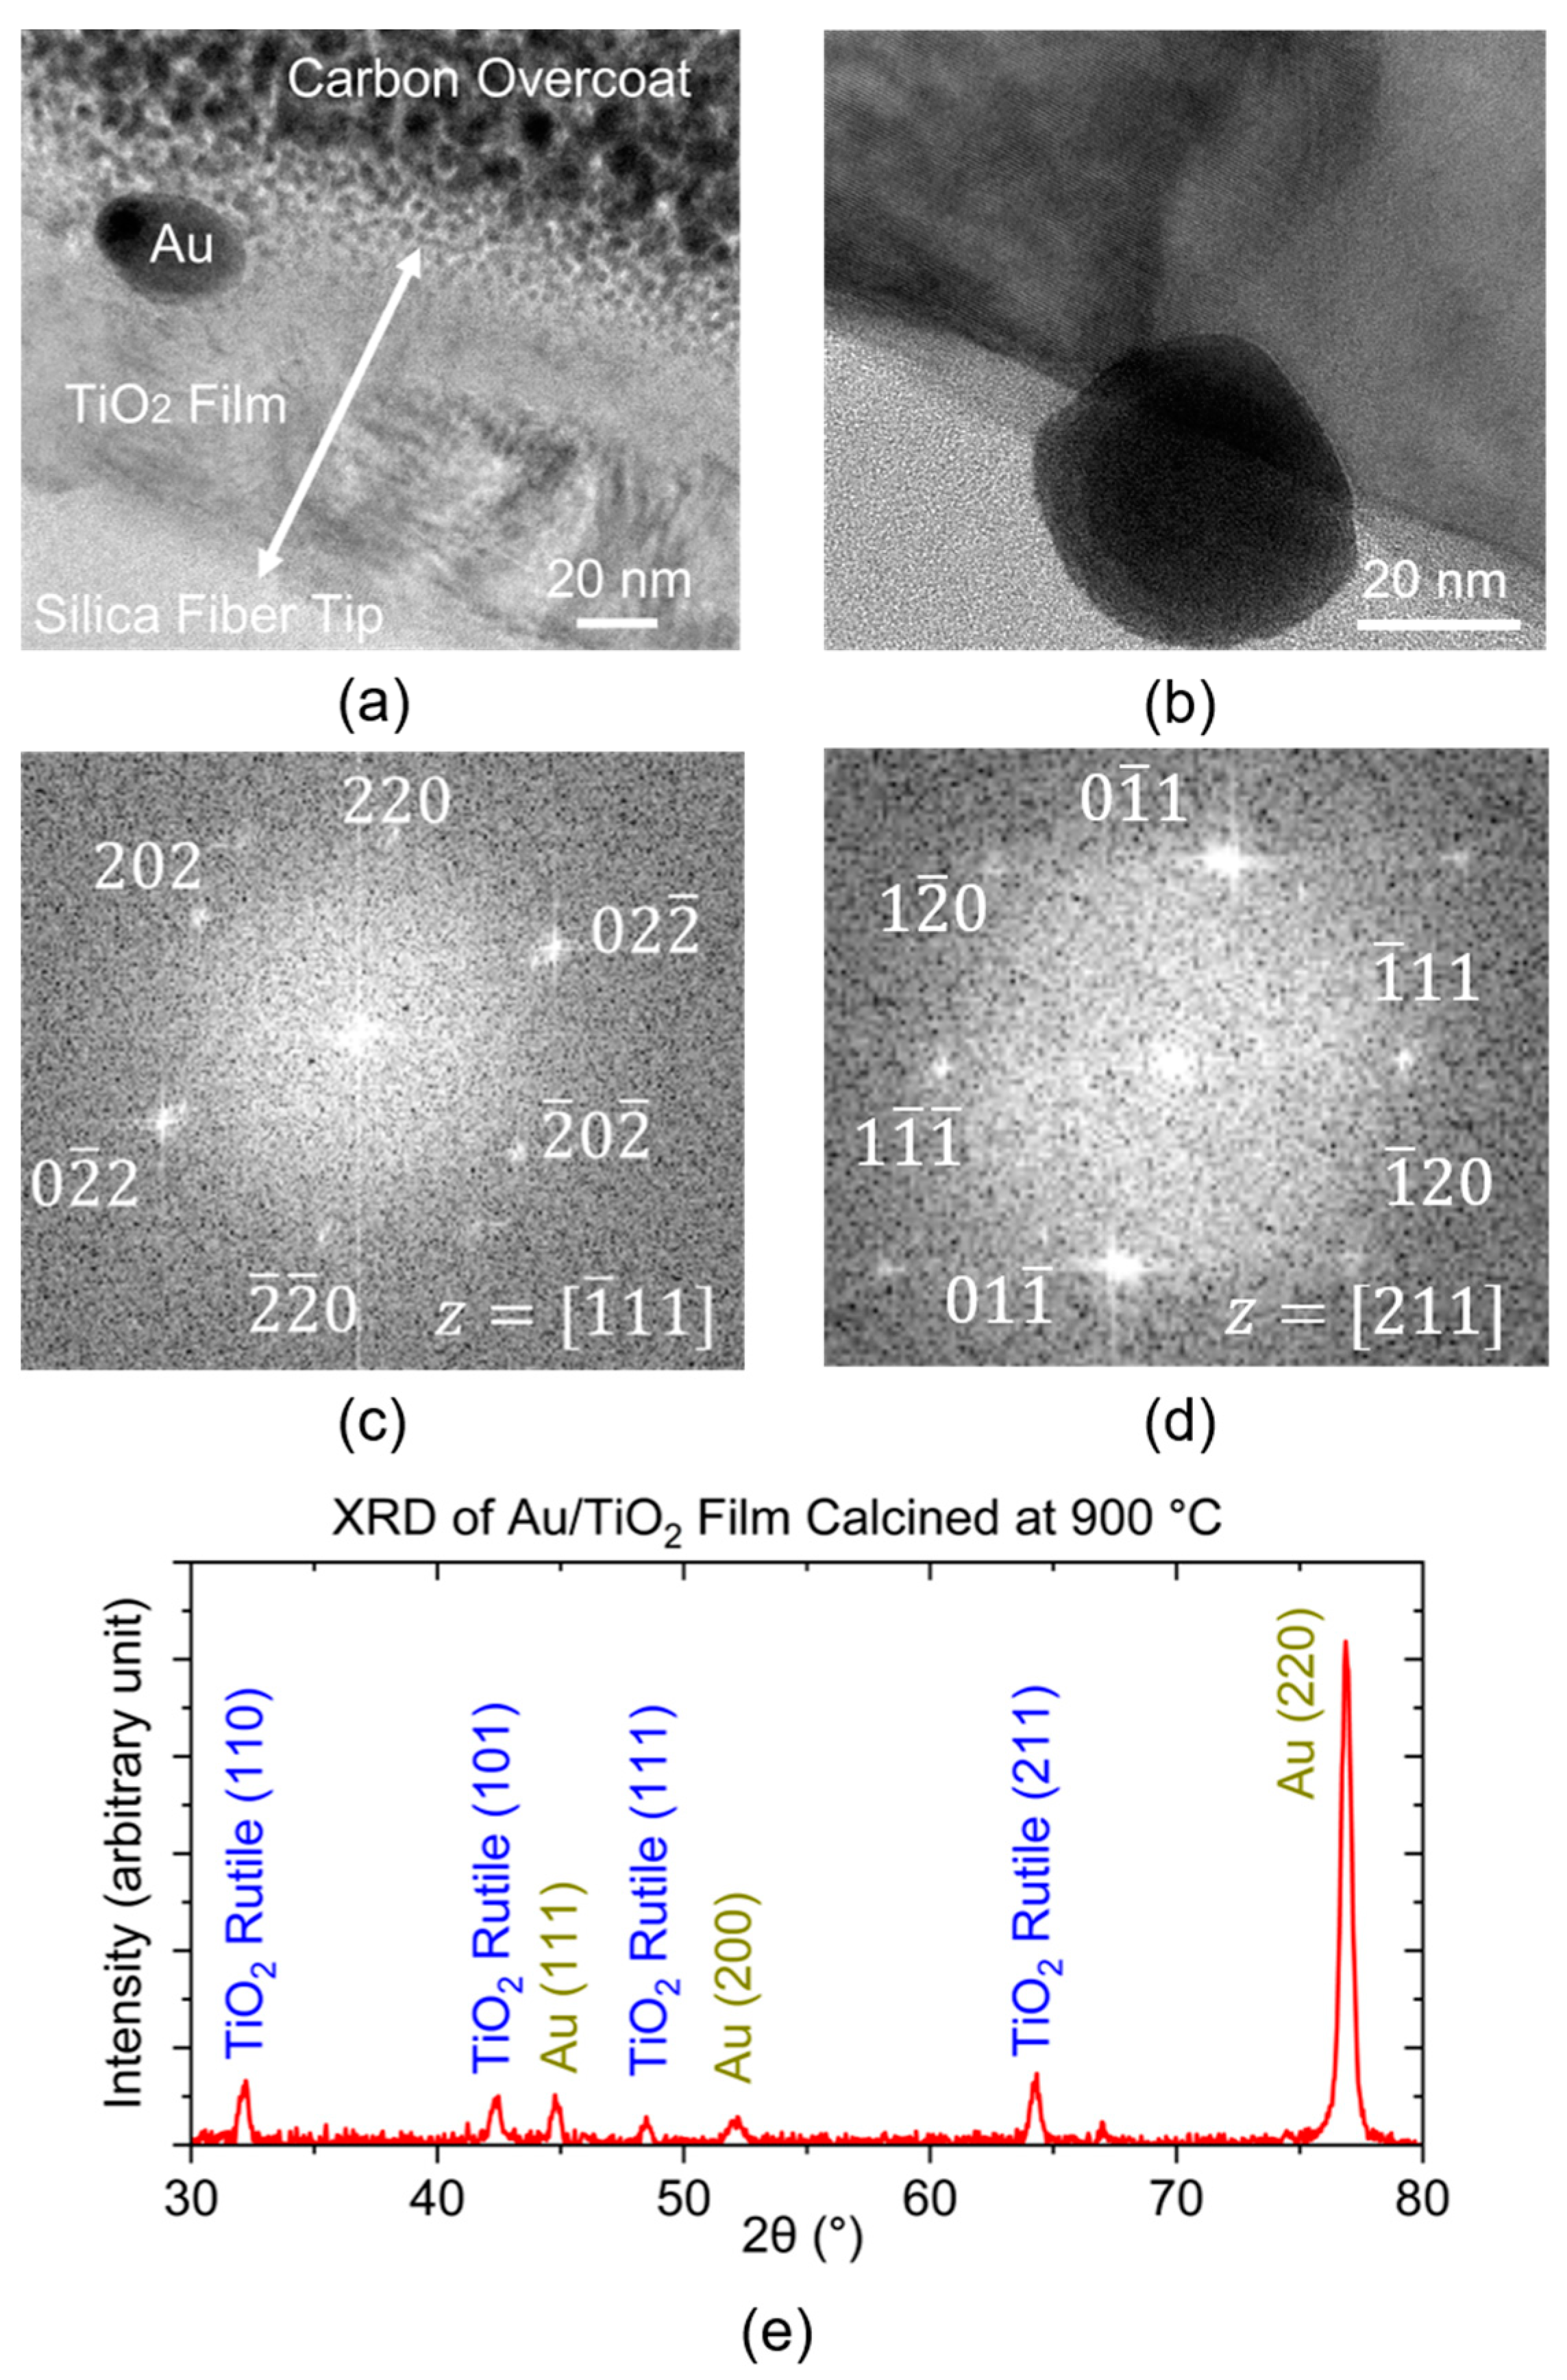
2.1. Materials Preparation and Characterization

Au/TiO2 and Au/SiO2 nanocomposite thin films are made by E-beam evaporation (PLASSYS, Marolles-en-Hurepoix, France) and magnetron RF sputtering (Angstrom, Cambridge, Ontario, Canada), respectively, in periodic multilayered structures. In preparing Au/TiO2 films, three layers of titanium are evaporated at a rate of 0.01 nm/s for 15 nm each, with two layers of gold alternately evaporated in between at a rate of 0.05 nm/s for 4.4 nm each. The specified thicknesses are to ensure an approximate 10 vol% of Au after calcination step considering the volume expansion from titanium oxidation. This process is performed in a vacuum with a plasma etch cleaning step preceding the deposition. To reach oxidation and spheroidization of fully dispersed Au NP, the Au/Ti film stacks are then subjected to a post-calcination step in a tube furnace from room temperature to 900 °C in air at a ramping rate of 2.5 °C/min, followed by isothermal hold at 900 °C for 2 h and a cooling step to room temperature at a rate of 2.5 °C/min. Figure 1 illustrates the deposition and post-processing of an example Au-NP-incorporated TiO2 thin film. In preparing Au/SiO2, three layers of SiO2 are sputtered at a rate of 0.012 nm/s for 25 nm each, with two layers of gold alternately sputtered in between at a rate of 0.05 nm/s for 4.5 nm each. The working pressure in the sputtering chamber is set to be 5 × 10⁻³ Torr with an Argon working gas at a flow rate of 10 sccm. The Au/SiO2 film stacks are heat-treated after the deposition using the same calcination schedule described above. All nanocomposite thin films are coated on both 1-inch quartz disc and step-index multimode (MM) fiber (FG105UCA, Thorlabs, Newton, NJ, USA) substrates. MM fiber segments 8 cm long are cleaved on one end. Both the fiber and planar quartz substrates are then cleaned with IPA and ethanol before deposition. To deposit films on the fiber tip, during all processes in the above deposition chambers, fiber segments are held upright by Kapton tapes with the cleaved end facing the target materials.
The driving force for Au NP formation in the oxide matrix is a combined effect of solid-state interfacial diffusion and a difference between bond energies of Au-Au and Au-oxide. Figure 2 shows the SEM (ZEISS, Oberkochen, Germany) images of the calcined fiber samples with Au/TiO2 or Au/SiO2 film deposited on the fiber tip. All SEM images are performed in a variable-pressure mode with a low vacuum level at a chamber working pressure of 4 × 10⁻⁴ to 7 × 10⁻⁴ mbar to prevent the charge accumulation on the non-conductive oxide sample surfaces. Au/TiO2 and Au/SiO2 film on a fiber sensor tip are characterized in Figure 2a and Figure 2b, respectively. Although larger particles of approximately 1 μm can be observed on the surface, Au particles appear to be uniformly dispersed as shown in Figure 2c,d for both materials, with the majority of particles being much smaller in size. Nanoscale Au spherical particles ranging from 100 to 200 nm can be seen in Figure 2e on the surface of the Au/TiO2, whereas in Figure 2f, more elongated and islanded shapes of Au particles are revealed on the surface of the SiO2 host. This is likely due to the absence of grain boundaries in the amorphous SiO2 to effectively trap the NP on the surface of the films. However, Au particle size distribution in Figure 2g,h shows that much smaller (<50 nm) Au NP dominate in both the TiO2 and SiO2 matrix hosts, which accounts for 57.5% of the NP in TiO2 and 50% of that in SiO2 matrices. This meets the quasi-static approximation of propagating light wave in nanostructures and confines the LSPR absorption bands in the visible range.
The larger particles tend to lie on the surface, resulting from enhanced surface diffusion rates of Au atoms relative to the film interior. The optical properties of both materials are first confirmed using planar quartz samples measured by standard spectrophotometer (JASCO, Japan). As shown in Figure 3a, the Au/TiO2 sample exhibits an LSPR absorption band with full width at half maximum (FWHM) spanning from 600 to 750 nm. Spectra of Au/SiO2 in Figure 3b, on the other hand, have the FWHM of LSPR band at 500 to 550 nm. Despite the fact that most Au NP are spherical and less than 50nm in diameter, the less symmetric and larger ones will tend to contribute additional absorption and even scattering at longer wavelengths than would be predicted within the quasi-static approximation, thereby shifting the spectral location of the LSPR and affecting the intensity of the absorption peak [32]. This tends to raise heterogeneities among samples with the same processing recipe. In addition to particle size, different spacing, resulting from plasmon coupling and radiative dipole interaction between nearby Au NPs, is another parameter to consider that can vary the spectral location of LSPR peak [33]. A systematic analysis is required regarding the size, shape, and spacing distribution of the NP inclusions and their effect on the effective optical constants of the nanocomposite medium, and thus the LSPR spectral properties, for high quantitative accuracy of LSPR optical response modeling. Nevertheless, the quasi-static approximation can still yield useful insights for comparative benchmarking with experimental results and trends observed in practice.

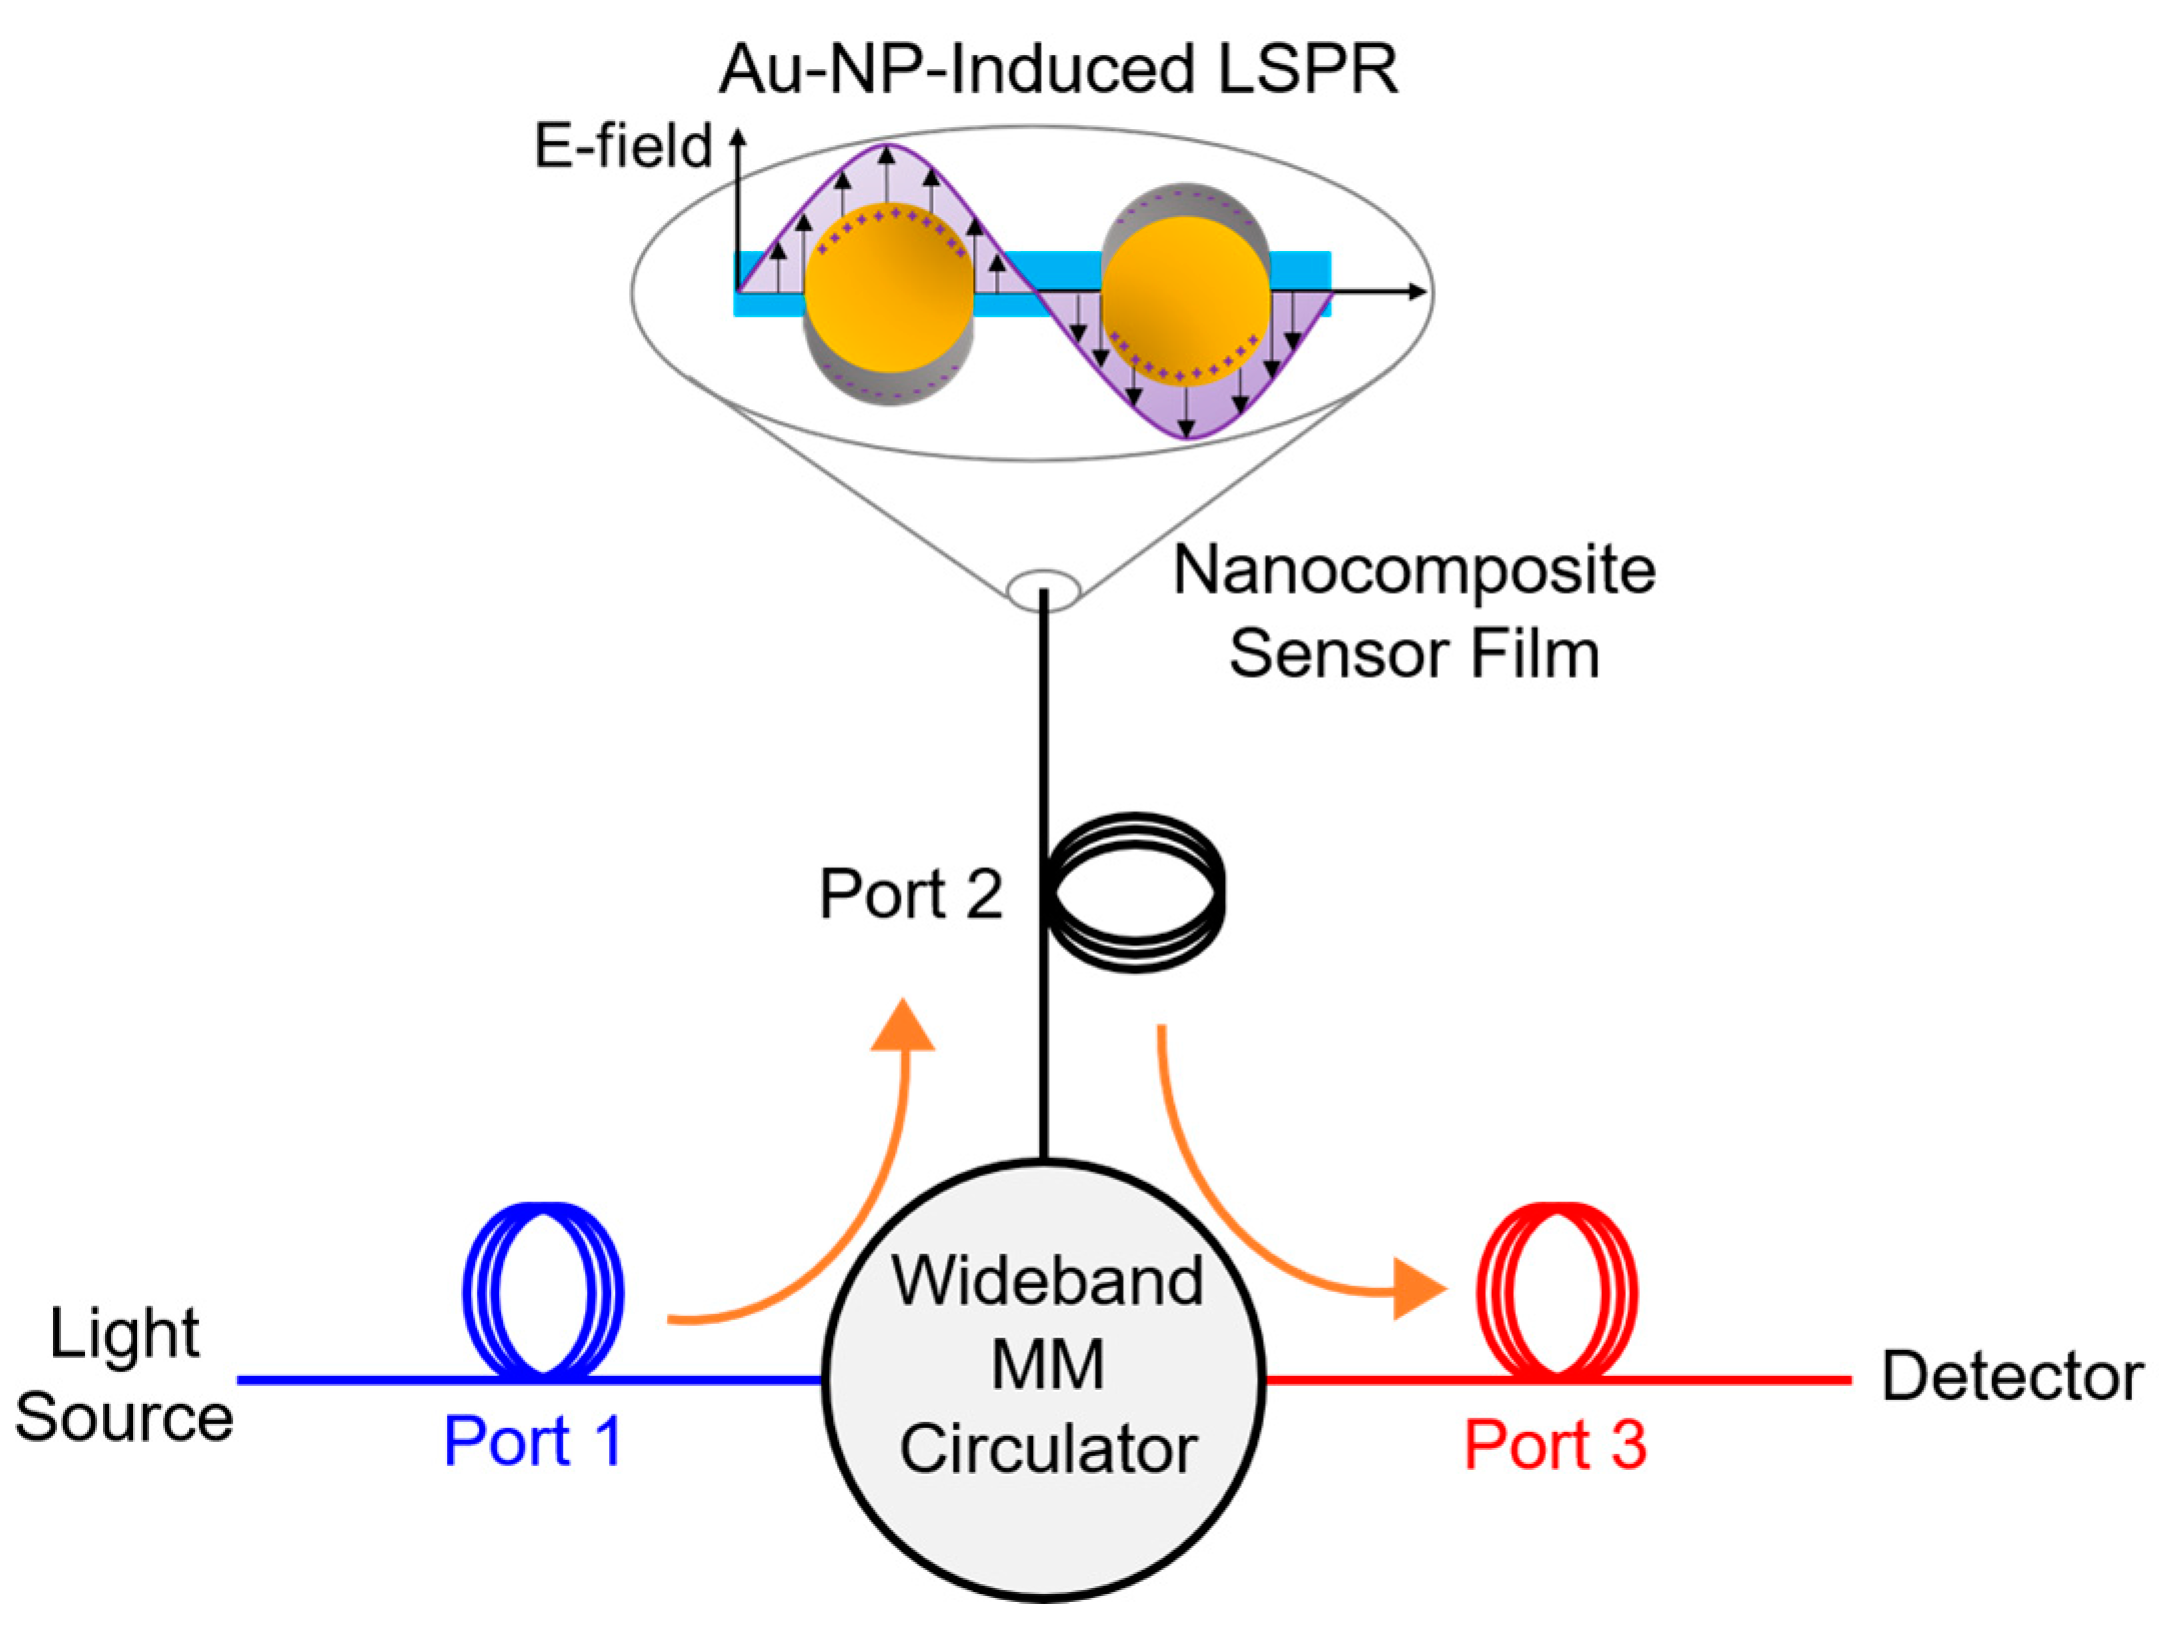
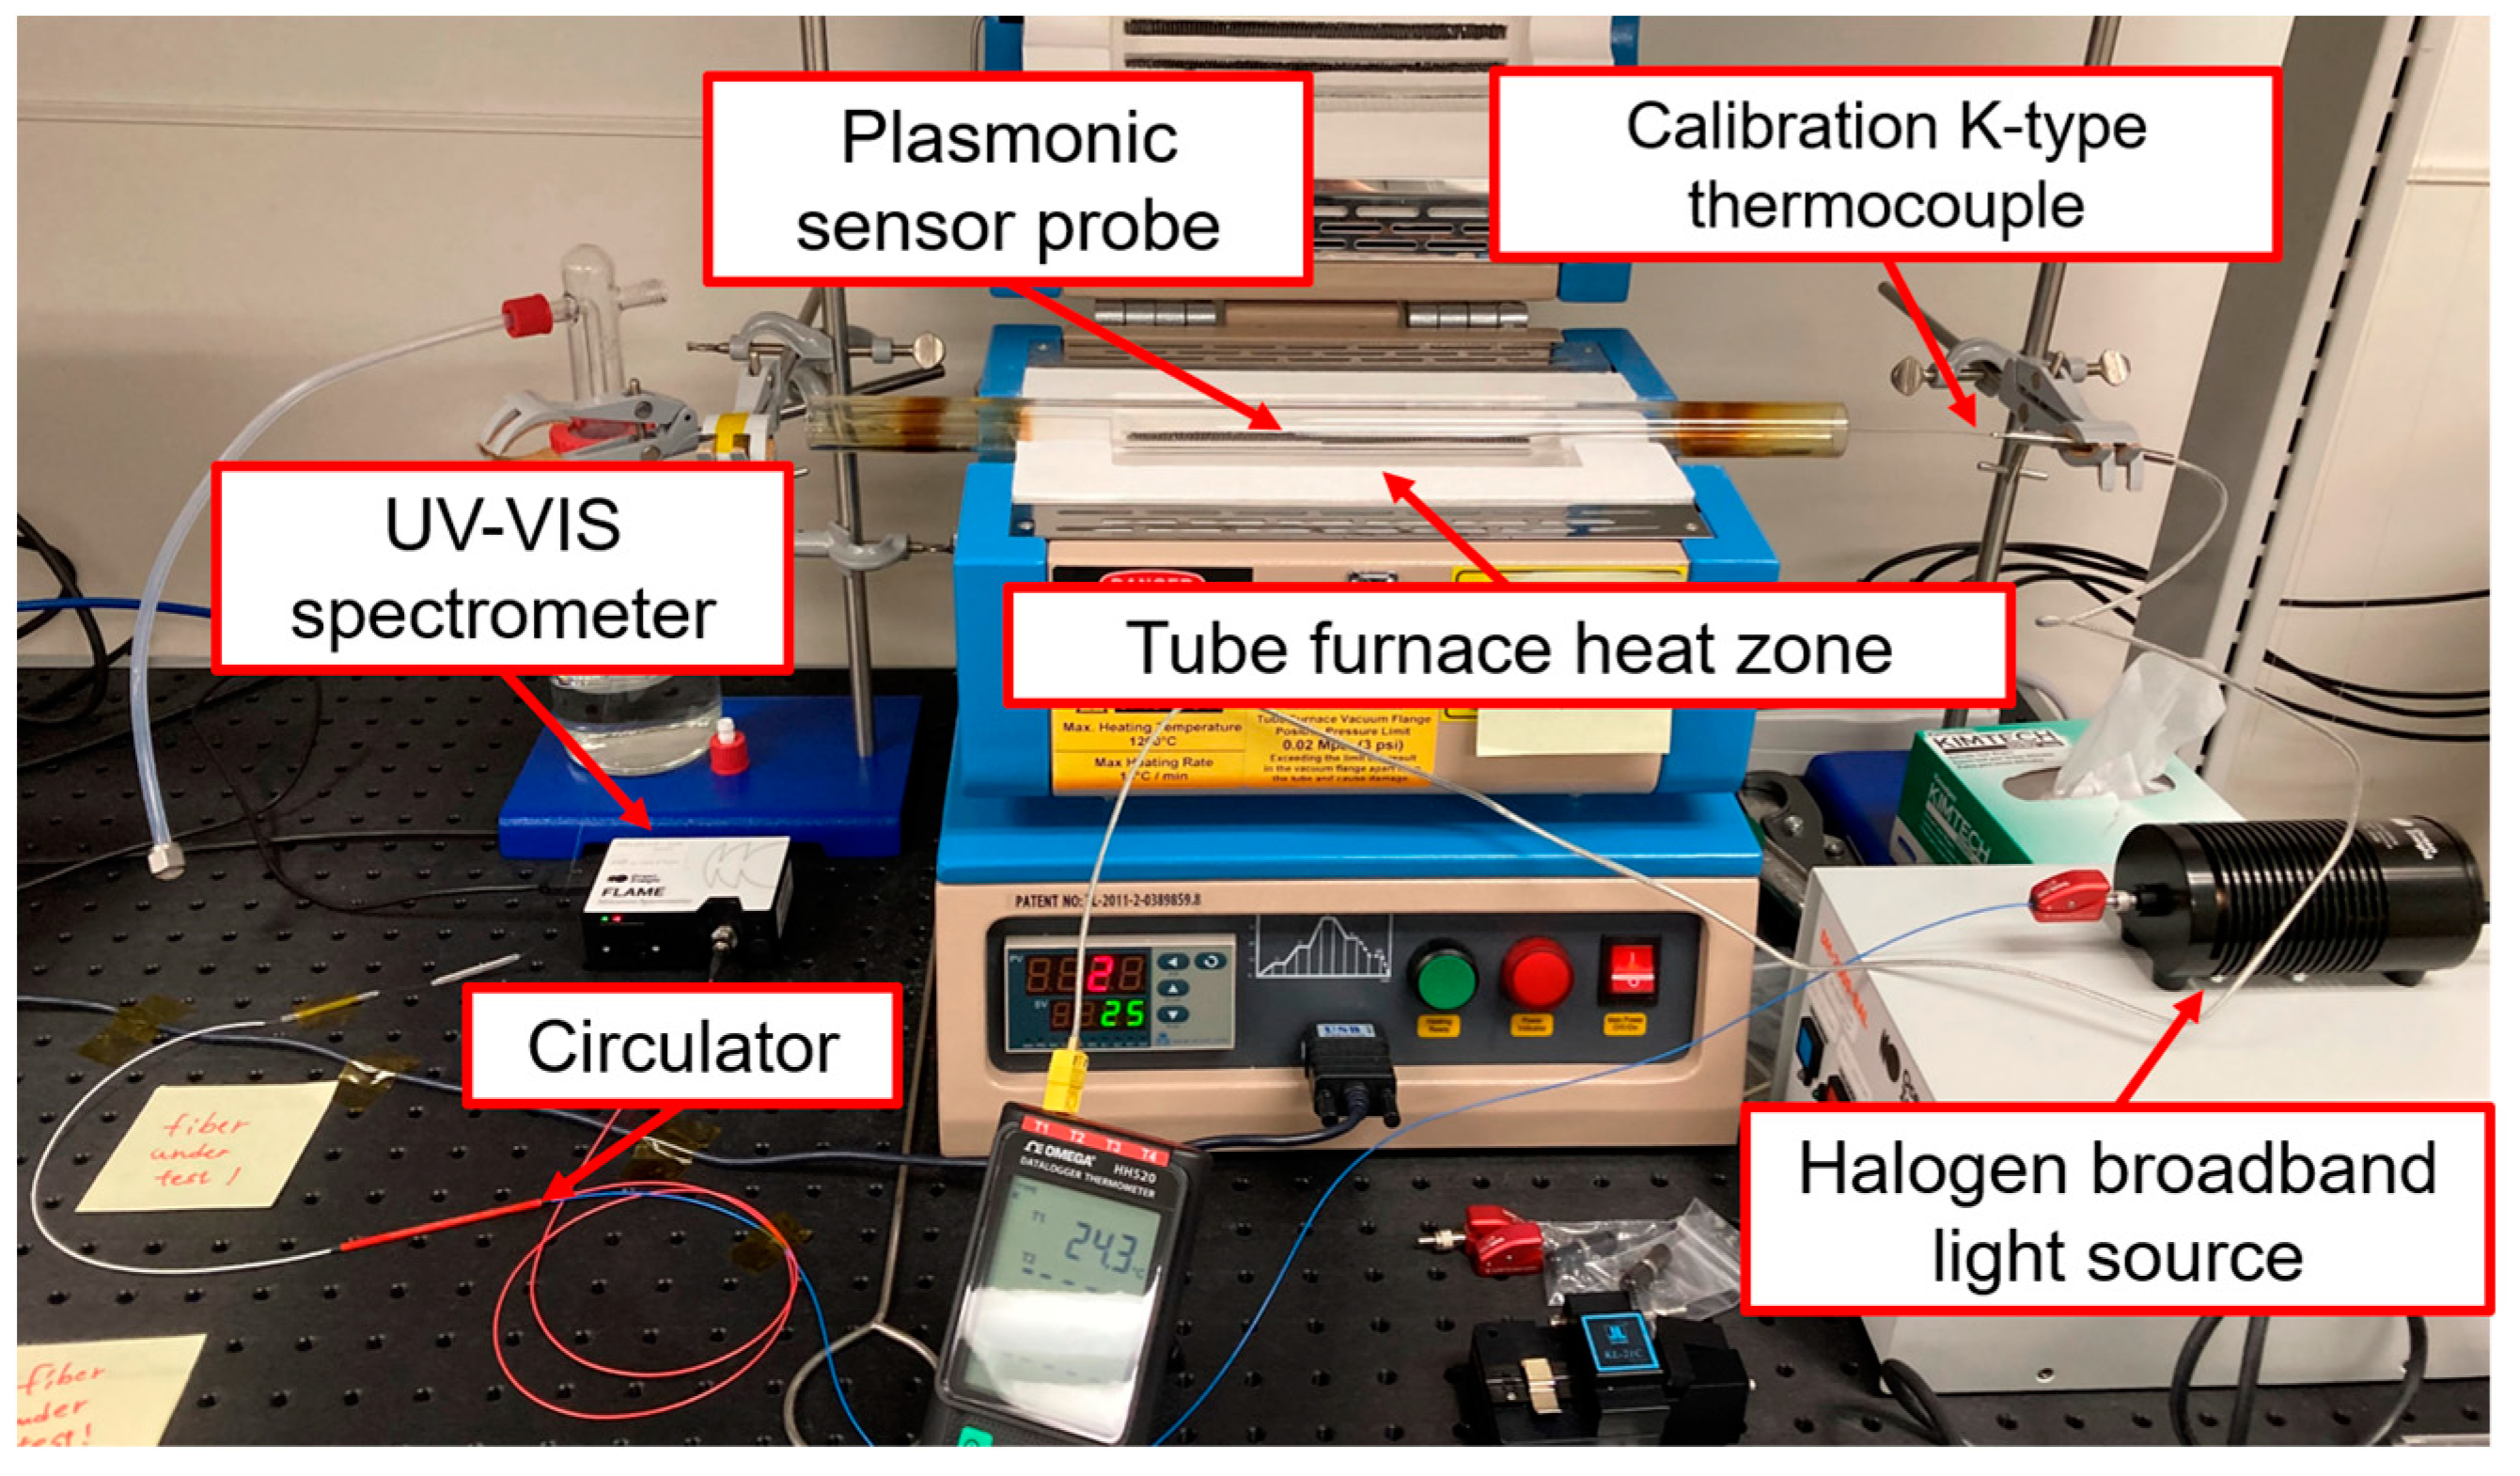
2.2. Sensor and Conventional Interrogation Setup

The reflection-based fiber sensor is made by fusion-splicing a MM fiber sensor segment, 105 μm in core diameter, to a wideband MM circulator (WMC1H1S, Thorlabs, Newton, NJ, USA), as shown in Figure 4. Lead fibers at port 1, 50 μm in core diameter, are connected in free space to the light source; whereas fibers at port 2 and 3, with core diameter of 105 μm, are spliced and connected to the sensor element and the interrogator, respectively. Temperature sensing experiments are performed using the conventional interrogation equipment: a Halogen broadband white light source (Ocean Insight, Orlando, FL, USA) with Flame UV-VIS spectrometer (Ocean Insight, Orlando, FL, USA). As shown in Figure 5, the optical fiber is inserted in a tube furnace (MTI, Richmond, CA, USA), with the sensor probe being placed at the center of the heating zone. A k-type thermocouple is placed from the other end into the quartz tube in vicinity of the fiber sensor to calibrate the temperature readings. The furnace is programmed to ramp from room temperature to 500 °C in 30 min, with an isothermal hold for 10 min and subsequently cooled down by air. The data sampling rate of the thermocouple logger is set to be 1 s−1. Data acquisition parameters of the spectrometer depend on the reflectance of the post-annealed nanocomposite deposited on the sensor tip. For Au/TiO2 sensors, the integration time is set to be 3 to 5 ms. However, 10 to 12 ms of integration time is needed for Au/SiO2 sensors due to the lower reflection intensity of the SiO2. For all sensors in this setup, 100 scans of spectrums are averaged to obtain one visible range of spectral data. The data update rate is set to be 1 s−1. The spectral resolution of the spectrometer is 1.35 nm with a boxcar averaging width of 5 data points being applied to increase the signal-to-noise ratio (SNR).

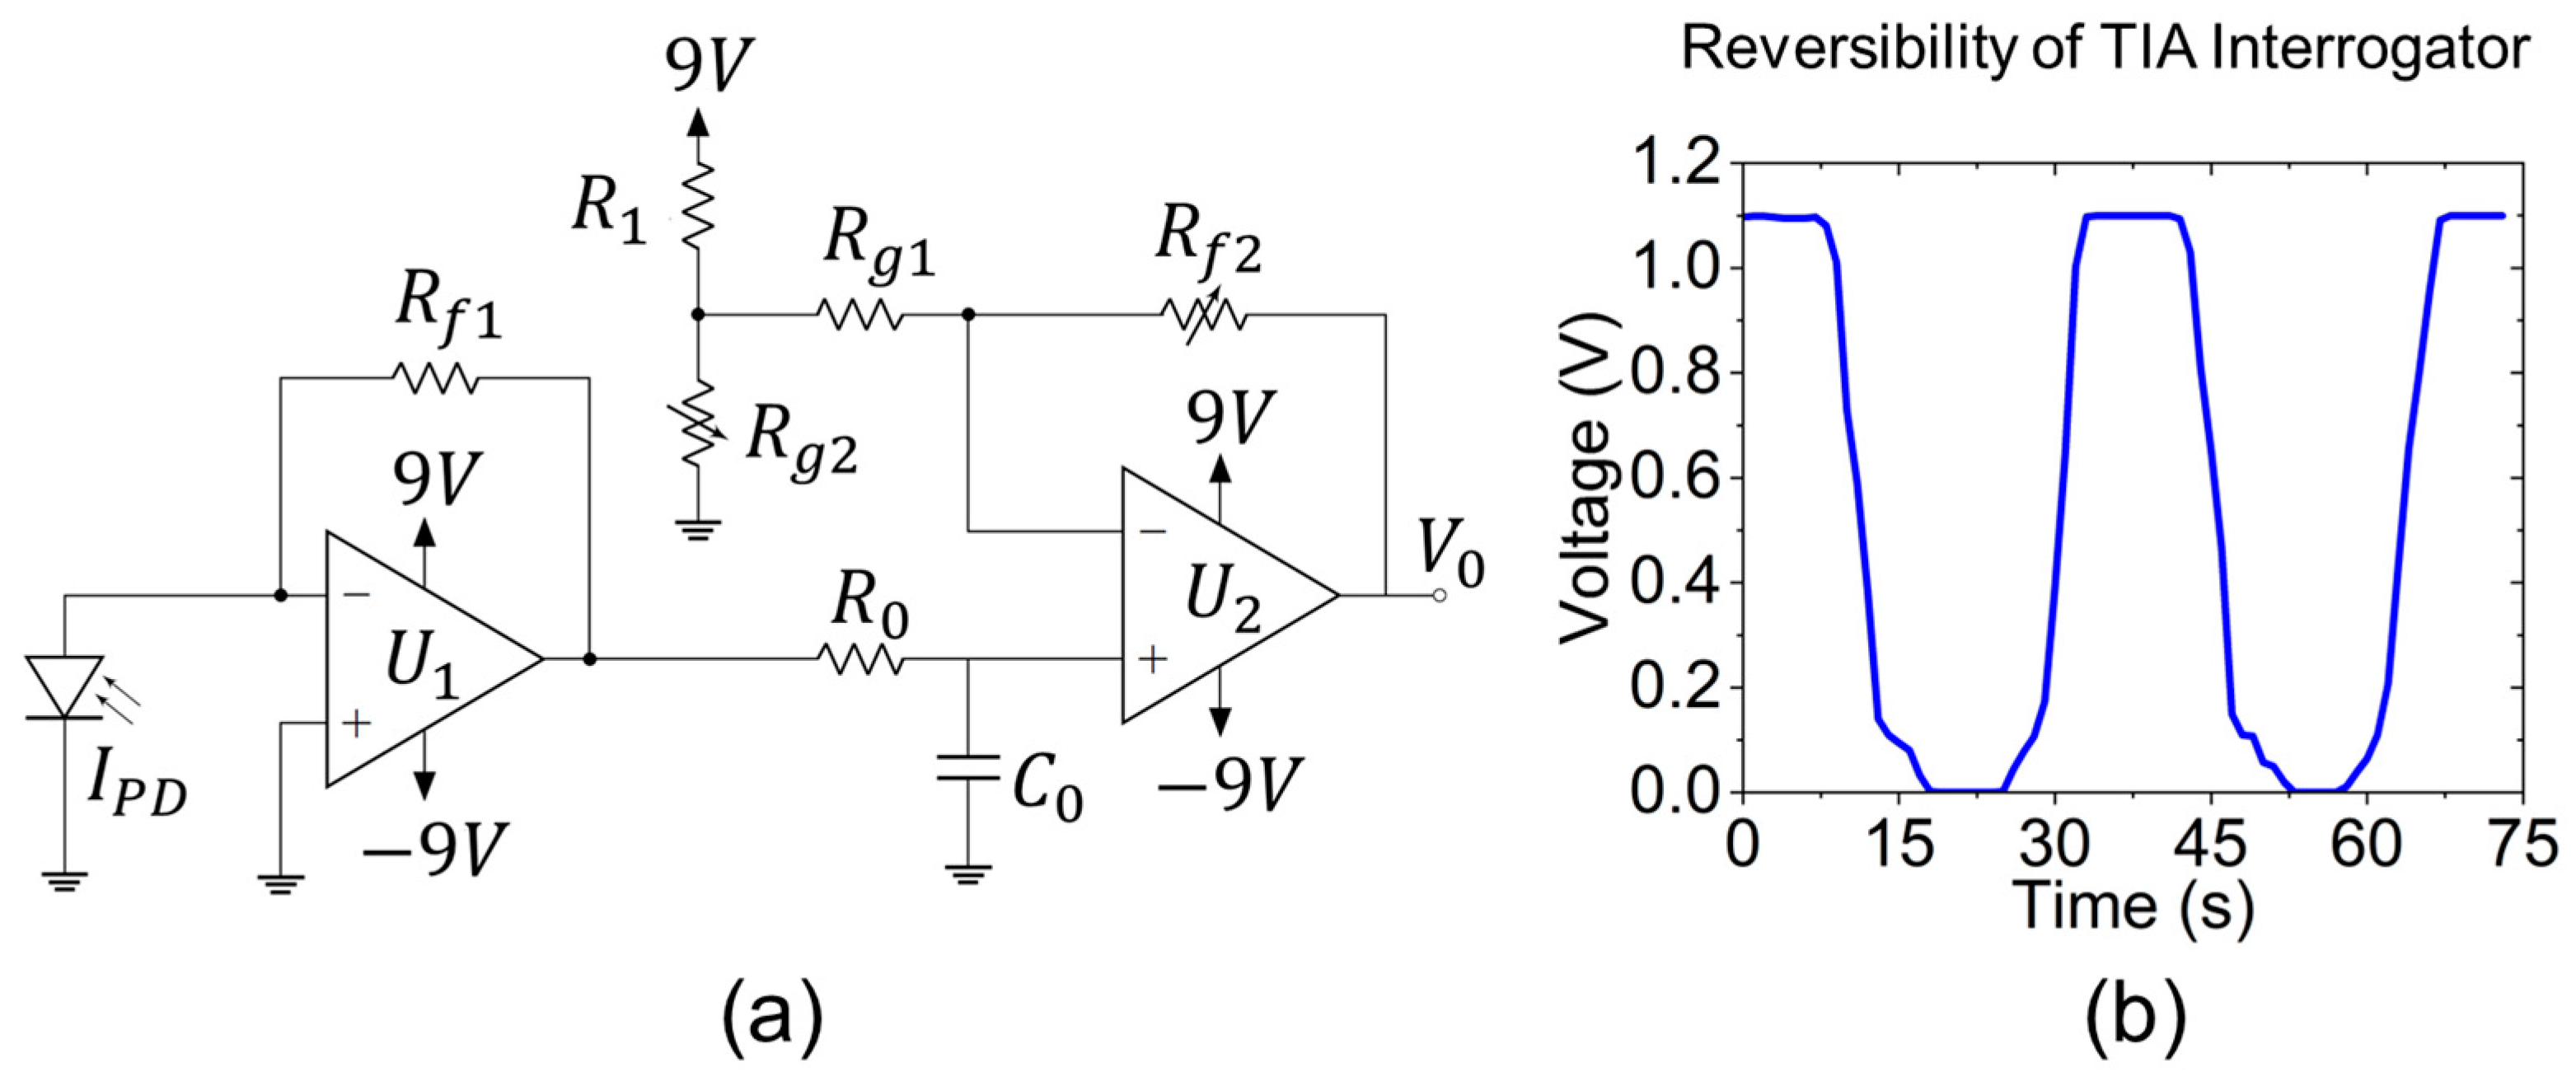
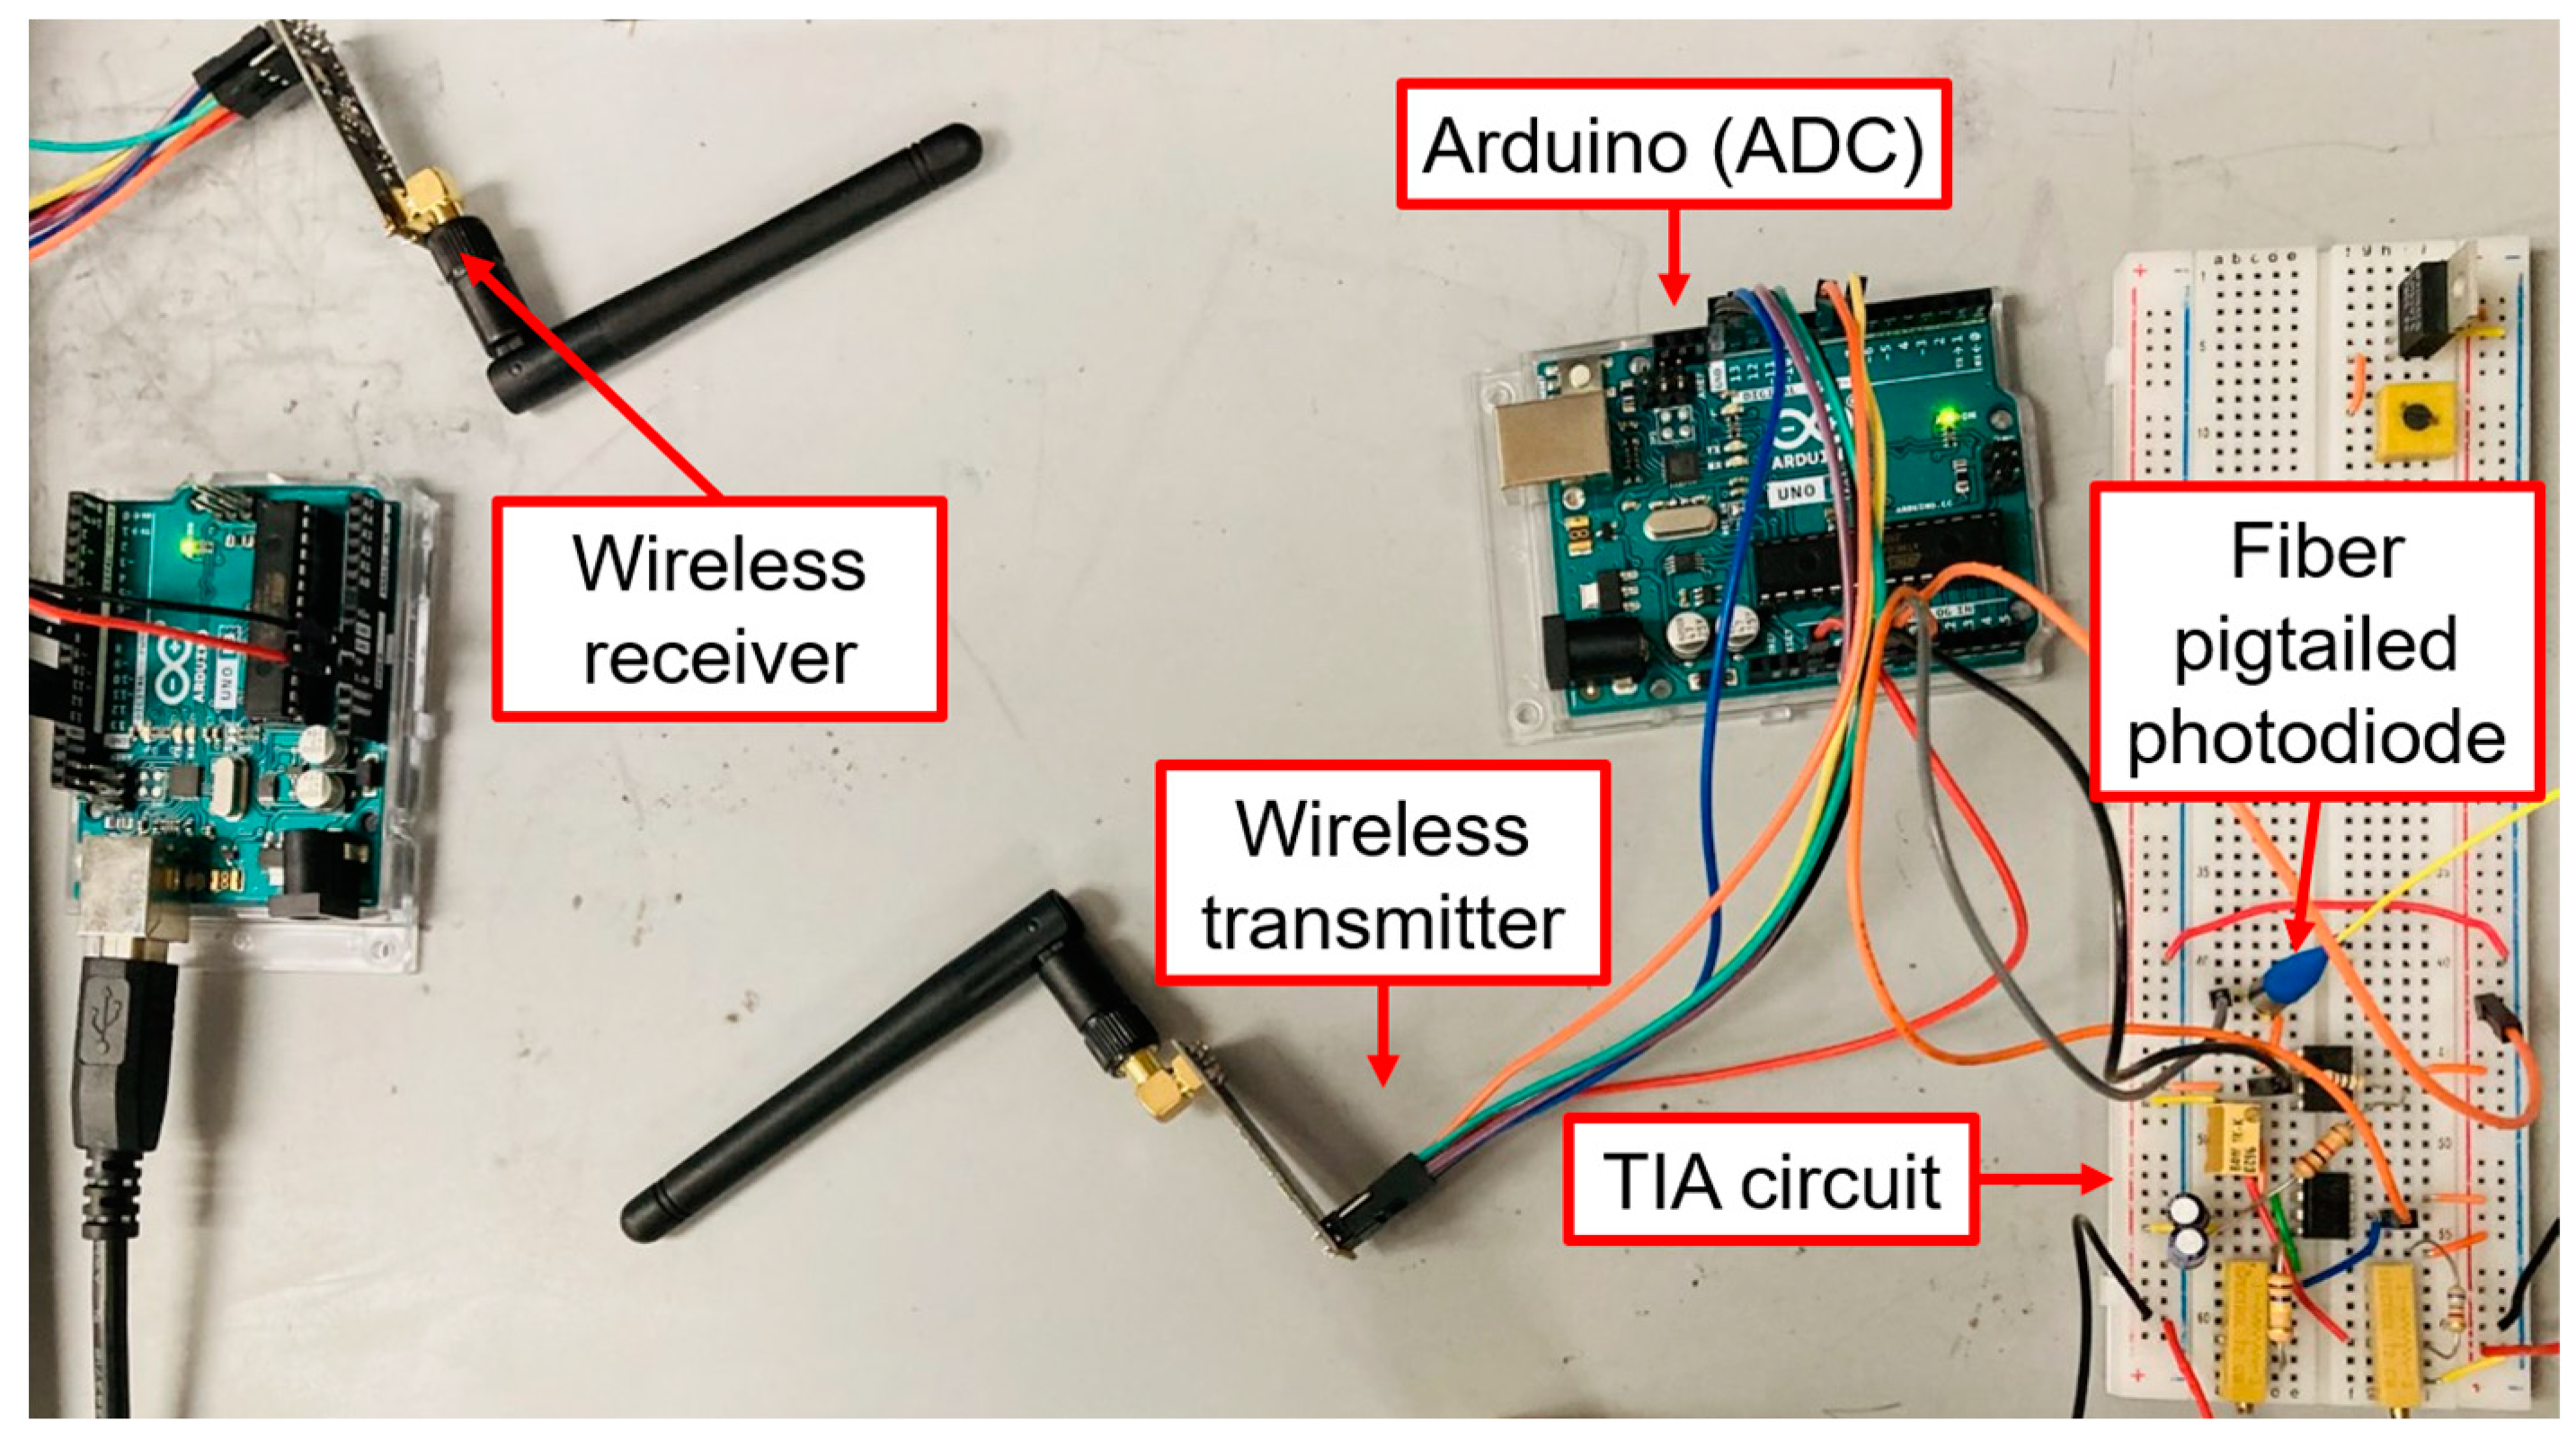
2.3. Wireless Interrogation

The low-cost interrogator circuit consists of a pigtailed photodiode (FDSP625, Thorlabs), dual-stage amplifiers, two Arduino Uno microcontroller boards, and two wireless transceiver modules (nRF24L01+), with a total build cost of USD 250. The detailed operation principles of TIA was described previously in our work [31]. Here, an updated design of the dual-stage TIA is shown in Figure 6a. A single wavelength fiber-coupled LED (M530F2, Thorlabs) is used as the light source. Briefly, the photocurrent, I P D , from the diode is converted into output voltage, V 0 , by the operational amplifier (Op-Amp), and later transmitted by the microcontrollers. The max. and min. of the photocurrent and output voltage define the gain of the Op-Amp, which is also represented by the feedback resistor. The photocurrent change from the sensor is designed to be amplified to the voltage input range of the Arduino analog-to-digital converters (ADC), and a DC offset is added for the minimum current to correspond to the minimum voltage of the ADC. The internal ADC reference voltage of the Arduino is 1.1 V. The dual-stage amplifier consists of a high-gain transimpedance amplifier, U 1 , cascaded into a low-gain amplifier, U 2 , with filtering and a DC offset [34]. The cut-off frequency of the low-pass filter is defined by R 0 and C 0 to capture the low frequency of temperature optical response. The DC offset is controlled by resistors R 1 and R g 2 that form a voltage divider, and the gain is customized by resistors R f 2 , R g 1 and R g 2 through two potentiometers. The non-inverting input of U 2 takes the voltage produced by the first stage, and its inverting input receives voltage produced by the voltage divider. With the component values chosen, this circuit can provide signal gain between 0.07 V/nA and 0.33 V/nA and up to 90V of negative DC offset. For a proof of concept, the nanocomposite reflection fiber sensor is spliced with the photodiode and integrated with the low-cost customized TIA interrogator to test the voltage output. Figure 6b shows the reversibility of the voltage variations wirelessly transmitted as a function of input optical intensity by manual adjustment of the LED driver over a short period of time. The transmitter-integrated Arduino is programmed to take 100 voltage samples each second and average them to mitigate the noise inherent to a high-gain system. The nRF24L01+ wireless modules communicate with the Arduino through an SPI interface and transmit/receive signals in the 2.4 GHz band. Data is collected and logged from the receiver using the USB interface of the Arduino at a sampling rate of 1 s−1 after the data pre-processing. The entire low-cost wireless interrogator is presented in Figure 7. Two 9 V batteries are connected in series to power the entire interrogator circuit. Alternative power supply options are being considered for future prototypes.

3. Theoretical Modeling Procedures

In order to benchmark and validate the experimental results of LSPR plasmonic sensors, we developed an analytical model that combines thin-film optics and an optical waveguide in reflection geometry carried out in MATLAB programming. This model consists of two major parts: optical constant models of different Au-incorporated nanocomposites in a visible range and an MM fiber wave optics model that starts from a collimated light source through the lead fiber to the nanocomposite film, implemented by Fresnel and Airy’s expression of transmission and reflection coefficients in layered media.

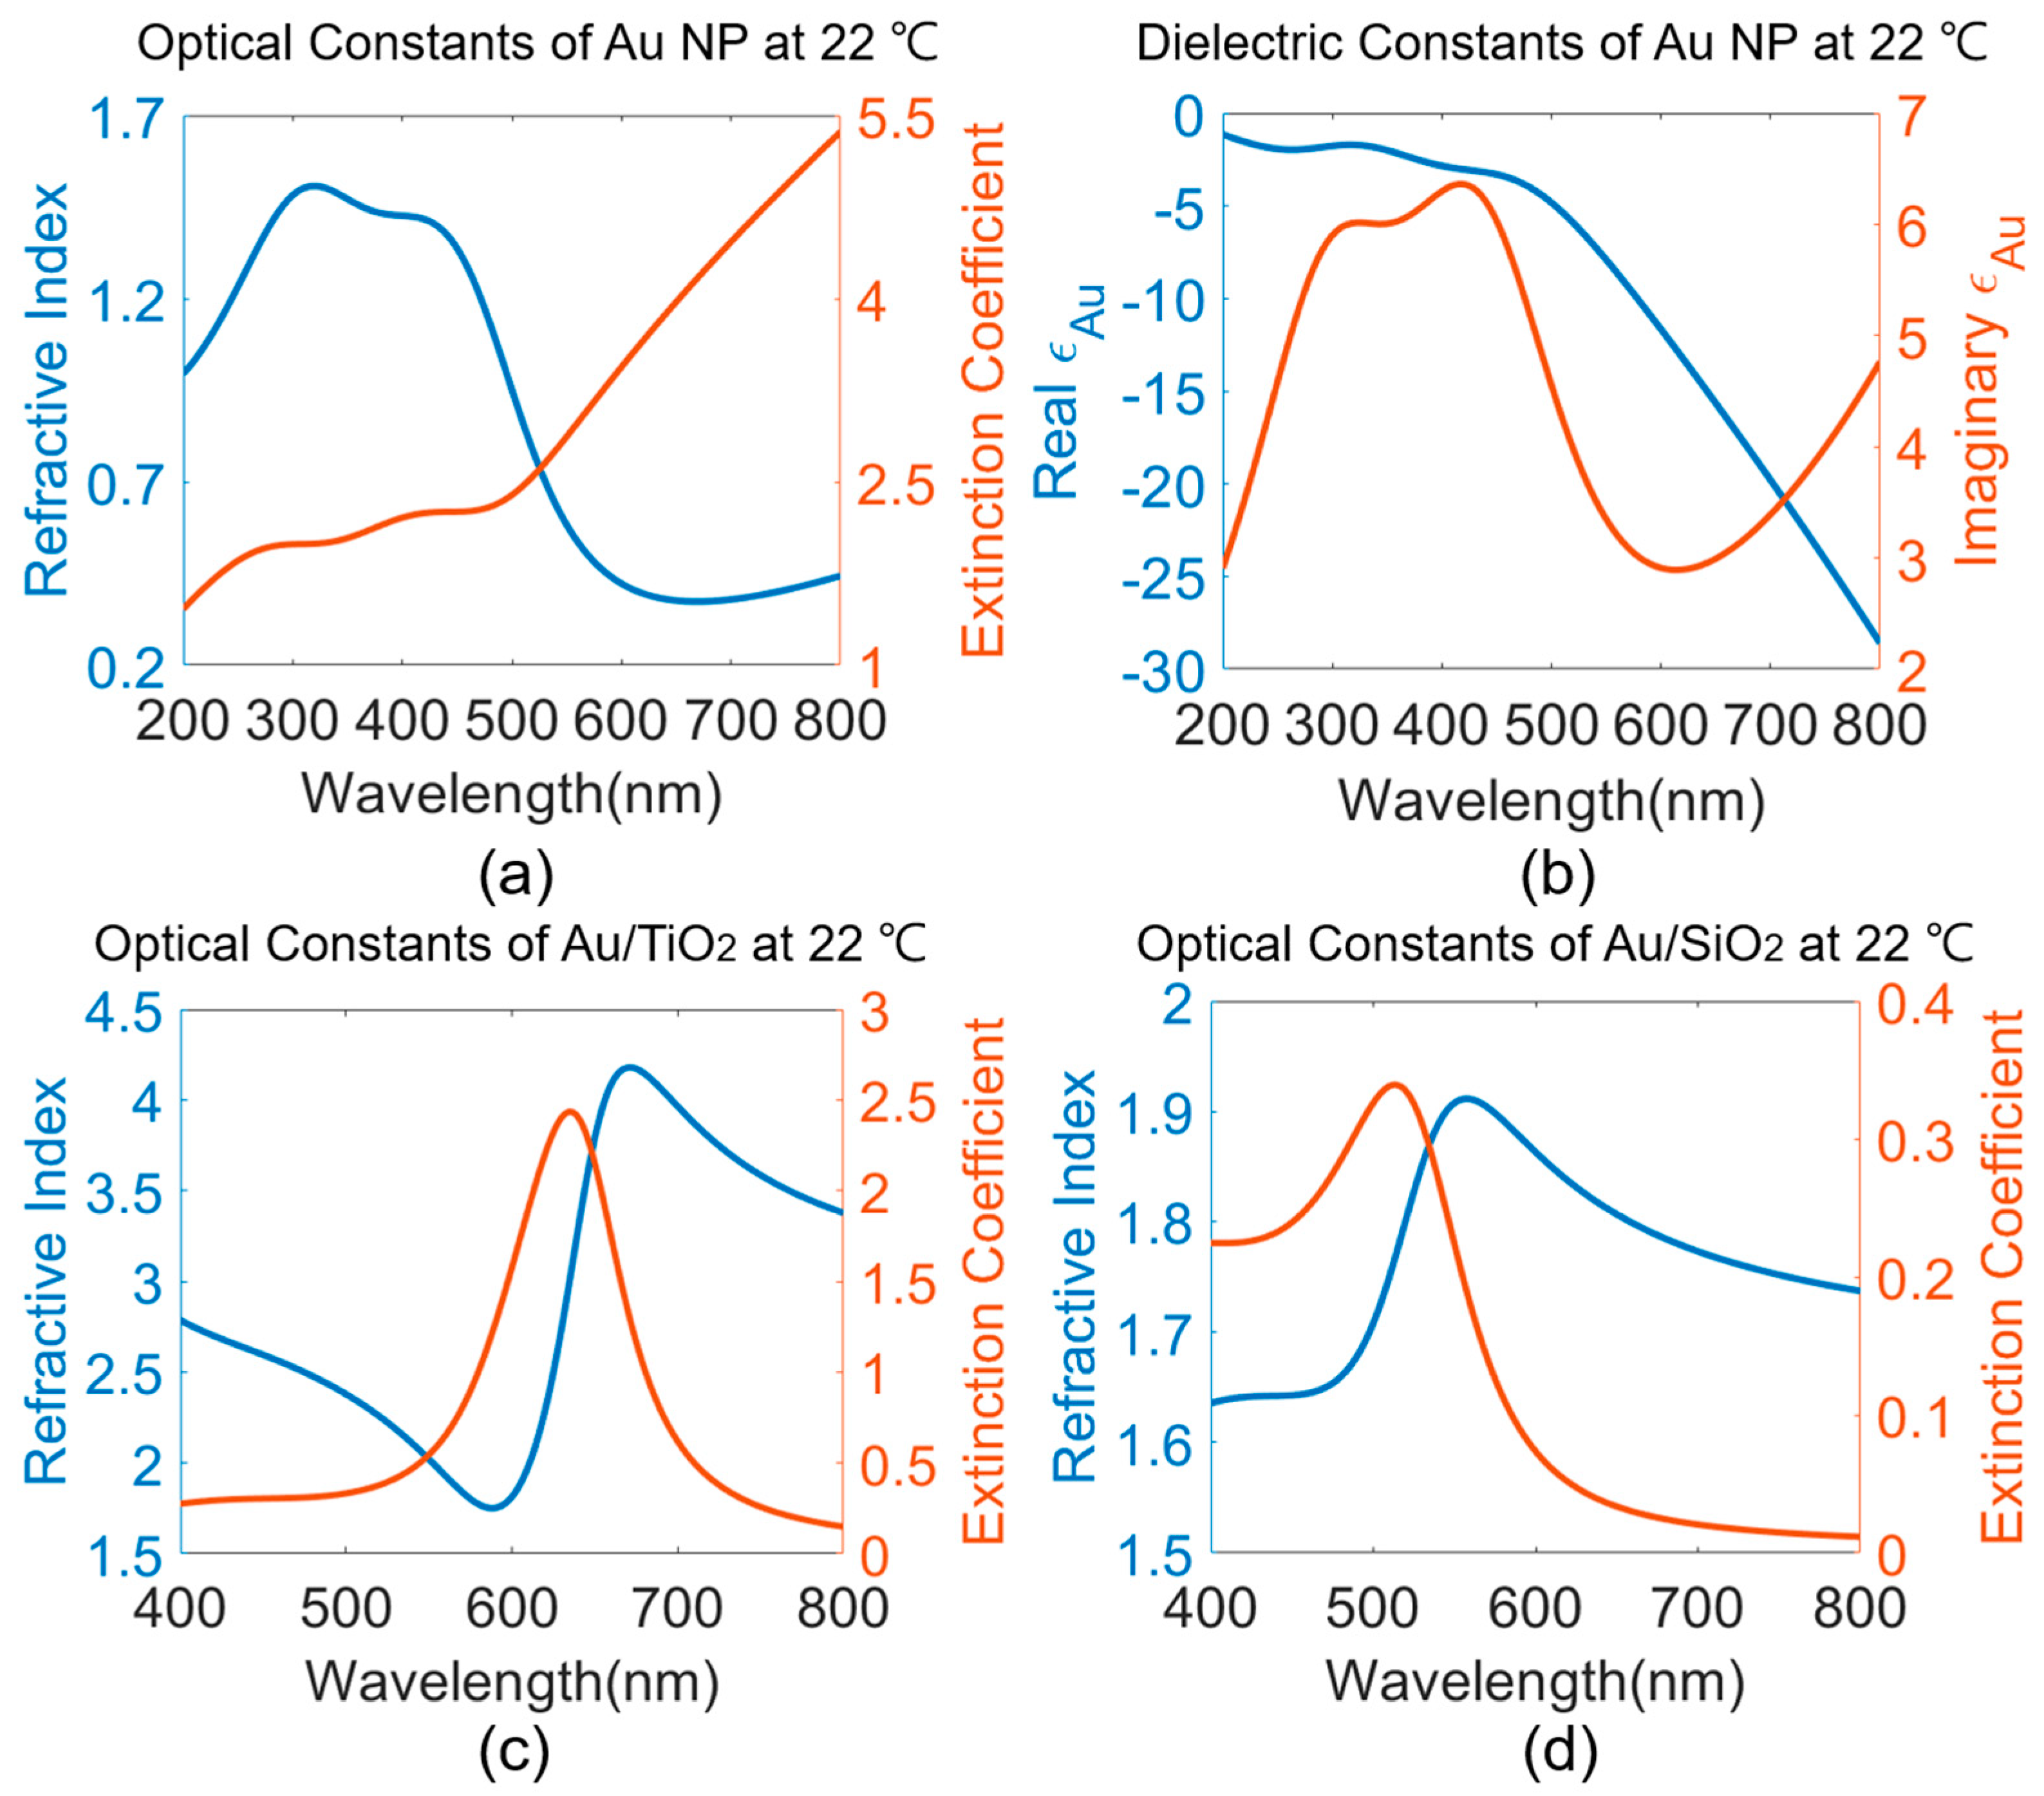
3.1. Optical Constant Modeling

Optical constant models using Sellmeier dispersion relations of SiO2 and TiO2 were described in detailed in our previous work [31], with the degree of birefringence of TiO2 polycrystalline tetrahedral structure neglected. Constant thermo-optic coefficients of 1.28 × 10⁻⁵/K and −1.49 × 10⁻⁴/K are used for SiO2 and TiO2, respectively, to capture the temperature dependence of refractive indices [20,27]. On the other hand, optical constants of Au NP, n A u , requires a careful consideration of both the electronic intraband absorption in the longer visible range and the interband absorption in the shorter, visible-to-UV range. This is modeled by a linear combination of interband transition term of the dielectric constant of Au, ε A u I B , and a Drude oscillator in (2). ε is the high frequency limit of dielectric constant of Au. The asymmetric line shapes of the two interband transition peaks render it difficult to model ε A u I B without using many Lorentz oscillators with phenomenological fitting parameters. Therefore, critical point analysis of interband transitions [35] are performed in (3) with parameters acquired from Etchegoin et al. [36], where C j is the amplitude, φ j the phase, E j the interband energy gap, τ j the broadening parameter for the jth critical point, and μ j the order of the pole. As simulated in Figure 8a, two dominant interband electronic transition features are captured in the 300 to 400 nm region. The same interband transition features can be seen in the corresponding complex dielectric function of Au NP in Figure 8b. The temperature dependence of Au NP lies in the Drude term in (2), where ω p is plasma frequency as a function of temperature and a thermal expansion coefficient of Au, γ e , as in (4) [37]. ω is the frequency components of incident light, and ω c , in (5), is a size-dependent collision (damping) frequency as a result of the electro–electron scattering frequency, ω c e , and the electron–phonon scattering frequency, ω c p . v F is the Fermi velocity representing free electrons travelling in Au, and r n p is the Au nanoparticle size. Electro–electron scattering in (6) is modeled by the Lawrence expression [38], whereas the Holstein model in (7) is based on the Debye model of phonon’s specific heat contribution in solids and is used to model electron–phonon scattering [39]. Γ is scattering probability averaged over the Fermi surface,   is Umklapp fractional scattering, E F is the Fermi energy, h is the Dirac constant, k B is the Boltzmann’s constant, T D is the Debye temperature, and ω 0 is a frequency constant.
n A u ( ω , T ) = ε A u I B + ε ω p 2 ω ( ω + i ω c )
ε A u I B = j = 1 2 C j [ e i φ j ( E j E i τ j ) μ j + e i φ j ( E j + E + i τ j ) μ j ]
ω p ( T ) = ω p o [ 1 + γ e ( T 298 ) ] 1 / 2
ω c ( T ) = ω c e ( T ) + ω c p ( T ) + v F r n p
ω c e ( T ) = 1 6 π 4 Γ h   E F [ ( k B T ) 2 + ( h ω 4 π 2 ) 2 ]
ω c p ( T ) = ω 0 [ 2 5 + 4 ( T T D ) 5   0 T D T z 4   d z e z 1 ]
ε e f f ε o x i d e ε e f f + 2 ε o x i d e = f A u ε A u ε o x i d e ε A u + 2 ε o x i d e
To derive the optical constant models for Au–oxide nanocomposites, Maxwell–Garnet effective medium theory, (8), is used. ε e f f gives the effective complex dielectric constant of the nanocomposite with Au NP assumed as spherical inclusions for simplicity, where the depolarization factor equals to 1. f A u is the volume fraction of Au NP doped in the oxide matrix. A total of 10 vol% of Au NP is assumed for all simulations in this work due to the temperature sensitivity analysis in our previous work [31] and the mechanical strength of the actual nanocomposite film studied by Rodrigues et al. [40]. Using Equation (8) and the parameters described in Table 1, the resulting optical constants of Au/TiO2 and Au/SiO2 are shown in Figure 8c,d. At the same Au doping level, Au/TiO2 shows a larger extinction coefficient in the anomalous dispersion region than Au/SiO2 due to the larger real index of TiO2 incorporated in the Maxwell–Garnet equation and the lack of an interband electron absorption overlaying the LSPR.

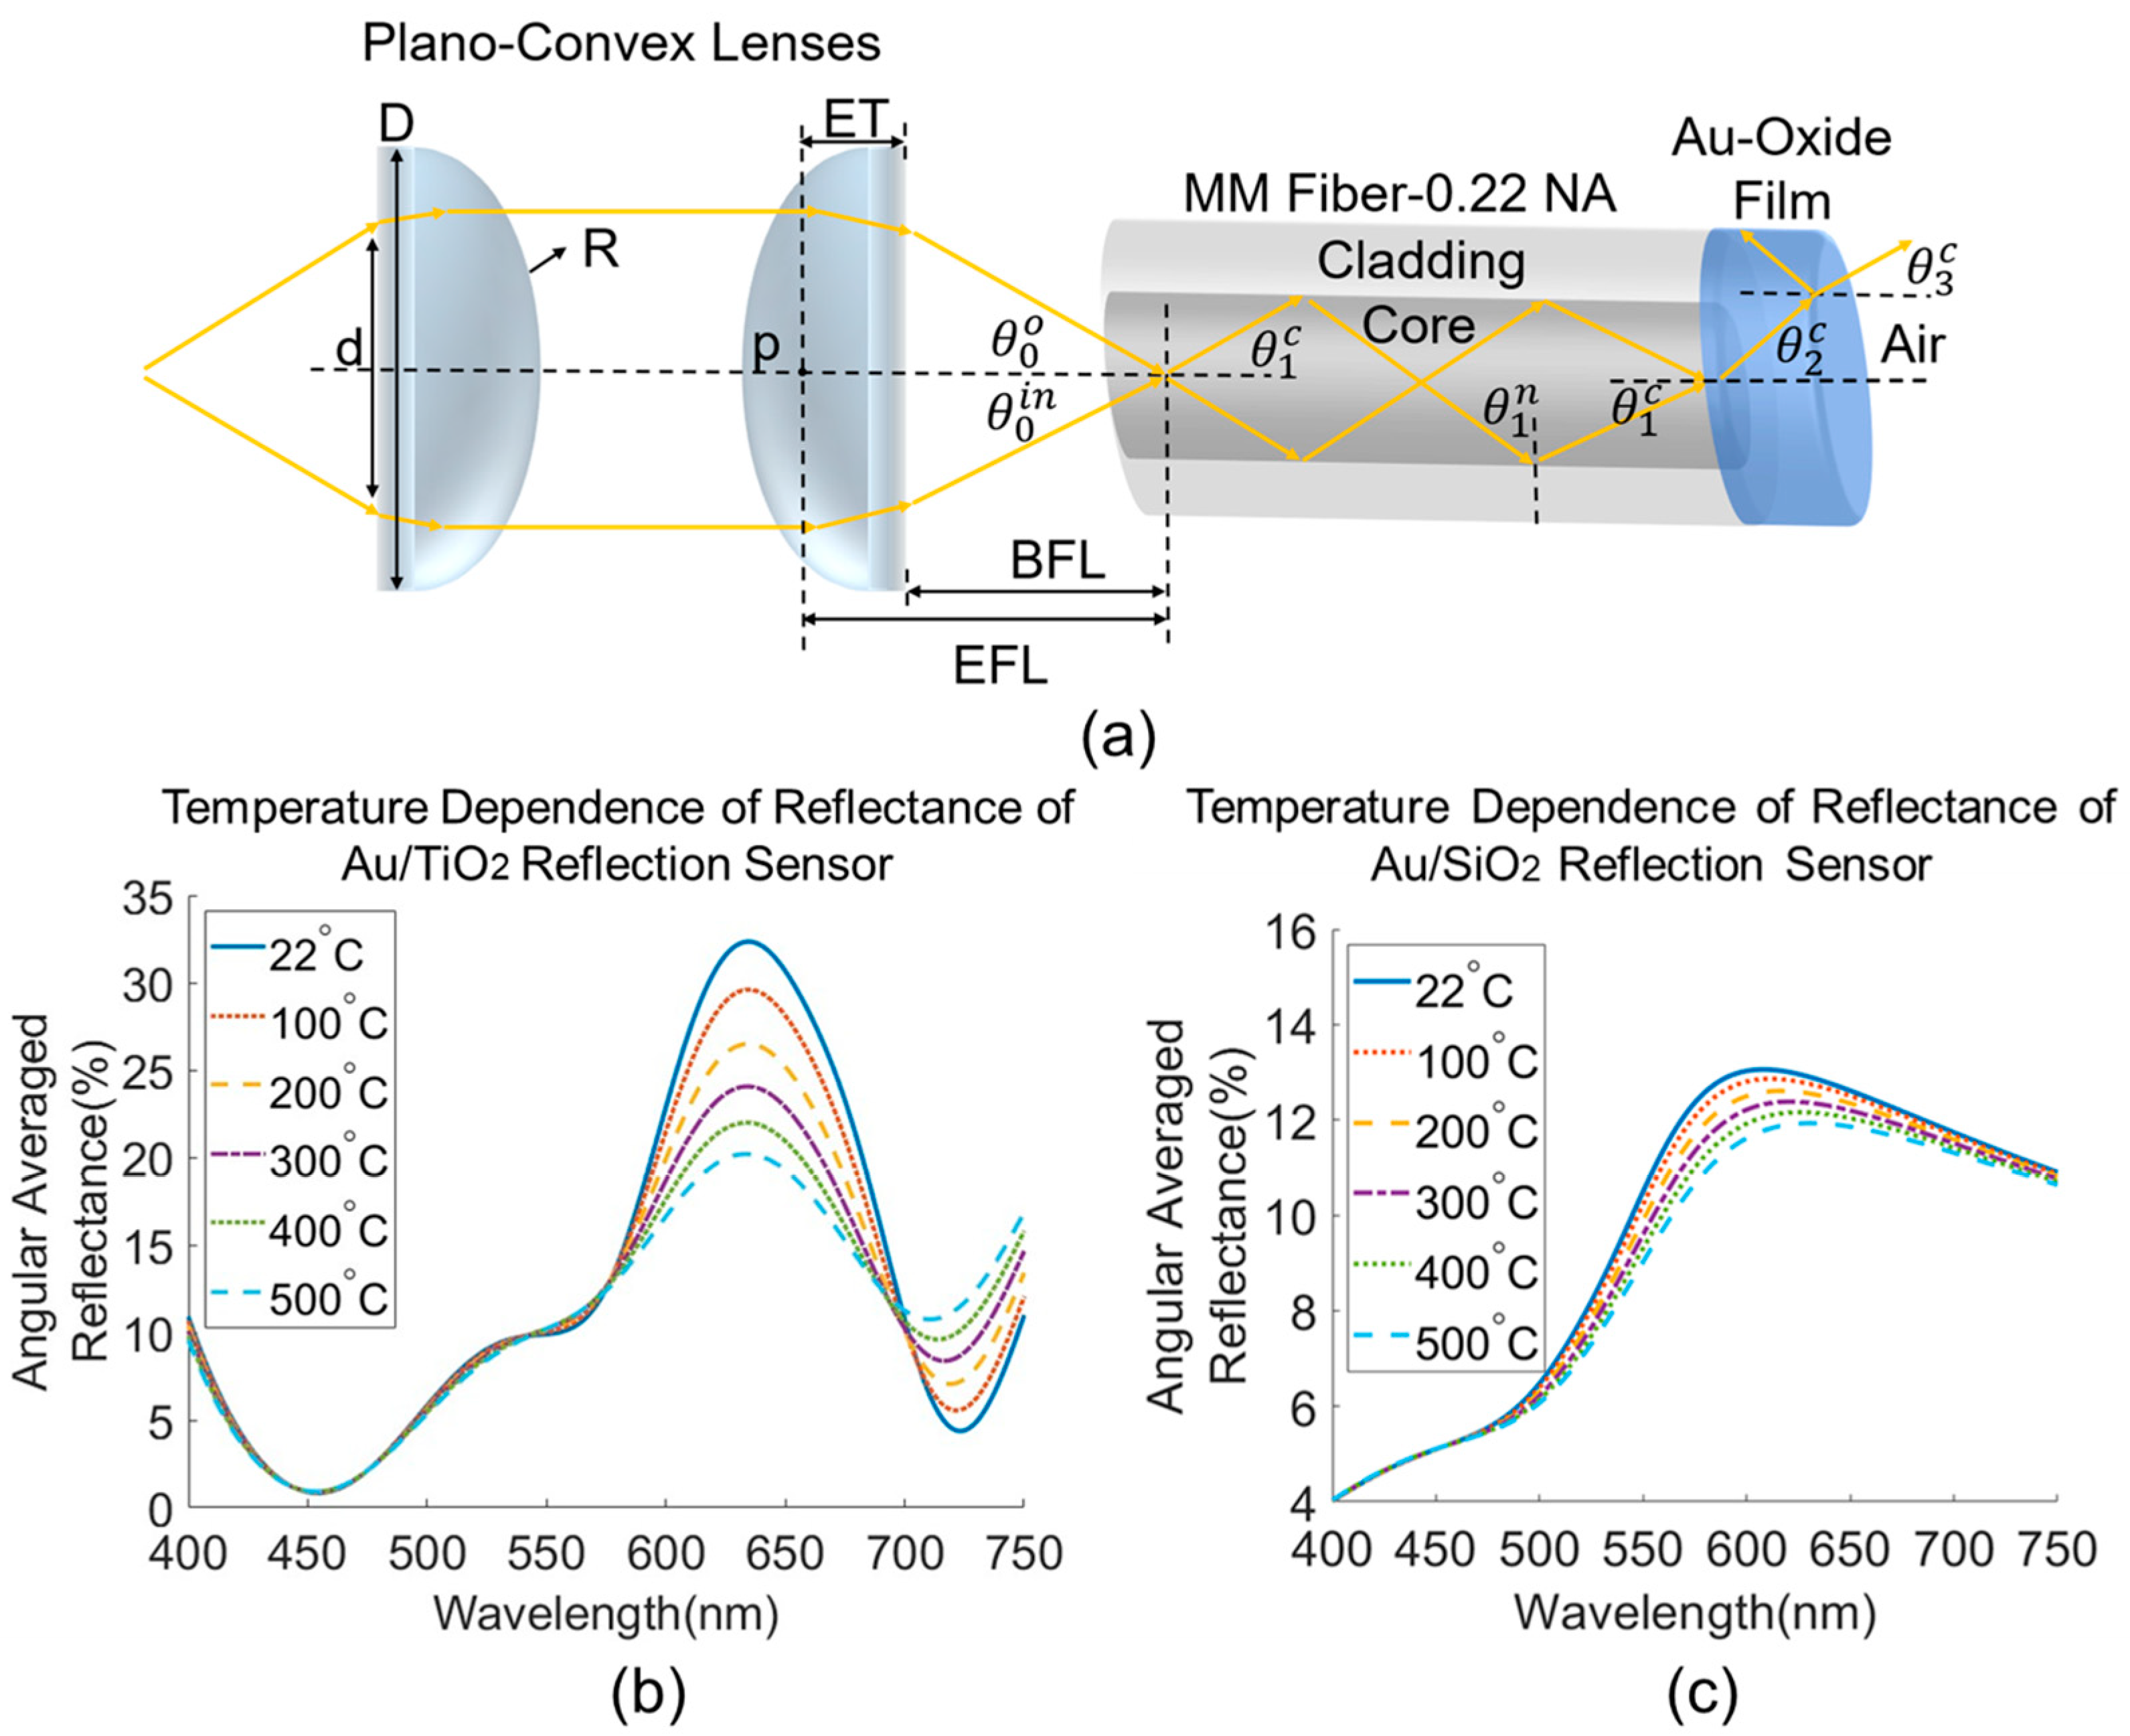
3.2. Optical Waveguide Modeling

Figure 9a illustrates the optical waveguide model of a fiber optic reflection sensor. The first step of the model assumes a broadband light source that launches through a pair of plano-convex lenses. These lenses are assumed to be made of MgF2-coated N-BK7 glass with a real index of 1.5 and a diameter, D, of 12.7 mm. Lenses are assumed to be coupled with the lead fiber in the air. The numerical aperture (NA) of a lens is a function of its refractive index, radius of curvature, R, and the emission diameter, d, of the light source. The effective focal length (EFL) of the lens is defined by the lensmaker’s equation [41], and the back focal length (BFL) can be found by assuming a constant value for the edge thickness (ET) of the lens. ET is the thickness of the lens to a principal plane, p, where the light mode bends due to refraction in the lens. By requiring that the NA of the MM fiber, 0.22, equals to that of the plano-convex lenses, the emission diameter of the source can be determined to form a trigonometric relation with BFL. This derives and confines the incident angle into the fiber to a specific range, which simulates core modes transmitting through the lead fiber of the sensor. A multilayered media can be envisioned when the core modes enter the lead fiber, creating three interfaces: air-core, core-film, and film-air. Each interface is conditionally implemented by Snell’s law and critical angle calculation if total internal reflection can be satisfied. This determines the refraction angle of every opposing medium. For simplicity, we assume the optical loss due to core-cladding mode coupling is negligible and each core mode is propagating independently throughout the process. From light source to detector, the roundtrip propagation of a complete optical signal can be simulated at three steps: forward propagation at the entrance fiber, propagation and multi-reflection within the nanocomposite sensor film, and backward propagation at the exit fiber connected to the detector. The final total reflectance of the fiber sensor received by the detector is estimated as:
R t o t a l = T f · R f i l m · T b
where T f and T b are transmittances calculated at the air/core interfaces at the entrance and exit, respectively. Assuming isotropic and linear wave optics, this is implemented using simple Fresnel transmission and reflection coefficients to derive the corresponding transmittance and reflectance. However, R f i l m , the effective reflectance of the silica core/film/air media, entails a careful consideration because of the finite thickness of thin solid films falling into the scale of the coherence length of propagating light wave. This condition is described in (10), where l is the thin film thickness, λ the incident wavelength, n 2 the complex optical constants of the film, λ the spectral bandwidth of the light source [42].
l λ 2 2 π n 2 λ
t = t 12 t 23 e i φ 1 + r 12 r 23 e 2 i φ
r = r 12 + r 23 e 2 i φ 1 + r 12 r 23 e 2 i φ
φ ( T ) = 2 π l n 2 c o s θ 2 c λ [ 1 l d l d T + 1 n 2 d n 2 d T ]
R f i l m = | r | 2
T f i l m = n 3 c o s θ 3 c n 1 c o s θ 1 c | t | 2
The multiple internal reflections within the film contribute to both the effective transmission coefficient and reflection coefficient of the thin film in (11) and (12), respectively. They are also called the expressions of Airy’s summation [43], which consist of: t 12 and r 12 ,   the simple Fresnel transmission and reflection coefficients at the core/film interface; and t 23 and r 23 ,   those at the film/air interface illustrated in Figure 9a. The resulting phase gain, φ , from the thin film propagation is described in (13) as a function of temperature. This temperature dependence comes from both the thermo-optic effect ( d n 2 d T ) of the complex optical constants described in the previous section and the thermal expansion ( d l d T ) of the thickness of the film [27]. The thermal expansion coefficient used for TiO2 is 7.14 × 10⁻⁶/K [27], and 2.4 × 10⁻⁷/K for SiO2 [44]. The baseline thicknesses of the simulated Au-oxide nanocomposite films are assumed to be 85 nm at room temperature, which are approximately the same as the film fabricated in the experimental recipe and measured in the subsequent sample characterization. S-polarized and p-polarized waves are both considered in deriving the simple Fresnel coefficients, which gives two sets of Airy’s effective transmission and reflection coefficients for later being averaged in (14) to obtain the effective reflectance and in (15) for effective transmittance. The simulated reflection fiber sensor absolute reflectance in response to temperature is shown in Figure 9b,c for Au/TiO2 and Au/SiO2 nanocomposite functional coatings. The Au/TiO2 sensor shows a higher temperature response in the relevant LSPR wavelength region than the Au/SiO2 sensor. This is a direct result of the refractive index of the polycrystalline TiO2 being 1.5 to 2.5 times the index of amorphous SiO2 in the visible range. In theory, the Au/TiO2 is thus expected to exhibit a higher temperature sensitivity than AuSiO2 in reflectance of a reflection configured fiber optic sensor at the same Au nanoparticle loading.

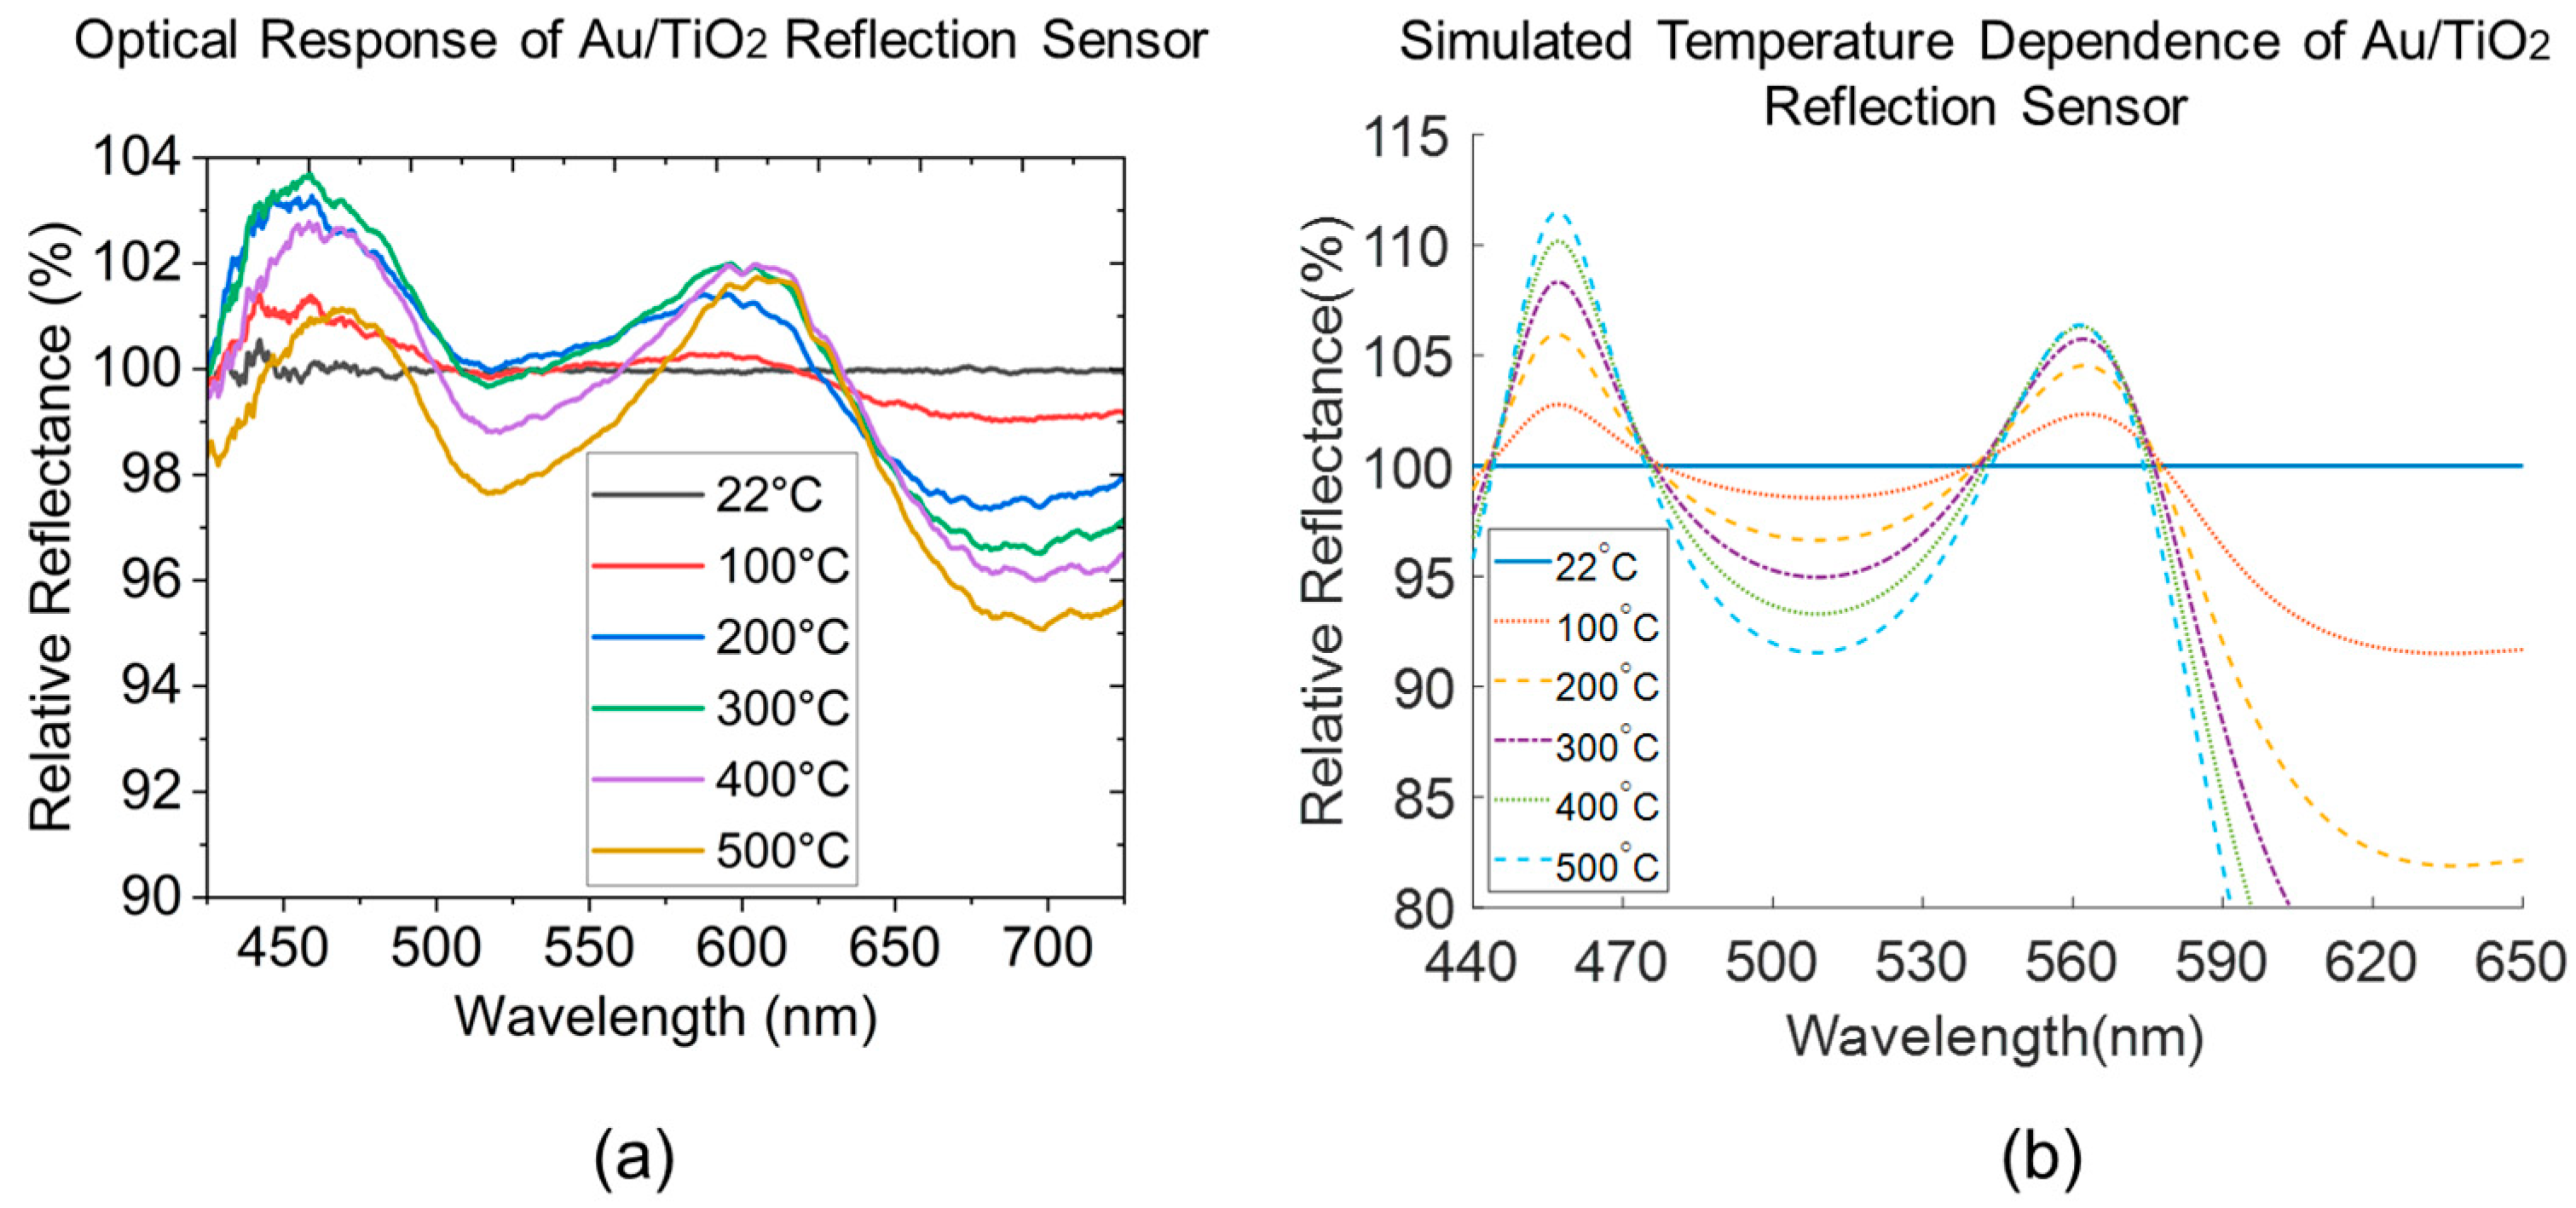
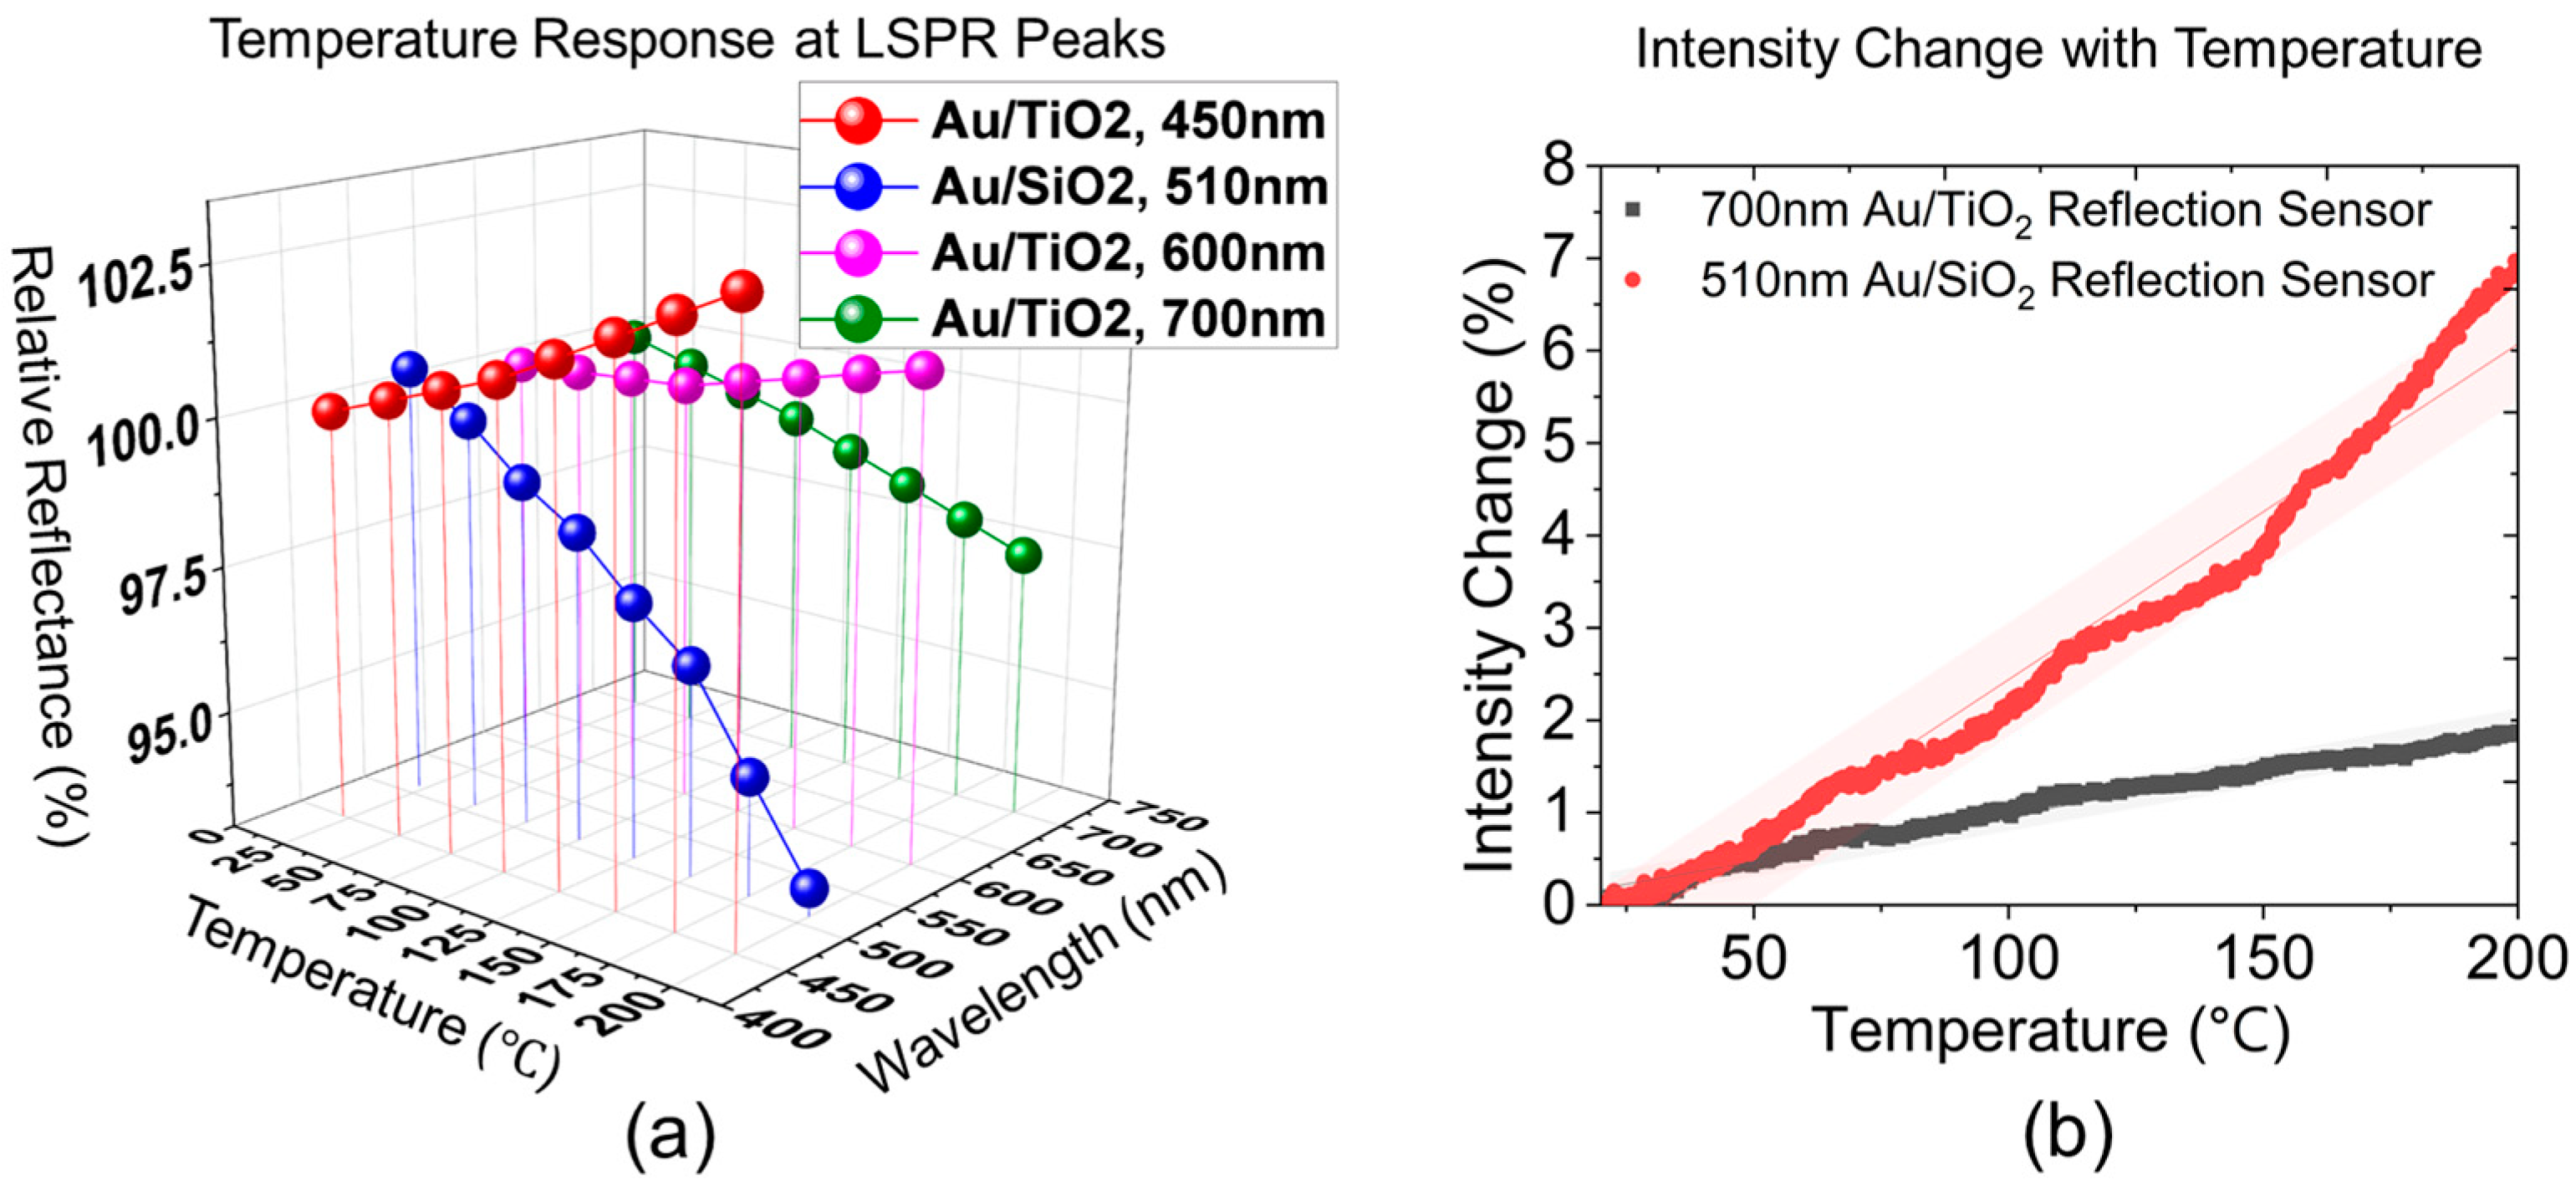
4. Results and Discussion

The temperature sensing experiments are conducted in real-time using the furnace setup described in Section 2.2. to compare the plasmonic-induced temperature sensitivity of the two reflective nanocomposites and validate against their theoretical performance modeling results. To simulate the spectral baseline of the interrogation software (OceanView 2.0), the comparative modeling results are completed by assuming that 100% of the absolute reflectance of the Au–Oxide reflection sensor modeled at 22 °C is served as the baseline reference. The subsequent temperature-dependent spectra at all elevated temperatures are obtained by dividing the modeled absolute reflectance at those temperatures by the baseline and normalized with a value of 100% to complete the relative reflectance. Figure 10a shows the experimental results of an Au/TiO2 reflection sensor changing as the environmental temperature increases from room temperature to 500 °C. All spectral convex features within the visible region are captured and confirmed experimentally when compared to their simulation counterpart in Figure 10b. The characteristics in the visible range are dominated by the LSPR absorption of Au NP inclusion, with the one from 600 nm and onwards being dominating, which can be observed from the absolute reflectance spectrum in Figure 9b. As for the absorption band before 600 nm, the convex-upward band at 500 to 550 nm decreases in intensity with temperature. The convex-downwards feature at 450 to 500 nm and 550 to 600 nm are shown to be increasing with temperature in the modeling but is observed to first increase then drop in relative reflectance at higher temperatures due to the spectral damping effect from the 500 to 550 nm band being in the immediate vicinity. Although the experimental results validate the spectral feature locations for the Au/TiO2 sensor, the peak change in reflection intensity is lower than the model in theory would predict. We hypothesize that these intensity deviations derive from the discrepancies between the assumed uniform film thickness, neglected TiO2/air surface and TiO2/fiber interface roughness, average particle size and spherical shape of Au NPs in the model and those formed in the fabricated sample, as well as the polycrystalline microstructure of the Au/TiO2 sample. However, the Au/SiO2 shows good agreement both in terms of the intensity change and the major LSPR peak, as shown in Figure 11a,b. At low temperatures, 22 to 200 °C, the Au/SiO2 shows a higher approximately linear response with a temperature sensitivity of 0.04%/°C, which is the temperature range of interest for electric power equipment thermal health monitoring. The convex-upward band at 500 to 600 nm has an accuracy of relative reflectance intensity change within ±3% when being benchmarked against the simulated intensity change in Figure 11b. Both sensing layers in the reflection fiber optic configuration show potential for temperature sensing in normal operational temperature rises in electrical power equipment, as well as high temperature monitoring in applications under extreme conditions. This could be relevant for a wide range of other harsh environment applications including aviation aerospace, power generation, and industrial manufacturing processes.
Figure 12a presents a detailed analysis of the optical responses of different characteristic peaks of LSPR under normal operation temperatures ranging from room temperature to 200 °C. The analysis shows both ascending and descending trends at different peaks for the Au/TiO2 sensor. Among these peaks, the 700 nm peak exhibits the most stable response over an extended range, whereas the 450 nm peak demonstrates better sensitivity at temperatures below 200 °C. Moreover, the multiple LSPR features presented by Au/TiO2 reflection spectra offer a unique potential of decoding simultaneous multivariate sensing beyond the temperature measurand alone, as shown in prior work [21,45]. Sensitivities of two sensing materials are recorded in real time in Figure 12b, where the Au/TiO2 sensor is interrogated at 700 nm and the Au/SiO2 sensor at 510 nm. The percentage changes in relative reflectance as a function of temperature are plotted to build a comparative case. At the respective interrogation wavelengths, the Au/SiO2 sensor yielded a higher averaged temperature sensitivity of 0.025%/°C than that of Au/TiO2 at around 0.01%/°C, at respective wavelengths. The response linearity of the two sensors can be represented by the R 2 value of the linear fit, which is 0.97428 and 0.97367 for Au/TiO2 and Au/SiO2, respectively. The observed quantitative experimental results are impacted by experimental details of the film morphologies and microstructure, which is expected to explain deviations from the quasistatic modeling approximation for Au/TiO2.
To better understand the film microstructure, post-experimental fiber samples of the Au/TiO2 sensors are studied with TEM (Hitachi High-Tech, Toronto, Ontario, Canada) images of a 5-μm piece of the film using FIB-based lift-out method. The actual film thickness on the fiber tip is verified by the cross-sectional TEM image in Figure 13a, showing that the Au/TiO2 film thickness is around 80 to 85 nm. The crystalline phases of the post-sensing film are confirmed with the high-resolution TEM (HRTEM) image of the Au nanoparticle and TiO2 presented in Figure 13b. Diffraction patterns of crystals can be seen after performing Fast-Fourier transform (FFT) on the HRTEM image. Patterns in Figure 13c, obtained along the [ 1 ¯ 11 ] zone axis, confirms the Face-Centered-Cubic (FCC) phase of the Au nanoparticle, whereas TiO2 is confirmed to be in a stable rutile phase, as shown in Figure 13d, along the [ 211 ] zone axis. In addition, this agrees with the X-ray diffraction (XRD) patterns conducted on nanocomposite thin film planar samples, shown in Figure 13e. XRD experiment is performed at grazing incidence with an Empyrean X-ray Diffractometer (Malvern Panalytical, Malvern, UK) using a cobalt source. A close comparison between the experimental XRD patterns and the standard XRD patterns of Au and TiO2 shows that the Au/TiO2 nanocomposite calcined at 900 °C is rutile phase dominated and showing the major Au FCC diffraction peaks.

5. Conclusions

We have experimentally confirmed the developed LSPR optical waveguide model for two exemplar Au-incorporated nanocomposite thin films fabricated in a simple reflection fiber probe configuration by an optical circulator. Physics-based optical waveguide modeling has proved to be an essential tool to benchmark the optical sensing performance for fiber optic sensors using functional material cladding. Both Au/TiO2 and Au/SiO2 nanocomposite sensors exhibit reasonable agreement, with Au/SiO2 being the more readily validated one in practice and therefore appears to have greater potential sensitivity for use as a reflection fiber probe for point temperature sensing in electrical power facilities. Au/TiO2, on the other hand, shows potential in multi-parameter sensing by identifying different representative LSPR absorption bands in the reflection spectrum. This can be particularly important for challenging environments where both temperature-rise and off-gassing are convoluted events that indicate imminent failures. With the experimental demonstrations up to 500 °C and potential for even higher temperatures, both sensing materials also show capability to be deployed in extreme temperatures and harsh environments for relevant applications. From a practical deployment perspective, the concept of low-cost interrogators based on a simple dual-stage TIA circuit with customized gain and filtering for intensity-based fiber temperature sensors has been demonstrated, with an additional advantage of wireless signal transmission to prevent hazardous high-voltage contacts during field equipment monitoring. The reflection configuration of the sensor probe itself also provides a geometrical advantage for the ease of installation. Future exploration in this topic can be expanded to further optimize both the temperature sensitivity and accuracy by incorporating bimetallic nanoparticles in stable oxide matrices. The temperature-dependent electron and phonon scattering based on plasmon coupling of different noble metals can provide more control parameters for the tunability of functional thin-film-based fiber optic temperature sensors. In addition, bivariate temperature and gas sensing can be studied using metal NP-incorporated thermo-optic dielectrics with high selectivity towards targeted gas species.

Author Contributions

Conceptualization, Y.-D.S. and P.R.O.; methodology, Y.-D.S. and C.N.L.; analysis, Y.-D.S. and Y.W.; writing—original draft preparation, Y.-D.S.; writing—review and editing, P.R.O.; supervision, P.R.O.; funding acquisition, P.R.O. All authors have read and agreed to the published version of the manuscript.

Funding

This material is based upon work supported by the U.S. Department of Energy’s Office of Energy Efficiency and Renewable Energy (EERE) under the Solar Energy Technologies Office Award Number DE-EE0009632. This work is also supported by the Grid Modernization Lab Consortium, a partnership between the Department of Energy and Lawrence Livermore National Laboratories under the contract B643144 and B651143.

Institutional Review Board Statement

Not applicable.

Informed Consent Statement

Not applicable.

Data Availability Statement

The data presented in this study are available within the article.

Conflicts of Interest

This report was prepared as an account of work sponsored by an agency of the United States Government. Neither the United States Government nor any agency thereof, nor any of their employees, makes any warranty, express or implied, or assumes any legal liability or responsibility for the accuracy, completeness, or usefulness of any information, apparatus, product, or process disclosed, or represents that its use would not infringe privately owned rights. Reference herein to any specific commercial product, process, or service by trade name, trademark, manufacturer, or otherwise does not necessarily constitute or imply its endorsement, recommendation, or favoring by the United States Government or any agency thereof. The views and opinions of authors expressed herein do not necessarily state or reflect those of the United States Government or any agency thereof.

References

  1. Pan, T.; Cao, W.; Wang, M. TiO2 Thin Film Temperature Sensor Monitored by Smartphone. Opt. Fiber Technol. 2018, 45, 359–362. [Google Scholar] [CrossRef]
  2. Algorri, J.F.; García-Cámara, B.; García-García, A.; Urruchi, V.; Sánchez-Pena, J.M. Theoretical Modeling of a Localized Surface Plasmon Resonance (LSPR) Based Fiber Optic Temperature Sensor. In Proceedings of the 23rd International Conference on Optical Fibre Sensors, Santander, Spain, 2–6 June 2014; SPIE: Bellingham, WA, USA, 2014; Volume 9157, pp. 453–456. [Google Scholar]
  3. Zhao, Y.; Deng, Z.-Q.; Hu, H.-F. Fiber-Optic SPR Sensor for Temperature Measurement. IEEE Trans. Instrum. Meas. 2015, 64, 3099–3104. [Google Scholar] [CrossRef]
  4. Velázquez-González, J.S.; Monzón-Hernández, D.; Moreno-Hernández, D.; Martínez-Piñón, F.; Hernández-Romano, I. Simultaneous Measurement of Refractive Index and Temperature Using a SPR-Based Fiber Optic Sensor. Sens. Actuators B Chem. 2017, 242, 912–920. [Google Scholar] [CrossRef]
  5. Huang, Q.; Wang, Y.; Zhu, W.; Lai, T.; Peng, J.; Lyu, D.; Guo, D.; Yuan, Y.; Lewis, E.; Yang, M. Graphene–Gold–Au@Ag NPs-PDMS Films Coated Fiber Optic for Refractive Index and Temperature Sensing. IEEE Photonics Technol. Lett. 2019, 31, 1205–1208. [Google Scholar] [CrossRef]
  6. Lu, L.; Lu, L.; Jiang, Z.; Hu, Y.; Zhou, H.; Liu, G.; Liu, G.; Chen, Y.; Chen, Y.; Luo, Y.; et al. A Portable Optical Fiber SPR Temperature Sensor Based on a Smart-Phone. Opt. Express 2019, 27, 25420–25427. [Google Scholar] [CrossRef]
  7. Zhang, R.; Pu, S.; Li, X. Gold-Film-Thickness Dependent SPR Refractive Index and Temperature Sensing with Hetero-Core Optical Fiber Structure. Sensors 2019, 19, 4345. [Google Scholar] [CrossRef] [PubMed]
  8. Liu, Y.; Liang, B.; Zhang, X.; Hu, N.; Li, K.; Chiavaioli, F.; Gui, X.; Guo, T. Plasmonic Fiber-Optic Photothermal Anemometers With Carbon Nanotube Coatings. J. Light. Technol. 2019, 37, 3373–3380. [Google Scholar] [CrossRef]
  9. Lobry, M.; Fasseaux, H.; Loyez, M.; Chah, K.; Goormaghtigh, E.; Wattiez, R.; Chiavaioli, F.; Caucheteur, C. Plasmonic Fiber Grating Biosensors Demodulated Through Spectral Envelopes Intersection. J. Light. Technol. 2021, 39, 7288–7295. [Google Scholar] [CrossRef]
  10. Borges, J.; Kubart, T.; Kumar, S.; Leifer, K.; Rodrigues, M.S.; Duarte, N.; Martins, B.; Dias, J.P.; Cavaleiro, A.; Vaz, F. Microstructural Evolution of Au/TiO2 Nanocomposite Films: The Influence of Au Concentration and Thermal Annealing. Thin Solid Film. 2015, 580, 77–88. [Google Scholar] [CrossRef]
  11. Rodrigues, M.S.; Costa, D.; Domingues, R.P.; Apreutesei, M.; Pedrosa, P.; Martin, N.; Correlo, V.M.; Reis, R.L.; Alves, E.; Barradas, N.P.; et al. Optimization of Nanocomposite Au/TiO2 Thin Films towards LSPR Optical-Sensing. Appl. Surf. Sci. 2018, 438, 74–83. [Google Scholar] [CrossRef]
  12. Proença, M.; Borges, J.; Rodrigues, M.S.; Meira, D.I.; Sampaio, P.; Dias, J.P.; Pedrosa, P.; Martin, N.; Bundaleski, N.; Teodoro, O.M.N.D.; et al. Nanocomposite Thin Films Based on Au-Ag Nanoparticles Embedded in a CuO Matrix for Localized Surface Plasmon Resonance Sensing. Appl. Surf. Sci. 2019, 484, 152–168. [Google Scholar] [CrossRef]
  13. Pereira-Silva, P.; Borges, J.; Rodrigues, M.S.; Oliveira, J.C.; Alves, E.; Barradas, N.P.; Dias, J.P.; Cavaleiro, A.; Vaz, F. Nanocomposite Au-ZnO Thin Films: Influence of Gold Concentration and Thermal Annealing on the Microstructure and Plasmonic Response. Surf. Coat. Technol. 2020, 385, 125379. [Google Scholar] [CrossRef]
  14. Rodrigues, M.S.; Borges, J.; Proença, M.; Pedrosa, P.; Martin, N.; Romanyuk, K.; Kholkin, A.L.; Vaz, F. Nanoplasmonic Response of Porous Au-TiO2 Thin Films Prepared by Oblique Angle Deposition. Nanotechnology 2019, 30, 225701. [Google Scholar] [CrossRef] [PubMed]
  15. McMahon, J.M.; Gray, S.K.; Schatz, G.C. 3.06—Surface Nanophotonics Theory. In Comprehensive Nanoscience and Technology; Andrews, D.L., Scholes, G.D., Wiederrecht, G.P., Eds.; Academic Press: Amsterdam, The Netherlands, 2011; pp. 187–208. ISBN 978-0-12-374396-1. [Google Scholar]
  16. Ohodnicki, P.R.; Wang, C.; Natesakhawat, S.; Baltrus, J.P.; Brown, T.D. In-Situ and Ex-Situ Characterization of TiO2 and Au Nanoparticle Incorporated TiO2 Thin Films for Optical Gas Sensing at Extreme Temperatures. J. Appl. Phys. 2012, 111, 064320. [Google Scholar] [CrossRef]
  17. Costa, D.; Rodrigues, M.S.; Roiban, L.; Aouine, M.; Epicier, T.; Steyer, P.; Alves, E.; Barradas, N.P.; Borges, J.; Vaz, F. In-Situ Annealing Transmission Electron Microscopy of Plasmonic Thin Films Composed of Bimetallic Au–Ag Nanoparticles Dispersed in a TiO2 Matrix. Vacuum 2021, 193, 110511. [Google Scholar] [CrossRef]
  18. Ohodnicki, P.R., Jr.; Brown, T.D.; Buric, M.P.; Baltrus, J.P.; Chorpening, B. Plasmon Resonance at Extreme Temperatures in Sputtered Au Nanoparticle Incorporated TiO2 Films. In Proceedings of the Nanophotonic Materials IX, San Diego, CA, USA, 12–16 August 2012; International Society for Optics and Photonics: Bellingham, WA, USA, 2012; Volume 8456, p. 845608. [Google Scholar]
  19. Ohodnicki, P.R.; Buric, M.P.; Brown, T.D.; Matranga, C.; Wang, C.; Baltrus, J.; Andio, M. Plasmonic Nanocomposite Thin Film Enabled Fiber Optic Sensors for Simultaneous Gas and Temperature Sensing at Extreme Temperatures. Nanoscale 2013, 5, 9030–9039. [Google Scholar] [CrossRef]
  20. Buric, M.P.; Ohodnicki, P.; Chorpening, B. Theoretical and Experimental Investigation of Evanescent-Wave Absorption Sensors for Extreme Temperature Applications. In Proceedings of the Nanoengineering: Fabrication, Properties, Optics, and Devices X, San Diego, CA, USA, 25–29 August 2013; International Society for Optics and Photonics: Bellingham, WA, USA, 2013; Volume 8816, p. 88160N. [Google Scholar]
  21. Sun, C.; Lu, P.; Wright, R.; Ohodnicki, P.R. Low-Cost Fiber Optic Sensor Array for Simultaneous Detection of Hydrogen and Temperature. In Proceedings of the Fiber Optic Sensors and Applications XV, Orlando, FL, USA, 15–19 April 2018; International Society for Optics and Photonics: Bellingham, WA, USA, 2018; Volume 10654, p. 1065405. [Google Scholar]
  22. Kajikawa, K. Application 3—Sensing based on localized surface plasmon resonance in metallic nanoparticles. In Nanoparticle Technology Handbook; Hosokawa, M., Nogi, K., Naito, M., Yokoyama, T., Eds.; Elsevier: Amsterdam, The Netherlands, 2008; pp. 432–434. ISBN 978-0-444-53122-3. [Google Scholar]
  23. Mayer, K.M.; Hafner, J.H. Localized Surface Plasmon Resonance Sensors. Chem. Rev. 2011, 111, 3828–3857. [Google Scholar] [CrossRef]
  24. Roh, S.; Chung, T.; Lee, B. Overview of the Characteristics of Micro- and Nano-Structured Surface Plasmon Resonance Sensors. Sensors 2011, 11, 1565–1588. [Google Scholar] [CrossRef]
  25. Chiavaioli, F.; Gouveia, C.A.J.; Jorge, P.A.S.; Baldini, F. Towards a Uniform Metrological Assessment of Grating-Based Optical Fiber Sensors: From Refractometers to Biosensors. Biosensors 2017, 7, 23. [Google Scholar] [CrossRef]
  26. Badar, M.; Su, Y.-D.; Lu, P.; Lu, F.; Buric, M.P.; Ohodnicki, P.R. Low-Cost Optical Fiber Based Temperature Sensor for Real-Time Health Monitoring of Power Transformers. In Proceedings of the Fiber Optic Sensors and Applications XVII, Online Only. FL, USA, 12–17 April 2021; Sanders, G.A., Lieberman, R.A., Scheel, I.U., Eds.; SPIE: Bellingham, WA, USA, 2021; p. 14. [Google Scholar]
  27. Inci, M.N.; Barton, J.S.; Jones, J.D.C. A Fibre-Optic Thermometric Sensor Based on the Thermo-Optic Effect of Titanium Dioxide Coatings. Opt. Laser Technol. 1997, 29, 121–124. [Google Scholar] [CrossRef]
  28. Kasap, S.O. Principles of Electronic Materials and Devices; McGraw-Hill: New York, NY, USA, 2006; ISBN 978-0-07-295791-4. [Google Scholar]
  29. Su, Y.-D.; Preger, Y.; Burroughs, H.; Sun, C.; Ohodnicki, P. Fiber Optic Sensing Technologies for Battery Management Systems and Energy Storage Applications. Sensors 2021, 21, 1397. [Google Scholar] [CrossRef]
  30. Raghavan, A.; Kiesel, P.; Lochbaum, A.; Saha, B.; Sommer, L.W.; Staudt, T. Battery Management Based on Internal Optical Sensing. U.S. Patent 9,553,465, 24 January 2017. [Google Scholar]
  31. Su, Y.-D.; Athas, J.; Lalam, N.; Grainger, B.; Ohodnicki, P. Low-Cost Plasmonic Fiber Probe and Wireless Interrogation for Electric Power Equipment Temperature Sensing. In Proceedings of the Fiber Optic Sensors and Applications XVIII, Orlando, FL, USA, 6–12 June 2022; SPIE: Bellingham, WA, USA, 2022; Volume 12105, pp. 74–85. [Google Scholar]
  32. Khurana, K.; Jaggi, N. Localized Surface Plasmonic Properties of Au and Ag Nanoparticles for Sensors: A Review. Plasmonics 2021, 16, 981–999. [Google Scholar] [CrossRef]
  33. Kosuda, K.M.; Bingham, J.M.; Wustholz, K.L.; Van Duyne, R.P.; Groarke, R.J. 4.06—Nanostructures and Surface-Enhanced Raman Spectroscopy. In Comprehensive Nanoscience and Nanotechnology, 2nd ed.; Andrews, D.L., Lipson, R.H., Nann, T., Eds.; Academic Press: Oxford, UK, 2016; pp. 117–152. ISBN 978-0-12-812296-9. [Google Scholar]
  34. Carter, B. Designing Gain and Offset in Thirty Seconds; Texas Instruments: Dallas, TX, USA, 2022. [Google Scholar]
  35. Etchegoin, P.; Kircher, J.; Cardona, M. Elasto-Optical Constants of Si. Phys. Rev. B 1993, 47, 10292–10303. [Google Scholar] [CrossRef] [PubMed]
  36. Etchegoin, P.G.; Le Ru, E.C.; Meyer, M. An Analytic Model for the Optical Properties of Gold. J. Chem. Phys. 2006, 125, 164705. [Google Scholar] [CrossRef] [PubMed]
  37. Sharma, A.K.; Gupta, B.D. Theoretical Model of a Fiber Optic Remote Sensor Based on Surface Plasmon Resonance for Temperature Detection. Opt. Fiber Technol. 2006, 12, 87–100. [Google Scholar] [CrossRef]
  38. Lawrence, W.E. Electron-Electron Scattering in the Low-Temperature Resistivity of the Noble Metals. Phys. Rev. B 1976, 13, 5316–5319. [Google Scholar] [CrossRef]
  39. Holstein, T. Optical and Infrared Volume Absorptivity of Metals. Phys. Rev. 1954, 96, 535–536. [Google Scholar] [CrossRef]
  40. Rodrigues, M.S.; Borges, J.; Gabor, C.; Munteanu, D.; Apreutesei, M.; Steyer, P.; Lopes, C.; Pedrosa, P.; Alves, E.; Barradas, N.P.; et al. Functional Behaviour of TiO2 Films Doped with Noble Metals. Surf. Eng. 2016, 32, 554–561. [Google Scholar] [CrossRef]
  41. Greivenkamp, J.E. Field Guide to Geometrical Optics; SPIE: Bellingham, WA, USA, 2004; ISBN 978-0-8194-5294-8. [Google Scholar]
  42. Stenzel, O. The Physics of Thin Film Optical Spectra: An Introduction; Springer Series in Surface Sciences; Springer International Publishing: Cham, Switzerland, 2016; Volume 44, ISBN 978-3-319-21601-0. [Google Scholar]
  43. Yeh, P. Optical Waves in Layered Media; Wiley: Hoboken, NJ, USA, 2005; ISBN 978-0-471-73192-4. [Google Scholar]
  44. Tsou, C.; Huang, Y.-S.; Li, H.-C.; Lai, T.-H. Determination of Thermal Expansion Coefficient of Thermal Oxide. Sens. Mater. 2005, 17, 11. [Google Scholar]
  45. Joy, N.A.; Rogers, P.H.; Nandasiri, M.I.; Thevuthasan, S.; Carpenter, M.A. Plasmonic-Based Sensing Using an Array of Au–Metal Oxide Thin Films. Anal. Chem. 2012, 84, 10437–10444. [Google Scholar] [CrossRef]
Figure 1. Schematic of example multilayered film stack to achieve uniformly distributed Au NP in the TiO2 matrix after calcination.
Sensors 23 04165 g001
Figure 2. Low-vacuum backscattered-electron SEM images of (a) Au/TiO2 and (b) AuSiO2 of a fiber sensor tip. Uniform Au particle distribution at the surface of (c) TiO2 and (d) SiO2. Spherical inclusions of Au NP in (e) TiO2 and (f) SiO2 at the nanoscale, with SiO2 showing more diverse shapes of elongated Au particles. Au NP size distribution in (g) TiO2 and (h) SiO2 matrix.
Sensors 23 04165 g002
Figure 3. Spectrophotometry of (a) Au/TiO2 and (b) Au/SiO2 nanocomposites on planar quartz substrates showing representative LSPR absorption bands in the visible range.
Sensors 23 04165 g003
Figure 4. Optical circulator configuration of reflection-based sensor probe with fiber tip functionalized by Au-incorporated nanocomposite that shows LSPR absorption features. Conceptually, the purple arrows indicate the coherent oscillation of free electrons in Au NPs with charge separation, while the blue surface represents the oxide matrix surrounding the Au NPs.
Sensors 23 04165 g004
Figure 5. Experimental setup of plasmonic sensor probe temperature sensing.
Sensors 23 04165 g005
Figure 6. (a) Circuit diagram of the dual-stage transimpedance amplifier. (b) Reversibility of low-cost interrogator voltage signal tailored to the baseline reflectance of the reflective fiber sensor.
Sensors 23 04165 g006
Figure 7. Entire setup of the low-cost and wireless interrogator circuit.
Sensors 23 04165 g007
Figure 8. (a) Optical constant model, (b) associated real and imaginary dielectric constants of Au nanoparticles at room temperature. Effective optical constant model of (c) Au/TiO2 nanocomposite, and (d) Au/SiO2 nanocomposite simulated at room temperature.
Sensors 23 04165 g008
Figure 9. (a) Graphical illustration of optical waveguide model of Au/Oxide nanocomposite-coated sensor in reflection geometry, assuming free space coupling of plano-convex lenses. Simulated temperature dependence of the absolute reflectance averaged at a range of incident angles for (b) Au/TiO2 sensor and (c) Au/SiO2 sensor.
Sensors 23 04165 g009
Figure 10. (a) Experimental results of the optical response of an Au/TiO2 plasmonic reflection sensor under temperature sensing test. (b) Simulated optical response to temperature of the same using the optical waveguide model.
Sensors 23 04165 g010
Figure 11. (a) Experimental results of the optical response of an Au/SiO2 plasmonic reflection sensor under temperature sensing test. (b) Simulated optical response to temperature of the same using the optical waveguide model.
Sensors 23 04165 g011
Figure 12. (a) Temperature responses demodulated at individual LSPR peaks of Au/TiO2 sensor compared to the dominant LSPR peak (510 nm) of Au/SiO2 sensor. (b) Percent change in relative reflectance of Au/TiO2 at 700 nm compared to Au/SiO2 at 510 nm as a function of temperature, with linear fit to the data within 95% prediction band.
Sensors 23 04165 g012
Figure 13. (a) Cross-sectional TEM image of post-temperature-sensing Au/TiO2 film, with Au NP embedded in the TiO2 matrix. (b) HRTEM image of a representative Au nanoparticle at the interface between the silica fiber tip and TiO2. (c) FFT pattern obtained from the Au nanoparticle in (b) along the zone axis [ 1 ¯ 11 ] . (d) FFT pattern of TiO2 in the surrounding region of the Au nanoparticle along the zone axis [211]. (e) Grazing incidence XRD pattern of a reference Au/TiO2 planar sample on quartz disc made by the same recipe as the fiber sample in (a).
Sensors 23 04165 g013
Table 1. Model parameters used to generate optical constants and dielectric functions of Au nano particles in Figure 8.
Model Parameter of Au NPValue
High frequency dielectric constant ( ε )1.5
Plasma frequency at room temp. ( ω p o ) 1.418 × 10 16   rad s
Thermal expansion coefficient ( γ e ) 1.42 × 10 5   K 1
Fermi velocity of free electrons ( v F ) 1.4 × 10 6   m s
Assumed averaged Au NP size ( r n p )20 nm
Scattering probability ( Γ )0.55
Umklapp fractional scattering ( )0.77
Fermi energy ( E F )5.53 eV
Debye temperature ( T D )185 K
Frequency constant ( ω 0 ) 1.0698 × 10 14 rad s
Disclaimer/Publisher’s Note: The statements, opinions and data contained in all publications are solely those of the individual author(s) and contributor(s) and not of MDPI and/or the editor(s). MDPI and/or the editor(s) disclaim responsibility for any injury to people or property resulting from any ideas, methods, instructions or products referred to in the content.

