
Using Arterial Pulse and Laser Doppler Analyses to Discriminate between the Cardiovascular Effects of Different Running Levels

Abstract
:1. Introduction
2. Materials and Methods
2.1. Participants
2.2. Outdoor 3-km Testing
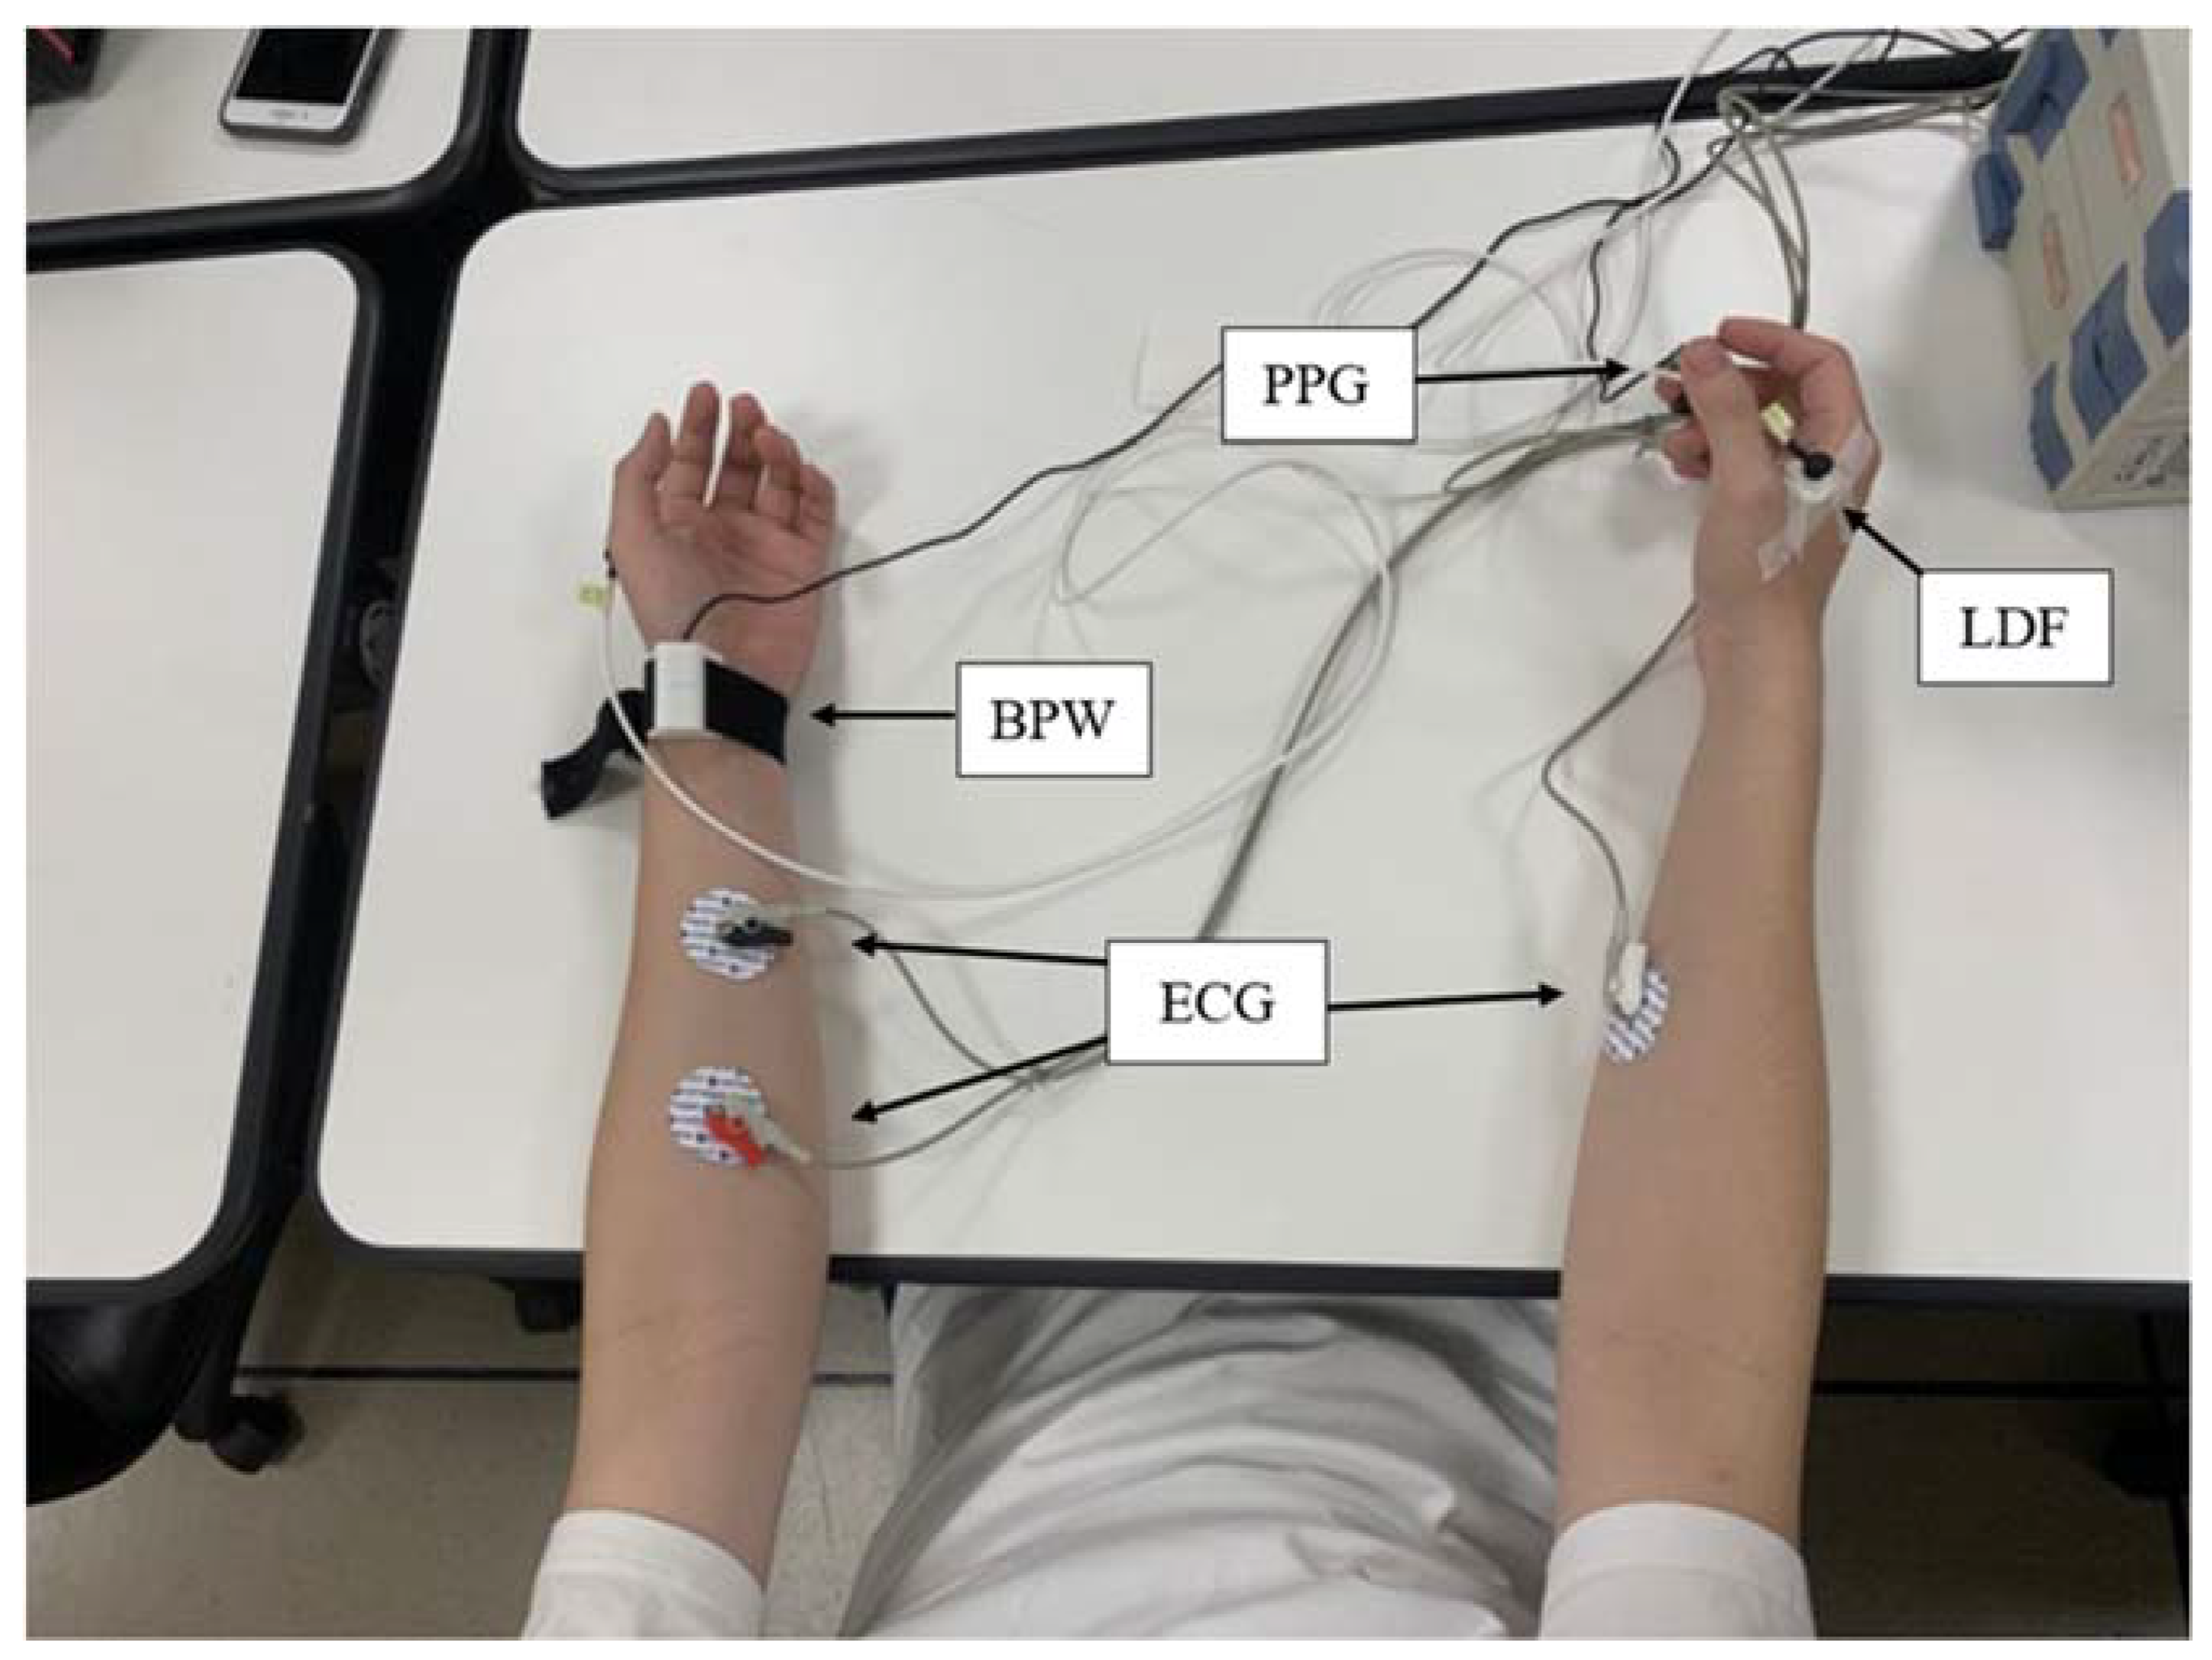
2.3. Measurement
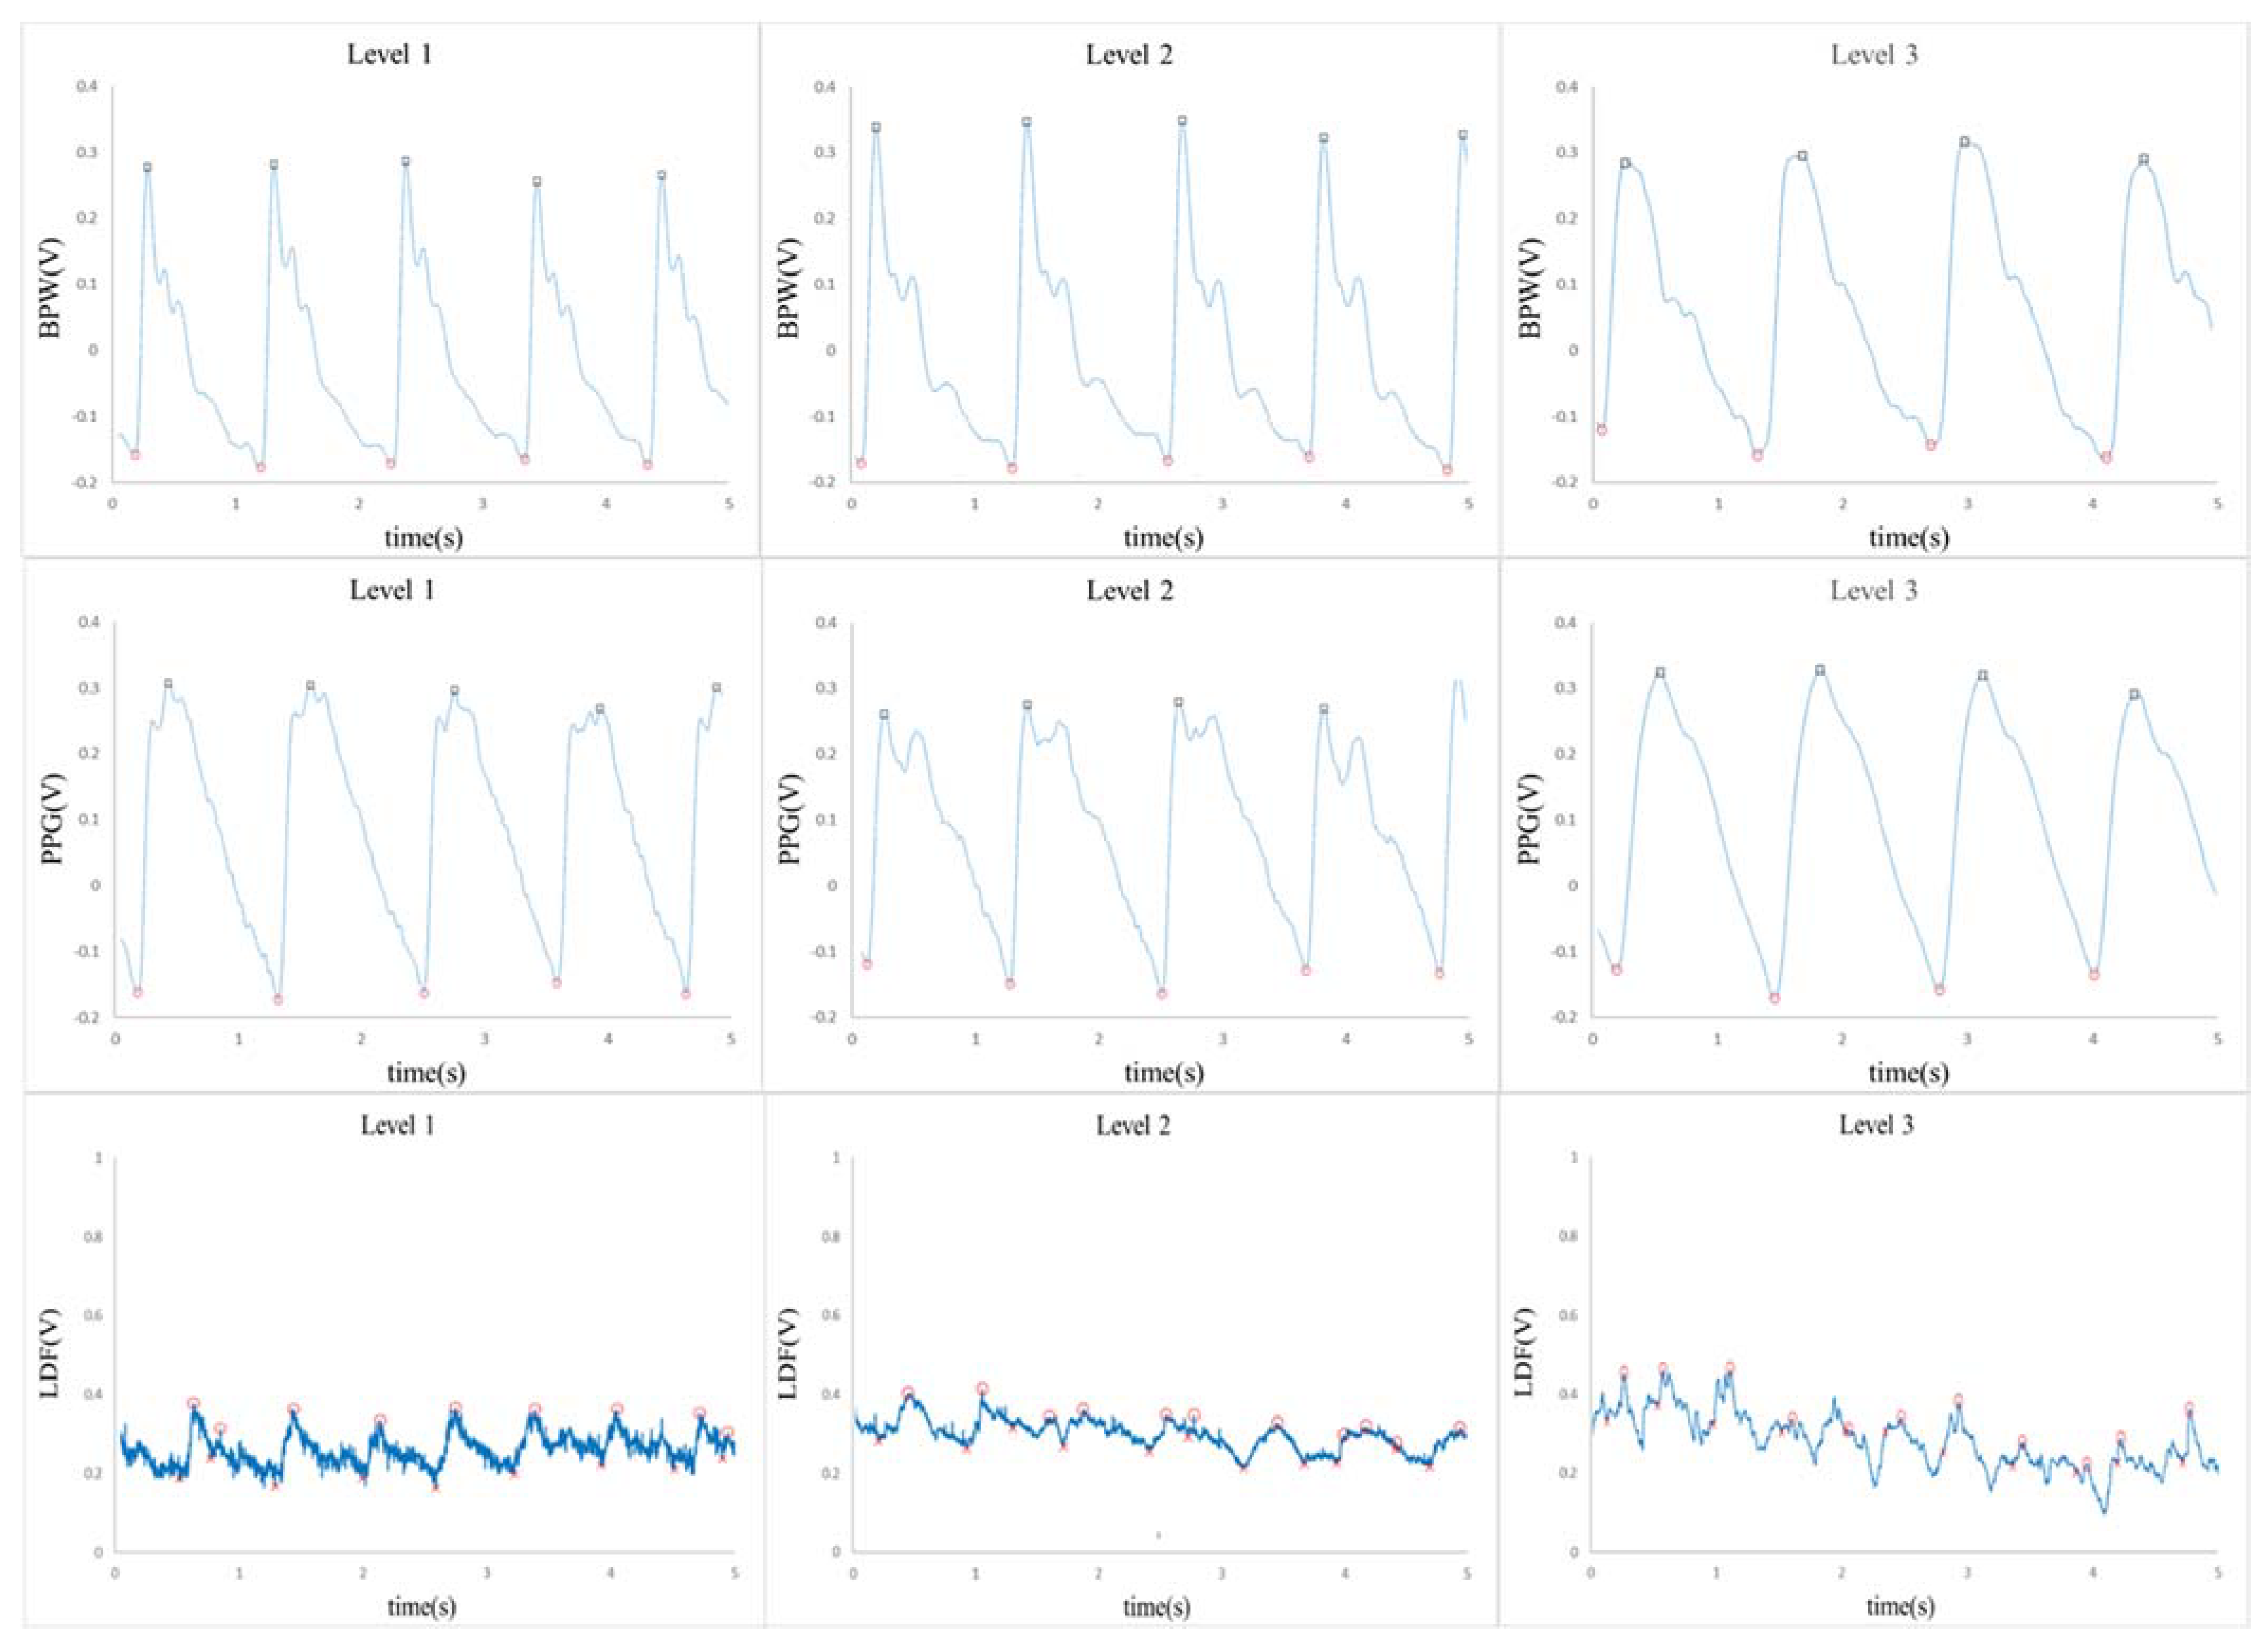
2.4. Analysis
- Choose the indices with significant or prominent differences relative to the Level-3 group.
- Prepare to calculate the pulse effect indices: divide the values by the average value of the Level-3 group for C2, C4, C5, C6, C7, P2, P3, P4, P5, P6…. and denote them as C2′, C4′, ….
- Define the amplitude effect index as (C4′ × C5′ × C6′ × C7′/C2′).
- Define the angle effect index as (P2′ × P3′ × P4′ × P5′ × P6′).
- Plot the relative changes in the pulse effect indices. The relative change is based on the concept of Z-score standardization. With the amplitude effect index as an example, the relative change was defined as ((one amplitude effect index) − (average of all amplitude effect indices of the group))/(average of all amplitude effect indices of the group).
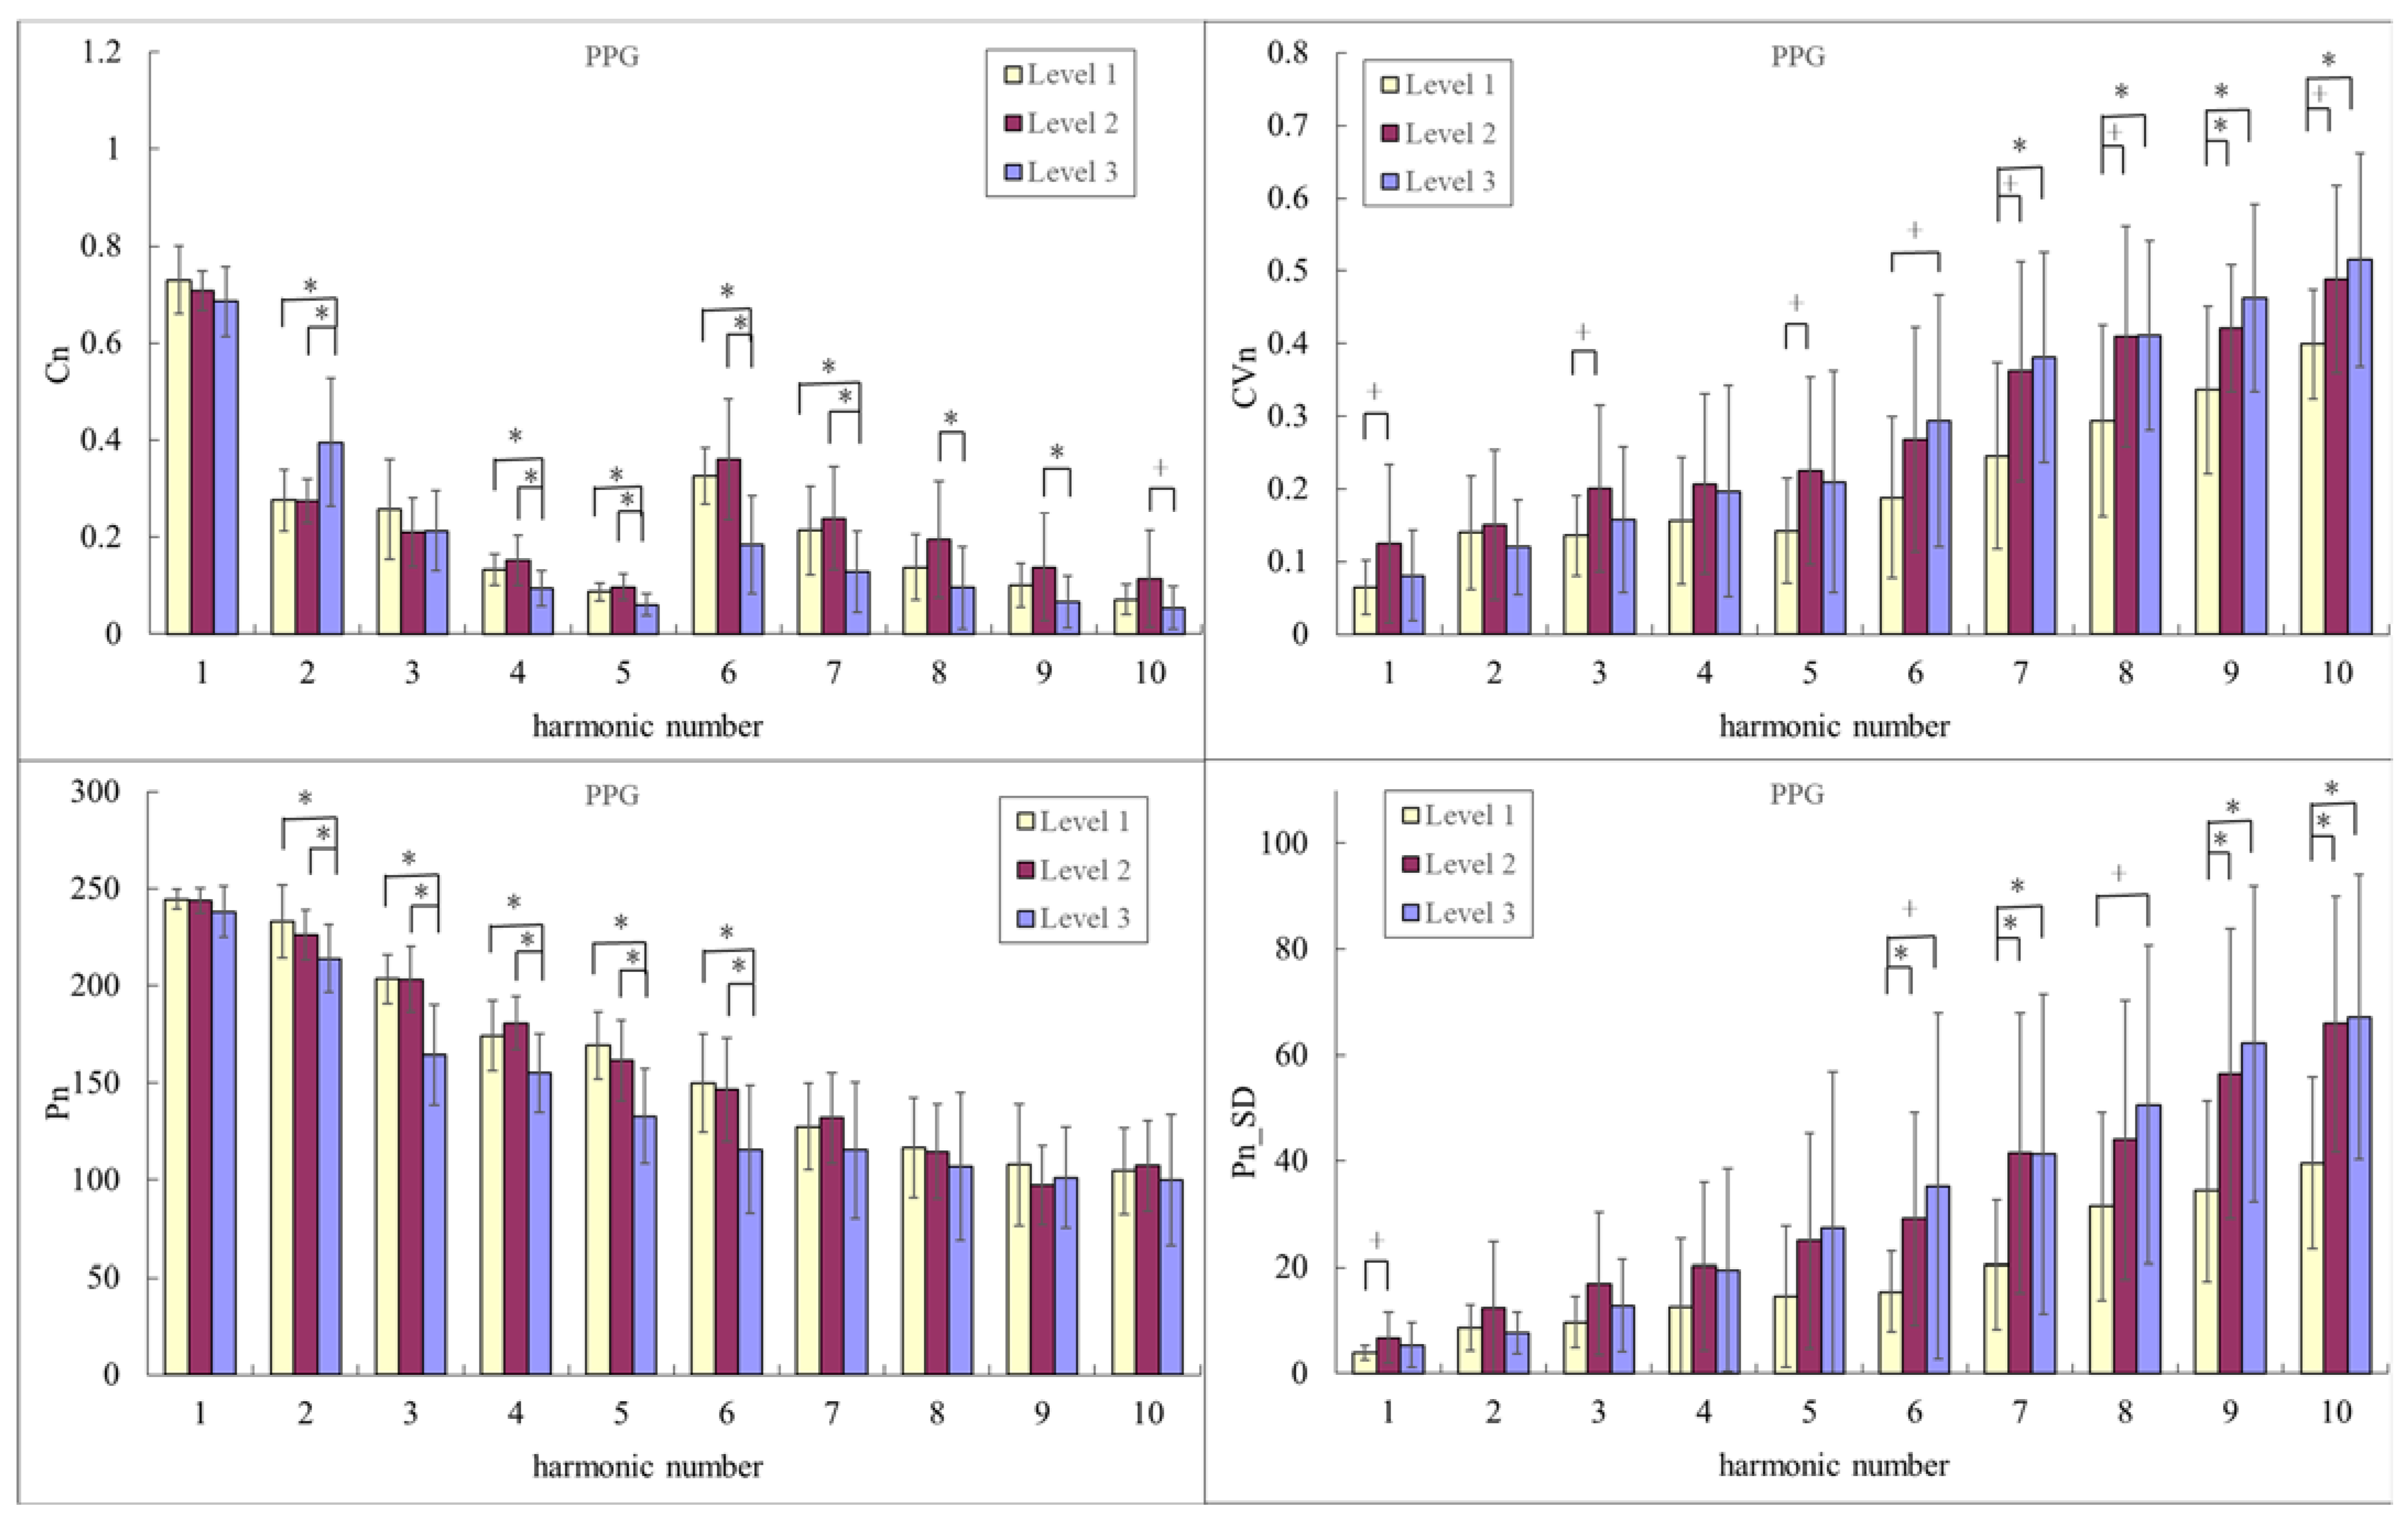
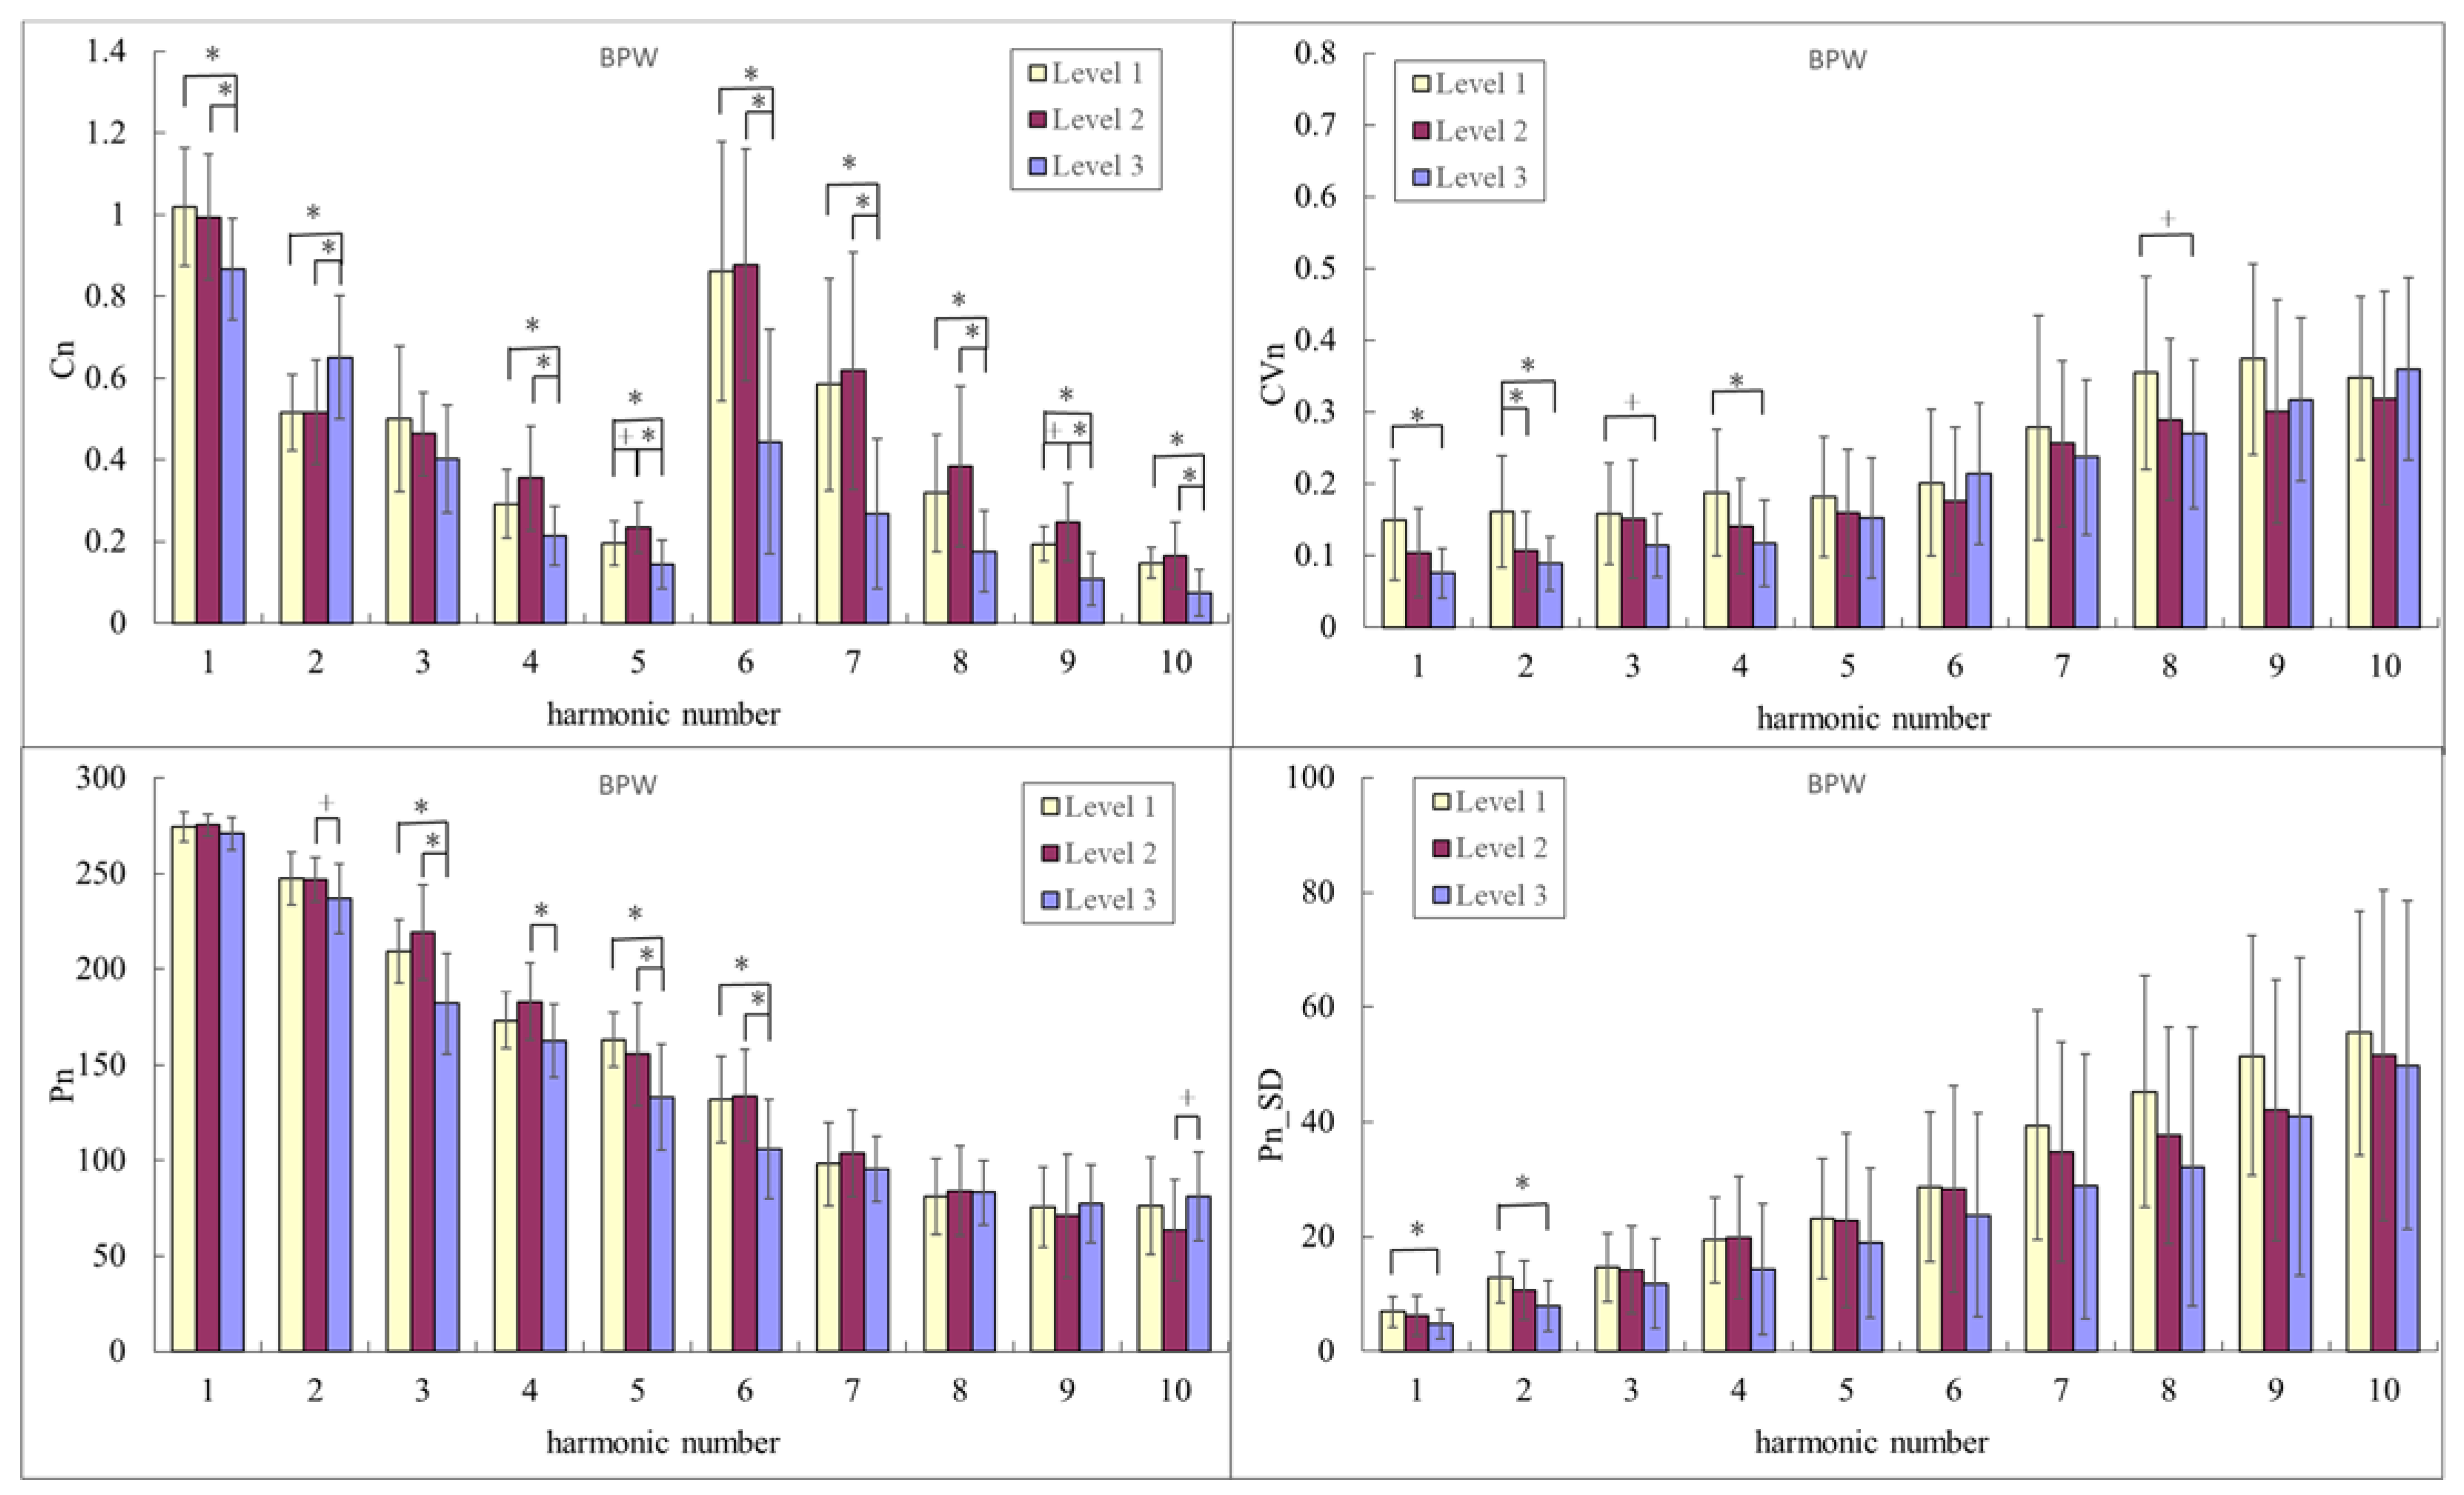
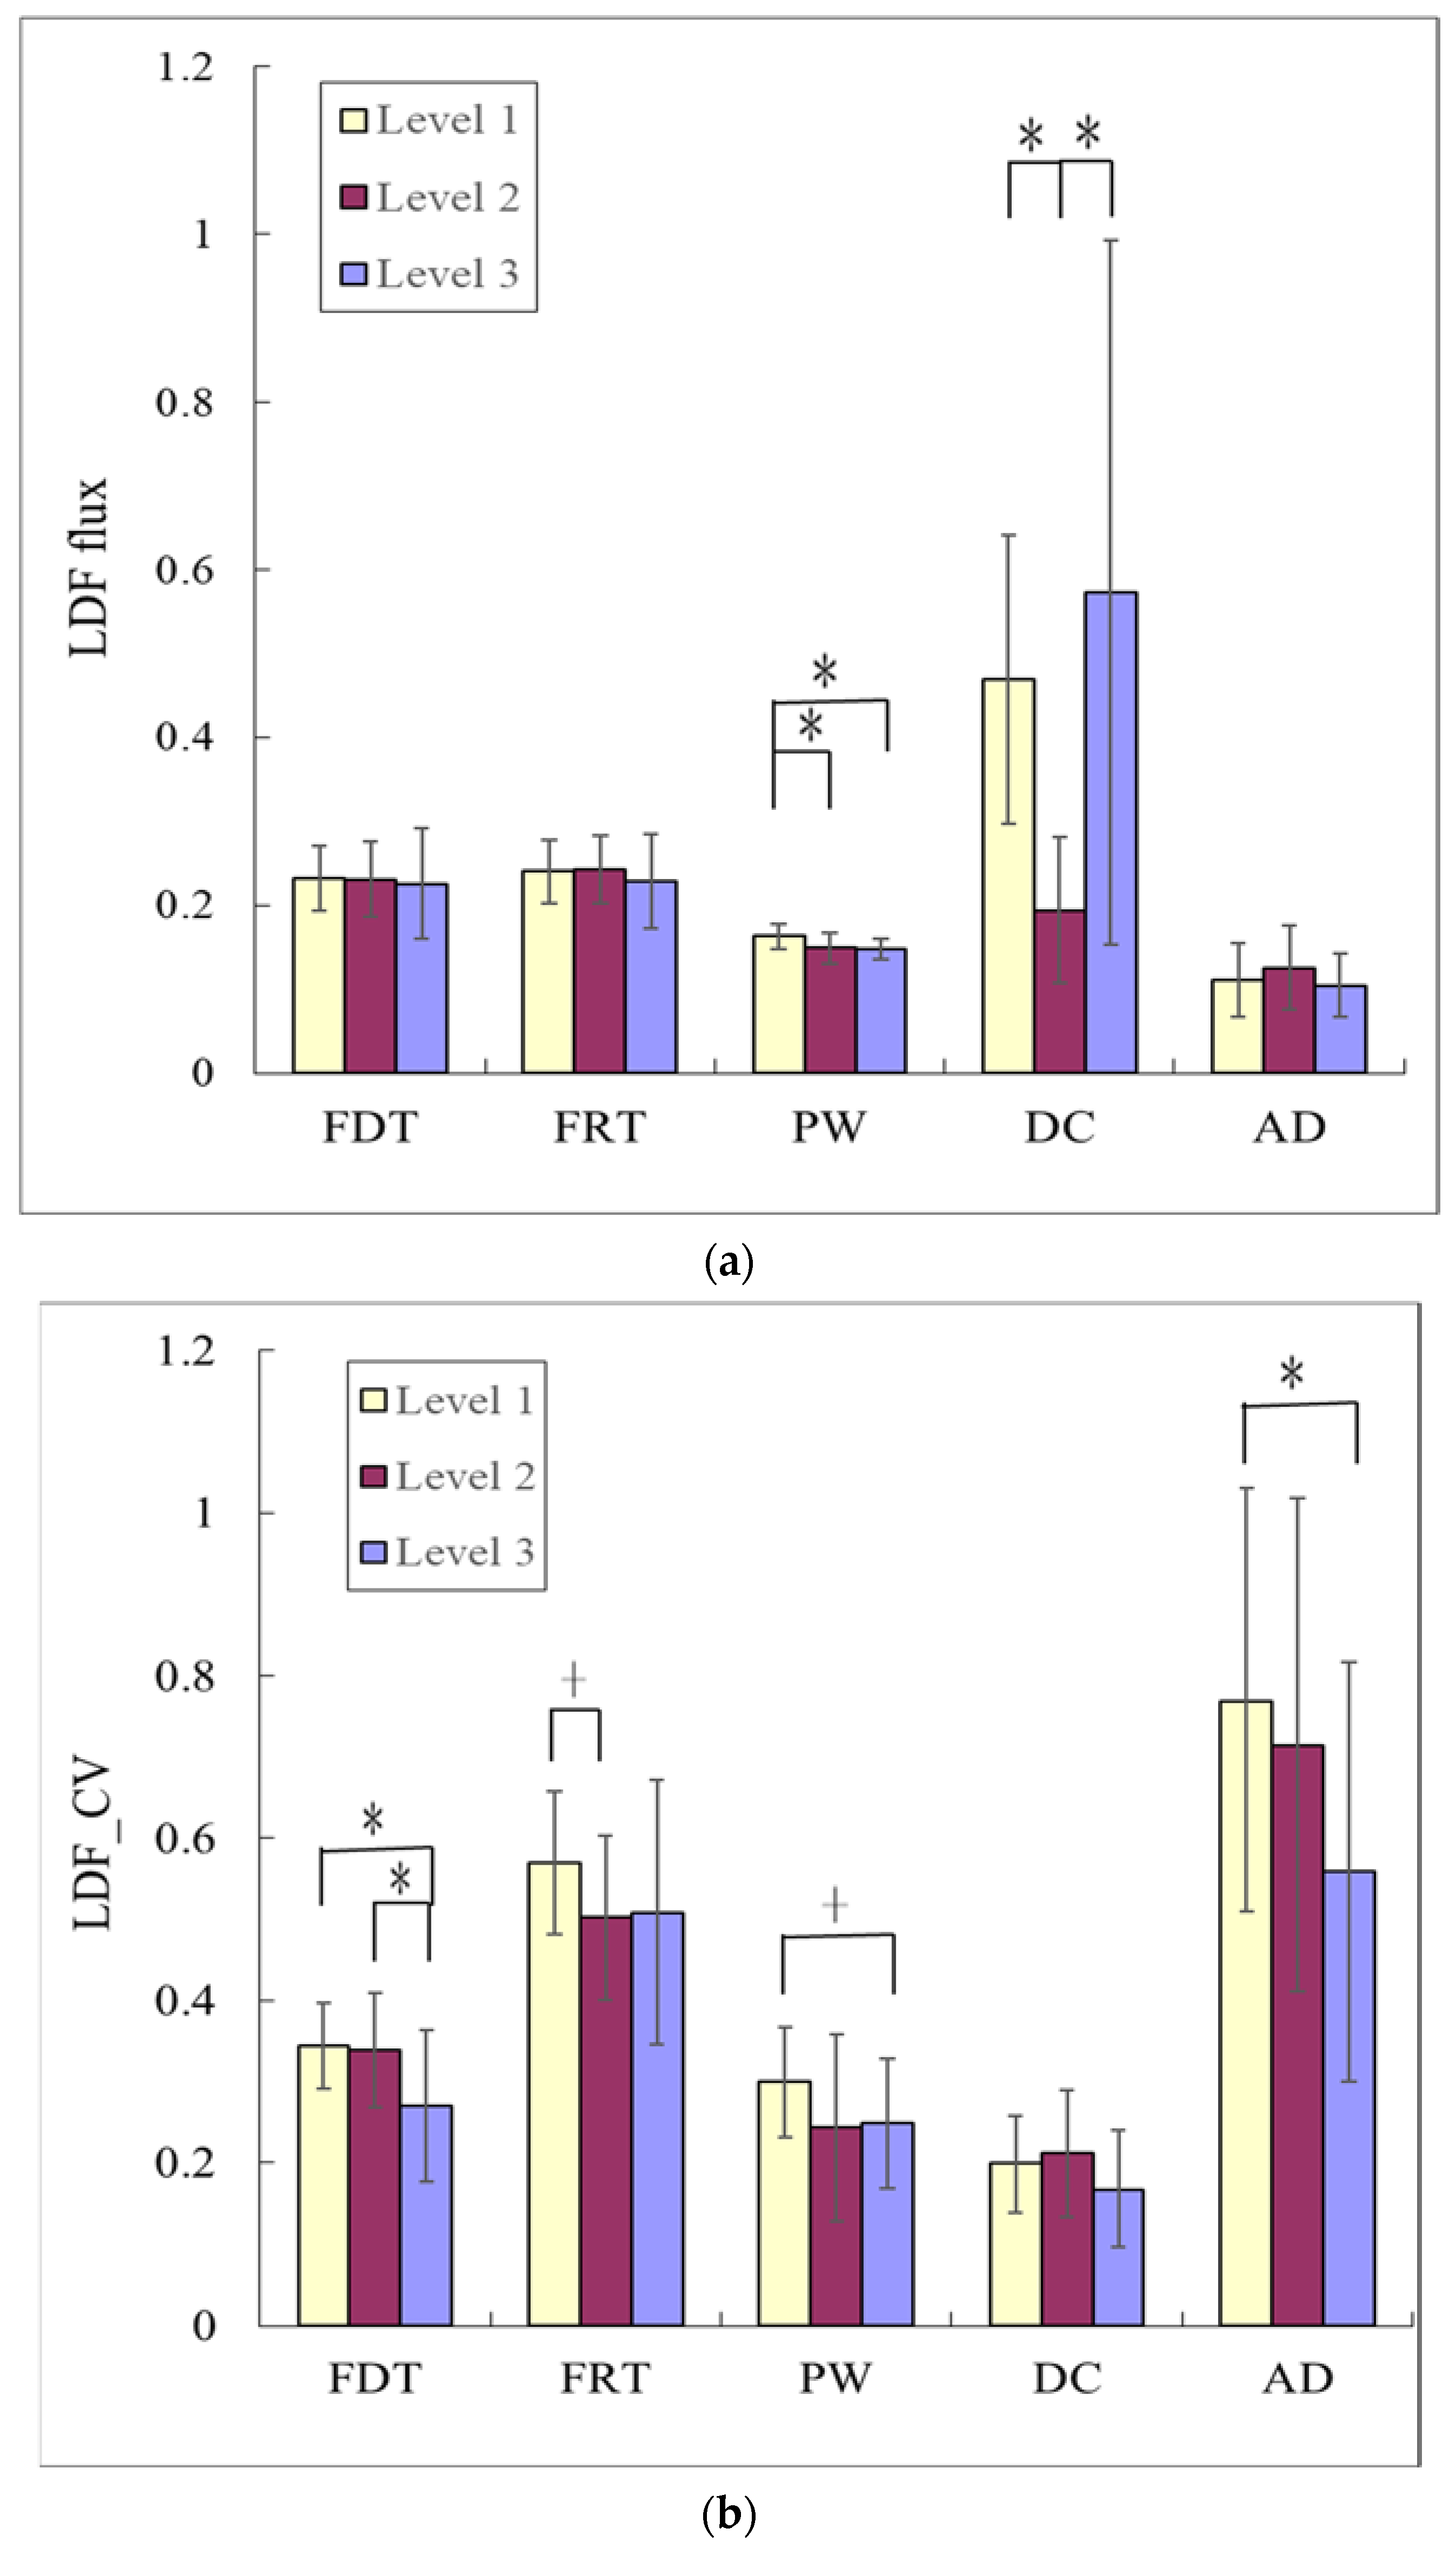
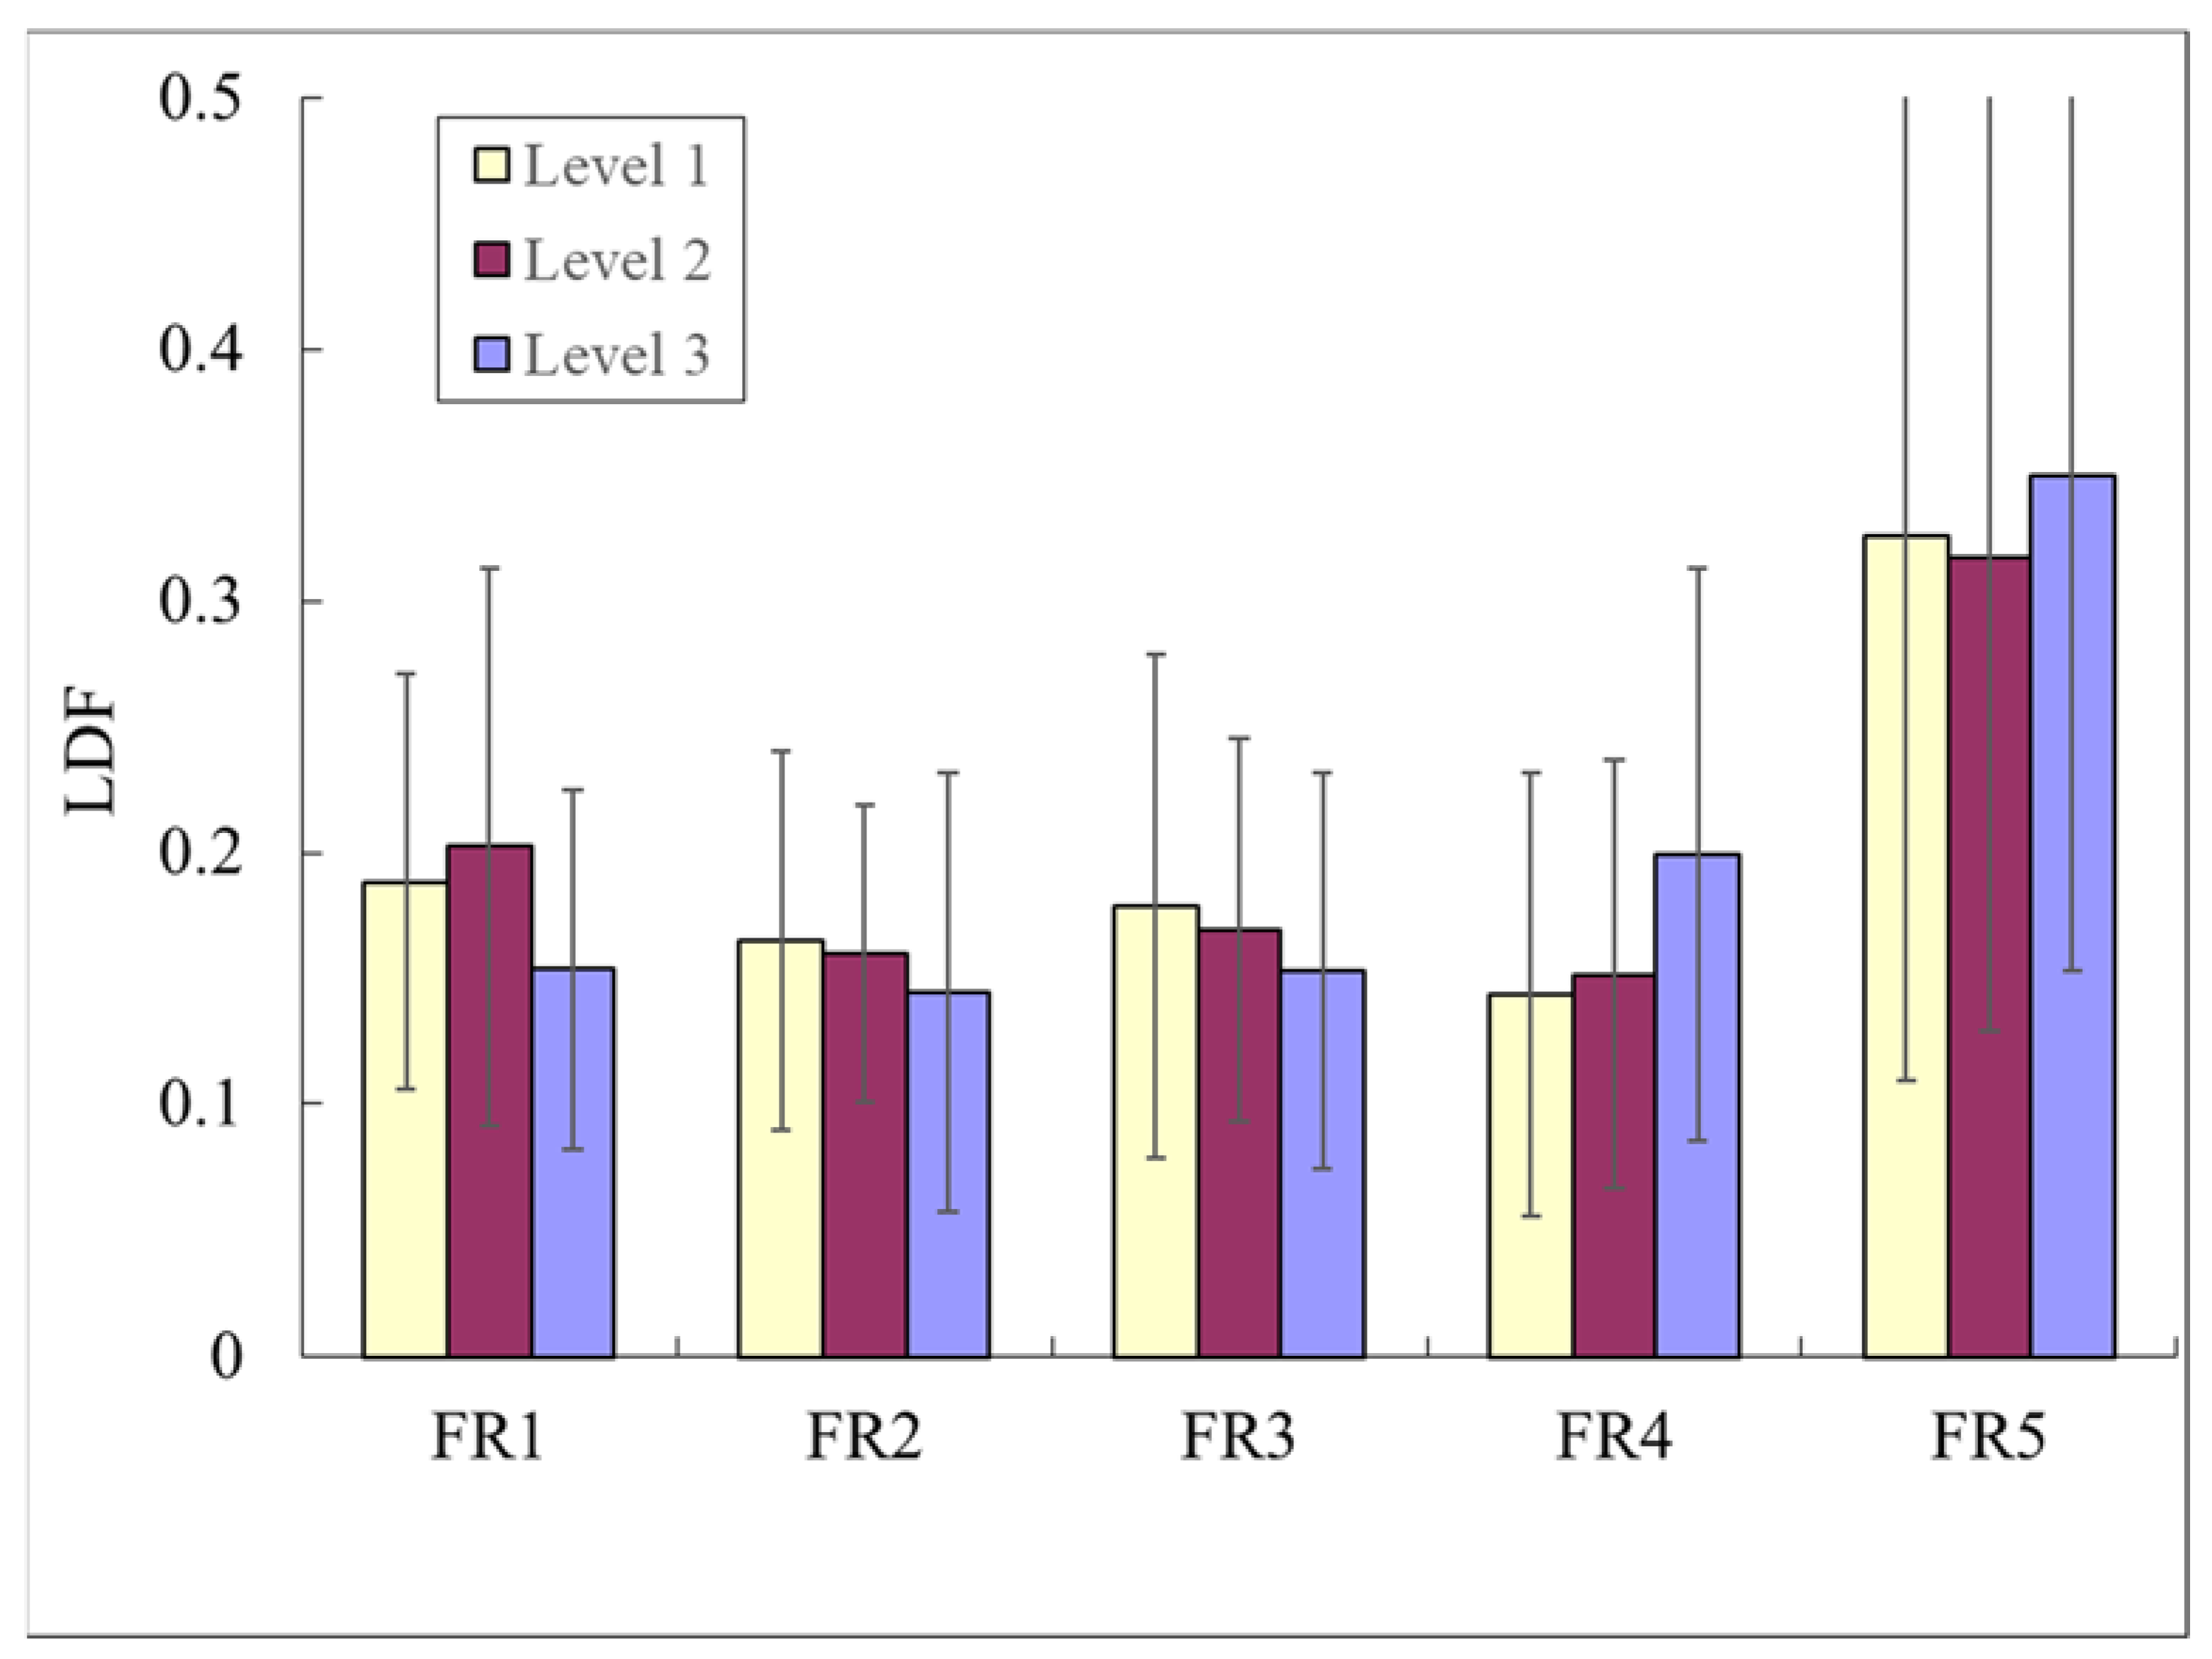
3. Results
4. Discussion
4.1. Changes in Pulse Waveform Indices (Cn and Pn)
4.2. Changes in Pulse Variability Indices (CVn and Pn_SD)
4.3. LDF Indices
4.4. Distinguishing Level 1 from Level 2
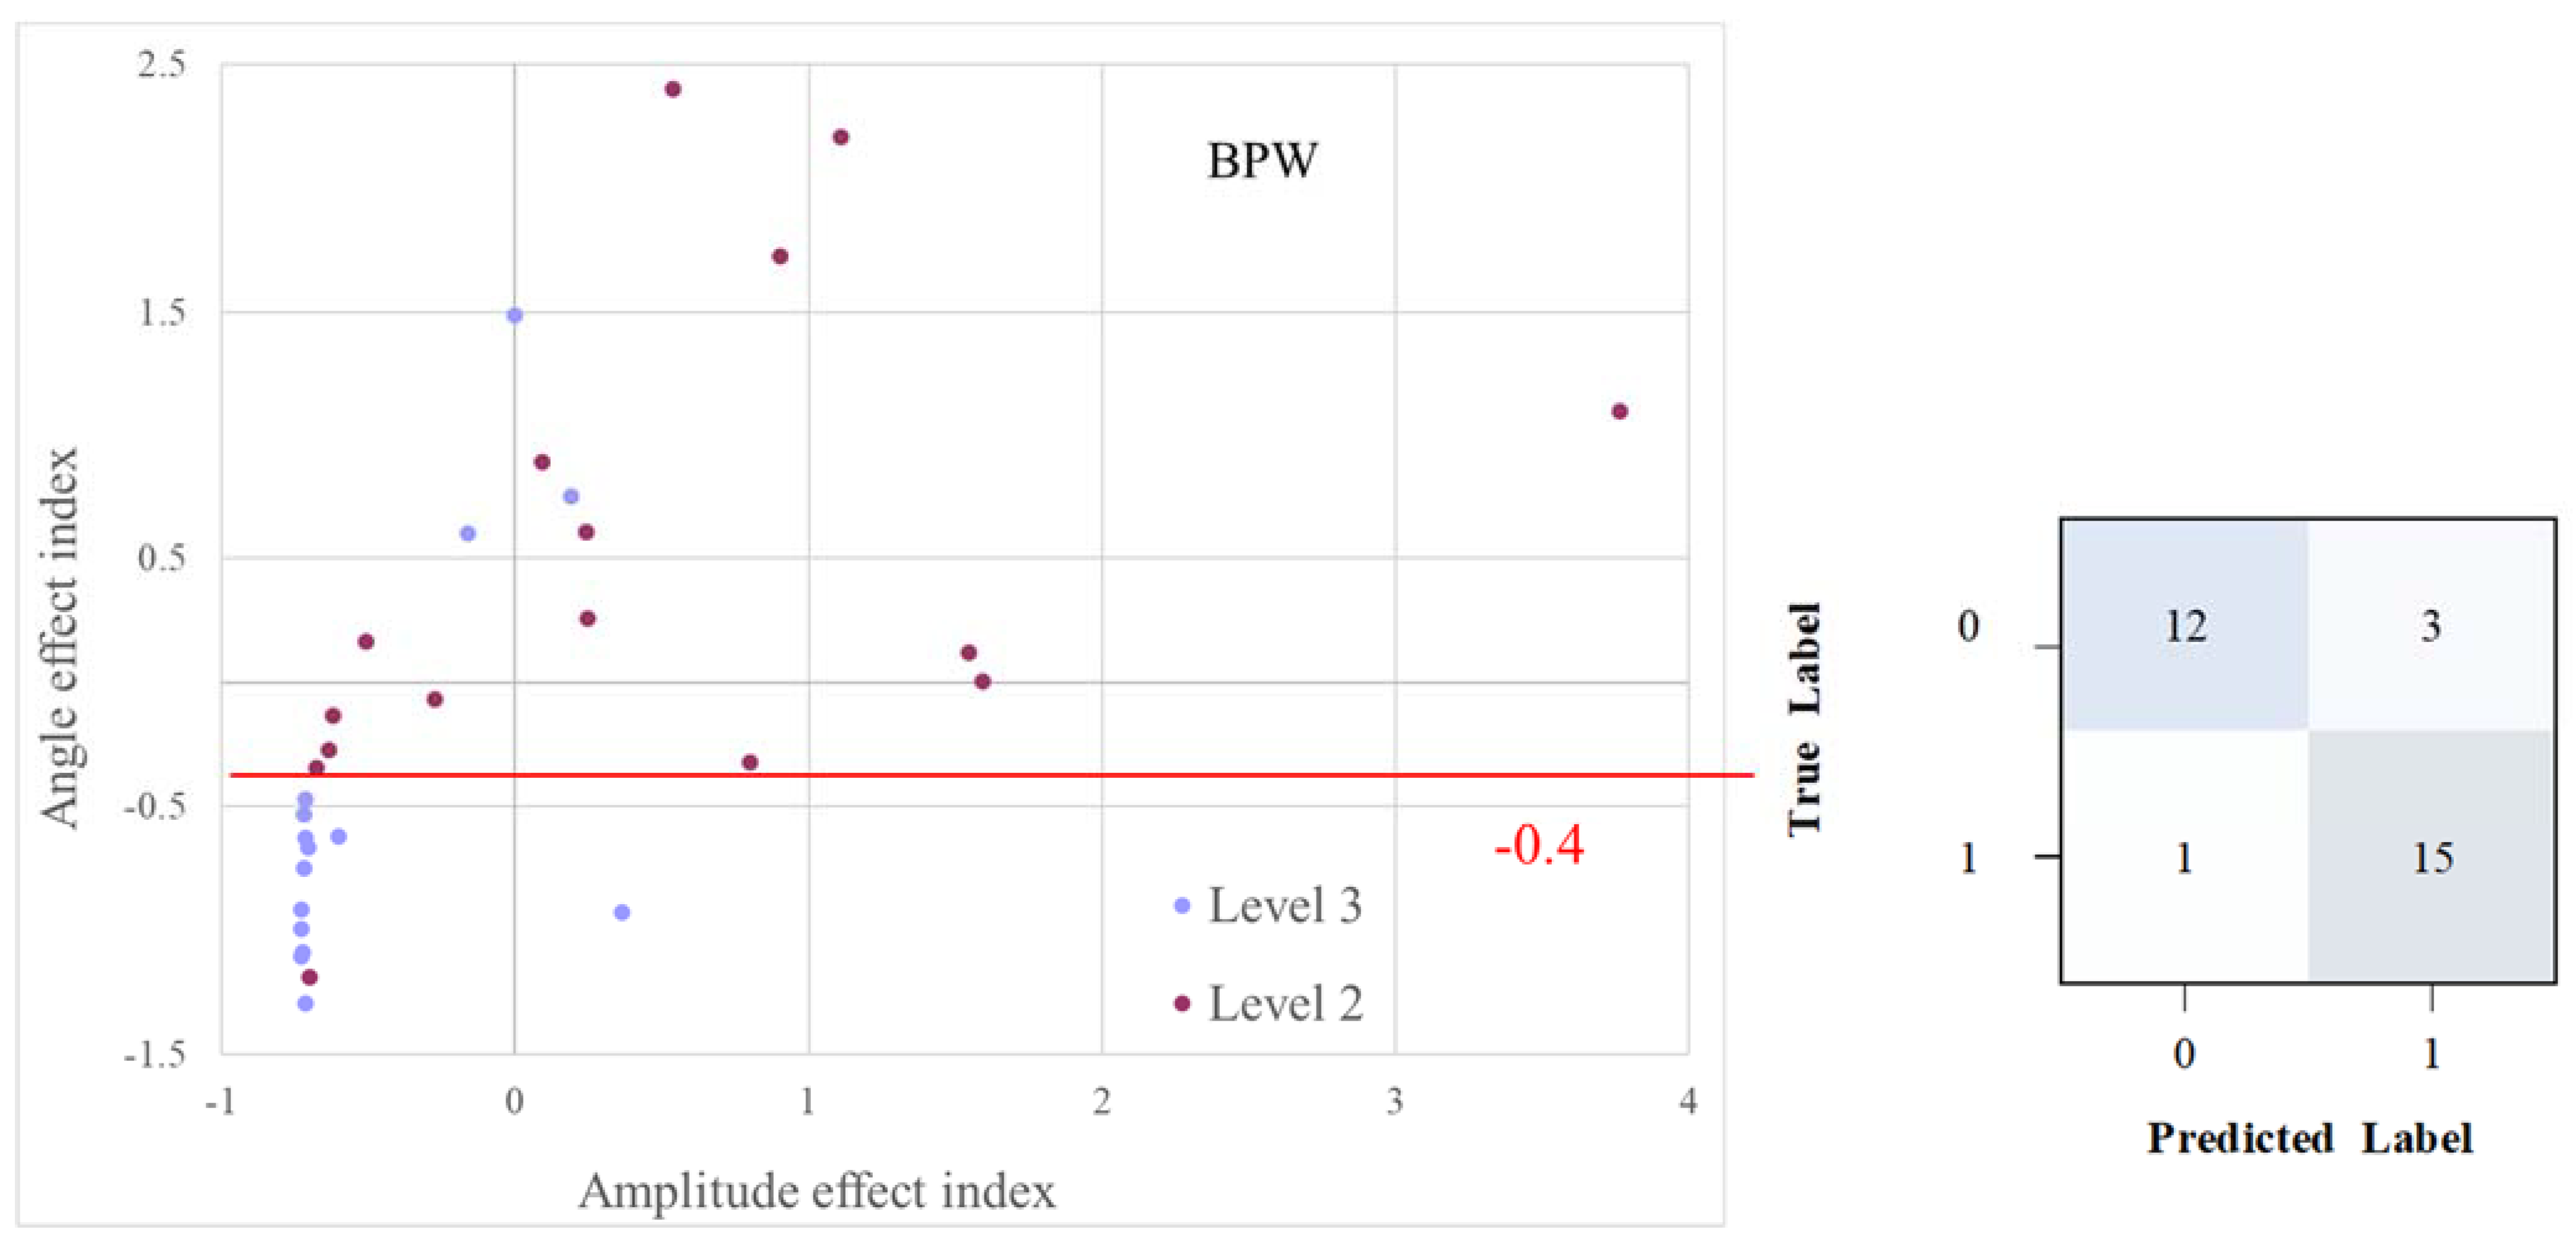
4.5. Classification by Analysis of Pulse-EffectIndices
5. Conclusions
- Significant differences were noted in pulse and LDF indices between groups. These could be used to evaluate advantageous cardiovascular effects provided by exercise.
- The present method of pulse waveform analysis can be used to discriminate Level 1 from Level 2, and hence aid in the screening of outstanding Level 2s.
- Using relative changes in the amplitude and angle-effect indices can achieve almost perfect discrimination between Level 2 and Level 3 (AUC = 0.878 for BPW). This could be useful for early-stage research in classifying the different effects on blood supply, and can also assist in feature selection in subsequent artificial intelligence analysis.
- There is a need for convenient and immediate evaluation tools for evaluating the benefits of exercise on the cardiovascular system. The present findings may contribute to the development of technologies and devices for evaluating exercise-induced physiological effects.
Supplementary Materials
Author Contributions
Funding
Institutional Review Board Statement
Informed Consent Statement
Data Availability Statement
Acknowledgments
Conflicts of Interest
References
- Lee, D.C.; Pate, R.R.; Lavie, C.J.; Sui, X.; Church, T.S.; Blair, S.N. Leisure-time running reduces all-cause and cardiovascular mortality risk. J. Am. Coll. Cardiol. 2014, 64, 472–481. [Google Scholar] [CrossRef] [PubMed] [Green Version]
- Tomoto, T.; Sugawara, J.; Hirasawa, A.; Imai, T.; Maeda, S.; Ogoh, S. Impact of short-term training camp on arterial stiffness in endurance runners. J. Physiol. Sci. 2015, 65, 445–449. [Google Scholar] [CrossRef] [PubMed]
- Vlachopoulos, C.; Kardara, D.; Anastasakis, A.; Baou, K.; Terentes-Printzios, D.; Tousoulis, D.; Stefanadis, C. Arterial stiffness and wave reflections in marathon runners. Am. J. Hypertens. 2010, 23, 974–979. [Google Scholar] [CrossRef] [Green Version]
- Silva, D.V.; Waclawovsky, G.; Kramer, A.B.; Stein, C.; Eibel, B.; Grezzana, G.B.; Schaun, M.I.; Lehnen, A.M. Comparison of Cardiac and Vascular Parameters in Powerlifters and Long-Distance Runners: Comparative Cross-Sectional Study. Arq. Bras. Cardiol. 2018, 111, 772–781. [Google Scholar] [CrossRef] [PubMed]
- Nystoriak, M.A.; Bhatnagar, A. Cardiovascular Effects and Benefits of Exercise. Front. Cardiovasc. Med. 2018, 5, 135. [Google Scholar] [CrossRef] [Green Version]
- Kiss, O.; Sydó, N.; Vargha, P.; Vágó, H.; Czimbalmos, C.; Édes, E.; Zima, E.; Apponyi, G.; Merkely, G.; Sydó, T.; et al. Detailed heart rate variability analysis in athletes. Clin. Auton. Res. 2016, 26, 245–252. [Google Scholar] [CrossRef]
- Wakeham, D.J.; Lord, R.N.; Talbot, J.S.; Lodge, F.M.; Curry, B.A.; Dawkins, T.G.; Simpson, L.L.; Shave, R.E.; Pugh, C.J.A.; Moore, J.P. Upward resetting of the vascular sympathetic baroreflex in middle-aged male runners. Am. J. Physiol. Heart Circ. Physiol. 2019, 317, H181–H189. [Google Scholar] [CrossRef] [PubMed]
- Augustine, J.A.; Lefferts, W.K.; DeBlois, J.P.; Barreira, T.V.; Taylor, B.A.; Liu, K.; Heffernan, K.S. Sex differences in cardiovascular adaptations in recreational marathon runners. Eur. J. Appl. Physiol. 2021, 121, 3459–3472. [Google Scholar] [CrossRef]
- Talbot, J.S.; Lord, R.N.; Wakeham, D.J.; Dawkins, T.G.; Curry, B.A.; Brown, M.; Lodge, F.M.; Pugh, C.J.A. The influence of habitual endurance exercise on carotid artery strain and strain rate in young and middle-aged men. Exp. Physiol. 2020, 105, 1396–1407. [Google Scholar] [CrossRef]
- Burr, J.F.; Phillips, A.A.; Drury, T.C.; Ivey, A.C.; Warburton, D.E. Temporal response of arterial stiffness to ultra-marathon. Int. J. Sport. Med. 2014, 35, 658–663. [Google Scholar] [CrossRef] [Green Version]
- Vaitkevicius, P.V.; Fleg, J.L.; Engel, J.H.; O’Connor, F.C.; Wright, J.G.; Lakatta, L.E.; Yin, F.C.; Lakatta, E.G. Effects of age and aerobic capacity on arterial stiffness in healthy adults. Circulation 1993, 88, 1456–1462. [Google Scholar] [CrossRef] [Green Version]
- O’Rourke, M.F.; Nichols, W.W. Aortic diameter, aortic stiffness, and wave reflection increase with age and isolated systolic hypertension. Hypertension 2005, 45, 652–658. [Google Scholar] [CrossRef] [PubMed] [Green Version]
- Boutouyrie, P.; Tropeano, A.I.; Asmar, R.; Gautier, I.; Benetos, A.; Lacolley, P.; Laurent, S. Aortic stiffness is an independent predictor of primary coronary events in hypertensive patients: A longitudinal study. Hypertension 2002, 39, 10–15. [Google Scholar] [CrossRef] [Green Version]
- Sutton-Tyrrell, K.; Najjar, S.S.; Boudreau, R.M.; Venkitachalam, L.; Kupelian, V.; Simonsick, E.M.; Havlik, R.; Lakatta, E.G.; Spurgeon, H.; Kritchevsky, S.; et al. Elevated aortic pulse wave velocity, a marker of arterial stiffness, predicts cardiovascular events in well-functioning older adults. Circulation 2005, 111, 3384–3390. [Google Scholar] [CrossRef]
- Mancia, G.; Fagard, R.; Narkiewicz, K.; Redón, J.; Zanchetti, A.; Böhm, M.; Christiaens, T.; Cifkova, R.; De Backer, G.; Dominiczak, A.; et al. 2013 ESH/ESC Guidelines for the management of arterial hypertension: The Task Force for the management of arterial hypertension of the European Society of Hypertension (ESH) and of the European Society of Cardiology (ESC). J. Hypertens. 2013, 31, 1281–1357. [Google Scholar] [CrossRef] [Green Version]
- Sehestedt, T.; Jeppesen, J.; Hansen, T.W.; Wachtell, K.; Ibsen, H.; Torp-Pedersen, C.; Hildebrandt, P.; Olsen, M.H. Risk prediction is improved by adding markers of subclinical organ damage to SCORE. Eur. Heart J. 2010, 31, 883–891. [Google Scholar] [CrossRef] [Green Version]
- Wu, L.W.; OuYoung, T.; Chiu, Y.C.; Hsieh, H.F.; Hsiu, H. Discrimination between possible sarcopenia and metabolic syndrome using the arterial pulse spectrum and machine-learning analysis. Sci. Rep. 2022, 12, 21452. [Google Scholar] [CrossRef] [PubMed]
- Chen, C.C.; Chang, C.K.; Chiu, C.C.; Yang, T.Y.; Hao, W.R.; Lin, C.H.; Fang, Y.A.; Jian, W.; Hsu, M.H.; Yang, T.L.; et al. Machine Learning Analyses Revealed Distinct Arterial Pulse Variability According to Side Effects of Pfizer-BioNTech COVID-19 Vaccine (BNT162b2). J. Clin. Med. 2022, 11, 6119. [Google Scholar] [CrossRef] [PubMed]
- Hsiu, H.; Lin, S.K.; Weng, W.L.; Hung, C.M.; Chang, C.K.; Lee, C.C.; Chen, C.T. Discrimination of the Cognitive Function of Community Subjects Using the Arterial Pulse Spectrum and Machine-Learning Analysis. Sensors 2022, 22, 806. [Google Scholar] [CrossRef]
- Hsiu, H.; Liu, J.C.; Yang, C.J.; Chen, H.S.; Wu, M.S.; Hao, W.R.; Lee, K.Y.; Hu, C.J.; Wang, Y.H.; Fang, Y.A. Discrimination of vascular aging using the arterial pulse spectrum and machine-learning analysis. Microvasc. Res. 2021, 139, 104240. [Google Scholar] [CrossRef]
- Lin, S.K.; Hsiu, H.; Chen, H.S.; Yang, C.J. Classification of patients with Alzheimer’s disease using the arterial pulse spectrum and a multilayer-perceptron analysis. Sci. Rep. 2021, 11, 8882. [Google Scholar] [CrossRef] [PubMed]
- Lin, F.C.; Hsiu, H.; Chiu, H.S.; Chen, C.T.; Hsu, C.H. Characteristics of pulse-waveform and laser-Doppler indices in frozen-shoulder patients. Biomed. Signal Process. Control 2020, 56, 101718. [Google Scholar] [CrossRef]
- Stefanovska, A.; Bracic, M.; Kvernmo, H.D. Wavelet analysis of oscillations in the peripheral blood circulation measured by laser Doppler technique. IEEE Trans. Biomed. Eng. 1999, 46, 1230–1239. [Google Scholar] [CrossRef] [PubMed]
- Iwasaki, W.; Nogami, H.; Takeuchi, S.; Furue, M.; Higurashi, E.; Sawada, R. Detection of Site-Specific Blood Flow Variation in Humans during Running by a Wearable Laser Doppler Flowmeter. Sensors 2015, 15, 25507–25519. [Google Scholar] [CrossRef] [PubMed] [Green Version]
- Franzoni, F.; Galetta, F.; Morizzo, C.; Lubrano, V.; Palombo, C.; Santoro, G.; Ferrannini, E.; Quiñones-Galvan, A. Effects of age and physical fitness on microcirculatory function. Clin. Sci. 2004, 106, 329–335. [Google Scholar] [CrossRef] [Green Version]
- Kvernmo, H.D.; Stefanovska, A.; Kirkebøen, K.A. Enhanced endothelial activity reflected in cutaneous blood flow oscillations of Level 2s. Eur. J. Appl. Physiol. 2003, 90, 16–22. [Google Scholar] [CrossRef]
- Heffernan, K.S. How healthy were the arteries of Phidippides? Clin. Cardiol. 2012, 35, 65–68. [Google Scholar] [CrossRef]
- Ferber, R.; Davis, I.M.; Williams, D.S., 3rd. Gender differences in lower extremity mechanics during running. Clin. Biomech. 2003, 18, 350–357. [Google Scholar] [CrossRef]
- Buist, I.; Bredeweg, S.W.; Bessem, B.; van Mechelen, W.; Lemmink, K.A.; Diercks, R.L. Incidence and risk factors of running-related injuries during preparation for a 4-mile recreational running event. Br. J. Sport. Med. 2010, 44, 598–604. [Google Scholar] [CrossRef] [Green Version]
- Laursen, P.B.; Francis, G.T.; Abbiss, C.R.; Newton, M.J.; Nosaka, K. Reliability of time-to-exhaustion versus time-trial running tests in runners. Med. Sci. Sport. Exerc. 2007, 39, 1374–1379. [Google Scholar] [CrossRef]
- Chang, Y.W.; Hsiu, H.; Yang, S.H.; Fang, W.H.; Tsai, H.C. Characteristics of beat-to-beat photoplethysmography waveform indexes in subjects with metabolic syndrome. Microvasc. Res. 2016, 106, 80–87. [Google Scholar] [CrossRef] [PubMed]
- Bolotin, A.; Bakayev, V. Peripheral circulation indicators in veteran trail runners. J. Phys. Ther. Sci. 2017, 29, 1092–1094. [Google Scholar] [CrossRef] [PubMed] [Green Version]
- da Silva, D.F.; Ferraro, Z.M.; Adamo, K.B.; Machado, F.A. Endurance Running Training Individually Guided by HRV in Untrained Women. J. Strength Cond. Res. 2019, 33, 736–746. [Google Scholar] [CrossRef] [PubMed]
- Dong, J.G. The role of heart rate variability in sports physiology. Exp. Ther. Med. 2016, 11, 1531–1536. [Google Scholar] [CrossRef] [PubMed] [Green Version]
- Gratze, G.; Mayer, H.; Luft, F.C.; Skrabal, F. Determinants of fast marathon performance: Low basal sympathetic drive, enhanced postcompetition vasodilatation and preserved cardiac performance after competition. Br. J. Sports Med. 2008, 42, 882–888. [Google Scholar] [CrossRef]
- Shin, K.; Minamitani, H.; Onishi, S.; Yamazaki, H.; Lee, M. Autonomic differences between Level 2s and nonLevel 2s: Spectral analysis approach. Med. Sci. Sports Exerc. 1997, 29, 1482–1490. [Google Scholar] [CrossRef]
- Bustos, D.; Guedes, J.C.; Baptista, J.S.; Vaz, M.P.; Costa, J.T.; Fernandes, R.J. Applicability of Physiological Monitoring Systems within Occupational Groups: A Systematic Review. Sensors 2021, 21, 7249. [Google Scholar] [CrossRef]
- Park, Y.G.; Lee, S.; Park, J.U. Recent Progress in Wireless Sensors for Wearable Electronics. Sensors 2019, 19, 4353. [Google Scholar] [CrossRef] [Green Version]
- Amidei, C. Measurement of physiologic responses to mobilisation in critically ill adults. Intensive Crit. Care Nurs. 2012, 28, 58–72. [Google Scholar] [CrossRef]
- Grant, S.; Aitchison, T.; Henderson, E.; Christie, J.; Zare, S.; McMurray, J.; Dargie, H. A comparison of the reproducibility and the sensitivity to change of visual analogue scales, Borg scales, and Likert scales in normal subjects during submaximal exercise. Chest 1999, 116, 1208–1217. [Google Scholar] [CrossRef]


| Group | Level 3 | Level 2 | Level 1 |
|---|---|---|---|
| Subject number | 15 | 16 | 13 |
| Age | 29.5 ± 13.4 | 25.9 ± 3.1 | 33.2 ± 5.9 |
| HR | 75.93 ± 14.90 | 58.3 ± 10.00 | 55.29 ± 8.25 |
| HR_CV | 0.061 ± 0.016 | 0.067 ± 0.014 | 0.061 ± 0.017 |
| BMI | 23.39 ± 1.71 | 23.33 ± 1.80 | 22.20 ± 1.70 |
| Pulse and Blood Flow Waveform Analysis | Electromyography(EMG) | Blood Test | Rating of Perceived Exertion (RPE) | |
|---|---|---|---|---|
| User friendliness | O | ∆ | O | |
| Accuracy | ∆ | O | O | ∆ |
| Required time | O | ∆ | O | |
| Noninvasive evaluation | O | ∆ | O | |
| Cost | O | ∆ | O | O |
Disclaimer/Publisher’s Note: The statements, opinions and data contained in all publications are solely those of the individual author(s) and contributor(s) and not of MDPI and/or the editor(s). MDPI and/or the editor(s) disclaim responsibility for any injury to people or property resulting from any ideas, methods, instructions or products referred to in the content. |
© 2023 by the authors. Licensee MDPI, Basel, Switzerland. This article is an open access article distributed under the terms and conditions of the Creative Commons Attribution (CC BY) license (https://creativecommons.org/licenses/by/4.0/).
Share and Cite
Lin, Y.-J.; Lee, C.-C.; Huang, T.-W.; Hsu, W.-C.; Wu, L.-W.; Lin, C.-C.; Hsiu, H. Using Arterial Pulse and Laser Doppler Analyses to Discriminate between the Cardiovascular Effects of Different Running Levels. Sensors 2023, 23, 3855. https://doi.org/10.3390/s23083855
Lin Y-J, Lee C-C, Huang T-W, Hsu W-C, Wu L-W, Lin C-C, Hsiu H. Using Arterial Pulse and Laser Doppler Analyses to Discriminate between the Cardiovascular Effects of Different Running Levels. Sensors. 2023; 23(8):3855. https://doi.org/10.3390/s23083855
Chicago/Turabian StyleLin, Yi-Jia, Chia-Chien Lee, Tzu-Wei Huang, Wei-Chun Hsu, Li-Wei Wu, Chen-Chun Lin, and Hsin Hsiu. 2023. "Using Arterial Pulse and Laser Doppler Analyses to Discriminate between the Cardiovascular Effects of Different Running Levels" Sensors 23, no. 8: 3855. https://doi.org/10.3390/s23083855